Elimination of subtelomeric repeat sequences exerts little effect on telomere essential functions in Saccharomyces cerevisiae
- The State Key Laboratory of Molecular Biology, CAS Center for Excellence in Molecular Cell Science, Shanghai Institute of Biochemistry and Cell Biology, Chinese Academy of Sciences; University of Chinese Academy of Sciences, China
- Key Laboratory of Synthetic Biology, CAS Center for Excellence in Molecular Plant Sciences, Shanghai Institute of Plant Physiology and Ecology, Chinese Academy of Sciences; University of Chinese Academy of Sciences, China
- Key Laboratory of Systems Health Science of Zhejiang Province, Hangzhou Institute for Advanced Study, University of Chinese Academy of Sciences, China
Figures
Figure 1
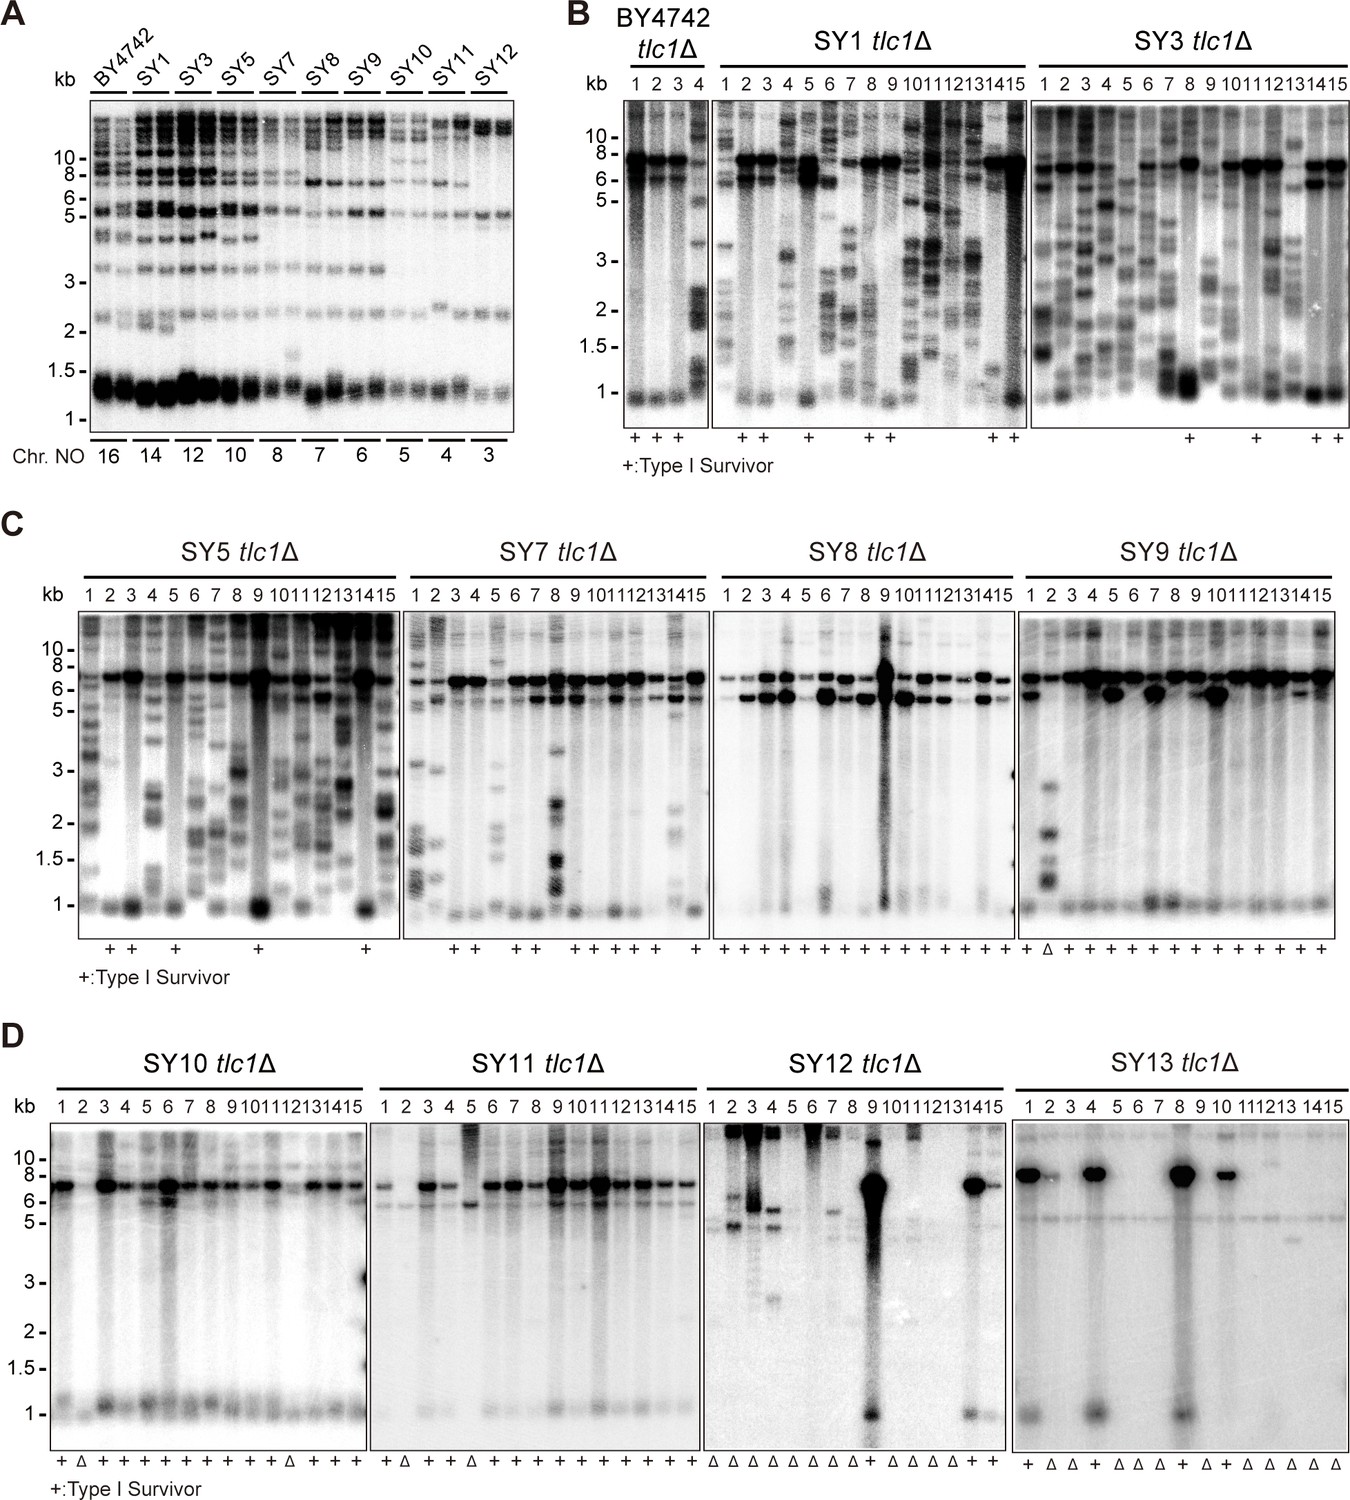
Telomere structures in SYn tlc1Δ survivors.
Telomere Southern blotting assay was performed to examine telomere structure. The genomic DNA extracted from BY4742 (wild type) and SYn strains (labeled on top) was digested with XhoI and subjected to Southern hybridization with a TG1-3 probe. (A) Telomerase-proficient strains (labeled on top), whose chromosome numbers are labeled at the bottom. Two independent clones of each strain were examined. (B–D) SYn tlc1Δ survivors generated on plates. In total, 4 (BY4742 tlc1Δ) and 15 (SYn tlc1Δ) individual survivor clones (labeled on top of each panel) of each strain were examined. ‘+’ at the bottom indicates Type I survivors. ‘Δ’ marks the survivors which are non-canonical Type I or Type II.
-
Figure 1—source data 1
Original file for the Southern blotting analysis in Figure 1A.
- https://cdn.elifesciences.org/articles/91223/elife-91223-fig1-data1-v1.zip
-
Figure 1—source data 2
File containing Figure 1A and original scans of the relevant Southern blotting analysis.
- https://cdn.elifesciences.org/articles/91223/elife-91223-fig1-data2-v1.zip
-
Figure 1—source data 3
Original file for the Southern blotting analysis in Figure 1B for BY4742 tlc1Δ and SY1 tlc1Δ.
- https://cdn.elifesciences.org/articles/91223/elife-91223-fig1-data3-v1.zip
-
Figure 1—source data 4
Original file for the Southern blotting analysis in Figure 1B for SY3 tlc1Δ.
- https://cdn.elifesciences.org/articles/91223/elife-91223-fig1-data4-v1.zip
-
Figure 1—source data 5
File containing Figure 1B and original scans of the relevant Southern blotting analysis.
- https://cdn.elifesciences.org/articles/91223/elife-91223-fig1-data5-v1.zip
-
Figure 1—source data 6
Original file for the Southern blotting analysis in Figure 1C for SY5 tlc1Δ.
- https://cdn.elifesciences.org/articles/91223/elife-91223-fig1-data6-v1.zip
-
Figure 1—source data 7
Original file for the Southern blotting analysis in Figure 1C for SY7 tlc1Δ and SY8 tlc1Δ.
- https://cdn.elifesciences.org/articles/91223/elife-91223-fig1-data7-v1.zip
-
Figure 1—source data 8
Original file for the Southern blotting analysis in Figure 1C for SY9 tlc1Δ.
- https://cdn.elifesciences.org/articles/91223/elife-91223-fig1-data8-v1.zip
-
Figure 1—source data 9
File containing Figure 1C and original scans of the relevant Southern blotting analysis.
- https://cdn.elifesciences.org/articles/91223/elife-91223-fig1-data9-v1.zip
-
Figure 1—source data 10
Original file for the Southern blotting analysis in Figure 1D for SY10 tlc1Δ.
- https://cdn.elifesciences.org/articles/91223/elife-91223-fig1-data10-v1.zip
-
Figure 1—source data 11
Original file for the Southern blotting analysis in Figure 1D for SY11 tlc1Δ.
- https://cdn.elifesciences.org/articles/91223/elife-91223-fig1-data11-v1.zip
-
Figure 1—source data 12
Original file for the Southern blotting analysis in Figure 1D for SY12 tlc1Δ.
- https://cdn.elifesciences.org/articles/91223/elife-91223-fig1-data12-v1.zip
-
Figure 1—source data 13
Original file for the Southern blotting analysis in Figure 1D for SY13 tlc1Δ.
- https://cdn.elifesciences.org/articles/91223/elife-91223-fig1-data13-v1.zip
-
Figure 1—source data 14
File containing Figure 1D and original scans of the relevant Southern blotting analysis.
- https://cdn.elifesciences.org/articles/91223/elife-91223-fig1-data14-v1.zip
Figure 2 with 8 supplements
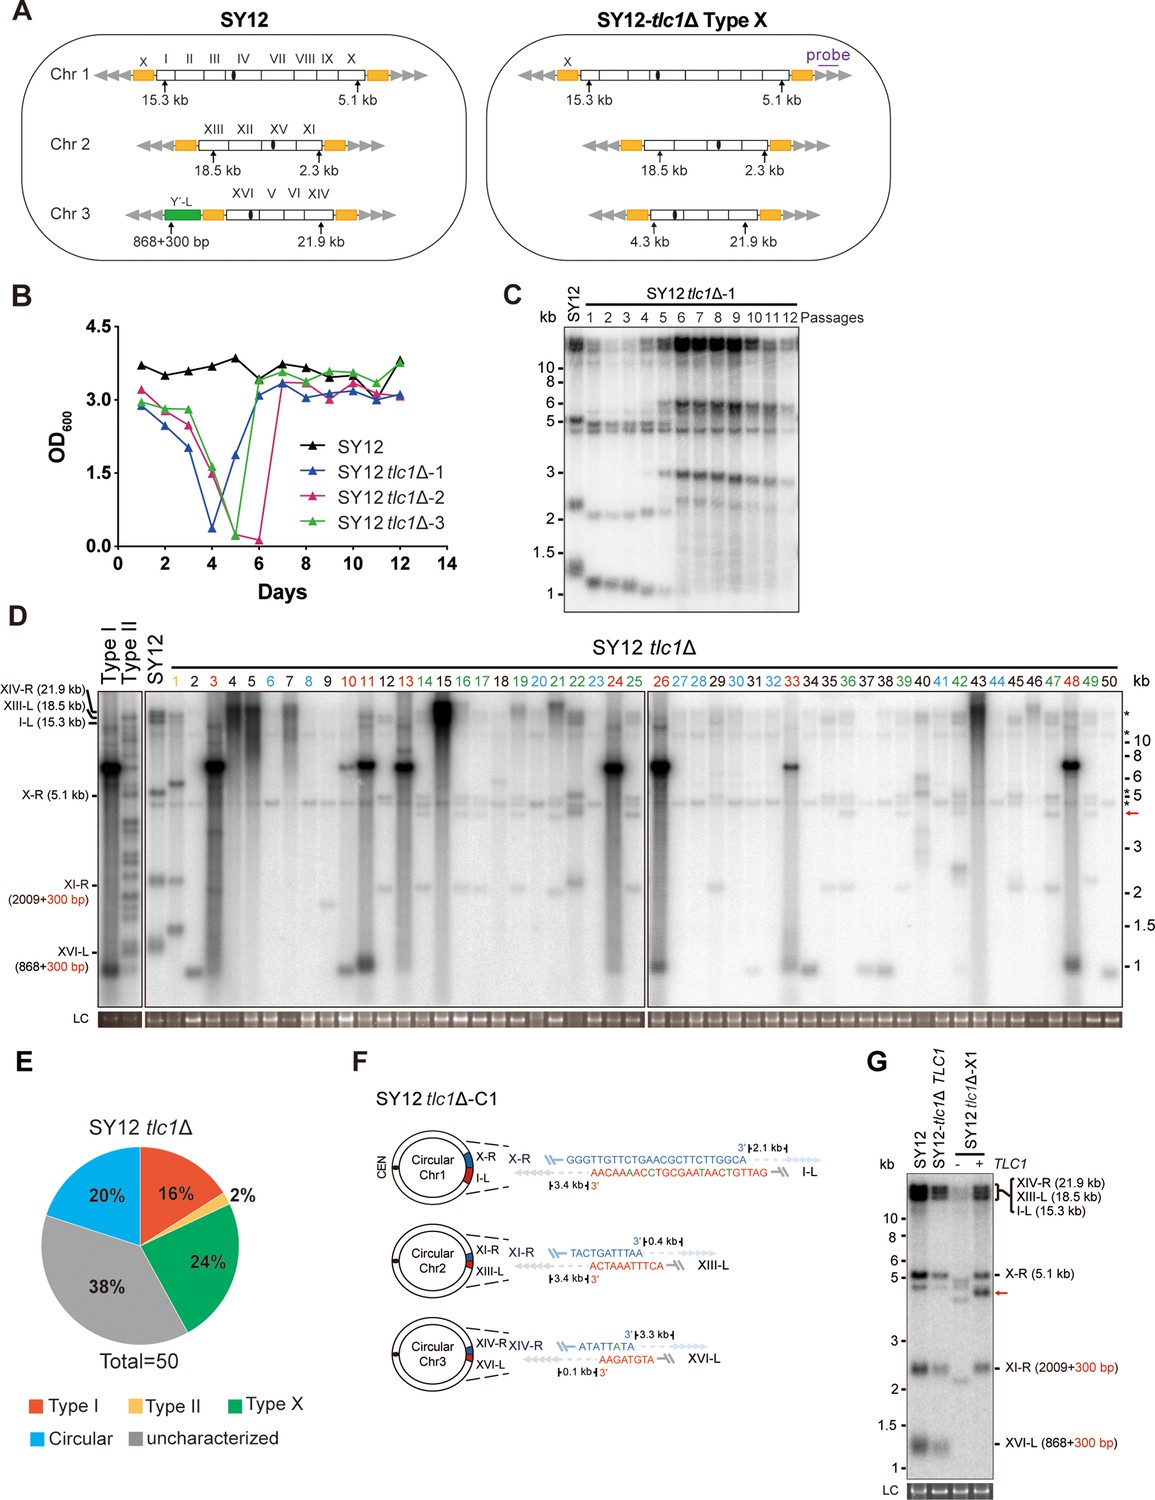
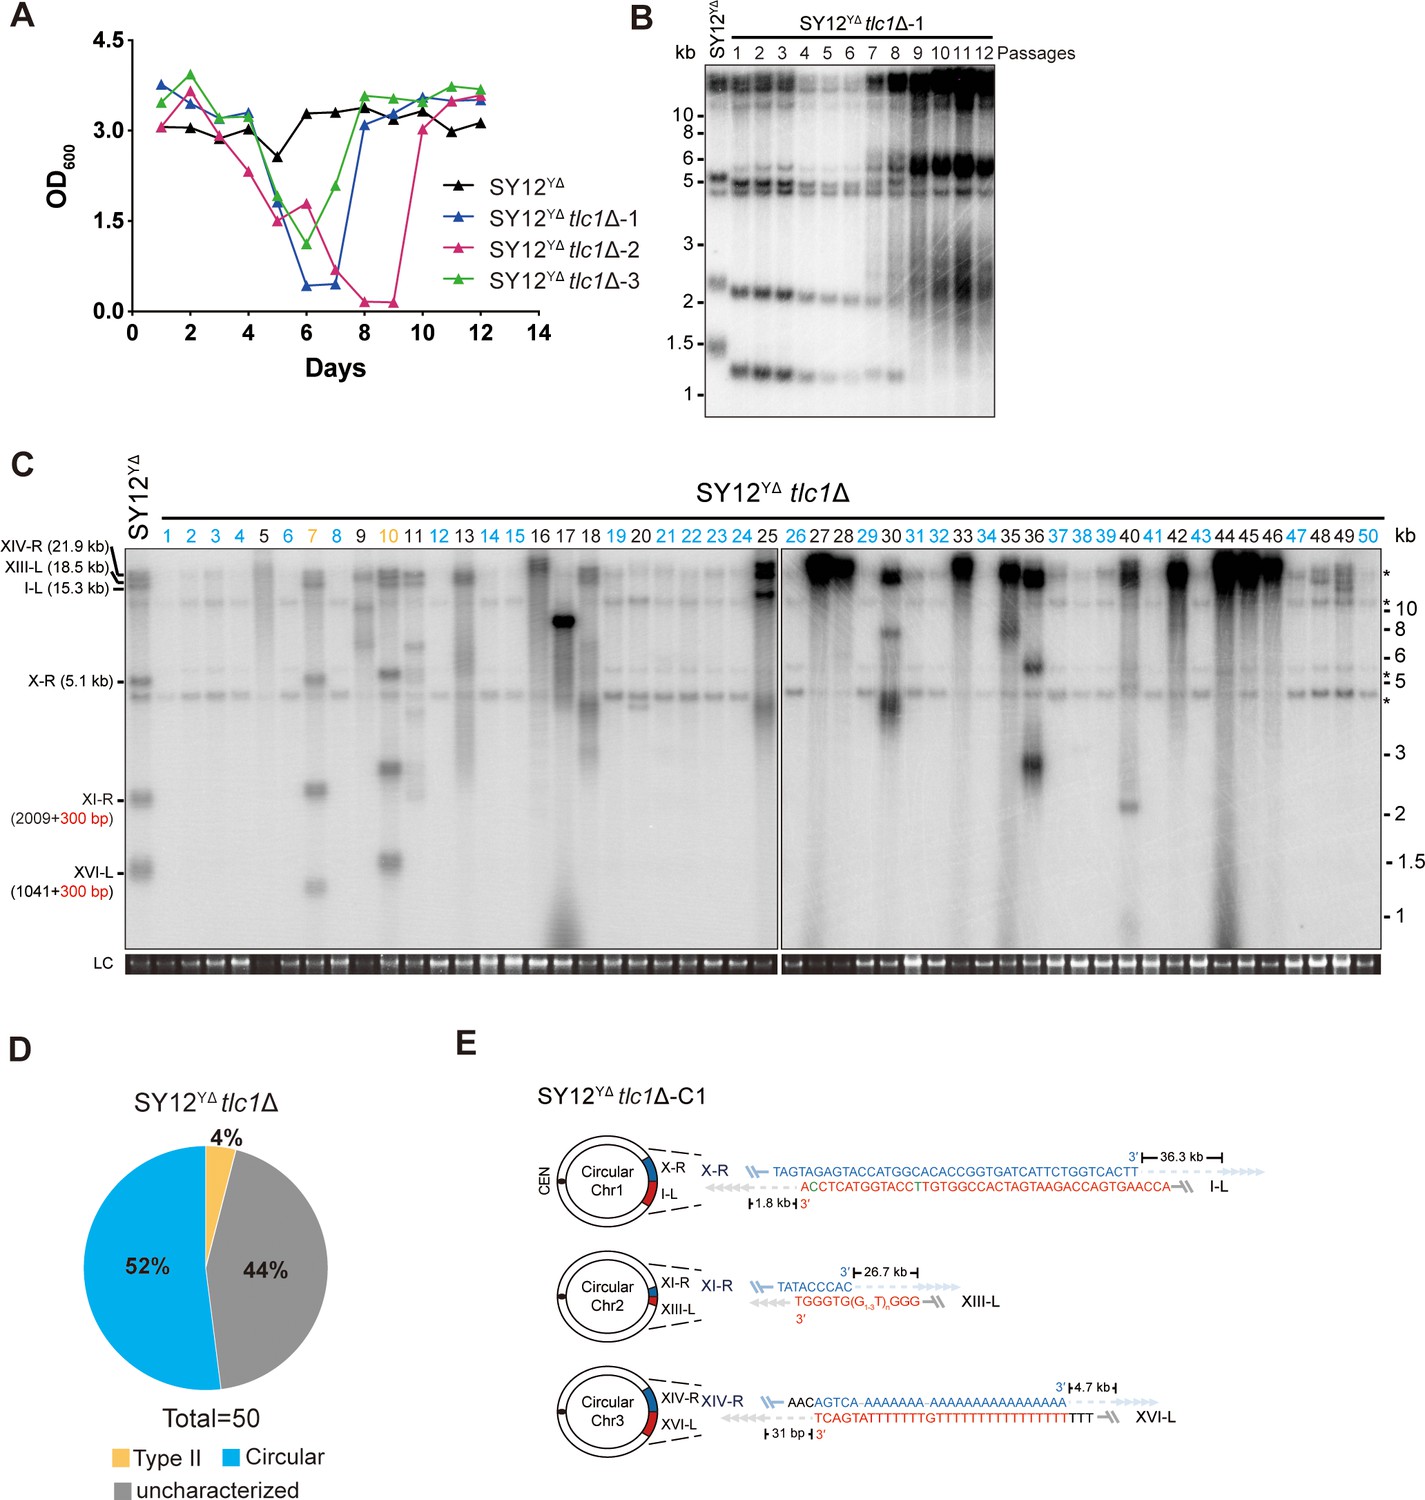
Survivor formation in SY12 tlc1Δ strain.
(A) Schematic representation of chromosome (and telomere) structures (not drawn to scale) in the SY12 strain (left panel) and the Type X survivor (right panel). The Roman numerals, native chromosomes; the Arabic numerals on the left, chromosome numbers of SY12; yellow box, X-element; green box, Y’-element; tandem gray triangles, telomeres; black circles, centromere; vertical arrows and numbers, positions and lengths of the terminal Xhol digestion fragments detected by the telomeric TG1-3 probe. Chromosome numbers are omitted in the Type X survivor (right panel). (B) Cell viability assay in liquid medium. The growth of SY12 (labeled in black) and SY12 tlc1Δ (three clones labeled in blue, purple, and green, respectively) strains were monitored every 24 hr for 12 d. (C) Telomeric Southern blotting assay of SY12 tlc1Δ survivors. Genomic DNAs prepared from SY12 tlc1Δ survivors assayed in (B) were digested with XhoI and subjected to Southern blotting with a TG1-3 probe. (D) Telomere Southern blotting assay of SY12 tlc1Δ survivors obtained on solid medium. Genomic DNA from 50 independent SY12 tlc1Δ clones (labeled on top) was digested with XhoI and hybridized to a telomere-specific TG1–3 probe. Type II survivors: in orange; Type I survivors: in red; circular survivors: in blue; Type X survivors: in green; uncharacterized survivors: in black. Theoretical telomere restriction fragments of the SY12 strain are indicated on the left. The red arrows indicate the new band of about 4.3 kb emerged in Type X survivors. The asterisks indicate the non-specific bands. Genomic DNA stained with Gelred was used as a relative loading control (LC). (E) The ratio of survivor types in SY12 tlc1Δ strain. n = 50; Type I, in red; Type II, in orange; Type X, in green; uncharacterized survivor, in gray; circular survivor, in blue. (F) Schematic of three circular chromosomes and fusion sequences in the SY12 tlc1Δ-C1 survivor. The sequence in blue indicates the sequences of X-R, XI-R, or XIV-R, the sequence in red indicates the sequences of I-L, XIII-L, or XVI-L. Bases in green are mis-paired. The numbers above or below the schematic line (chromosome) indicate the distance to the corresponding telomeres. (G) Telomere Southern blotting analysis of an SY12 tlc1Δ Type X survivor at the 20th re-streak after TLC1 reintroduction. The red arrows indicate the new band of about 4.3 kb emerged in Type X survivors. LC: loading control.
-
Figure 2—source data 1
File containing output results of growth analysis of the SY12 tlc1Δ strain in Figure 2B.
- https://cdn.elifesciences.org/articles/91223/elife-91223-fig2-data1-v1.zip
-
Figure 2—source data 2
Original file for the Southern blotting analysis in Figure 2C.
- https://cdn.elifesciences.org/articles/91223/elife-91223-fig2-data2-v1.zip
-
Figure 2—source data 3
File containing Figure 2C and original scans of the relevant Southern blotting analysis.
- https://cdn.elifesciences.org/articles/91223/elife-91223-fig2-data3-v1.zip
-
Figure 2—source data 4
Original file for the Southern blotting analysis in Figure 2D.
- https://cdn.elifesciences.org/articles/91223/elife-91223-fig2-data4-v1.zip
-
Figure 2—source data 5
Original file for the Southern blotting analysis in Figure 2D.
- https://cdn.elifesciences.org/articles/91223/elife-91223-fig2-data5-v1.zip
-
Figure 2—source data 6
Original file for the loading control of Southern blotting analysis in Figure 2D.
- https://cdn.elifesciences.org/articles/91223/elife-91223-fig2-data6-v1.zip
-
Figure 2—source data 7
Original file for the loading control of Southern blotting analysis in Figure 2D.
- https://cdn.elifesciences.org/articles/91223/elife-91223-fig2-data7-v1.zip
-
Figure 2—source data 8
File containing Figure 2D and original scans of the relevant Southern blotting analysis.
- https://cdn.elifesciences.org/articles/91223/elife-91223-fig2-data8-v1.zip
-
Figure 2—source data 9
File containing the original scans of the loading control of the Southern blotting analysis in Figure 2D.
- https://cdn.elifesciences.org/articles/91223/elife-91223-fig2-data9-v1.zip
-
Figure 2—source data 10
Original file for the Southern blotting analysis in Figure 2G.
- https://cdn.elifesciences.org/articles/91223/elife-91223-fig2-data10-v1.zip
-
Figure 2—source data 11
Original file for the loading control of Southern blotting analysis in Figure 2G.
- https://cdn.elifesciences.org/articles/91223/elife-91223-fig2-data11-v1.zip
-
Figure 2—source data 12
File containing Figure 2G and original scans of the relevant Southern blotting analysis.
- https://cdn.elifesciences.org/articles/91223/elife-91223-fig2-data12-v1.zip
-
Figure 2—source data 13
File containing the original scans of the loading control of the Southern blotting analysis in Figure 2G.
- https://cdn.elifesciences.org/articles/91223/elife-91223-fig2-data13-v1.zip
Figure 2—figure supplement 1
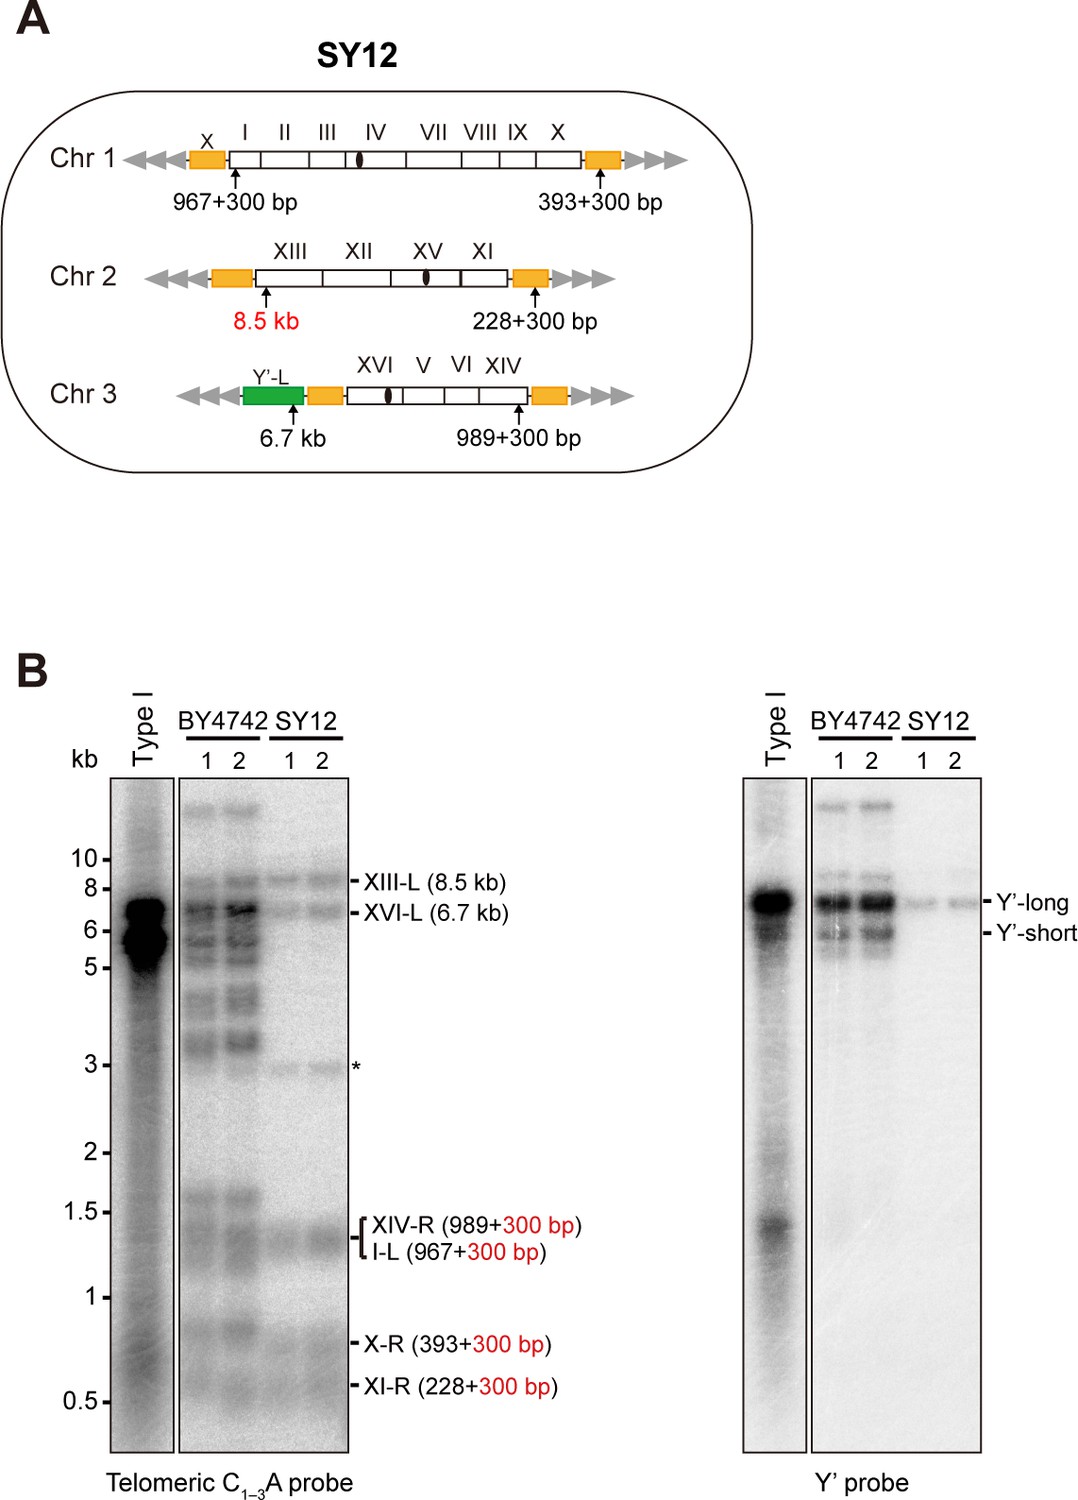
Characterization of SY12 strain.
(A) Schematic representation of chromosome (and telomere) structures (not drawn to scale) in the SY12 strain. The Roman numerals, native chromosomes; the Arabic numerals on the left, chromosome numbers of SY12; yellow box, X-element; green box, Y’-element; tandem gray triangles, telomeres; black circles, centromere; vertical arrows and numbers, positions and lengths of the terminal Ndel digestion fragments detected by the telomeric TG1-3 probe. (B) Southern blotting analysis of telomere length in BY4742 and SY12 (labeled on top) cells. Genomic DNA prepared from two independent clones of BY4742 and SY12 strains was digested with NdeI, and then subjected to Southern blotting with a TG1-3 probe (left panel). The numbers in brackets indicate the telomere length of the corresponding chromosomes. The blot was then stripped and reprobed with a Y’ probe (right panel). The asterisk indicates the non-specific band.
-
Figure 2—figure supplement 1—source data 1
Original file for the Southern blotting analysis in Figure 2—figure supplement 1B.
- https://cdn.elifesciences.org/articles/91223/elife-91223-fig2-figsupp1-data1-v1.zip
-
Figure 2—figure supplement 1—source data 2
Original file for the Southern blotting analysis in Figure 2—figure supplement 1B.
- https://cdn.elifesciences.org/articles/91223/elife-91223-fig2-figsupp1-data2-v1.zip
-
Figure 2—figure supplement 1—source data 3
File containing Figure 2—figure supplement 1B and original scans of the relevant Southern blotting analysis.
- https://cdn.elifesciences.org/articles/91223/elife-91223-fig2-figsupp1-data3-v1.zip
Figure 2—figure supplement 2

Telomere Southern blot with a Y’-element probe examining SY12 tlc1Δ survivors.
The blot in Figure 2D was then stripped and reprobed with a Y’ probe.
-
Figure 2—figure supplement 2—source data 1
Original file for the Southern blotting analysis in Figure 2—figure supplement 2.
- https://cdn.elifesciences.org/articles/91223/elife-91223-fig2-figsupp2-data1-v1.zip
-
Figure 2—figure supplement 2—source data 2
Original file for the Southern blotting analysis in Figure 2—figure supplement 2.
- https://cdn.elifesciences.org/articles/91223/elife-91223-fig2-figsupp2-data2-v1.zip
-
Figure 2—figure supplement 2—source data 3
File containing Figure 2—figure supplement 2 and original scans of the relevant Southern blotting analysis.
- https://cdn.elifesciences.org/articles/91223/elife-91223-fig2-figsupp2-data3-v1.zip
Figure 2—figure supplement 3
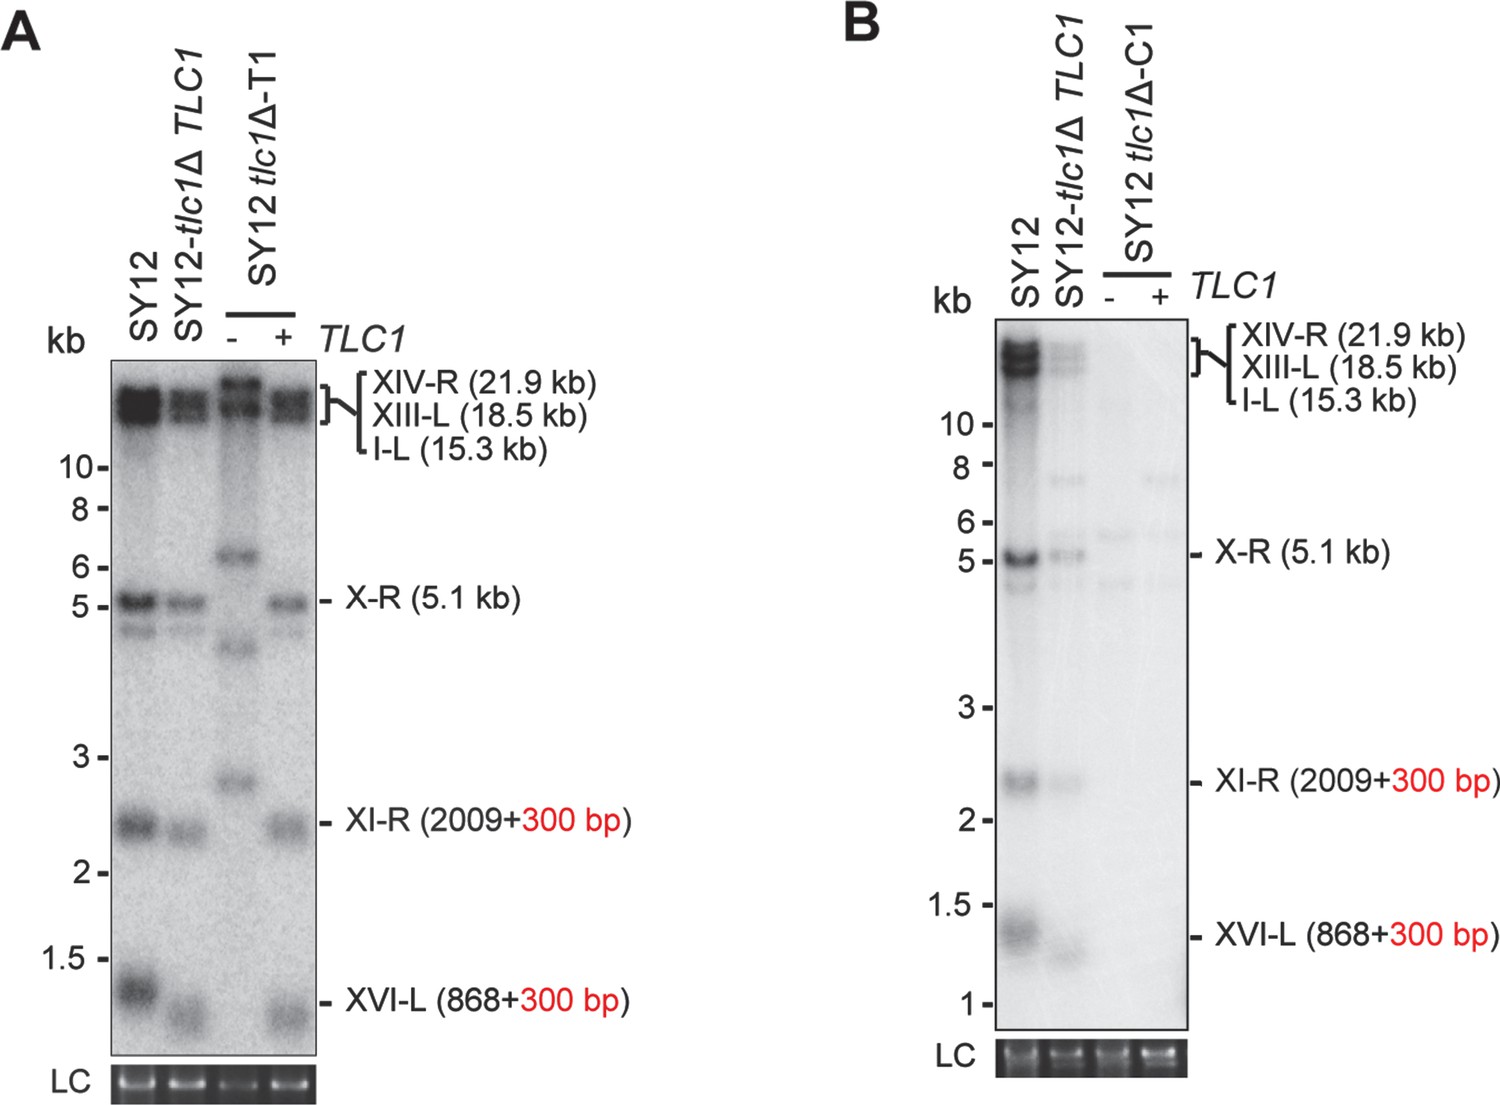
Southern blotting results of reintroduce TLC1 into SY12 tlc1Δ survivors.
(A) Southern blotting result of SY12 tlc1Δ Type II survivor at the 20th re-streaks after TLC1 reintroduction. LC: loading control. (B) Southern blotting result of SY12 tlc1Δ circular survivor at the 20th re-streaks after TLC1 reintroduction. LC: loading control.
-
Figure 2—figure supplement 3—source data 1
Original file for the Southern blotting analysis in Figure 2—figure supplement 3A.
- https://cdn.elifesciences.org/articles/91223/elife-91223-fig2-figsupp3-data1-v1.zip
-
Figure 2—figure supplement 3—source data 2
Original file for the Southern blotting analysis in Figure 2—figure supplement 3B.
- https://cdn.elifesciences.org/articles/91223/elife-91223-fig2-figsupp3-data2-v1.zip
-
Figure 2—figure supplement 3—source data 3
Original file for the loading control of the Southern blotting analysis in Figure 2—figure supplement 3A.
- https://cdn.elifesciences.org/articles/91223/elife-91223-fig2-figsupp3-data3-v1.zip
-
Figure 2—figure supplement 3—source data 4
Original file for the loading control of the Southern blotting analysis in Figure 2—figure supplement 3B.
- https://cdn.elifesciences.org/articles/91223/elife-91223-fig2-figsupp3-data4-v1.zip
-
Figure 2—figure supplement 3—source data 5
File containing Figure 2—figure supplement 3A and B and original scans of the relevant Southern blotting analysis.
- https://cdn.elifesciences.org/articles/91223/elife-91223-fig2-figsupp3-data5-v1.zip
-
Figure 2—figure supplement 3—source data 6
File containing the loading control of the relevant Southern blotting analysis in Figure 2—figure supplement 3A and B.
- https://cdn.elifesciences.org/articles/91223/elife-91223-fig2-figsupp3-data6-v1.zip
Figure 2—figure supplement 4
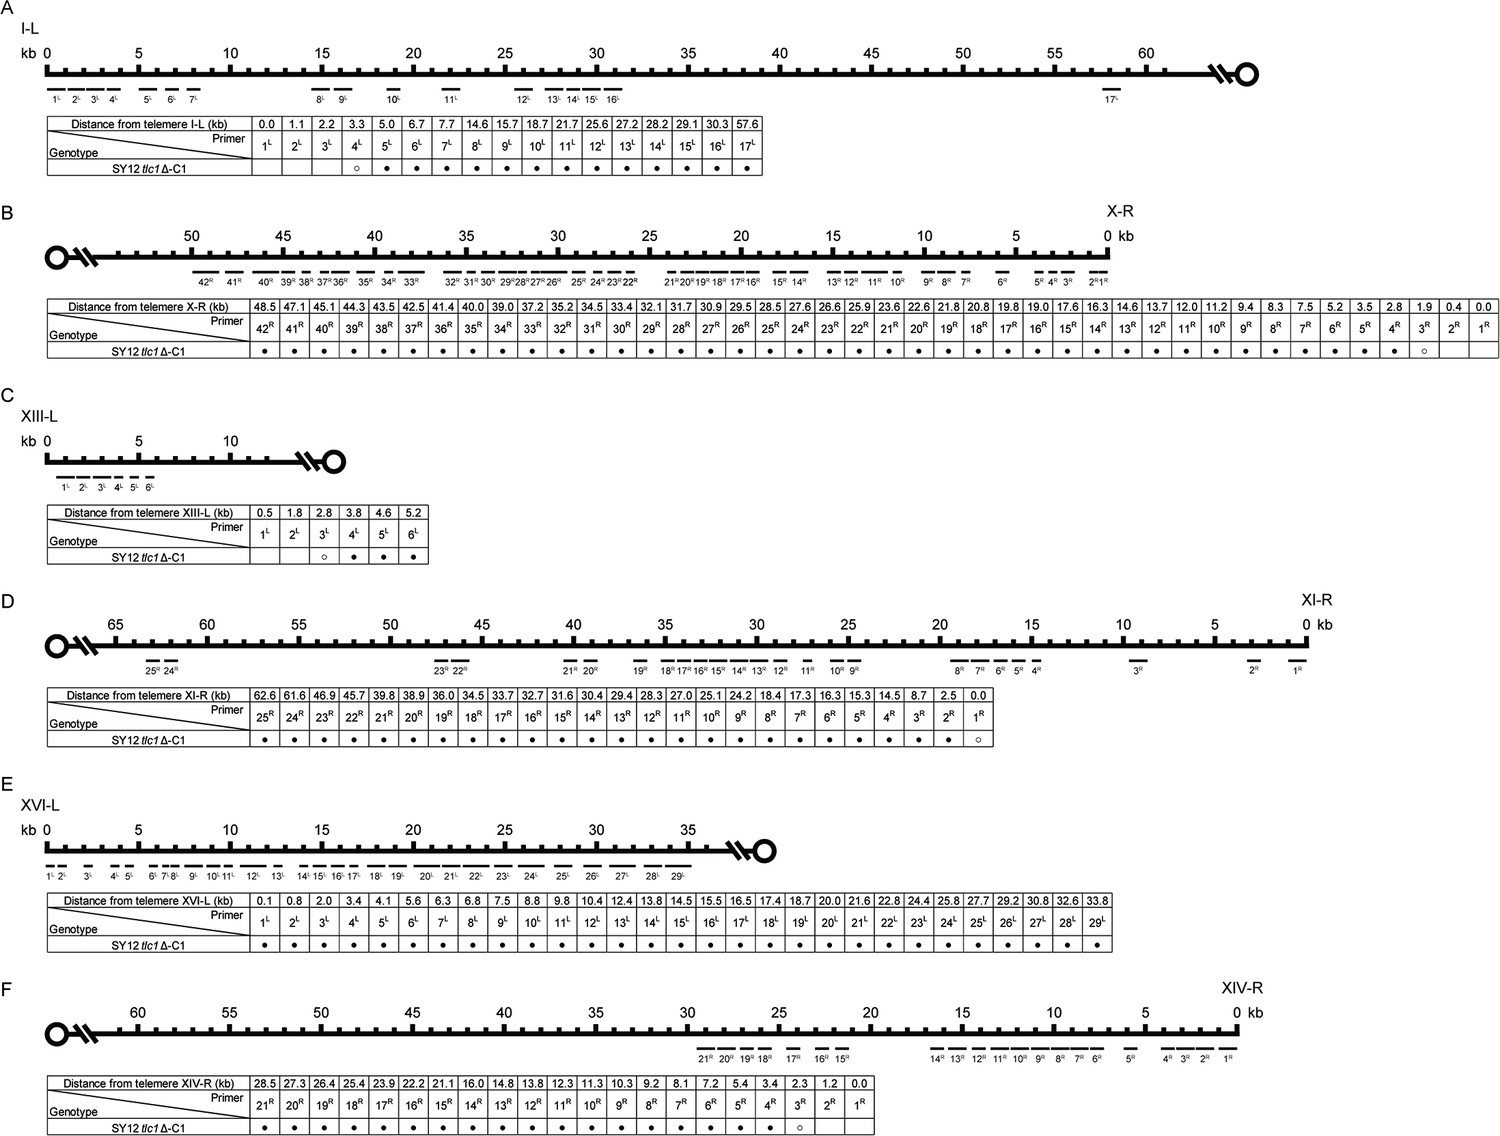
Borders of erosion of the SY12 tlc1Δ-C1 survivor are defined by PCR mapping.
(A) Upper panel, a schematic diagram of the subtelomeric region of 0–60 kb proximal to I-L telomere is shown. Primer pairs (no. 1L to 17L) are aligned and indicated at their corresponding subtelomeric loci. Lower panel, the genotype is listed on the left, and primer pairs are listed on top; solid circles mean positive PCR products and open circles mean no PCR products with corresponding primer pairs. (B) Upper panel, a schematic diagram of the subtelomeric region of 0–50 kb proximal to X-R telomeric TG1-3 sequence is shown. Primer pairs (no. 1R to 42R) are aligned and indicated at their corresponding subtelomeric loci. Lower panel, the genotype is listed on the left, and primer pairs are listed on top. (C) Upper panel, a schematic diagram of the subtelomeric region of 0–10 kb proximal to XIII-L telomeric TG1-3 sequence is shown. Primer pairs (no. 1L to 6L) are aligned and indicated at their corresponding subtelomeric loci. Lower panel, the genotype is listed on the left, and primer pairs are listed on top. (D) Upper panel, a schematic diagram of the subtelomeric region of 0–65 kb proximal to XI-R telomeric TG1-3 sequence is shown. Primer pairs (no. 1R to 25R) are aligned and indicated at their corresponding subtelomeric loci. Lower panel, the genotype is listed on the left, and primer pairs are listed on top. (E) Upper panel, a schematic diagram of the subtelomeric region of 0–35 kb proximal to XVI-L telomeric TG1-3 sequence is shown. Primer pairs (no. 1L to 29L) are aligned and indicated at their corresponding subtelomeric loci. Lower panel, the genotype is listed on the left, and primer pairs are listed on top. (F) Upper panel, a schematic diagram of the subtelomeric region of 0–60 kb proximal to XIV-R telomeric TG1-3 sequence is shown. Primer pairs (no. 1R to 21R) are aligned and indicated at their corresponding subtelomeric loci. Lower panel, the genotype is listed on the left, and primer pairs are listed on top.
Figure 2—figure supplement 5
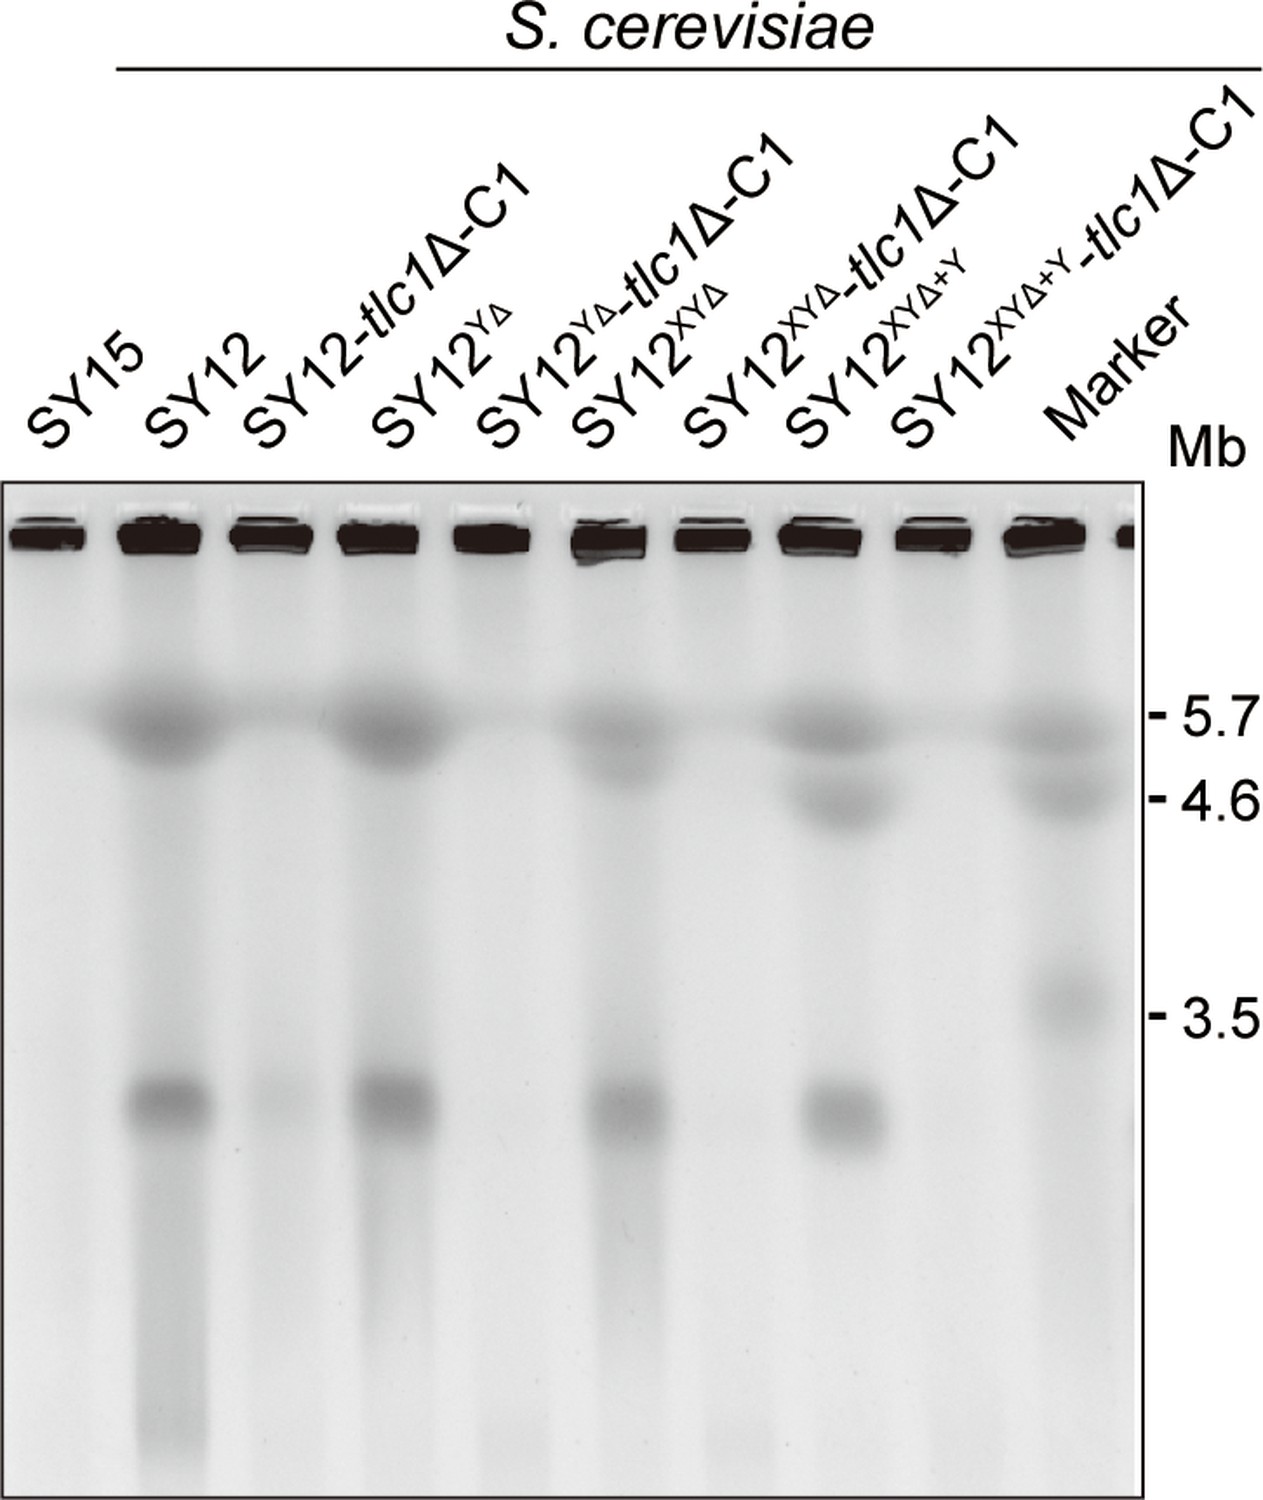
Pulsed-field gel electrophoresis (PFGE) result of circular survivors.
Chromosomal DNA analysis of ‘circular survivors’ SY12 tlc1Δ-C1, SY12YΔtlc1Δ-C1, SY12XYΔtlc1Δ-C1, SY12XYΔ+Ytlc1Δ-C1 by PFGE. The S. cerevisiae strain SY15 (with a single circular chromosome) was used as control. As marker, the size of three chromosomes in wild-type S. pombe strain is indicated on right.
-
Figure 2—figure supplement 5—source data 1
Original file for the PFGE analysis in Figure 2—figure supplement 5.
- https://cdn.elifesciences.org/articles/91223/elife-91223-fig2-figsupp5-data1-v1.zip
-
Figure 2—figure supplement 5—source data 2
File containing Figure 2—figure supplement 5 and original scans of the relevant PFGE analysis.
- https://cdn.elifesciences.org/articles/91223/elife-91223-fig2-figsupp5-data2-v1.zip
Figure 2—figure supplement 6
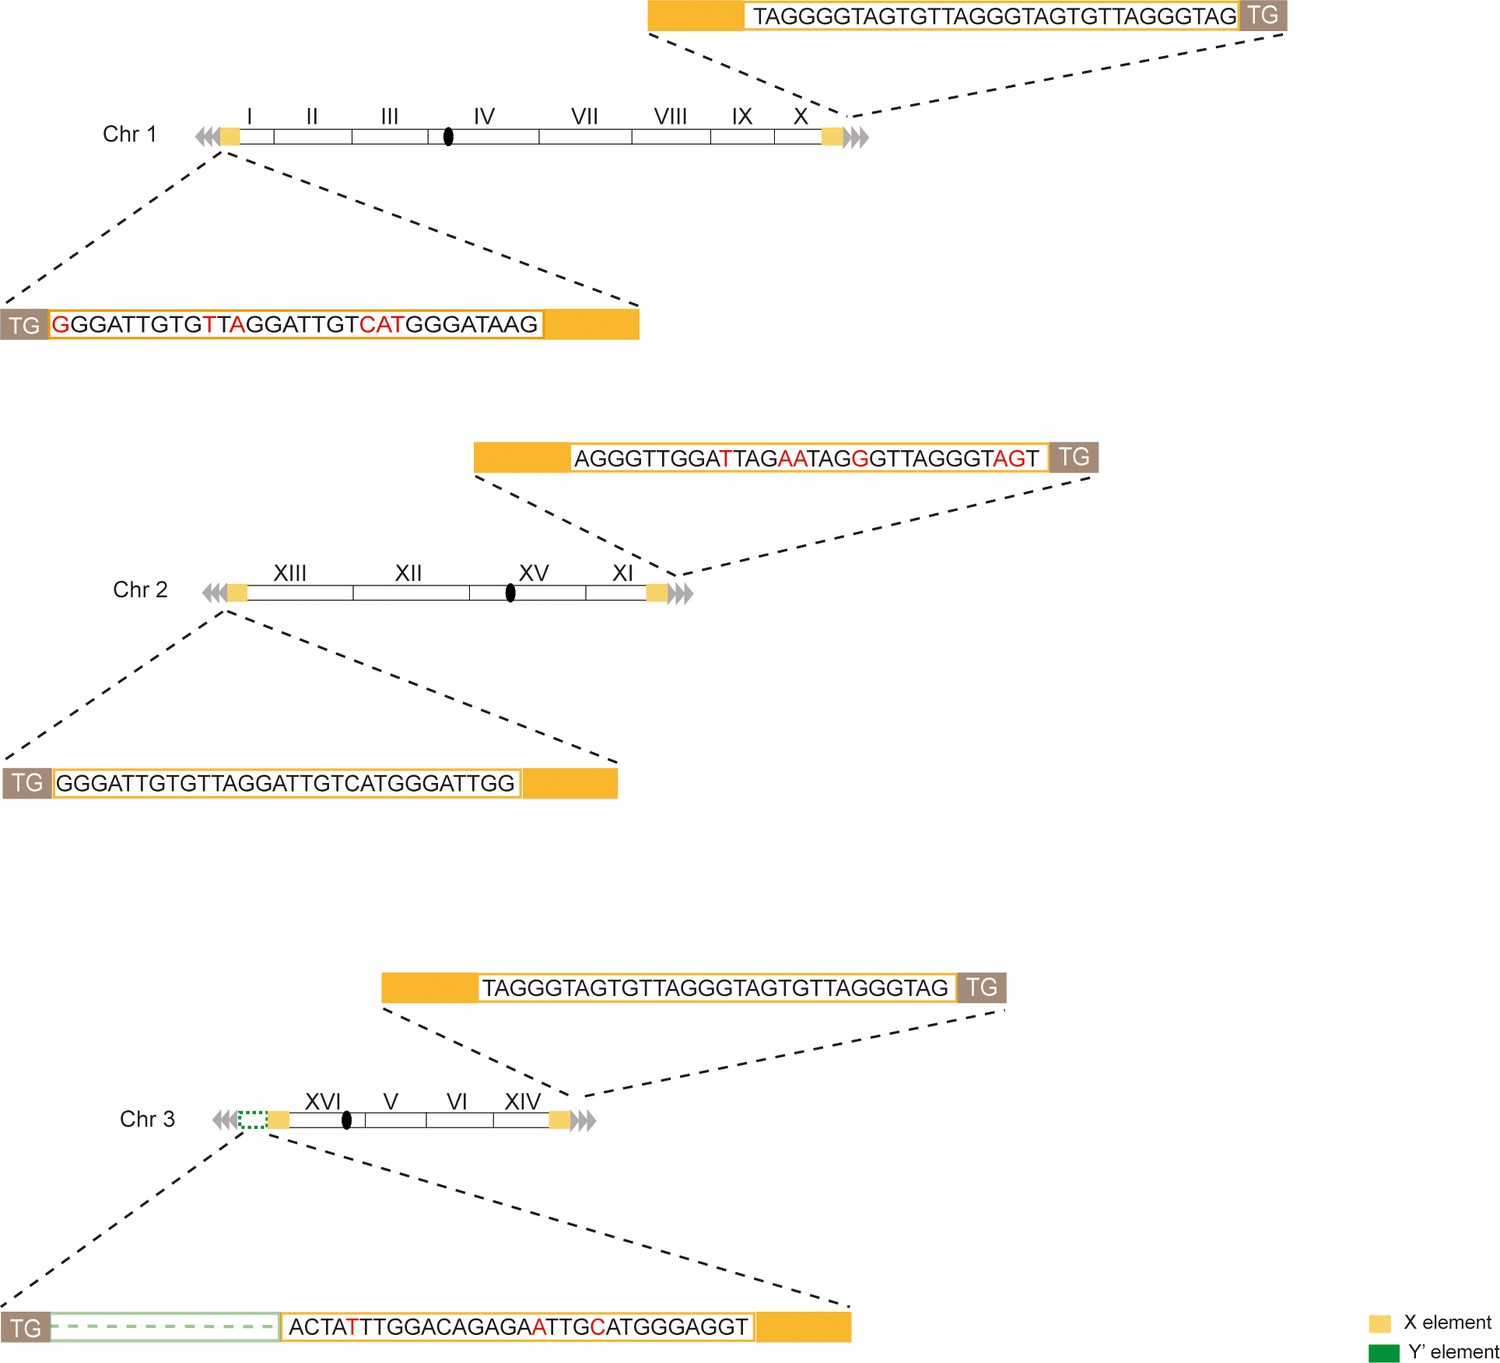
Telomere structure determination of type X survivor.
Schematic representation of chromosome (and telomere) structures (not drawn to scale) in the Type X survivor. The Roman numerals, native chromosomes; the Arabic numerals on the left, chromosome numbers of SY12; yellow box, X-element; green box, Y’-element; tandem gray triangles, telomeres; black circles, centromere. The sequence in yellow box belongs to X-element. Bases in rad are mis-paired. The dotted line in green represents the sequence of Y’-element is lost.
Figure 2—figure supplement 7

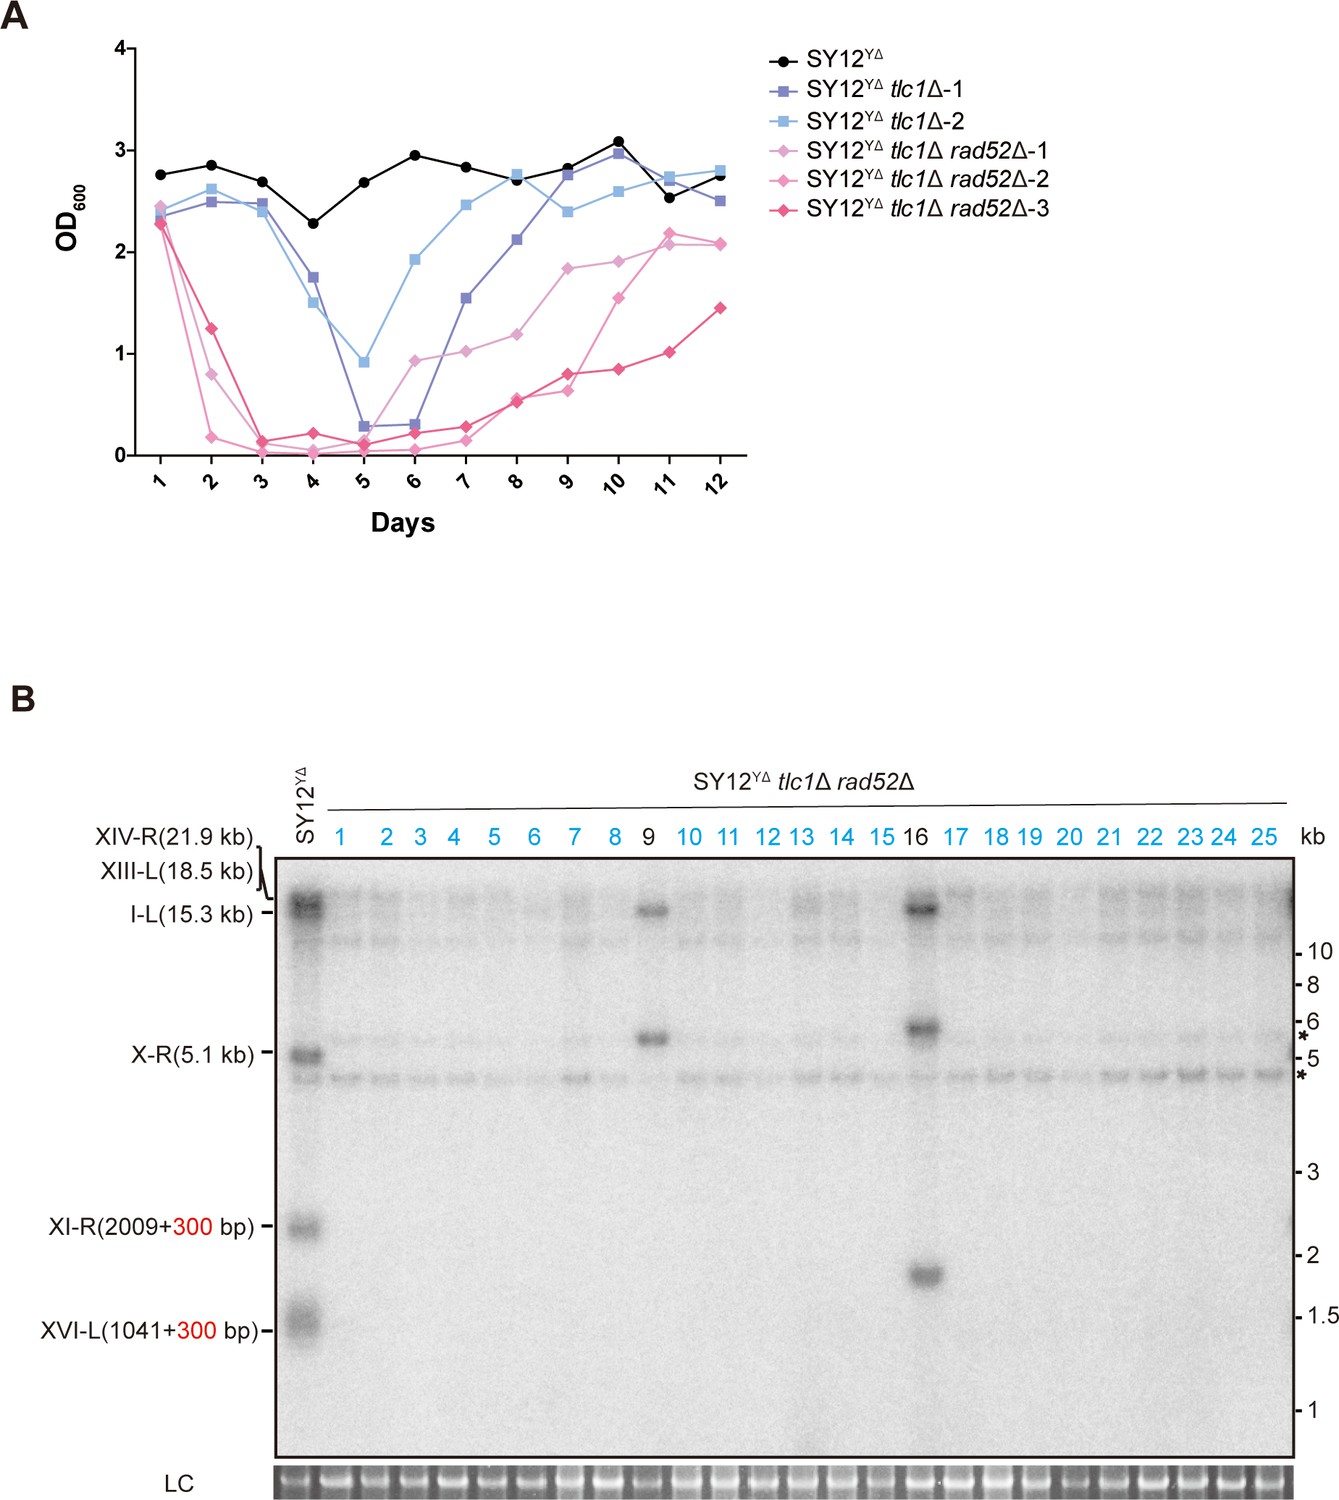
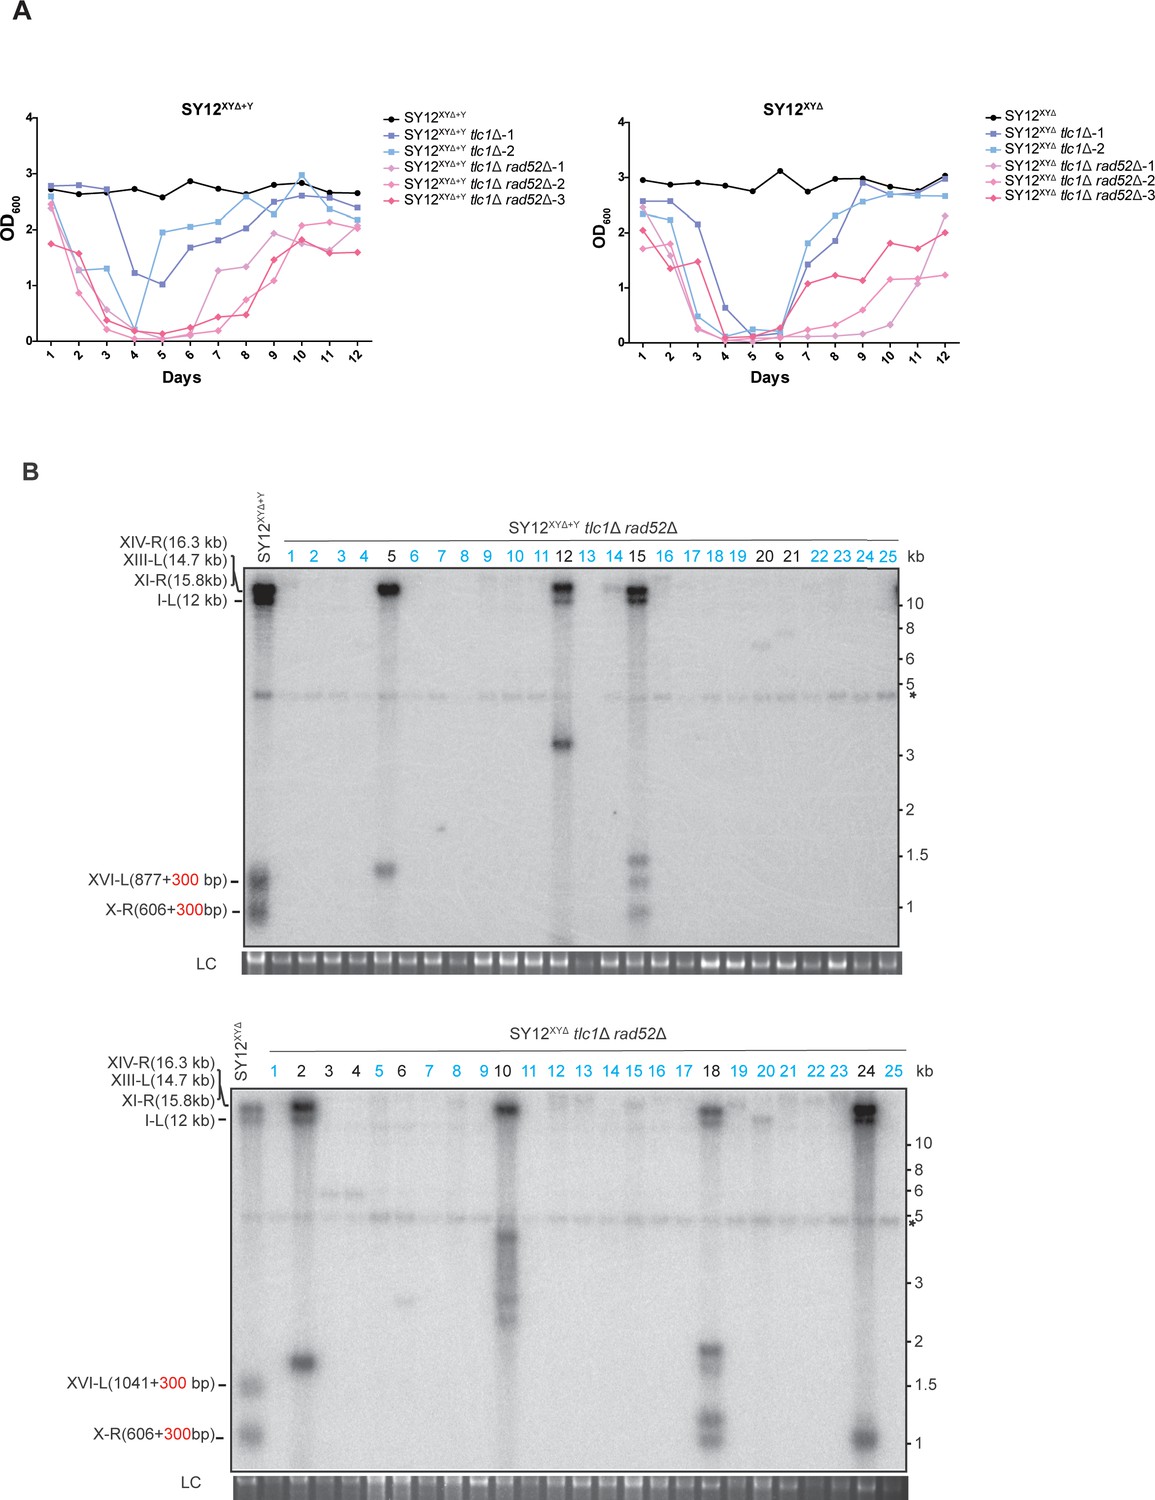
Survivor formation in SY12 tlc1Δ rad52Δ strain.
(A) Cell viability assay in liquid culture. The growth of SY12 (labeled in black), SY12 tlc1Δ (two clones labeled in purple and blue, respectively), and SY12 tlc1Δ rad52Δ (three clones labeled in violet, pink, and carmine, respectively) were monitored every 24 hr for 12 d. (B) Telomere Southern blotting assay of SY12 tlc1Δ rad52Δ survivors obtained on solid medium. Genomic DNA from 25 independent clones (labeled on top) was digested with XhoI and hybridized to a telomere-specific TG1–3 probe. Circular survivors: in blue; uncharacterized survivors: in black. Theoretical telomere restriction fragments of the SY12 strain are indicated on the left. The asterisks indicate the non-specific bands. Genomic DNA stained with Gelred was used as a relative loading control (LC).
-
Figure 2—figure supplement 7—source data 1
File containing output results of growth analysis of the SY12 tlc1Δ rad52Δ strain in Figure 2—figure supplement 7A.
- https://cdn.elifesciences.org/articles/91223/elife-91223-fig2-figsupp7-data1-v1.zip
-
Figure 2—figure supplement 7—source data 2
Original file for the Southern blotting analysis of the SY12 tlc1Δ rad52Δ strain in Figure 2—figure supplement 7B.
- https://cdn.elifesciences.org/articles/91223/elife-91223-fig2-figsupp7-data2-v1.zip
-
Figure 2—figure supplement 7—source data 3
Original file for the loading control of the Southern blotting analysis of the SY12 tlc1Δ rad52Δ strain in Figure 2—figure supplement 7B.
- https://cdn.elifesciences.org/articles/91223/elife-91223-fig2-figsupp7-data3-v1.zip
-
Figure 2—figure supplement 7—source data 4
File containing Figure 2—figure supplement 7B and original scans of the relevant Southern blotting analysis.
- https://cdn.elifesciences.org/articles/91223/elife-91223-fig2-figsupp7-data4-v1.zip
-
Figure 2—figure supplement 7—source data 5
File containing the loading control of the relevant Southern blotting analysis in Figure 2—figure supplement 7B.
- https://cdn.elifesciences.org/articles/91223/elife-91223-fig2-figsupp7-data5-v1.zip
Figure 2—figure supplement 8

Southern blotting result of SY12 tlc1Δ rad51Δ and SY12 tlc1Δ rad50Δ survivors.
(A) Genomic DNAs of 25 independent SY12 tlc1Δ rad51Δ clones were digested with XhoI and subjected to Southern blotting with a TG1-3 probe. Circular survivors: in blue; Type X survivors: in green; uncharacterized survivors: in black. Theoretical telomere restriction fragments of the SY12 strain are indicated on the left. The red arrows indicate the new band of about 4.3 kb emerged in Type X survivors. The asterisks indicate the non-specific bands. Genomic DNA stained with Gelred was used as a relative loading control (LC). (B) Genomic DNAs of 25 independent SY12 tlc1Δ rad50Δ clones were digested with XhoI and subjected to Southern blotting with a TG1-3 probe. Type I survivors: in rad; circular survivors: in blue; uncharacterized survivors: in black. Theoretical telomere restriction fragments of the SY12 strain are indicated on the left.
-
Figure 2—figure supplement 8—source data 1
Original file for the Southern blotting analysis of the SY12 tlc1Δ rad51Δ strain in Figure 2—figure supplement 8A.
- https://cdn.elifesciences.org/articles/91223/elife-91223-fig2-figsupp8-data1-v1.zip
-
Figure 2—figure supplement 8—source data 2
Original file for the loading control of the Southern blotting analysis of the SY12 tlc1Δ rad51Δ strain in Figure 2—figure supplement 8A.
- https://cdn.elifesciences.org/articles/91223/elife-91223-fig2-figsupp8-data2-v1.zip
-
Figure 2—figure supplement 8—source data 3
File containing the loading control of the relevant Southern blotting analysis of the SY12 tlc1Δ rad51Δ strain in Figure 2—figure supplement 8A.
- https://cdn.elifesciences.org/articles/91223/elife-91223-fig2-figsupp8-data3-v1.zip
-
Figure 2—figure supplement 8—source data 4
Original file for the Southern blotting analysis of the SY12 tlc1Δ rad50Δ strain in Figure 2—figure supplement 8B.
- https://cdn.elifesciences.org/articles/91223/elife-91223-fig2-figsupp8-data4-v1.zip
-
Figure 2—figure supplement 8—source data 5
File containing Figure 2—figure supplement 8A and B and original scans of the relevant Southern blotting analysis.
- https://cdn.elifesciences.org/articles/91223/elife-91223-fig2-figsupp8-data5-v1.zip
Figure 3 with 1 supplement
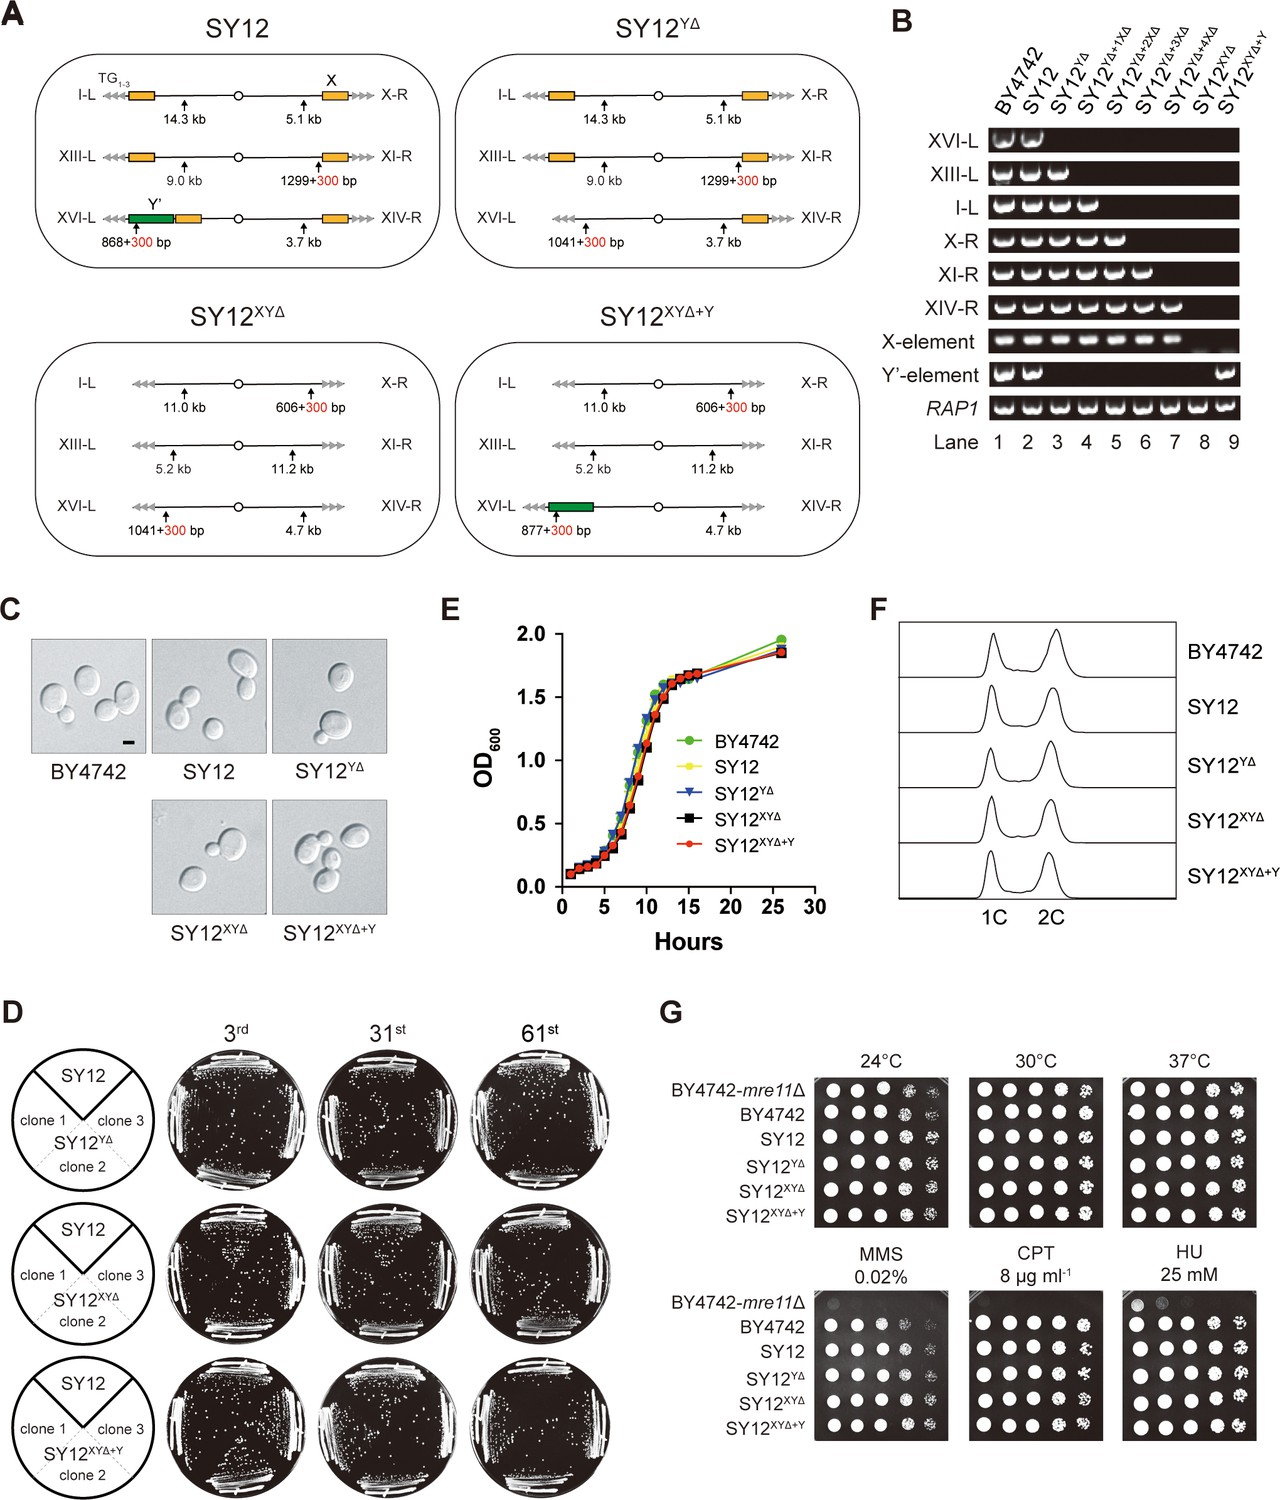
Characterization of SY12YΔ, SY12XYΔ, and SY12XYΔ+Υ strains.
(A) Schematic of chromosome structures in the SY12, SY12YΔ, SY12XYΔ, and SY12XYΔ+Υ strains. Yellow box, X-element; green box, Y’-element; tandem gray triangles, telomeres. Vertical arrows and numbers indicate the positions and sizes of the sites and length of Xhol and PaeI-digested terminal fragments. (B) PCR analyses of the engineered sites of the individual telomeres (labeled on the left) in BY4742, SY12, SY12YΔ, SY12YΔ+1XΔ, SY12YΔ+2XΔ, SY12YΔ+3XΔ, SY12YΔ+4XΔ, SY12XYΔ, and SY12XYΔ+Υ strains (labeled on top). Primer sequences for the PCR analyses are listed in Supplementary file 1. RAP1 was an internal control. (C) Morphology of BY4742, SY12, SY12YΔ, SY12XYΔ, and SY12XYΔ+Υ cells in the exponential growth phase (30°C in YPD). Shown are DIC images. Scale bar, 2 μm. (D) Growth analysis of the SY12, SY12YΔ, SY12XYΔ, and SY12XYΔ+Υ strains. Several clones of the SY12, SY12YΔ, SY12XYΔ, and SY12XYΔ+Υ strains were re-streaked on YPD plates 61 times at intervals of 2 d. Shown were the 3rd, 31st, and 61st re-streaks. (E) Growth analysis of BY4742, SY12, SY12YΔ, SY12XYΔ, and SY12XYΔ+Υ cells in liquid culture. Error bars represent standard deviation (s.d.), n = 3. (F) Fluorescence-activated cell sorting (FACS) analysis of DNA content of BY4742, SY12, SY12YΔ, SY12XYΔ, and SY12XYΔ+Υ cells. (G) Dotting assays on YPD plates at low (24°C) and high (37°C) temperatures, or on YPD plates containing methyl methane sulfonate (MMS), camptothecin (CPT), or hydroxyurea (HU) at the indicated concentrations. The BY4742 mre11Δ haploid strain serves as a negative control because Mre11 is involved in the repair of double-stranded breaks (Lewis et al., 2004).
-
Figure 3—source data 1
PCR identify of SY12 subtelomeric deletion strains in Figure 3B.
- https://cdn.elifesciences.org/articles/91223/elife-91223-fig3-data1-v1.zip
-
Figure 3—source data 2
File containing Figure 3B and original scans of PCR identify of SY12 subtelomeric deletion strains.
- https://cdn.elifesciences.org/articles/91223/elife-91223-fig3-data2-v1.zip
-
Figure 3—source data 3
Original file for the morphology analysis in Figure 3C for BY4742 strain.
- https://cdn.elifesciences.org/articles/91223/elife-91223-fig3-data3-v1.zip
-
Figure 3—source data 4
Original file for the morphology analysis in Figure 3C for SY12 strain.
- https://cdn.elifesciences.org/articles/91223/elife-91223-fig3-data4-v1.zip
-
Figure 3—source data 5
Original file for the morphology analysis in Figure 3C for SY12YΔ strain.
- https://cdn.elifesciences.org/articles/91223/elife-91223-fig3-data5-v1.zip
-
Figure 3—source data 6
Original file for the morphology analysis in Figure 3C for SY12XYΔ strain.
- https://cdn.elifesciences.org/articles/91223/elife-91223-fig3-data6-v1.zip
-
Figure 3—source data 7
Original file for the morphology analysis in Figure 3C for SY12XYΔ+Y strain.
- https://cdn.elifesciences.org/articles/91223/elife-91223-fig3-data7-v1.zip
-
Figure 3—source data 8
File containing Figure 3C and original photos of morphology analysis of SY12 subtelomeric deletion strains.
- https://cdn.elifesciences.org/articles/91223/elife-91223-fig3-data8-v1.zip
-
Figure 3—source data 9
Original file for the growth analysis in Figure 3D for SY12YΔ strain at the third streaks.
- https://cdn.elifesciences.org/articles/91223/elife-91223-fig3-data9-v1.zip
-
Figure 3—source data 10
Original file for the growth analysis in Figure 3D for SY12YΔ strain at the 31st streaks.
- https://cdn.elifesciences.org/articles/91223/elife-91223-fig3-data10-v1.zip
-
Figure 3—source data 11
Original file for the growth analysis in Figure 3D for SY12YΔ strain at the 61st streaks.
- https://cdn.elifesciences.org/articles/91223/elife-91223-fig3-data11-v1.zip
-
Figure 3—source data 12
Original file for the growth analysis in Figure 3D for SY12XYΔ strain at the third streaks.
- https://cdn.elifesciences.org/articles/91223/elife-91223-fig3-data12-v1.zip
-
Figure 3—source data 13
Original file for the growth analysis in Figure 3D for SY12XYΔ strain at the 31st streaks.
- https://cdn.elifesciences.org/articles/91223/elife-91223-fig3-data13-v1.zip
-
Figure 3—source data 14
Original file for the growth analysis in Figure 3D for SY12XYΔ strain at the 61st streaks.
- https://cdn.elifesciences.org/articles/91223/elife-91223-fig3-data14-v1.zip
-
Figure 3—source data 15
Original file for the growth analysis in Figure 3D for SY12XYΔ+Y strain at the third streaks.
- https://cdn.elifesciences.org/articles/91223/elife-91223-fig3-data15-v1.zip
-
Figure 3—source data 16
Original file for the growth analysis in Figure 3D for SY12XYΔ+Y strain at the 31st streaks.
- https://cdn.elifesciences.org/articles/91223/elife-91223-fig3-data16-v1.zip
-
Figure 3—source data 17
Original file for the growth analysis in Figure 3D for SY12XYΔ+Y strain at the 61st streaks.
- https://cdn.elifesciences.org/articles/91223/elife-91223-fig3-data17-v1.zip
-
Figure 3—source data 18
File containing Figure 3D and original photos of growth analysis of SY12 subtelomeric deletion strains.
- https://cdn.elifesciences.org/articles/91223/elife-91223-fig3-data18-v1.zip
-
Figure 3—source data 19
File containing output results of growth analysis of the SY12 subtelomeric deletion strains in Figure 3E.
- https://cdn.elifesciences.org/articles/91223/elife-91223-fig3-data19-v1.zip
-
Figure 3—source data 20
Original FACS analysis results of Figure 3F.
- https://cdn.elifesciences.org/articles/91223/elife-91223-fig3-data20-v1.zip
-
Figure 3—source data 21
Original file for the dotting assay on YPD plate at 24°C in Figure 3G.
- https://cdn.elifesciences.org/articles/91223/elife-91223-fig3-data21-v1.zip
-
Figure 3—source data 22
Original file for the dotting assay on YPD plate at 30°C in Figure 3G.
- https://cdn.elifesciences.org/articles/91223/elife-91223-fig3-data22-v1.zip
-
Figure 3—source data 23
Original file for the dotting assay on YPD plate at 37°C in Figure 3G.
- https://cdn.elifesciences.org/articles/91223/elife-91223-fig3-data23-v1.zip
-
Figure 3—source data 24
Original file for the dotting assay on YPD plate containing MMS in Figure 3G.
- https://cdn.elifesciences.org/articles/91223/elife-91223-fig3-data24-v1.zip
-
Figure 3—source data 25
Original file for the dotting assay on YPD plate containing CPT in Figure 3G.
- https://cdn.elifesciences.org/articles/91223/elife-91223-fig3-data25-v1.zip
-
Figure 3—source data 26
Original file for the dotting assay on YPD plate containing HU in Figure 3G.
- https://cdn.elifesciences.org/articles/91223/elife-91223-fig3-data26-v1.zip
-
Figure 3—source data 27
File containing Figure 3G and original photos of dotting assays of SY12 subtelomeric deletion strains.
- https://cdn.elifesciences.org/articles/91223/elife-91223-fig3-data27-v1.zip
Figure 3—figure supplement 1

Schematics of CRISPR–Cas9-mediated deletion of X- and Y’-elements on individual chromosomes in SY12 cells.
The specific DNA sequences centromere-proximal to the subtelomeric region (site S1) were cleaved by the Cas9 nuclease with the guidance of gRNA1. Homologous recombination between the broken ends and the provided donors led to the deletion of X- and Y’-elements. Galactose induction of gRNA2 on pCas9 caused the cleavage at site S2 and the URA3 marker was counter-selected on 5′-FOA plates. Deletion of X- and Y’-elements were determined by PCR analysis with a primer located within the deletion region and another upstream of the region (indicated by purple arrows).
Figure 4
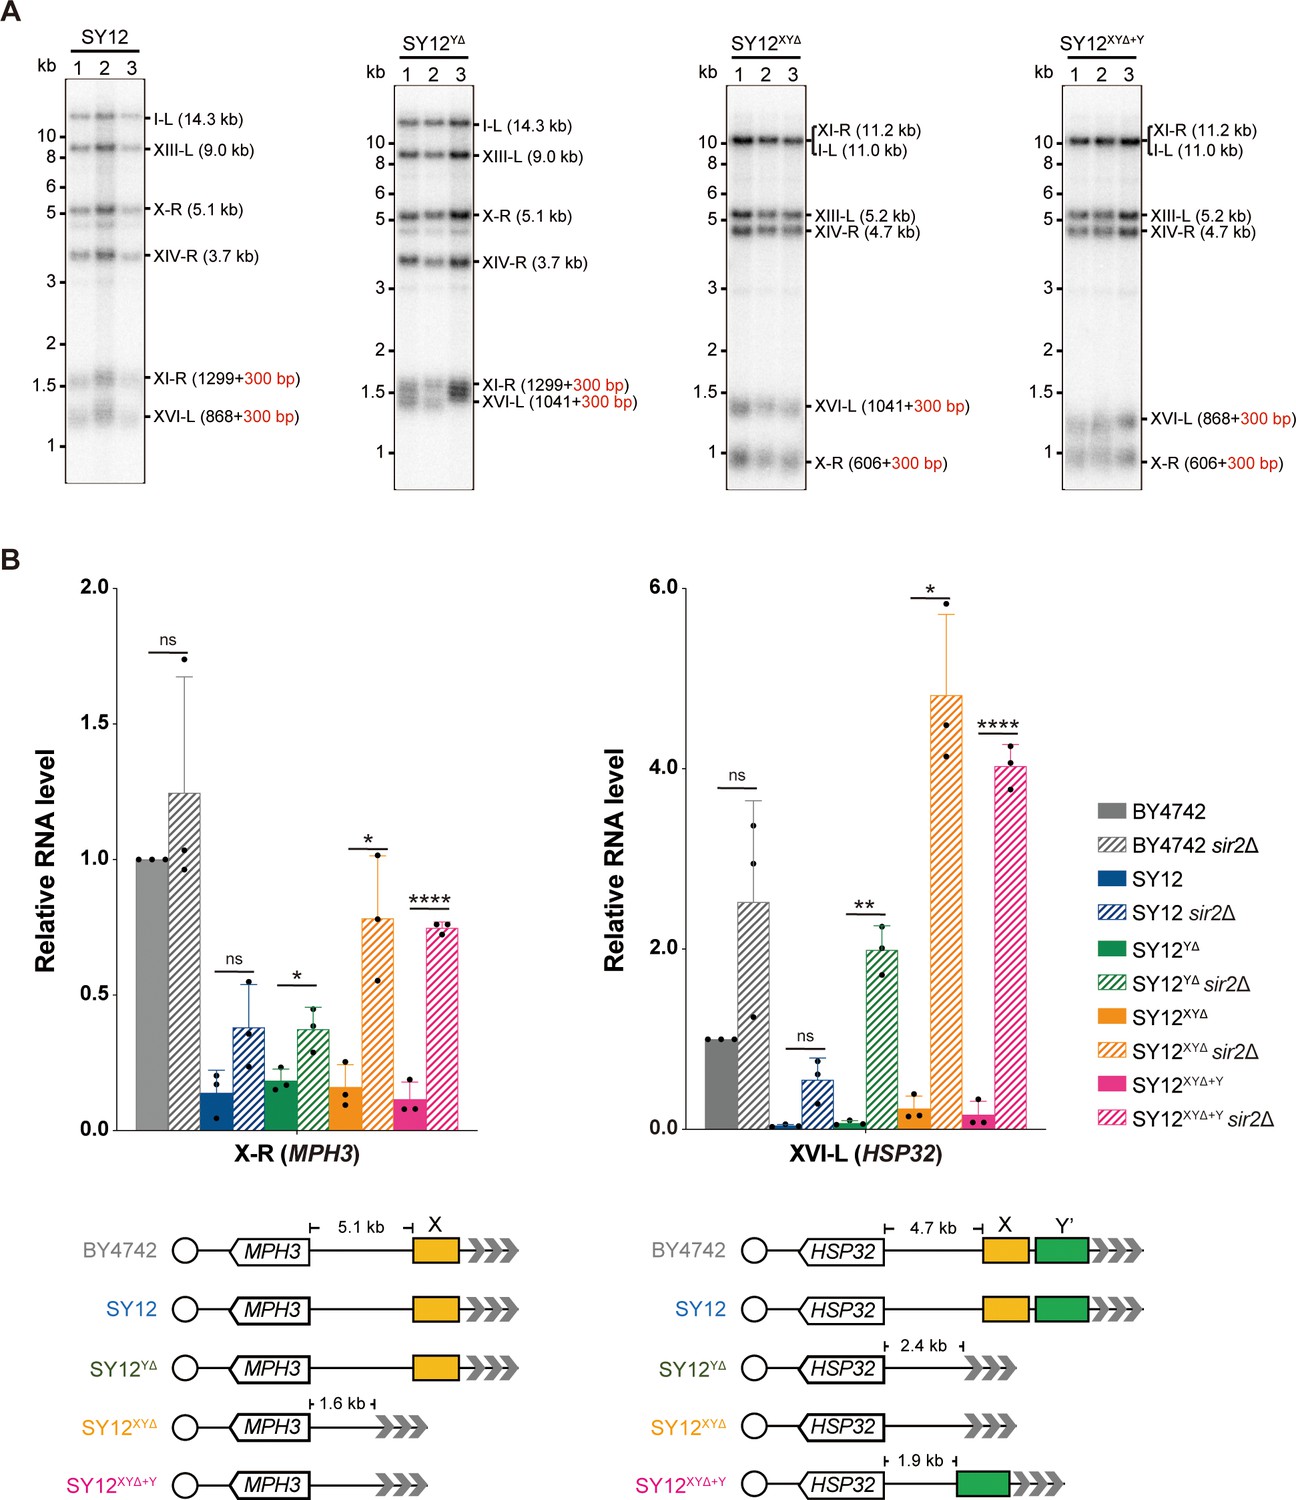
Telomere length and telomere silencing analyses of SY12YΔ, SY12ΧΥΔ, and SY12XYΔ+Υ strains.
(A) Southern blotting analysis of telomere length in SY12, SY12YΔ, SY12XYΔ, and SY12XYΔ+Υ (labeled on top) cells. Genomic DNA prepared from three independent clones of SY12, SY12YΔ, SY12XYΔ, and SY12XYΔ+Υ strains were digested with XhoI and PaeI, and then subjected to Southern blotting with a TG1-3 probe. The numbers in brackets indicate the telomere length of the corresponding chromosomes. (B) Expressions of MPH3 and HSP32 in ΒΥ4742, SY12, SY12YΔ, SY12XYΔ, and SY12XYΔ+Υ cells were detected by qRT-PCR. The numbers above the schematic line (lower panels) indicate the distance to the corresponding subtelomeric elements or telomeres. The RNA levels of MPH3 and HSP32 were normalized by ACT1. The wild-type value is arbitrarily set to 1. Error bars represent standard deviation (s.d.), n = 3. ‘ns’, p>0.5 (Student’s t-test); *p<0.05 (Student’s t-test); **p<0.01 (Student’s t-test); ****p<0.0001 (Student’s t-test).
-
Figure 4—source data 1
Original file for the Southern blotting analysis in Figure 4A.
- https://cdn.elifesciences.org/articles/91223/elife-91223-fig4-data1-v1.zip
-
Figure 4—source data 2
File containing Figure 4A and original scans of the relevant Southern blotting analysis.
- https://cdn.elifesciences.org/articles/91223/elife-91223-fig4-data2-v1.zip
-
Figure 4—source data 3
File containing output results of qPCR.
- https://cdn.elifesciences.org/articles/91223/elife-91223-fig4-data3-v1.zip
Figure 5 with 3 supplements
Survivor analysis of SY12YΔtlc1Δ strain.
(A) Cell viability assay in liquid medium. The growth of SY12YΔ (labeled in black) and SY12YΔtlc1Δ (three clones labeled in blue, purple, and green, respectively) strains were monitored every 24 hr for 12 d. (B) Telomeric Southern blotting assay of SY12YΔtlc1Δ survivors. Genomic DNAs prepared from SY12YΔtlc1Δ survivors assayed in (A) were digested with XhoI and subjected to Southern blotting with a TG1-3 probe. (C) Telomere Southern blotting analysis of SY12YΔtlc1Δ survivors obtained on solid medium. Genomic DNAs of 50 independent survivors (labeled 1–50 on top) were digested with XhoI and hybridized by a TG1-3 probe. Type II survivors: in orange; circular survivors: in blue; uncharacterized survivors: in black. Theoretical telomere restriction fragments of the SY12YΔ strain are indicated on the left. LC: loading control. (D) The ratio of survivor types in SY12 YΔtlc1Δ strain. n = 50; Type II, in orange; uncharacterized survivor, in gray; circular survivor, in blue. (E) Schematic of three circular chromosomes and fusion sequences in the SY12YΔtlc1Δ-C1 survivor. The sequence in blue indicates the sequences of X-R, XI-R, or XIV-R, the sequence in red indicates the sequences of I-L, XIII-L, or XVI-L. Bases in green are mis-paired, dashes are deleted. The numbers above or below the schematic line (chromosome) indicate the distance to the corresponding telomeres.
-
Figure 5—source data 1
File containing output results of growth analysis of the SY12YΔ tlc1Δ strain.
- https://cdn.elifesciences.org/articles/91223/elife-91223-fig5-data1-v1.zip
-
Figure 5—source data 2
Original file for the Southern blotting analysis in Figure 5B.
- https://cdn.elifesciences.org/articles/91223/elife-91223-fig5-data2-v1.zip
-
Figure 5—source data 3
File containing Figure 5B and original scans of the relevant Southern blotting analysis.
- https://cdn.elifesciences.org/articles/91223/elife-91223-fig5-data3-v1.zip
-
Figure 5—source data 4
Original file for the Southern blotting analysis in Figure 5C.
- https://cdn.elifesciences.org/articles/91223/elife-91223-fig5-data4-v1.zip
-
Figure 5—source data 5
Original file for the Southern blotting analysis in Figure 5C.
- https://cdn.elifesciences.org/articles/91223/elife-91223-fig5-data5-v1.zip
-
Figure 5—source data 6
Original file for the loading control of Southern blotting analysis in Figure 5C.
- https://cdn.elifesciences.org/articles/91223/elife-91223-fig5-data6-v1.zip
-
Figure 5—source data 7
Original file for the loading control of Southern blotting analysis in Figure 5C.
- https://cdn.elifesciences.org/articles/91223/elife-91223-fig5-data7-v1.zip
-
Figure 5—source data 8
File containing Figure 5C and original scans of the relevant Southern blotting analysis.
- https://cdn.elifesciences.org/articles/91223/elife-91223-fig5-data8-v1.zip
-
Figure 5—source data 9
File containing the original scans of the loading control of the Southern blotting analysis in Figure 5C.
- https://cdn.elifesciences.org/articles/91223/elife-91223-fig5-data9-v1.zip
Figure 5—figure supplement 1
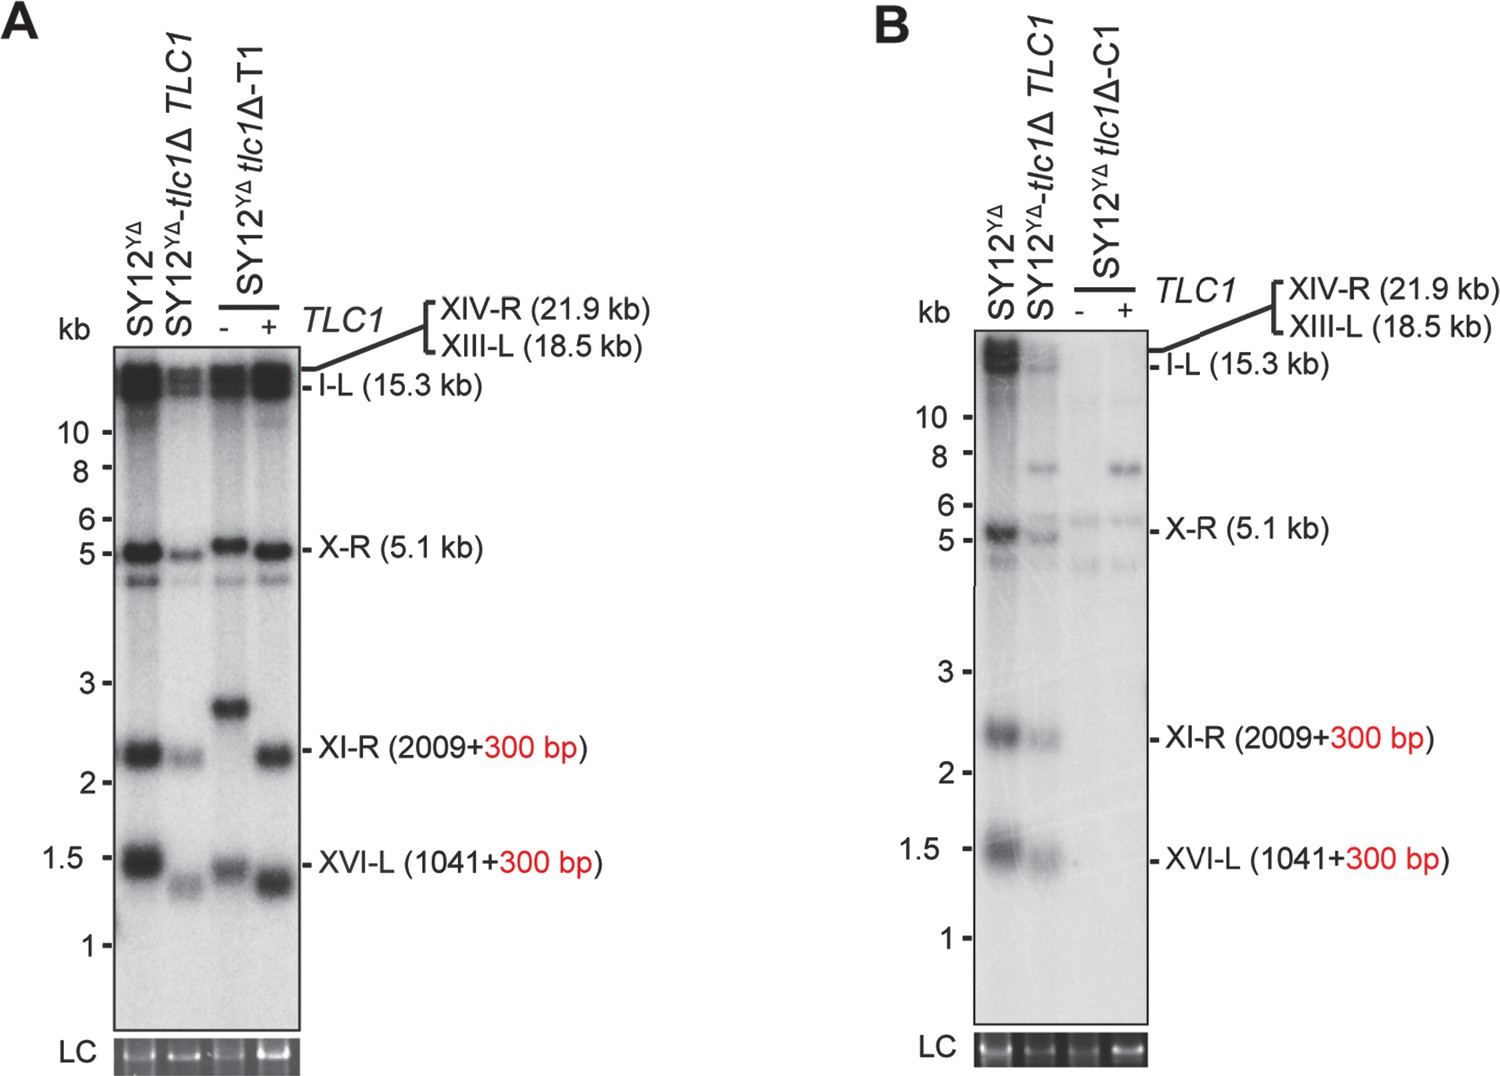
Southern blotting results of reintroducing TLC1 into SY12 YΔ tlc1Δ survivors.
(A) Southern blotting result of SY12 YΔ tlc1Δ Type II survivor at the 20th re-streaks after TLC1 reintroduction. LC: loading control. (B) Southern blotting result of SY12 YΔ tlc1Δ circular survivor at the 20th re-streaks after TLC1 reintroduction. LC: loading control.
-
Figure 5—figure supplement 1—source data 1
Original file for the Southern blotting analysis in Figure 5—figure supplement 1A.
- https://cdn.elifesciences.org/articles/91223/elife-91223-fig5-figsupp1-data1-v1.zip
-
Figure 5—figure supplement 1—source data 2
Original file for the loading control of Southern blotting analysis in Figure 5—figure supplement 1A.
- https://cdn.elifesciences.org/articles/91223/elife-91223-fig5-figsupp1-data2-v1.zip
-
Figure 5—figure supplement 1—source data 3
Original file for the Southern blotting analysis in Figure 5—figure supplement 1B.
- https://cdn.elifesciences.org/articles/91223/elife-91223-fig5-figsupp1-data3-v1.zip
-
Figure 5—figure supplement 1—source data 4
Original file for the loading control of Southern blotting analysis in Figure 5—figure supplement 1B.
- https://cdn.elifesciences.org/articles/91223/elife-91223-fig5-figsupp1-data4-v1.zip
-
Figure 5—figure supplement 1—source data 5
File containing Figure 5—figure supplement 1A and B and original scans of the relevant Southern blotting analysis.
- https://cdn.elifesciences.org/articles/91223/elife-91223-fig5-figsupp1-data5-v1.zip
-
Figure 5—figure supplement 1—source data 6
File containing the original scans of the loading control of the Southern blotting analysis in Figure 5—figure supplement 1.
- https://cdn.elifesciences.org/articles/91223/elife-91223-fig5-figsupp1-data6-v1.zip
Figure 5—figure supplement 2
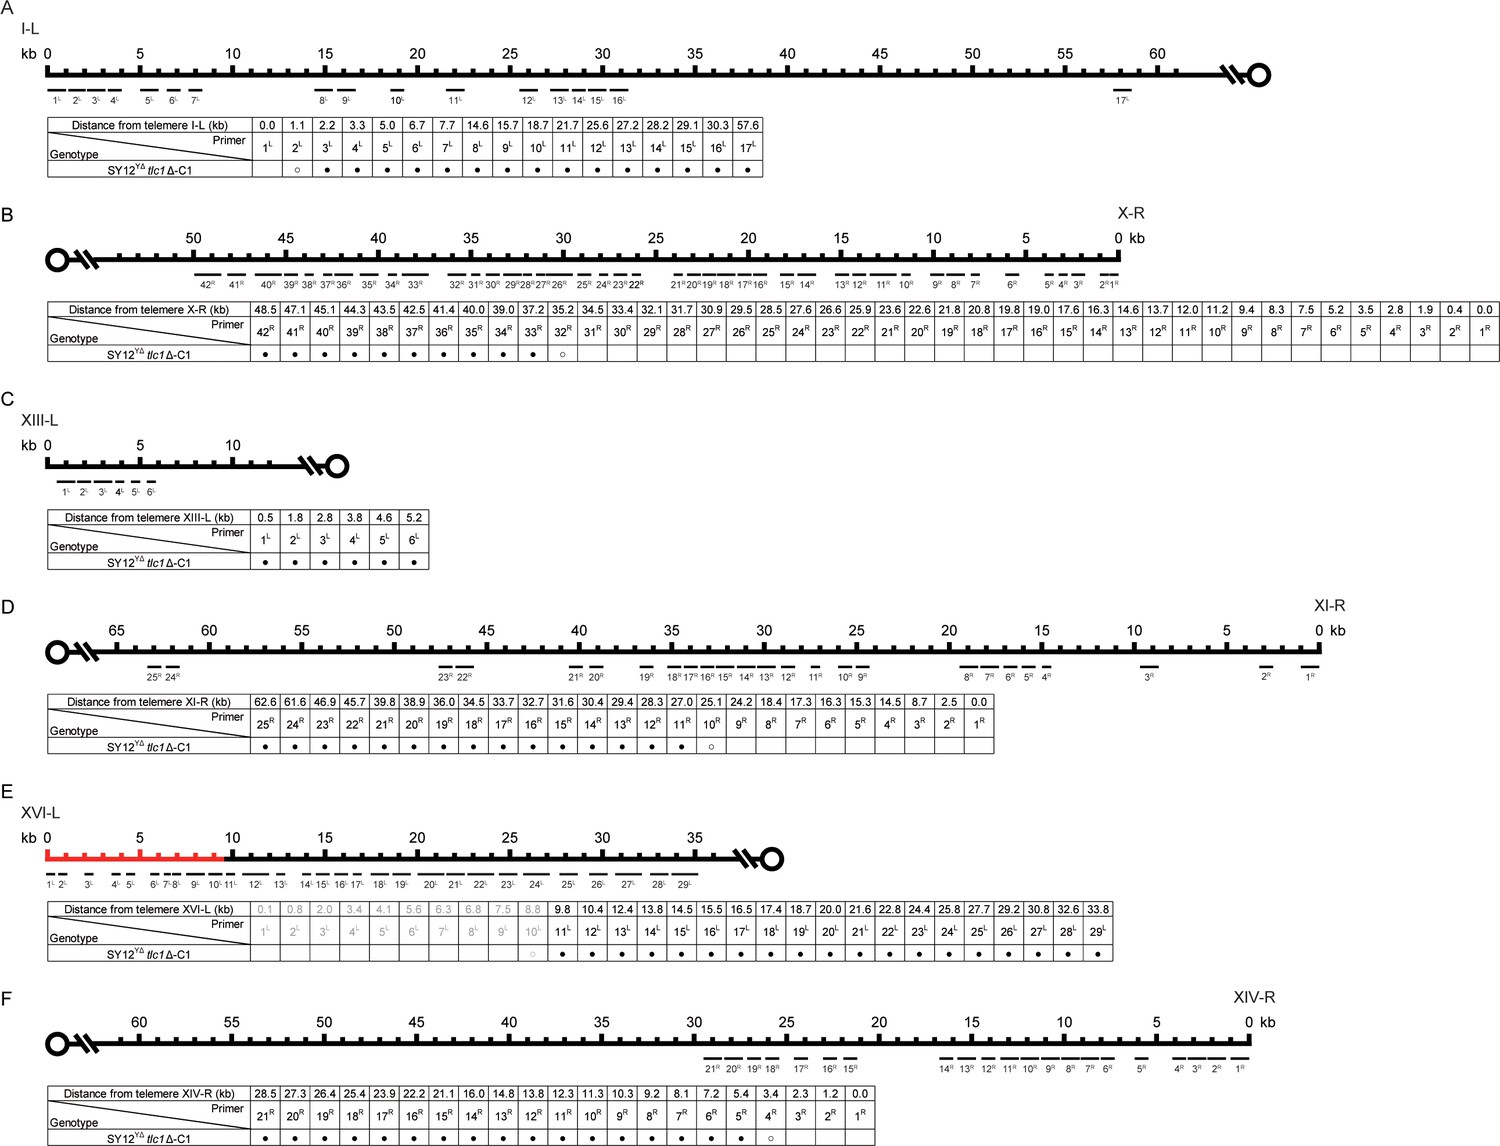
PCR mapping of the borders of erosion in SY12YΔtlc1Δ-C1 cell.
Red lines indicate the regions which have been deleted in the SY12YΔ strain. (A) Upper panel, a schematic diagram of the subtelomeric region of 0-60 kb proximal to I-L telomere is shown. Primer pairs (no. 1L to 17L) are aligned and indicated at their corresponding subtelomeric loci. Lower panel, the genotype is listed on the left, and primer pairs are listed on top; solid circles mean positive PCR products and open circles mean no PCR products with corresponding primer pairs. (B) Upper panel, a schematic diagram of the subtelomeric region of 0-50 kb proximal to X-R telomeric TG1-3 sequence is shown. Primer pairs (no. 1R to 42R) are aligned and indicated at their corresponding subtelomeric loci. Lower panel, the genotype is listed on the left, and primer pairs are listed on top. (C) Upper panel, a schematic diagram of the subtelomeric region of 0-10 kb proximal to XIII-L telomeric TG1-3 sequence is shown. Primer pairs (no. 1L to 6L) are aligned and indicated at their corresponding subtelomeric loci. Lower panel, the genotype is listed on the left, and primer pairs are listed on top. (D) Upper panel, a schematic diagram of the subtelomeric region of 0-65 kb proximal to XI-R telomeric TG1-3 sequence is shown. Primer pairs (no. 1R to 25R) are aligned and indicated at their corresponding subtelomeric loci. Lower panel, the genotype is listed on the left, and primer pairs are listed on top. (E) Upper panel, a schematic diagram of the subtelomeric region of 0-35 kb proximal to XVI-L telomeric TG1-3 sequence is shown. Primer pairs (no. 1L to 29L) are aligned and indicated at their corresponding subtelomeric loci. Lower panel, the genotype is listed on the left, and primer pairs are listed on top. (F) Upper panel, a schematic diagram of the subtelomeric region of 0-60 kb proximal to XIV-R telomeric TG1-3 sequence is shown. Primer pairs (no. 1R to 21R) are aligned and indicated at their corresponding subtelomeric loci. Lower panel, the genotype is listed on the left, and primer pairs are listed on top.
Figure 5—figure supplement 3
Survivor formation in SY12YΔ tlc1Δ rad52Δ strain.
(A) Cell viability assay in liquid culture. The growth of SY12YΔ (labeled in black), SY12YΔ tlc1Δ (two clones labeled in purple and blue, respectively), and SY12YΔ tlc1Δ rad52Δ (three clones labeled in violet, pink, and carmine, respectively) strains were monitored every 24 hr for 12 d. (B) Telomere Southern blotting assay of SY12YΔ tlc1Δ rad52Δ survivors obtained on solid medium. Genomic DNA from 25 independent clones (labeled on top) was digested with XhoI and hybridized to a telomere-specific TG1–3 probe. Circular survivors: in blue; uncharacterized survivors: in black. Theoretical telomere restriction fragments of the SY12YΔ strain are indicated on the left. The asterisks indicate the non-specific bands. Genomic DNA stained with Gelred was used as a relative loading control (LC).
-
Figure 5—figure supplement 3—source data 1
File containing output results of growth analysis of the SY12YΔ tlc1Δ rad52Δ strain in Figure 5—figure supplement 3A.
- https://cdn.elifesciences.org/articles/91223/elife-91223-fig5-figsupp3-data1-v1.zip
-
Figure 5—figure supplement 3—source data 2
Original file for the Southern blotting analysis in Figure 5—figure supplement 3B.
- https://cdn.elifesciences.org/articles/91223/elife-91223-fig5-figsupp3-data2-v1.zip
-
Figure 5—figure supplement 3—source data 3
Original file for the loading control of Southern blotting analysis in Figure 5—figure supplement 3B.
- https://cdn.elifesciences.org/articles/91223/elife-91223-fig5-figsupp3-data3-v1.zip
-
Figure 5—figure supplement 3—source data 4
File containing Figure 5—figure supplement 3B and original scans of the relevant Southern blotting analysis.
- https://cdn.elifesciences.org/articles/91223/elife-91223-fig5-figsupp3-data4-v1.zip
-
Figure 5—figure supplement 3—source data 5
File containing the original scans of the loading control of the Southern blotting analysis in Figure 5—figure supplement 3B.
- https://cdn.elifesciences.org/articles/91223/elife-91223-fig5-figsupp3-data5-v1.zip
Figure 6 with 7 supplements
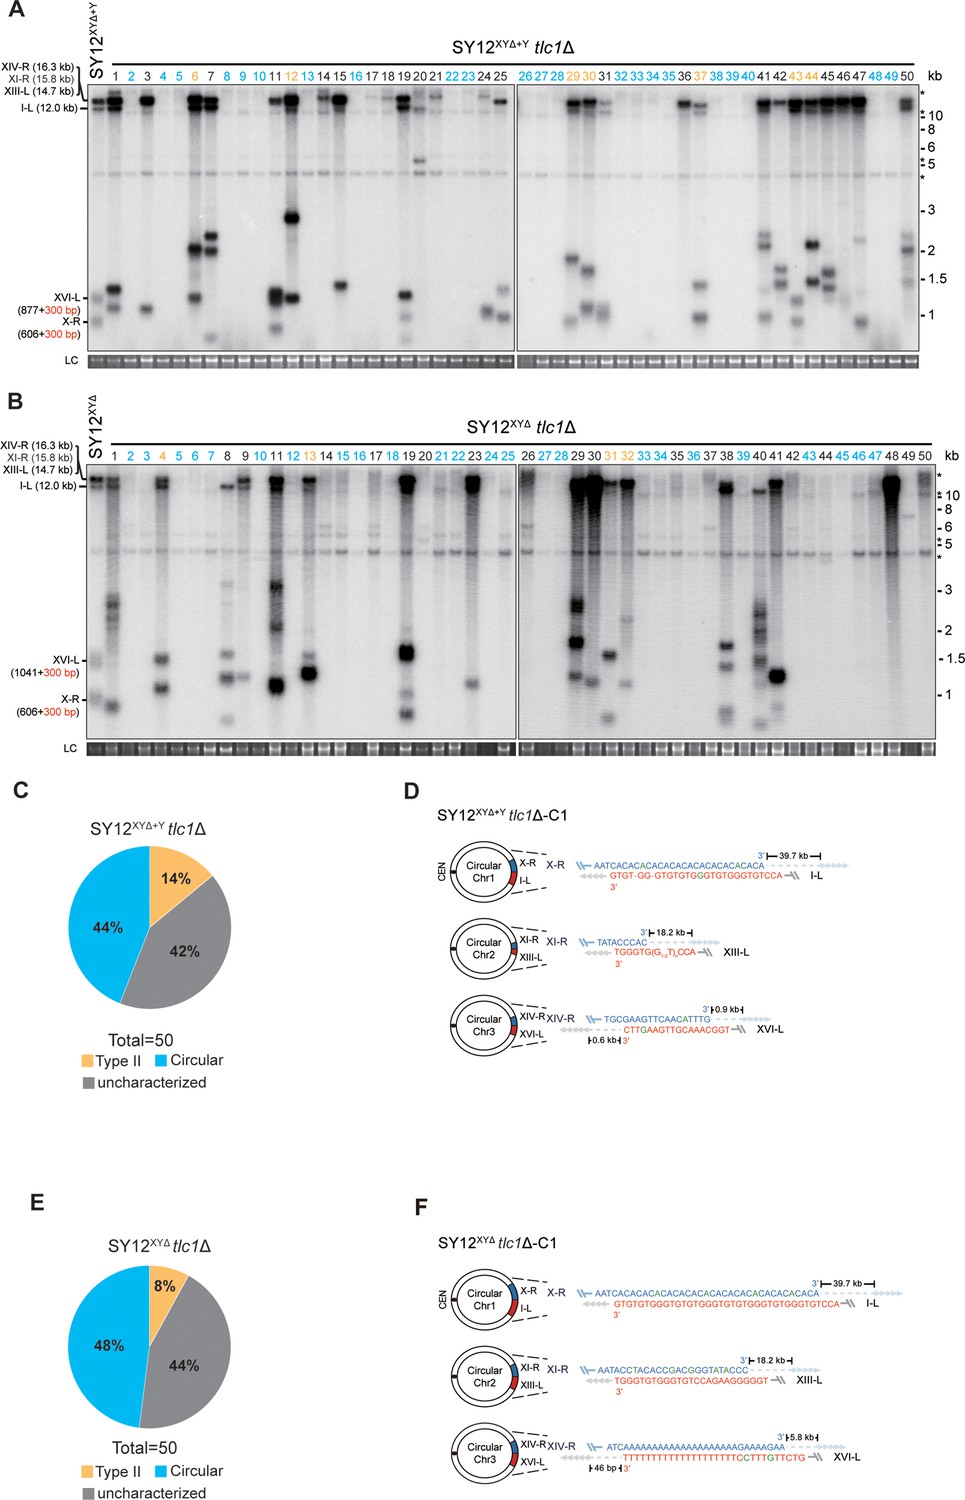
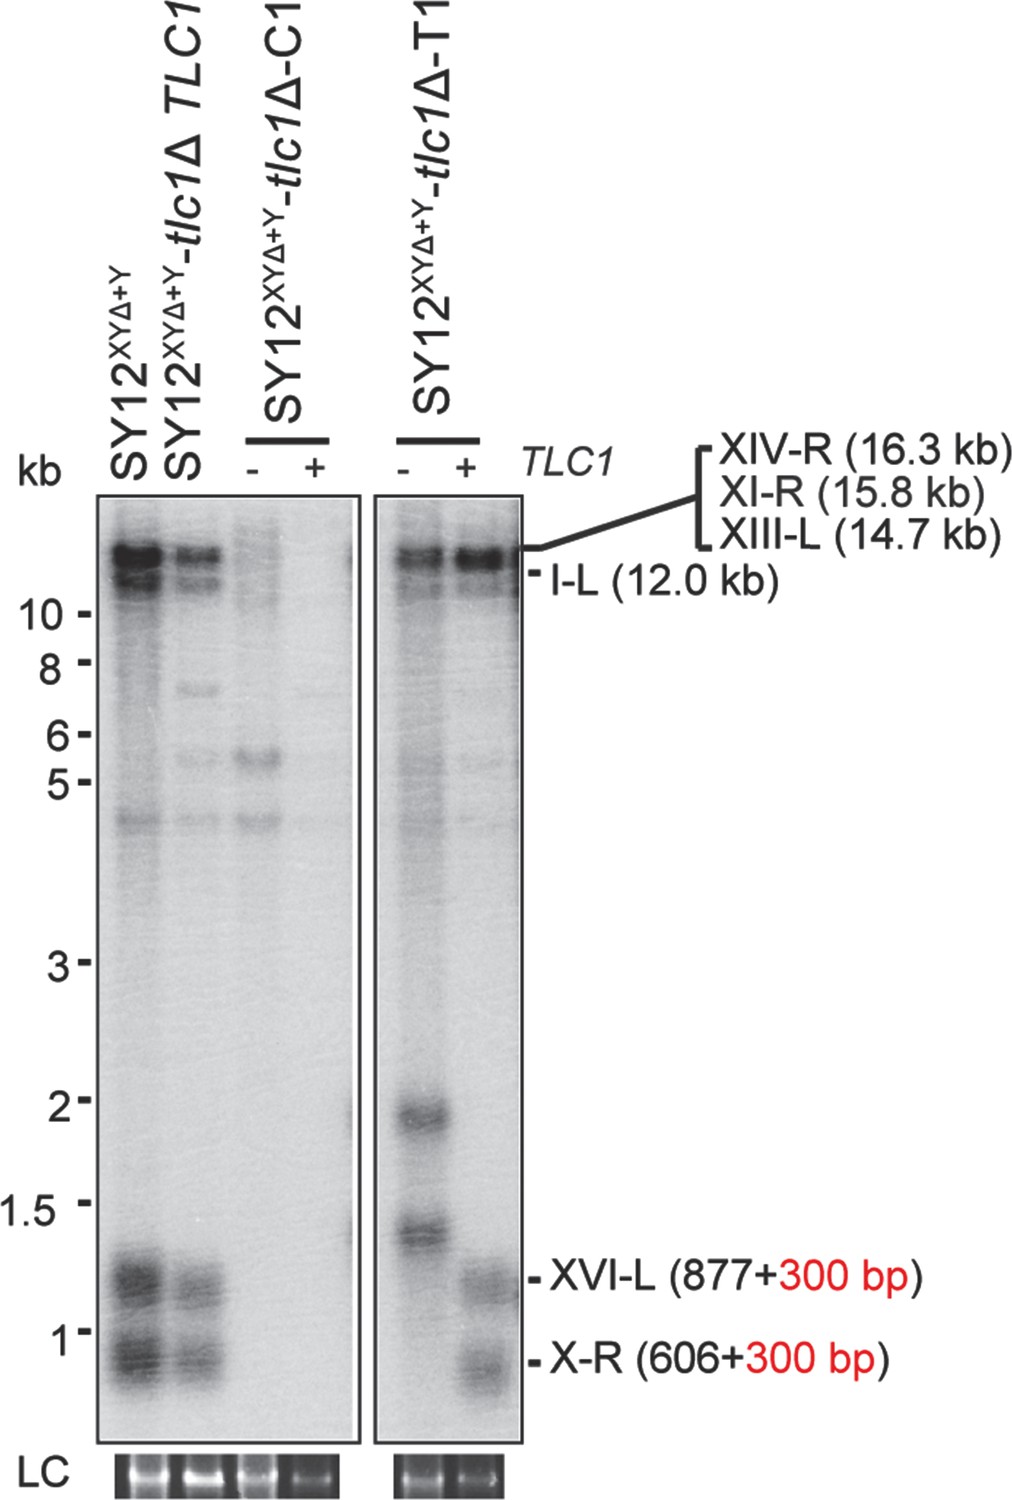
Survivor analysis of SY12XYΔtlc1Δ and SY12XYΔ+Ytlc1Δ strains.
(A, B) Telomere Southern blotting analysis of SY12XYΔ+Ytlc1Δ (A) and SY12XYΔ tlc1Δ (B) survivors obtained on solid medium. 50 independent survivors (labeled 1–50 on top) were randomly picked, and their genomic DNAs were digested with XhoI and subjected to the Southern blotting assay with a TG1-3 probe. Type II survivors: in orange; circular survivors: in blue; uncharacterized survivors: in black. The sizes of individual telomere restriction fragments of the SY12XYΔ+Y and SY12XYΔ strain are indicated on the left. LC: loading control. (C, E) The percentage of survivor types in SY12 XYΔ+Ytlc1Δ (C) and SY12 XYΔtlc1Δ (E) strains. n = 50; Type II, in orange; uncharacterized survivor, in gray; circular survivor, in blue. (D, F) Schematic of three circular chromosomes and fusion sequences in the SY12XYΔ+Ytlc1Δ-C1 (D) and SY12XYΔ tlc1Δ-C1 (F) survivors, respectively. The sequence in blue indicates the sequences of X-R, XI-R, or XIV-R, the sequence in red indicates the sequences of I-L, XIII-L, or XVI-L. Bases in green are mis-paired, dashes are deleted. The numbers above or below the schematic line (chromosome) indicate the distance to the corresponding telomeres.
-
Figure 6—source data 1
Original file for the Southern blotting analysis in Figure 6A.
- https://cdn.elifesciences.org/articles/91223/elife-91223-fig6-data1-v1.zip
-
Figure 6—source data 2
Original file for the Southern blotting analysis in Figure 6A.
- https://cdn.elifesciences.org/articles/91223/elife-91223-fig6-data2-v1.zip
-
Figure 6—source data 3
Original file for the loading control of Southern blotting analysis in Figure 6A.
- https://cdn.elifesciences.org/articles/91223/elife-91223-fig6-data3-v1.zip
-
Figure 6—source data 4
Original file for the loading control of Southern blotting analysis in Figure 6A.
- https://cdn.elifesciences.org/articles/91223/elife-91223-fig6-data4-v1.zip
-
Figure 6—source data 5
File containing Figure 6A and original scans of the relevant Southern blotting analysis.
- https://cdn.elifesciences.org/articles/91223/elife-91223-fig6-data5-v1.zip
-
Figure 6—source data 6
File containing the original scans of the loading control of the Southern blotting analysis in Figure 6A.
- https://cdn.elifesciences.org/articles/91223/elife-91223-fig6-data6-v1.zip
-
Figure 6—source data 7
Original file for the Southern blotting analysis in Figure 6B.
- https://cdn.elifesciences.org/articles/91223/elife-91223-fig6-data7-v1.zip
-
Figure 6—source data 8
Original file for the Southern blotting analysis in Figure 6B.
- https://cdn.elifesciences.org/articles/91223/elife-91223-fig6-data8-v1.zip
-
Figure 6—source data 9
Original file for the loading control of Southern blotting analysis in Figure 6B.
- https://cdn.elifesciences.org/articles/91223/elife-91223-fig6-data9-v1.zip
-
Figure 6—source data 10
Original file for the loading control of Southern blotting analysis in Figure 6B.
- https://cdn.elifesciences.org/articles/91223/elife-91223-fig6-data10-v1.zip
-
Figure 6—source data 11
File containing Figure 6B and original scans of the relevant Southern blotting analysis.
- https://cdn.elifesciences.org/articles/91223/elife-91223-fig6-data11-v1.zip
-
Figure 6—source data 12
File containing the original scans of the loading control of the Southern blotting analysis in Figure 6B.
- https://cdn.elifesciences.org/articles/91223/elife-91223-fig6-data12-v1.zip
Figure 6—figure supplement 1
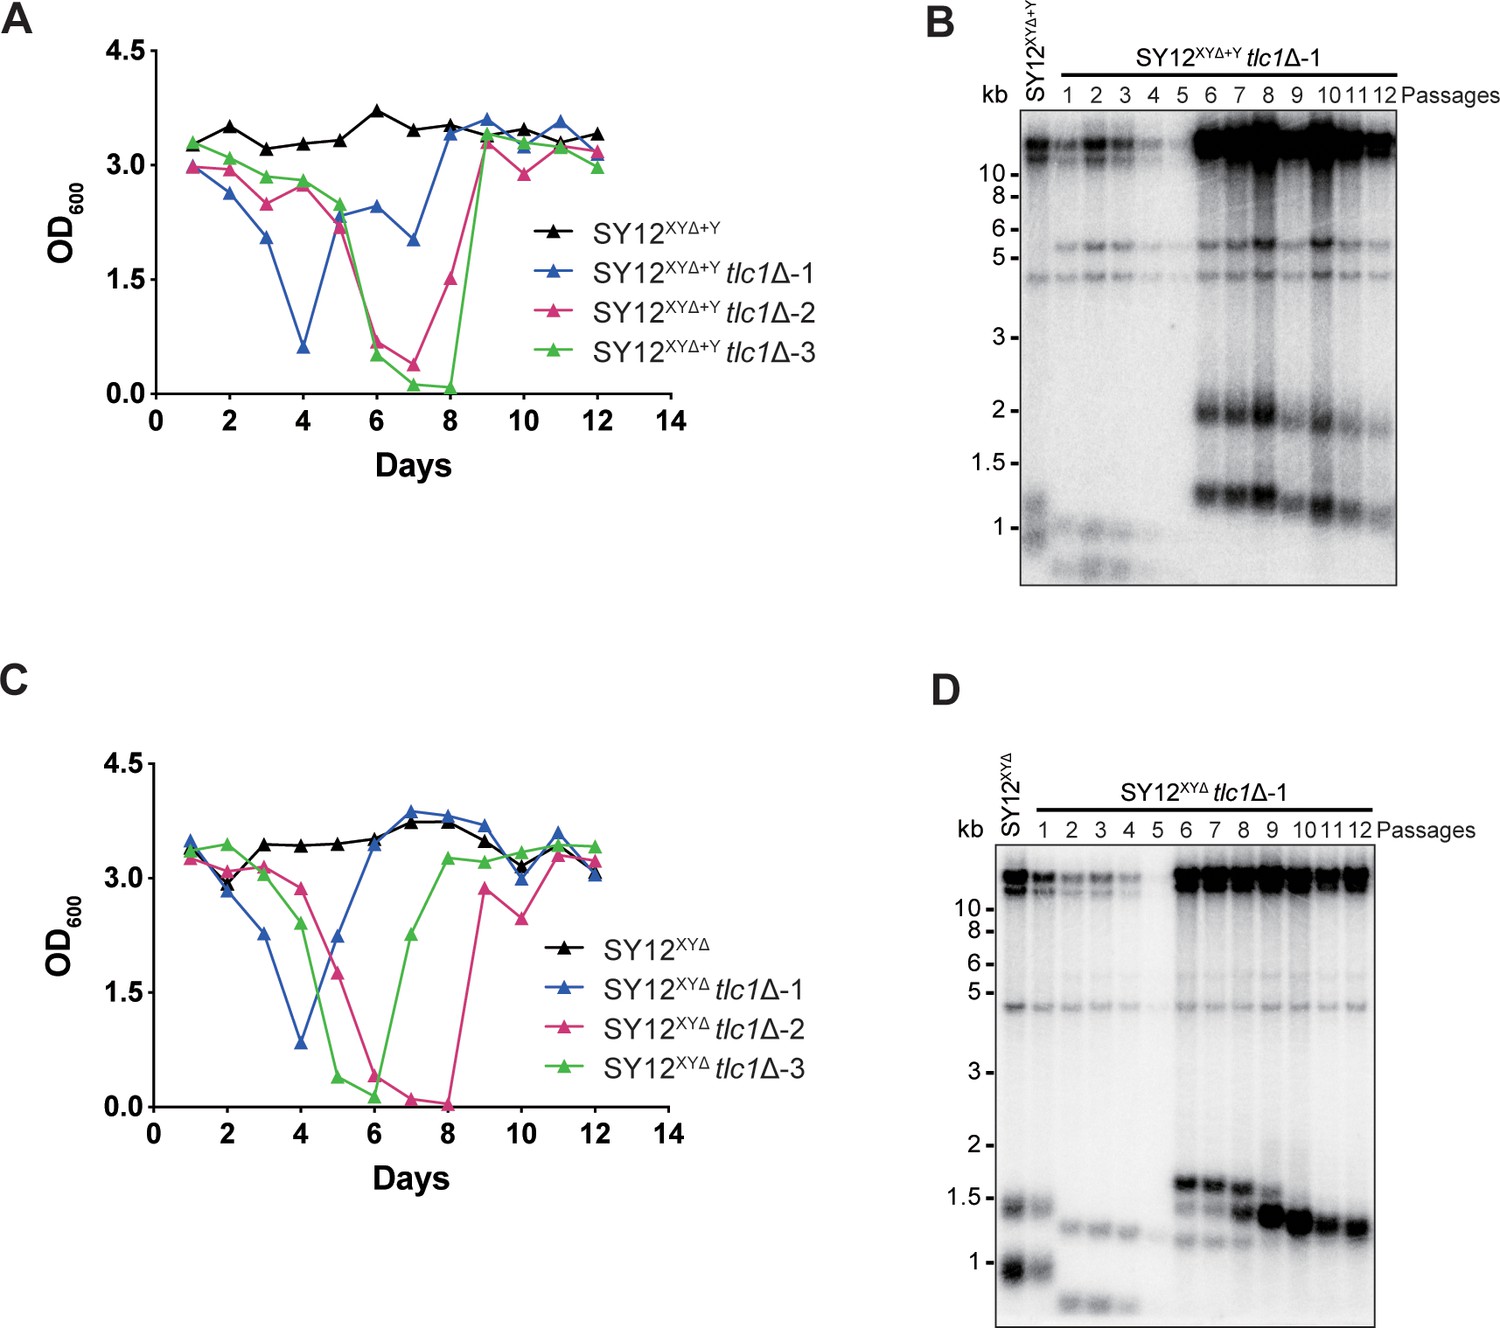
SY12XYΔ+Ytlc1Δ and SY12XYΔtlc1Δ strains form Type II survivors in liquid culture.
(A) Cell viability assay in liquid medium: the growth of SY12XYΔ+Y (labeled in black) and SY12XYΔ+Ytlc1Δ (three clones labeled in blue, purple, and green, respectively) strains were monitored every 24 hr for 12 d. (B) Telomeric Southern blotting assay of SY12XYΔ+Ytlc1Δ survivors. Genomic DNAs prepared from survivors in (A) were digested with XhoI and subjected to Southern blotting with a TG1-3 probe. (C) Cell viability assay in liquid medium: Tthe growth of SY12XYΔ (labeled in black) and SY12XYΔ tlc1Δ (three clones labeled in blue, purple, and green, respectively) strains were monitored every 24 hr for 12 d. (D) Telomeric Southern blotting assay of SY12XYΔ tlc1Δ survivors. Genomic DNAs prepared from survivors in (C) were digested with XhoI and subjected to Southern blotting with a TG1-3 probe.
-
Figure 6—figure supplement 1—source data 1
File containing output results of growth analysis of the SY12XYΔ+Y tlc1Δ strain in Figure 6—figure supplement 1A.
- https://cdn.elifesciences.org/articles/91223/elife-91223-fig6-figsupp1-data1-v1.zip
-
Figure 6—figure supplement 1—source data 2
Original file for the Southern blotting analysis in Figure 6—figure supplement 1B.
- https://cdn.elifesciences.org/articles/91223/elife-91223-fig6-figsupp1-data2-v1.zip
-
Figure 6—figure supplement 1—source data 3
File containing output results of growth analysis of the SY12XYΔ tlc1Δ strain Figure 6—figure supplement 1C.
- https://cdn.elifesciences.org/articles/91223/elife-91223-fig6-figsupp1-data3-v1.zip
-
Figure 6—figure supplement 1—source data 4
Original file for the Southern blotting analysis in Figure 6—figure supplement 1D.
- https://cdn.elifesciences.org/articles/91223/elife-91223-fig6-figsupp1-data4-v1.zip
-
Figure 6—figure supplement 1—source data 5
File containing Figure 6—figure supplement 1B and D and original scans of the relevant Southern blotting analysis.
- https://cdn.elifesciences.org/articles/91223/elife-91223-fig6-figsupp1-data5-v1.zip
Figure 6—figure supplement 2
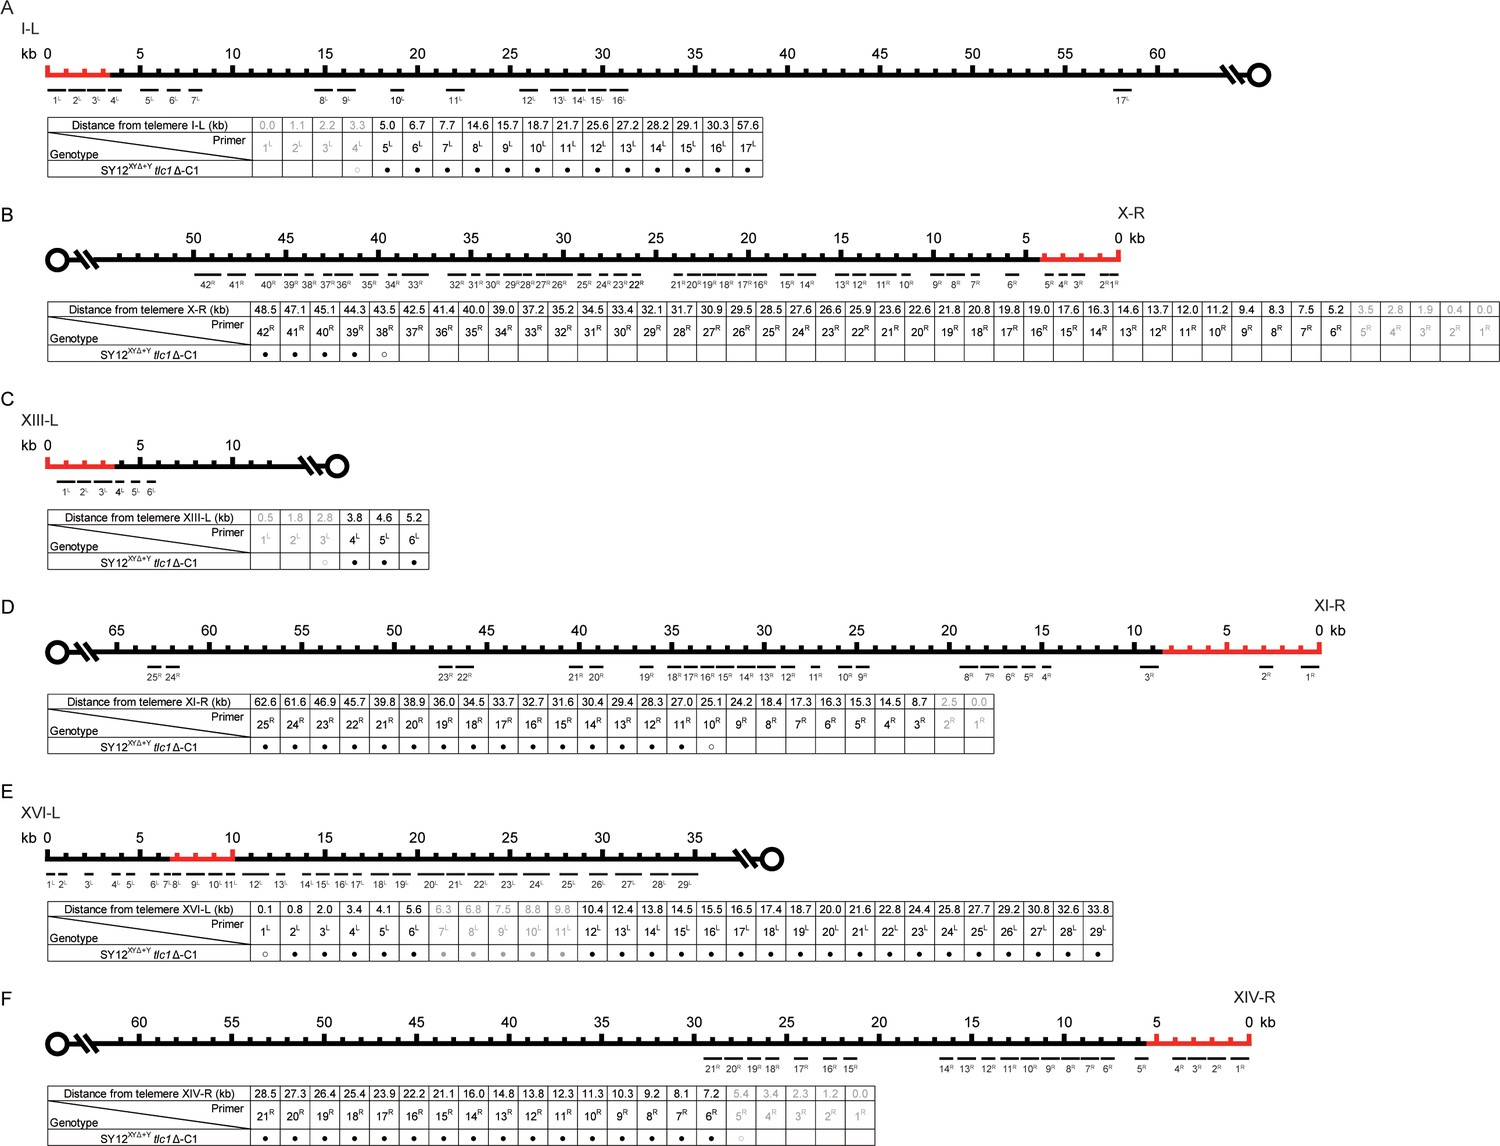
PCR mapping of the borders of erosion in SY12XYΔ+Υtlc1Δ-C1 cell.
Red lines indicate the regions which are absent in the SY12XYΔ+Υ strain. (A) Upper panel, a schematic diagram of the subtelomeric region of 0-60 kb proximal to I-L telomere is shown. Primer pairs (no. 1L to 17L) are aligned and indicated at their corresponding subtelomeric loci. Lower panel, the genotype is listed on the left, and primer pairs are listed on top; solid circles mean positive PCR products and open circles mean no PCR products with corresponding primer pairs. (B) Upper panel, a schematic diagram of the subtelomeric region of 0-50 kb proximal to X-R telomeric TG1-3 sequence is shown. Primer pairs (no. 1R to 42R) are aligned and indicated at their corresponding subtelomeric loci. Lower panel, the genotype is listed on the left, and primer pairs are listed on top. (C) Upper panel, a schematic diagram of the subtelomeric region of 0-10 kb proximal to XIII-L telomeric TG1-3 sequence is shown. Primer pairs (no. 1L to 6L) are aligned and indicated at their corresponding subtelomeric loci. Lower panel, the genotype is listed on the left, and primer pairs are listed on top. (D) Upper panel, a schematic diagram of the subtelomeric region of 0-65 kb proximal to XI-R telomeric TG1-3 sequence is shown. Primer pairs (no. 1R to 25R) are aligned and indicated at their corresponding subtelomeric loci. Lower panel, the genotype is listed on the left, and primer pairs are listed on top. (E) Upper panel, a schematic diagram of the subtelomeric region of 0-35 kb proximal to XVI-L telomeric TG1-3 sequence is shown. Primer pairs (no. 1L to 29L) are aligned and indicated at their corresponding subtelomeric loci. Lower panel, the genotype is listed on the left, and primer pairs are listed on top. (F) Upper panel, a schematic diagram of the subtelomeric region of 0-60 kb proximal to XIV-R telomeric TG1-3 sequence is shown. Primer pairs (no. 1R to 21R) are aligned and indicated at their corresponding subtelomeric loci. Lower panel, the genotype is listed on the left, and primer pairs are listed on top.
Figure 6—figure supplement 3
Southern blotting results of an SY12XYΔ+Y tlc1Δ circular survivor and an SY12XYΔ+Y tlc1Δ Type II survivor at the 20th re-streaks after TLC1 reintroduction.
LC: loading control.
-
Figure 6—figure supplement 3—source data 1
Original file for the Southern blotting analysis in Figure 6—figure supplement 3.
- https://cdn.elifesciences.org/articles/91223/elife-91223-fig6-figsupp3-data1-v1.zip
-
Figure 6—figure supplement 3—source data 2
Original file for the loading control of Southern blotting analysis in Figure 6—figure supplement 3.
- https://cdn.elifesciences.org/articles/91223/elife-91223-fig6-figsupp3-data2-v1.zip
-
Figure 6—figure supplement 3—source data 3
File containing Figure 6—figure supplement 3 and original scans of the relevant Southern blotting analysis.
- https://cdn.elifesciences.org/articles/91223/elife-91223-fig6-figsupp3-data3-v1.zip
-
Figure 6—figure supplement 3—source data 4
File containing the original scans of the loading control of the Southern blotting analysis in Figure 6—figure supplement 3.
- https://cdn.elifesciences.org/articles/91223/elife-91223-fig6-figsupp3-data4-v1.zip
Figure 6—figure supplement 4

PCR mapping of the borders of erosion in SY12XYΔtlc1Δ-C1 cell.
Red lines indicate the regions which have been deleted in the SY12XYΔ strain. (A) Upper panel, a schematic diagram of the subtelomeric region of 0-60 kb proximal to I-L telomere is shown. Primer pairs (no. 1L to 17L) are aligned and indicated at their corresponding subtelomeric loci. Lower panel, the genotype is listed on the left, and primer pairs are listed on top; solid circles mean positive PCR products and open circles mean no PCR products with corresponding primer pairs. (B) Upper panel, a schematic diagram of the subtelomeric region of 0-50 kb proximal to X-R telomeric TG1-3 sequence is shown. Primer pairs (no. 1R to 42R) are aligned and indicated at their corresponding subtelomeric loci. Lower panel, the genotype is listed on the left, and primer pairs are listed on top. (C) Upper panel, a schematic diagram of the subtelomeric region of 0-10 kb proximal to XIII-L telomeric TG1-3 sequence is shown. Primer pairs (no. 1L to 6L) are aligned and indicated at their corresponding subtelomeric loci. Lower panel, the genotype is listed on the left, and primer pairs are listed on top. (D) Upper panel, a schematic diagram of the subtelomeric region of 0-65 kb proximal to XI-R telomeric TG1-3 sequence is shown. Primer pairs (no. 1R to 25R) are aligned and indicated at their corresponding subtelomeric loci. Lower panel, the genotype is listed on the left, and primer pairs are listed on top. (E) Upper panel, a schematic diagram of the subtelomeric region of 0-35 kb proximal to XVI-L telomeric TG1-3 sequence is shown. Primer pairs (no. 1L to 29L) are aligned and indicated at their corresponding subtelomeric loci. Lower panel, the genotype is listed on the left, and primer pairs are listed on top. (F) Upper panel, a schematic diagram of the subtelomeric region of 0-60 kb proximal to XIV-R telomeric TG1-3 sequence is shown. Primer pairs (no. 1R to 21R) are aligned and indicated at their corresponding subtelomeric loci. Lower panel, the genotype is listed on the left, and primer pairs are listed on top.
Figure 6—figure supplement 5

Southern blotting results of reintroducing TLC1 into SY12XYΔtlc1Δ survivors.
(A) Southern blotting result of SY12XYΔtlc1Δ circular survivor at the 20th re-streaks after TLC1 reintroduction. LC: loading control. (B) Southern blotting result of SY12XYΔtlc1Δ Type II survivor at the 20th re-streaks after TLC1 reintroduction. LC: loading control.
-
Figure 6—figure supplement 5—source data 1
Original file for the Southern blotting analysis in Figure 6—figure supplement 5A.
- https://cdn.elifesciences.org/articles/91223/elife-91223-fig6-figsupp5-data1-v1.zip
-
Figure 6—figure supplement 5—source data 2
Original file for the loading control of Southern blotting analysis in Figure 6—figure supplement 5A.
- https://cdn.elifesciences.org/articles/91223/elife-91223-fig6-figsupp5-data2-v1.zip
-
Figure 6—figure supplement 5—source data 3
Original file for the Southern blotting analysis in Figure 6—figure supplement 5B.
- https://cdn.elifesciences.org/articles/91223/elife-91223-fig6-figsupp5-data3-v1.zip
-
Figure 6—figure supplement 5—source data 4
Original file for the loading control of Southern blotting analysis in Figure 6—figure supplement 5B.
- https://cdn.elifesciences.org/articles/91223/elife-91223-fig6-figsupp5-data4-v1.zip
-
Figure 6—figure supplement 5—source data 5
File containing Figure 6—figure supplement 5A and B and original scans of the relevant Southern blotting analysis.
- https://cdn.elifesciences.org/articles/91223/elife-91223-fig6-figsupp5-data5-v1.zip
-
Figure 6—figure supplement 5—source data 6
File containing the original scans of the loading control of the Southern blotting analysis in Figure 6—figure supplement 5A and B.
- https://cdn.elifesciences.org/articles/91223/elife-91223-fig6-figsupp5-data6-v1.zip
Figure 6—figure supplement 6
Survivor formation in SY12XYΔ+Y tlc1Δ rad52Δ and SY12XYΔtlc1Δ rad52Δ strains.
(A) Cell viability assay in liquid culture. The growth of SY12XYΔ+Y (labeled in black), SY12XYΔ+Y tlc1Δ (two clones labeled in purple and blue, respectively), and SY12XYΔ+Y tlc1Δ rad52Δ (three clones labeled in violet, pink, and carmine, respectively) strains shown in the left panel; the survivor formation in SY12XYΔ (labeled in black), SY12XYΔtlc1Δ (two clones labeled in purple and blue, respectively), and SY12XYΔtlc1Δ rad52Δ (three clones labeled in violet, pink, and carmine, respectively) strains shown in the right panel. They were monitored every 24 hr for 12 d. (B) Telomere Southern blotting assay of SY12XYΔ+Y tlc1Δ rad52Δ (upper) and SY12XYΔtlc1Δ rad52Δ (lower) survivors obtained on solid medium. Genomic DNA from 25 independent clones (labeled on top) was digested with XhoI and hybridized to a telomere-specific TG1–3 probe. Circular survivors: in blue; uncharacterized survivors: in black. Theoretical telomere restriction fragments of each strain are indicated on the left. The asterisks indicate the non-specific bands. Genomic DNA stained with Gelred was used as a relative loading control (LC).
-
Figure 6—figure supplement 6—source data 1
File containing output results of growth analysis of the SY12XYΔ+Y tlc1Δ rad52Δ strain in Figure 6—figure supplement 6A.
- https://cdn.elifesciences.org/articles/91223/elife-91223-fig6-figsupp6-data1-v1.zip
-
Figure 6—figure supplement 6—source data 2
File containing output results of growth analysis of the SY12XYΔ tlc1Δ rad52Δ strain in Figure 6—figure supplement 6A.
- https://cdn.elifesciences.org/articles/91223/elife-91223-fig6-figsupp6-data2-v1.zip
-
Figure 6—figure supplement 6—source data 3
Original file for the Southern blotting analysis of the SY12XYΔ+Y tlc1Δ rad52Δ strain in Figure 6—figure supplement 6B.
- https://cdn.elifesciences.org/articles/91223/elife-91223-fig6-figsupp6-data3-v1.zip
-
Figure 6—figure supplement 6—source data 4
Original file for the Southern blotting analysis of the SY12XYΔ tlc1Δ rad52Δ strain in Figure 6—figure supplement 6B.
- https://cdn.elifesciences.org/articles/91223/elife-91223-fig6-figsupp6-data4-v1.zip
-
Figure 6—figure supplement 6—source data 5
Original file for the loading control of Southern blotting analysis of the SY12XYΔ+Y tlc1Δ rad52Δ strain in Figure 6—figure supplement 6B.
- https://cdn.elifesciences.org/articles/91223/elife-91223-fig6-figsupp6-data5-v1.zip
-
Figure 6—figure supplement 6—source data 6
Original file for the loading control of Southern blotting analysis the SY12XYΔ tlc1Δ rad52Δ strain in Figure 6—figure supplement 6B.
- https://cdn.elifesciences.org/articles/91223/elife-91223-fig6-figsupp6-data6-v1.zip
-
Figure 6—figure supplement 6—source data 7
File containing Figure 6—figure supplement 6B and original scans of the relevant Southern blotting analysis.
- https://cdn.elifesciences.org/articles/91223/elife-91223-fig6-figsupp6-data7-v1.zip
-
Figure 6—figure supplement 6—source data 8
File containing the original scans of the loading control of the Southern blotting analysis in Figure 6—figure supplement 6B.
- https://cdn.elifesciences.org/articles/91223/elife-91223-fig6-figsupp6-data8-v1.zip
Figure 6—figure supplement 7
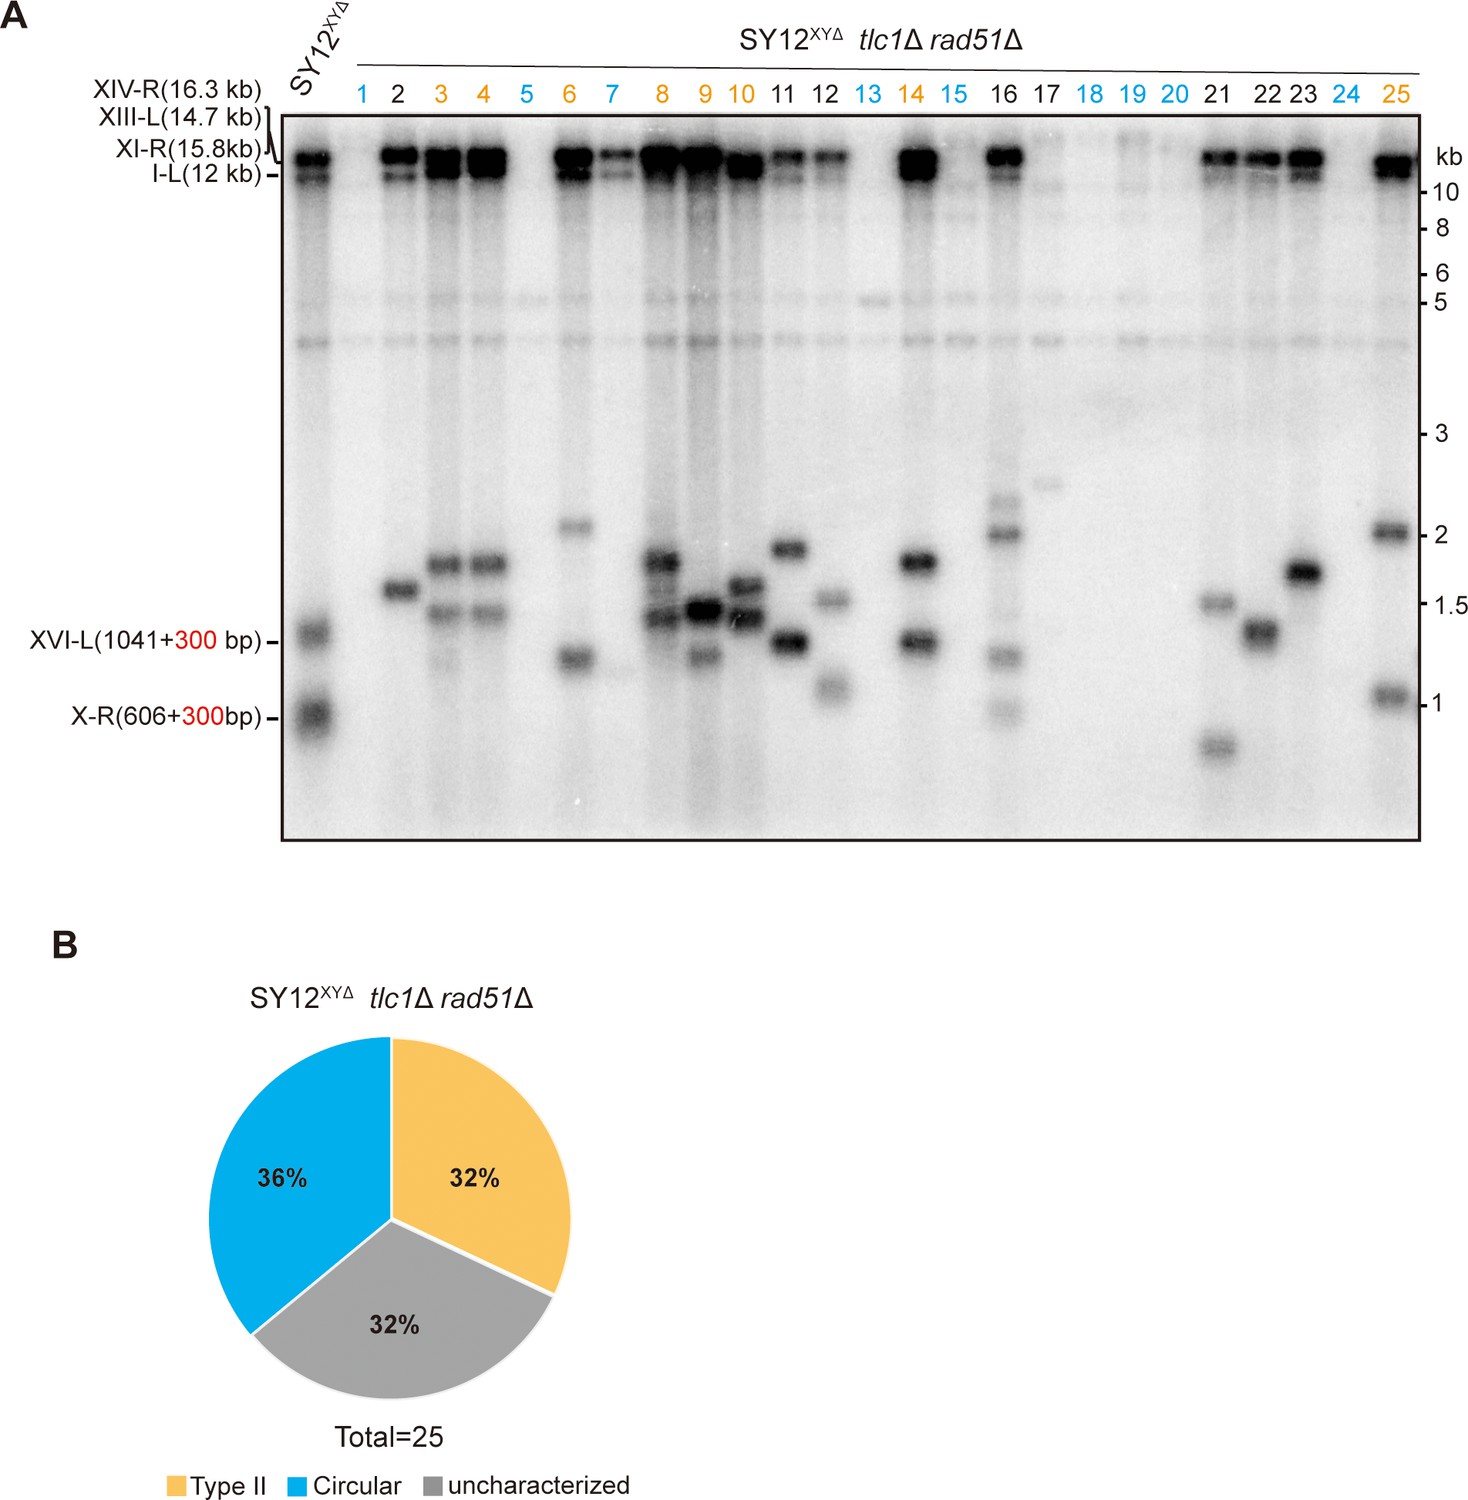
Survivor formation in SY12XYΔtlc1Δ rad51Δ strain.
(A) Southern blotting result of SY12XYΔtlc1Δ rad51Δ strain. 25 independent survivors (labeled 1–25 on top) were randomly picked, and their genomic DNAs were digested with XhoI and subjected to the Southern blotting assay with a TG1-3 probe. Type II survivors: in orange; circular survivors: in blue; uncharacterized survivors: in black. (B) The percentage of survivor types in SY12XYΔtlc1Δ rad51Δ strain. n = 25; Type II, in orange; uncharacterized survivor, in gray; circular survivor, in blue.
-
Figure 6—figure supplement 7—source data 1
Original file for the Southern blotting analysis in Figure 6—figure supplement 7A.
- https://cdn.elifesciences.org/articles/91223/elife-91223-fig6-figsupp7-data1-v1.zip
-
Figure 6—figure supplement 7—source data 2
File containing Figure 6—figure supplement 7A and original scans of the relevant Southern blotting analysis.
- https://cdn.elifesciences.org/articles/91223/elife-91223-fig6-figsupp7-data2-v1.zip
Additional files
-
Supplementary file 1
Primer used in this study.
- https://cdn.elifesciences.org/articles/91223/elife-91223-supp1-v1.docx
-
Supplementary file 2
The remaining subtelomeric elements in SY8 to SY13 strains.
- https://cdn.elifesciences.org/articles/91223/elife-91223-supp2-v1.docx
-
Supplementary file 3
Details of fusion points in the circular survivors.
- https://cdn.elifesciences.org/articles/91223/elife-91223-supp3-v1.docx
-
Supplementary file 4
Details of the creation of SY12 subtelomeric engineered strains.
- https://cdn.elifesciences.org/articles/91223/elife-91223-supp4-v1.docx
-
Supplementary file 5
Quantitation of each survivor type in SY12 subtelomeric engineered strains.
- https://cdn.elifesciences.org/articles/91223/elife-91223-supp5-v1.docx
-
Supplementary file 6
Yeast strains used in this study.
- https://cdn.elifesciences.org/articles/91223/elife-91223-supp6-v1.docx
-
MDAR checklist
- https://cdn.elifesciences.org/articles/91223/elife-91223-mdarchecklist1-v1.docx
Download links
A two-part list of links to download the article, or parts of the article, in various formats.
Downloads (link to download the article as PDF)
Open citations (links to open the citations from this article in various online reference manager services)
Cite this article (links to download the citations from this article in formats compatible with various reference manager tools)
Elimination of subtelomeric repeat sequences exerts little effect on telomere essential functions in Saccharomyces cerevisiae
eLife 12:RP91223.
https://doi.org/10.7554/eLife.91223.4


