Shh from mossy cells contributes to preventing NSC pool depletion after seizure-induced neurogenesis and in aging
- Department of Neurology, University of California, San Francisco, United States
- Santa Clara University, Biology Department, Neuroscience Program, United States
- Programs in Neuroscience and Developmental & Stem Cell Biology, Eli and Edythe Broad Center of Regeneration Medicine and Stem Cell Research, University of California San Francisco, United States
Figures
Figure 1 with 1 supplement
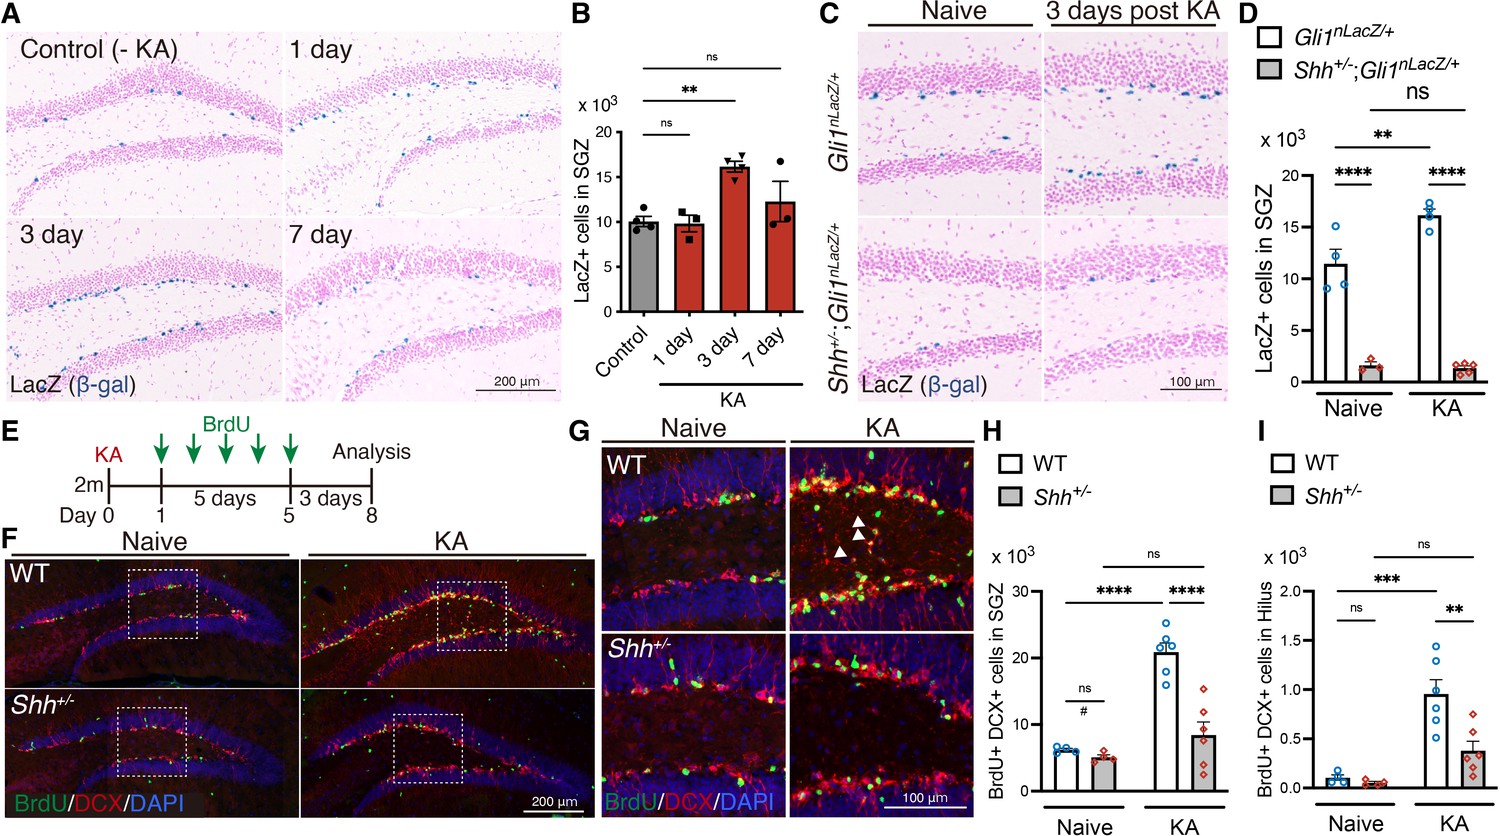
Sonic hedgehog (Shh) signaling activity is increased upon seizure induction.
(A) Representative Gli1-nLacZ staining images of the SGZ of Gli1nLacZ/+ mice 1, 3, or 7 days after kainic acid (KA)-induced seizure. Control mice did not receive KA treatment. (B) Quantification of Gli1-LacZ+ cells in SGZ. Values represent mean ± standard error of the mean (SEM); ns: p > 0.05, **p < 0.01. One-way analysis of variance (ANOVA) with Tukey’s multiple comparison test (control: n = 4, 1 day: n = 3, 3 days: n = 4, 7 days: n = 3 mice). (C) Representative Gli1-LacZ staining from SGZ of Gli1nLacZ/+ and Shh+/−;Gli1nLacZ/+mice 3 days after KA-induced seizure. (D) Quantification of Gli1-nLacZ+ cells in SGZ without (Naive) and with seizure induction (KA). Values represent mean ± SEM; ns: p > 0.05, **p < 0.01, ****p < 0.0001. Two-way ANOVA with Tukey’s multiple comparison test (naive: Gli1nLacZ/+ n = 4, Shh+/−;Gli1nLacZ/+ n = 3, KA: Gli1nLacZ/+ n = 4, Shh+/−;Gli1nLacZ/+ n = 5 mice). (E) Experimental scheme of analyzing neurogenesis by 5-bromo-2′-deoxyuridine (BrdU) pulse labeling. Seizures were induced in 2-month-old (2 m) mice by KA injection. One day after KA-induced seizures, the mice received BrdU for 5 days and then were analyzed 3 days after the last BrdU injection. (F) Representative immunofluorescence images of newborn neurons labeled with BrdU (green), DCX(doublecortin) (red), and 4′,6-diamidino-2-phenylindole, dihydrochloride (DAPI; blue) in the SGZ of wild-type (WT) and Shh+/− mice after seizure induction. (G) Higher magnification images from inset of panel (F), representing ectopic neurons in the hilus, which are indicated by white arrowheads. Quantification of newborn neurons (H) and ectopic neurons (I) produced after seizure induction in the SGZ of WT and Shh+/− mice. Values represent mean ± SEM; ns: p > 0.05, **p < 0.01, ***p < 0.001, ****p < 0.0001. Two-way ANOVA with Tukey’s multiple comparison test (naive: WT n = 4, Shh+/− n = 4, KA: WT n = 6, Shh+/− n = 6 mice). #p < 0.05. Unpaired t-test (two-tailed) in two groups (WT vs Shh+/− in naive condition). There was reduction of DCX+ BrdU+ cells between WT vs Shh+/− in naive condition.
-
Figure 1—source data 1
Raw data for counts.
- https://cdn.elifesciences.org/articles/91263/elife-91263-fig1-data1-v1.xlsx
Figure 1—figure supplement 1
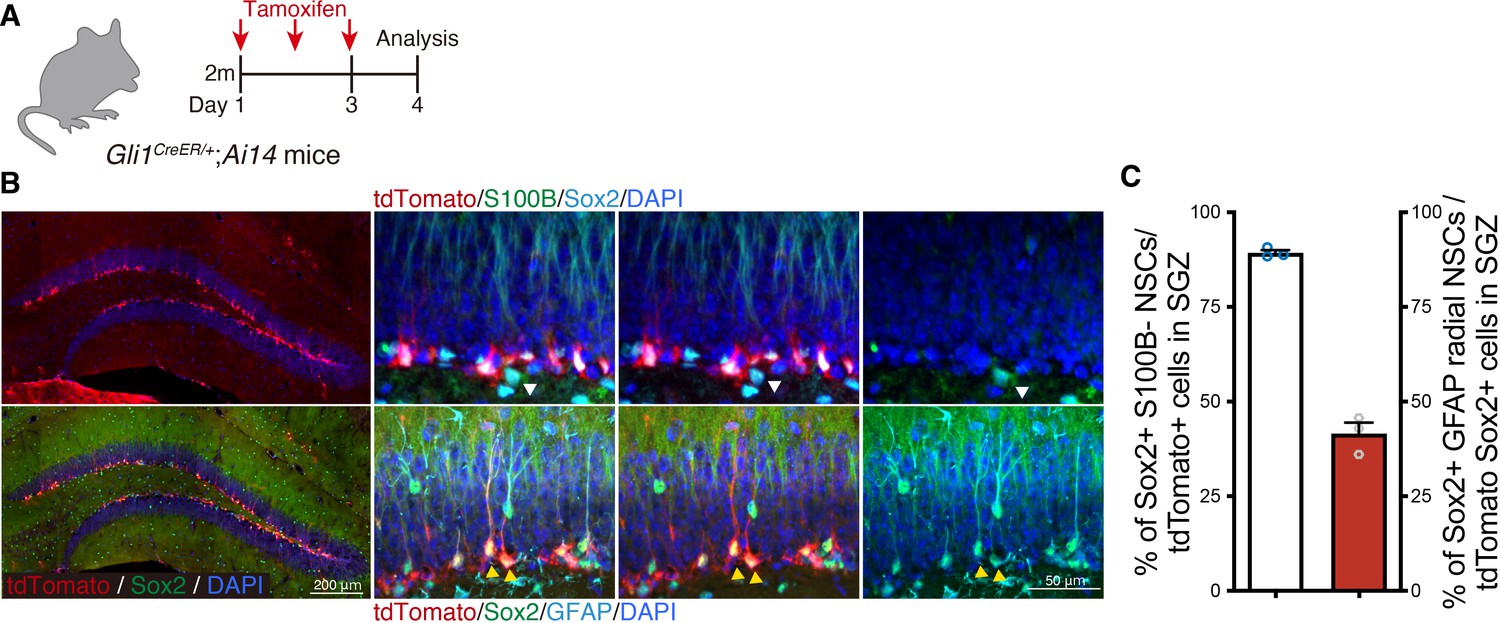
Sonic hedgehog (Shh)-responding cells in the SGZ are neural stem cells (NSCs).
(A) Experimental scheme of tamoxifen injection to label Gli1 expressing cells in Gli1CreER/+;RosaAI14 mice. (B) Representative immunofluorescence images of Gli1 expressing cells labeled with tdTomato (red) in the dentate gyrus (DG) 1 day after a 3-day tamoxifen treatment. NSCs are defined as stem cell marker Sox2+ (cyan)-positive and astrocyte marker S100B (green)-negative cells in upper panels (white arrowhead). Radial NSCs are labeled with Sox2 (green) and defined by radial fiber stained with GFAP (cyan) in bottom panels (yellow arrowheads). (C) Quantification of Sox2+ S100B− NSCs in tdTomato+ cells and Sox2+ GFAP+ radial NSCs in tdTomato+ Sox2+ cells (n = 3 mice). Values represent mean ± standard error of the mean (SEM).
-
Figure 1—figure supplement 1—source data 1
Raw data for counts.
- https://cdn.elifesciences.org/articles/91263/elife-91263-fig1-figsupp1-data1-v1.xlsx
Figure 2 with 1 supplement
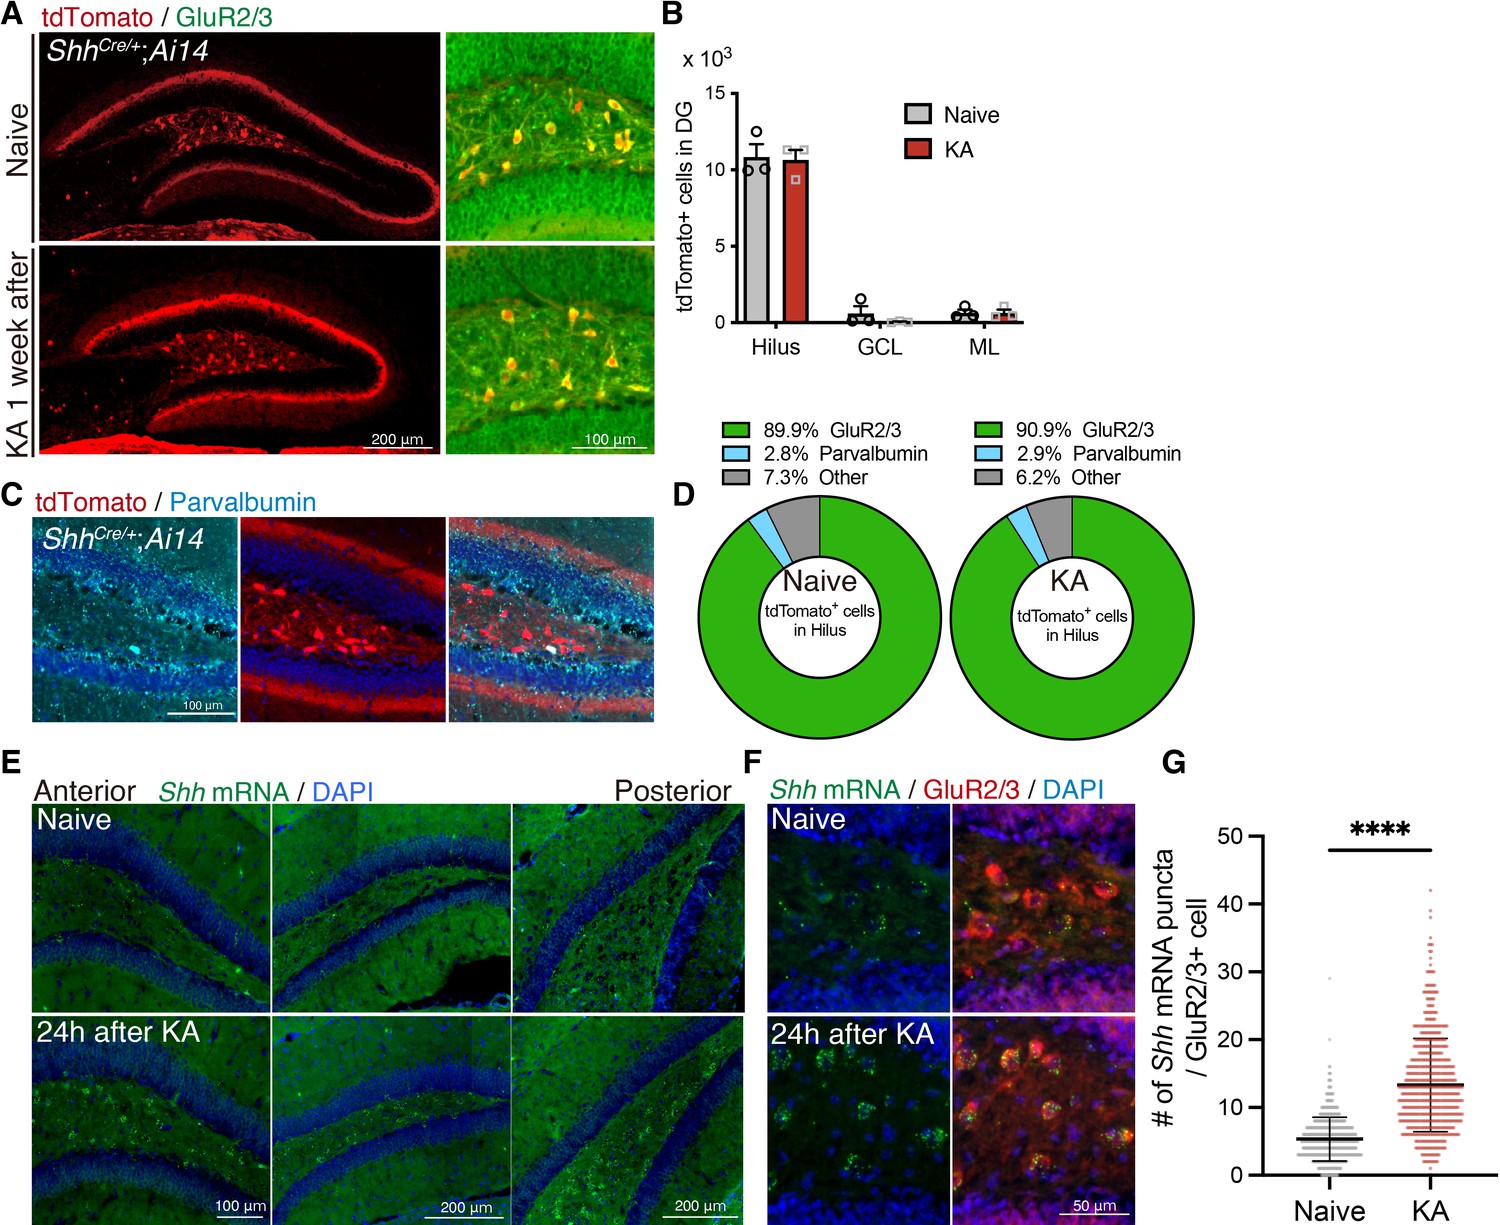
Sonic hedgehog (Shh) is expressed in mossy cells and upregulated upon seizure induction.
(A) Representative immunofluorescence images of mossy cells labeled with GluR2/3 (green) and ShhCre/+;RosaAI14 (tdTomato; red) 1 week after seizure induction. (B) Quantification of tdTomato+ cells in each area of the dentate gyrus (DG). GCL: granule cell layer, ML: molecular layer (naive: n = 3, kainic acid [KA]: n = 3 mice). (C) Representative immunofluorescence images of interneurons labeled with parvalbumin (cyan) and ShhCre/+;RosaAI14 (tdTomato; red) in the hilus. (D) Cell-type population of tdTomato+ cells in the hilus of ShhCre/+;RosaAI14 mice 1 week after seizure induction (naive: n = 3, KA: n = 3 mice). (E) In situ RNAscope detection of Shh mRNA (green) in the DG from anterior to posterior 24 hr after seizure induction. (F) Representative RNAscope-immunofluorescence images for Shh expression in mossy cells labeled with GluR2/3 (red). (G) Quantification of Shh mRNA puncta in GluR2/3+ mossy cells. Values represent mean ± standard error of the mean (SEM); ****p < 0.0001. Unpaired t-test (two-tailed). A total of 608 and 584 GluR2/3+ cells were quantified from three mice in naive and KA treated groups, respectively.
-
Figure 2—source data 1
Raw data for counts.
- https://cdn.elifesciences.org/articles/91263/elife-91263-fig2-data1-v1.xlsx
Figure 2—figure supplement 1
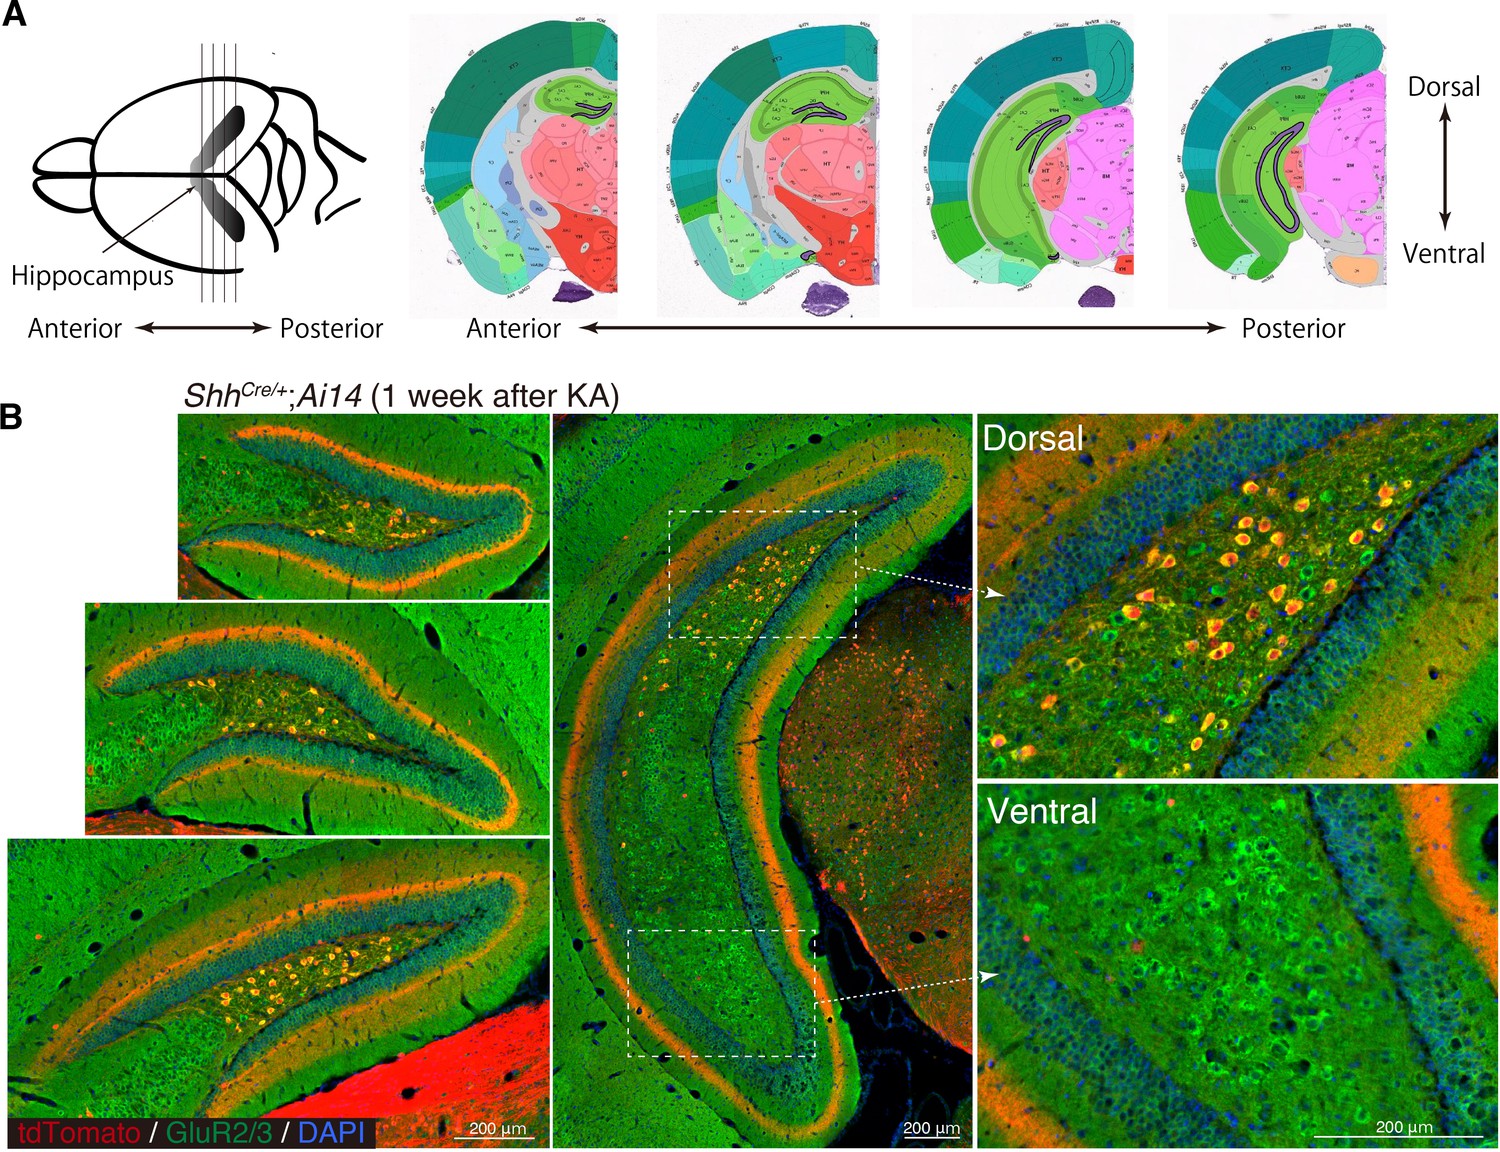
Shh is expressed in dorsal mossy cells.
(A) Schematic illustration of coronal sections of hippocampus (reference images of the coronal mouse brain from Allen Brain Atlas). (B) Representative immunofluorescence images of dentate gyrus (DG) from ShhCre/+;RosaAI14 mice 1 week after seizure induction. Higher magnification of inset panels from dorsal and ventral regions of posterior DG. GluR2/3+ (green) mossy cells in dorsal but not ventral DG were labeled with ShhCre/+;RosaAI14 (red).
Figure 3 with 1 supplement
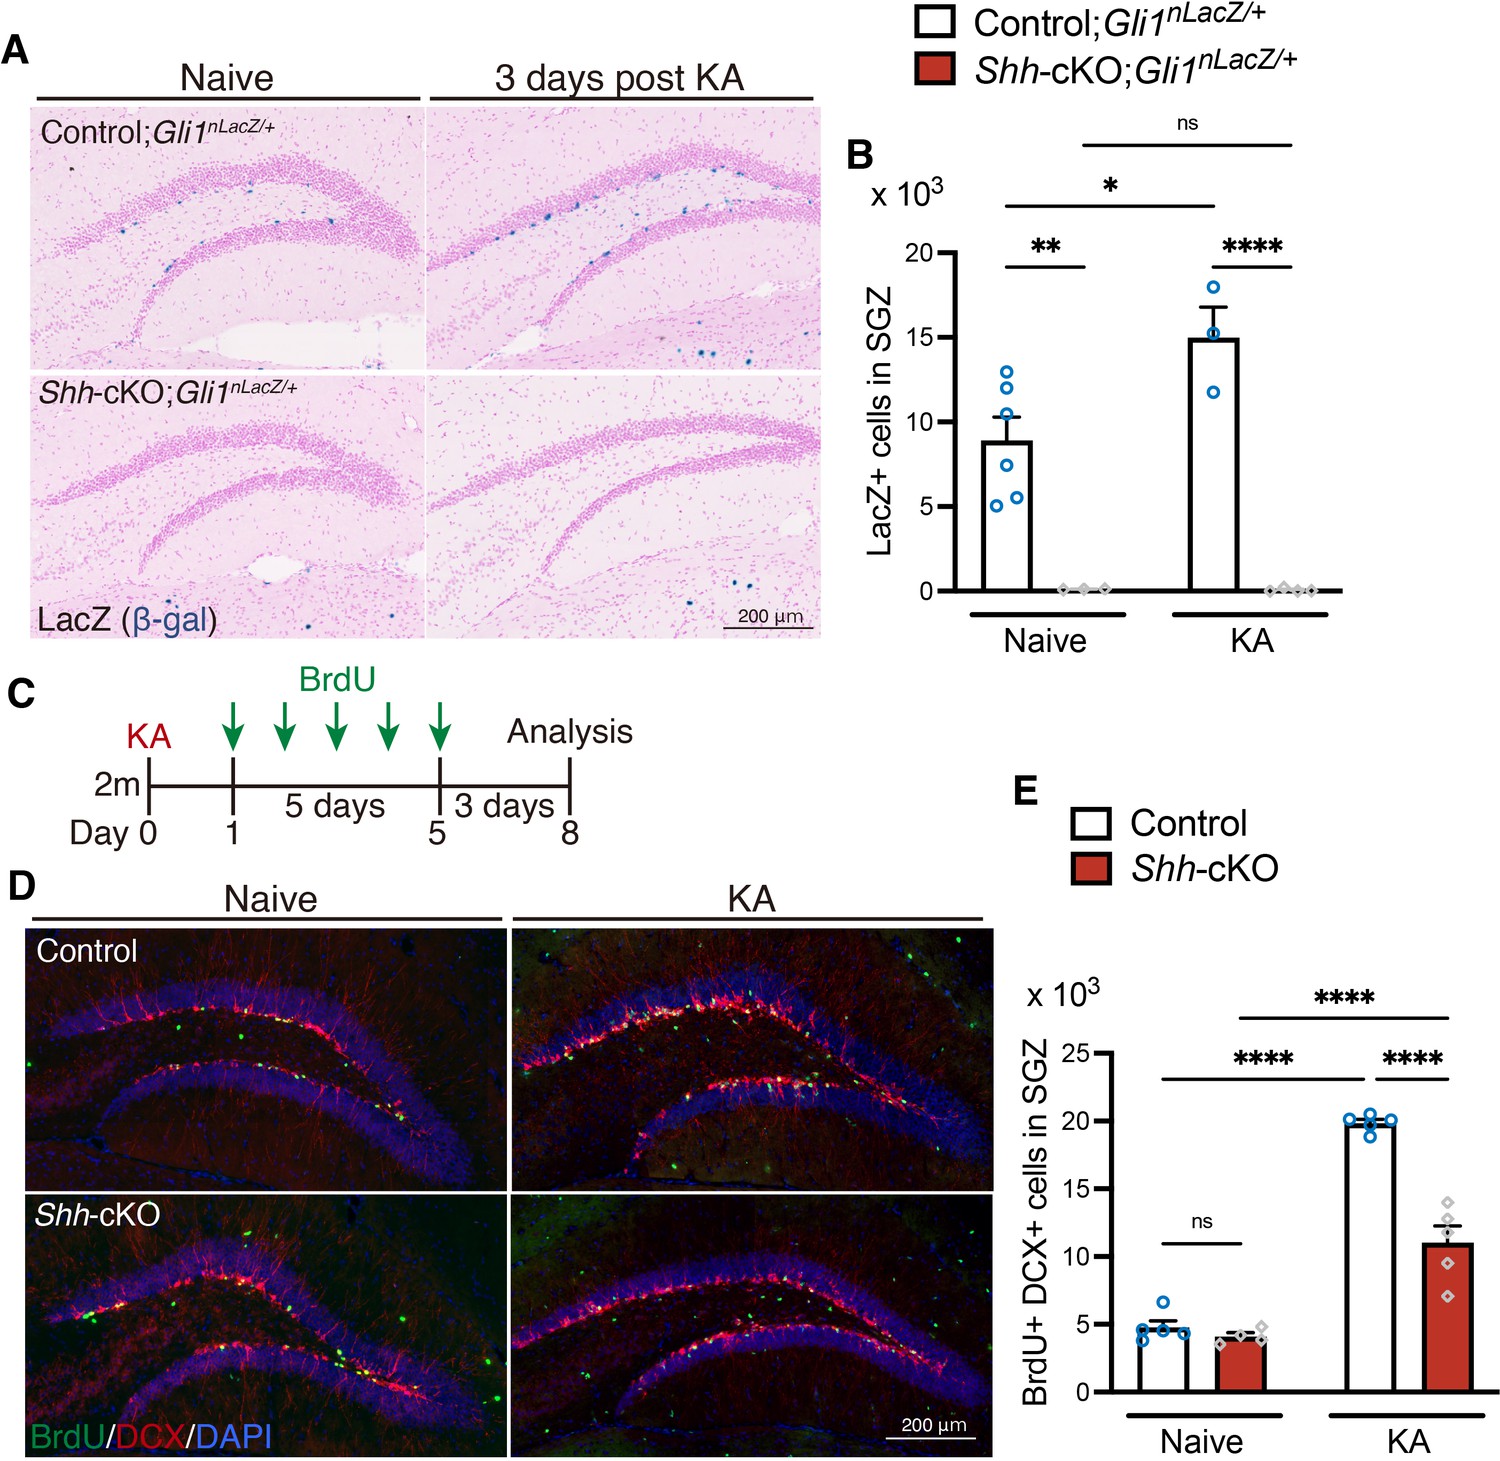
Deletion of Sonic hedgehog (Shh) in mossy cells decreases Shh signaling activation and attenuates seizure-induced neurogenesis.
(A) Representative Gli1-LacZ staining images of the dentate gyrus (DG) of control (Crlr-Cre;Shh+/+ and Shh+/+, Shh fl/+ and Shh fl/fl without Cre), and Crlr-Cre;Shhfl/fl (Shh-cKO);Gli1nlacZ/+ mice 3 days after kainic acid (KA)-induced seizure. (B) Quantification of Gli1-nLacZ+ cells in SGZ. Values represent mean ± standard error of the mean (SEM); ns: p > 0.05, *p < 0.05, **p < 0.01, ****p < 0.0001. Two-way analysis of variance (ANOVA) with Tukey’s multiple comparison test (naive: control;Gli1nlacZ/+ n = 6, Shh-cKO; Gli1nlacZ/+ n = 3, KA: control;Gli1nlacZ/+ n = 3, Shh-cKO; Gli1nlacZ/+ n = 4 mice). (C) Experimental scheme of analyzing neurogenesis by 5-bromo-2′-deoxyuridine (BrdU) pulse labeling. One day after KA-induced seizures, control and Shh-cKO mice were injected with BrdU for 5 days and analyzed 3 days after the last BrdU injection. (D) Representative immunofluorescence images for newborn neurons labeled with BrdU (green), DCX (red), and 4′,6-diamidino-2-phenylindole, dihydrochloride (DAPI; blue) in the SGZ of control and Shh-cKO mice after seizure induction (KA). (E) Quantification of newborn neurons after seizure induction in the SGZ of control and Shh-cKO mice. Values represent mean ± SEM; ns: p > 0.05, ****p < 0.0001. Two-way ANOVA with Tukey’s multiple comparison test (naive: control n = 5, Shh-cKO n = 4, KA: control n = 5, Shh-cKO n = 5 mice).
-
Figure 3—source data 1
Raw data for counts.
- https://cdn.elifesciences.org/articles/91263/elife-91263-fig3-data1-v1.xlsx
Figure 3—figure supplement 1
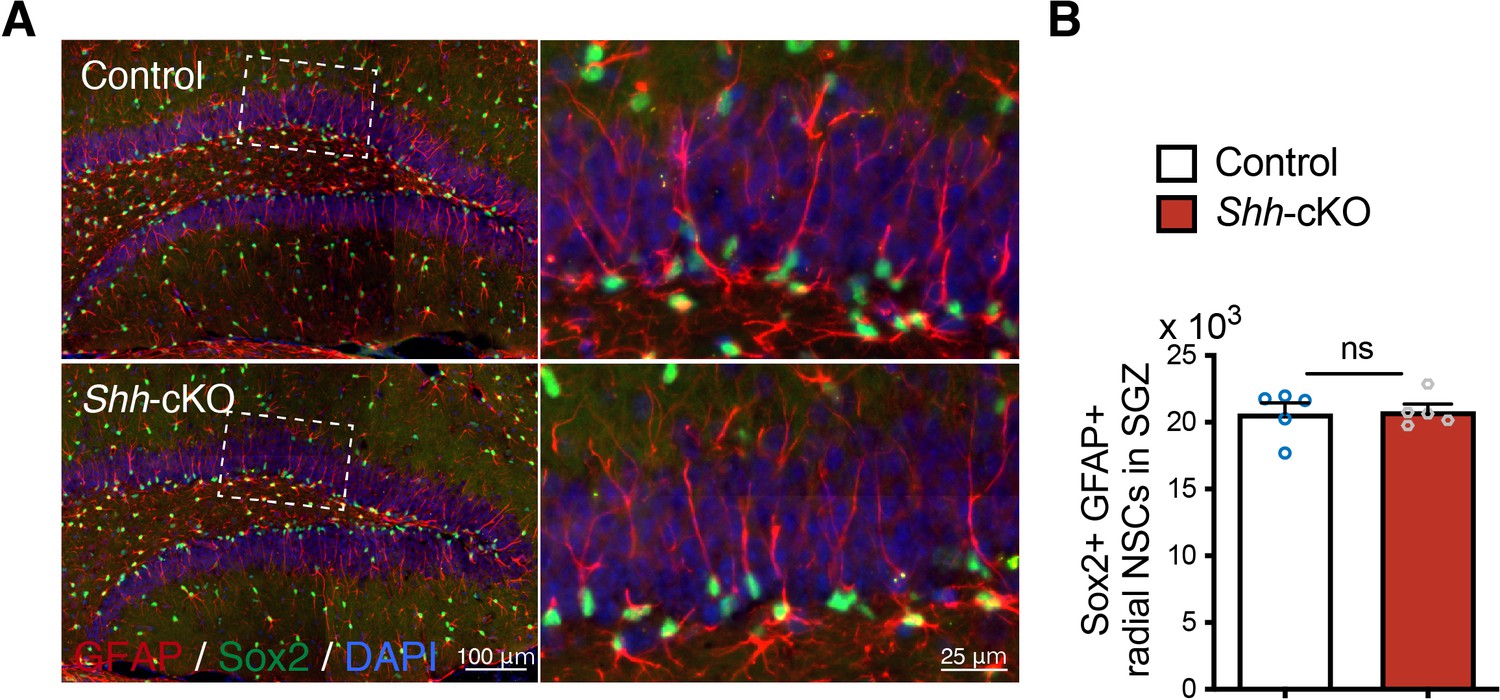
Deletion of Shh from mossy cells does not change neural stem cell (NSC) number.
(A) Representative immunofluorescence images of Sox2+ (green) GFAP+ (red) radial NSCs in the SGZ of dentate gyrus (DG) in control and Shh-cKO mice. Higher magnification of inset panels representing radial NSCs labeled with Sox2 and GFAP. (B) Quantification of Sox2+ GFAP+ radial NSCs in the SGZ. Values represent mean ± standard error of the mean (SEM); ns: p > 0.05. Unpaired t-test (two-tailed, control n = 5, Shh-cKO n = 5 mice).
-
Figure 3—figure supplement 1—source data 1
Raw data for counts.
- https://cdn.elifesciences.org/articles/91263/elife-91263-fig3-figsupp1-data1-v1.xlsx
Figure 4 with 3 supplements
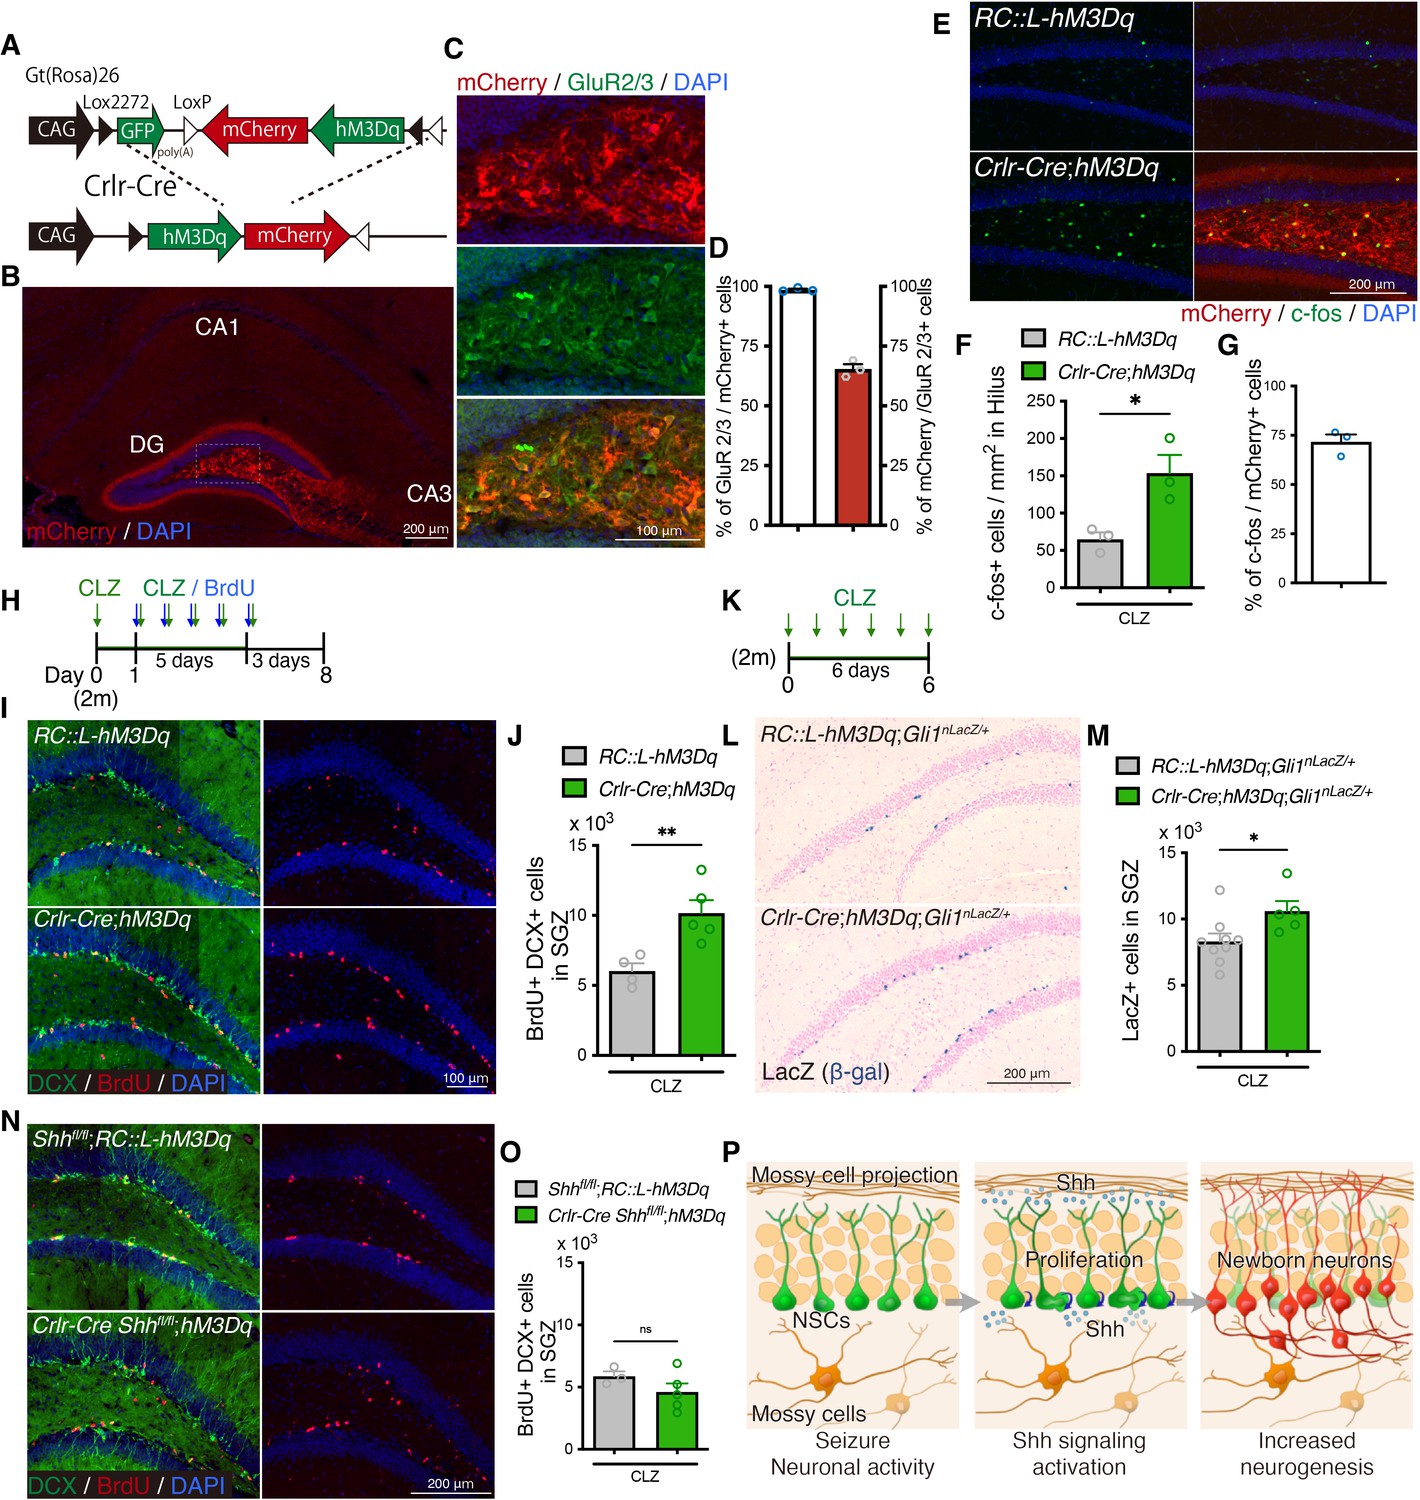
Mossy cell neuronal activity induces neurogenesis though Sonic hedgehog (Shh).
(A) Schematic of conditional expression of Designer Receptors Exclusively Activated by Designer Drugs (DREADD) activator in mossy cells. Representative immunofluorescence images of DREADD activator hM3Dq/mCherry (red) expressing cells in the hippocampus (B) and in GluR2/3+ (green) mossy cells of dentate hilus (C). (D) Quantification of recombination specificity (% of GluR2/3+ mossy cells in mCherry+ recombined cells) and rate (% of mCherry+ recombined cells in GluR2/3+ mossy cells) in GluR2/3+ mossy cells (n = 3 mice). Values represent mean ± standard error of the mean (SEM). (E) Representative immunofluorescence images of neuronal activation (c-fos, green) in the hilus of RosaDIO-hM3Dq and Crlr-Cre;RosaDIO-hM3Dq mice at 1.5 hr after CLZ injection. hM3Dq expressing recombined cells are labeled with mCherry (red). (F) Quantification of c-fos+ cells in the hilus of RosaDIO-hM3Dq and Crlr-Cre;RosaDIO-hM3Dq mice 1.5 hr after CLZ injection. Values represent mean ± SEM; *p < 0.05. Unpaired t-test (two-tailed, RosaDIO-hM3Dq: n = 3, Crlr-Cre;RosaDIO-hM3Dq: n = 3 mice). (G) Induction rate of neuronal activation in the hM3Dq expressing recombined cells (% of c-fos+ cells in mCherry+ cells in the hilus, n = 3 mice). Values represent mean ± SEM. (H) Experimental scheme of analyzing neurogenesis by 5-bromo-2′-deoxyuridine (BrdU) pulse labeling during DREADD activation. CLZ was administered to 2-month-old (2 m) mice for 6 days. Starting on the second day of CLZ administration, mice concomitantly received BrdU for 5 days and were analyzed 3 days after the last BrdU injection. (I) Representative immunofluorescence images for DCX+ (green) BrdU+ (red) newborn neurons produced after DREADD-induced neuronal activation of mossy cells in the SGZ of RosaDIO-hM3Dq and Crlr-Cre;RosaDIO-hM3Dq mice. (J) Quantification of newborn neurons in the SGZ. Values represent mean ± SEM; **p < 0.01. Unpaired t-test (two-tailed, RosaDIO-hM3Dq: n = 4, Crlr-Cre;RosaDIO-hM3Dq: n = 5 mice). (K) Experimental scheme of analyzing Shh signaling activation after induction of mossy cell neuronal activity. (L) Representative Gli1-nLacZ staining images of the dentate gyrus (DG) of RosaDIO-hM3Dq and Crlr-Cre;RosaDIO-hM3Dq mice after CLZ administration for 6 days. (M) Quantification of Gli1-nLacZ+ cells in SGZ. Values represent mean ± SEM; *p < 0.05. Unpaired t-test (two-tailed, RosaDIO-hM3Dq;Gli1nLacZ/+: n = 9, Crlr-Cre;RosaDIO-hM3Dq;Gli1nLacZ/+: n = 5 mice). (N) Representative immunofluorescence images for newborn neurons produced after DREADD-induced neuronal activation of mossy cells in the SGZ of Shhfl/fl;RosaDIO-hM3Dq and Crlr-Cre;Shhfl/fl;RosaDIO-hM3Dq mice, which are labeled with DCX (green), BrdU (red), and 4′,6-diamidino-2-phenylindole, dihydrochloride (DAPI; blue). (O) Quantification of newborn neurons in the SGZ of Shhfl/fl RosaDIO-hM3Dq and Crlr-Cre;Shhfl/fl;RosaDIO-hM3Dq mice after DREADD-induced neuronal activation of mossy cells. Values represent mean ± SEM; ns: P>0.05. Unpaired t-test (two-tailed, Shhfl/fl;RosaDIO-hM3Dq: n = 3, Crlr-Cre Shhfl/fl;RosaDIO-hM3Dq: n = 5 mice). (P) Our proposed model of mossy cell-mediated neurogenesis after seizures. Shh expression in mossy cells are upregulated by seizure activity. Neuronal activity of mossy cells activates Shh signaling in neural stem cells (NSCs) and contributes to the seizure-induced neurogenesis.
-
Figure 4—source data 1
Raw data for counts.
- https://cdn.elifesciences.org/articles/91263/elife-91263-fig4-data1-v1.xlsx
Figure 4—figure supplement 1
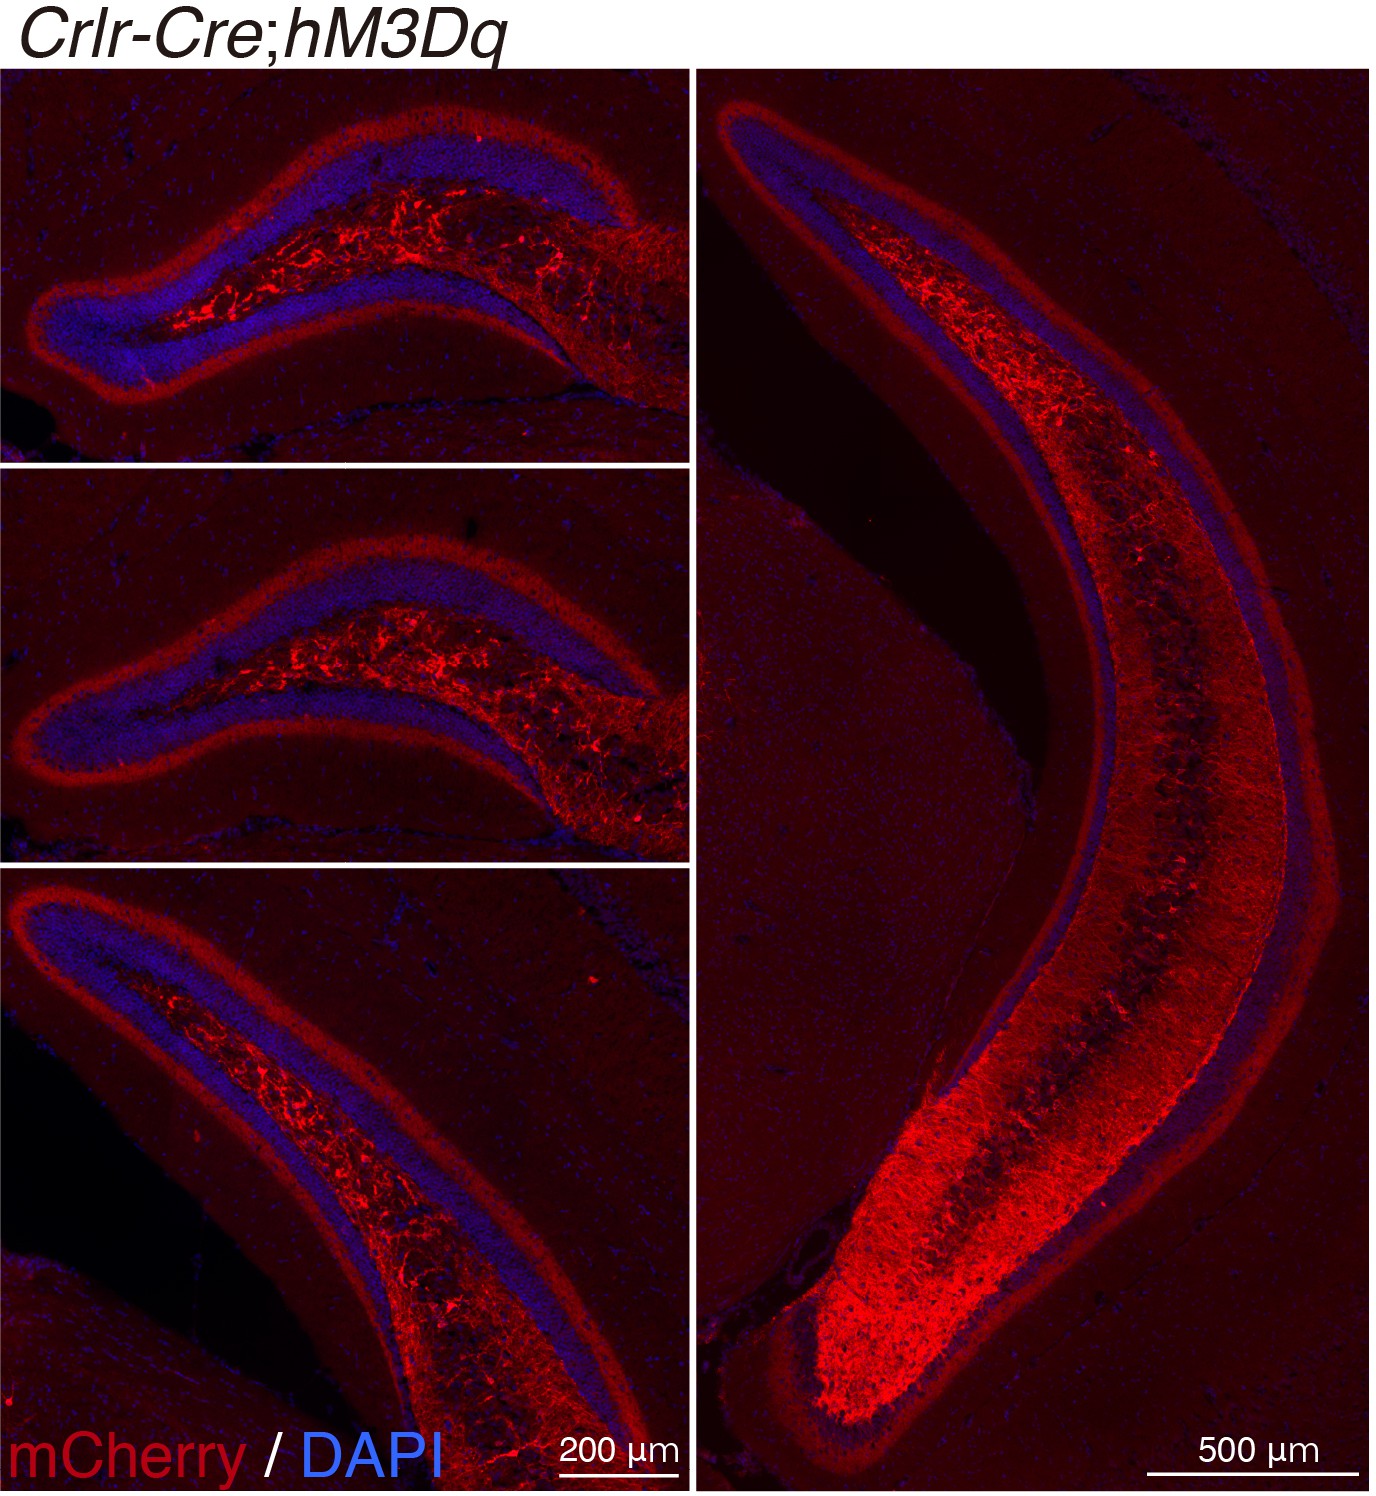
Crlr-Cre-mediated recombination in the dentate gyrus (DG).
Representative immunofluorescence images of Crlr-Cre recombination in cells labeled with mCherry (red) in the anterior to posterior DG of Crlr-Cre;hM3Dq mice.
Figure 4—figure supplement 2
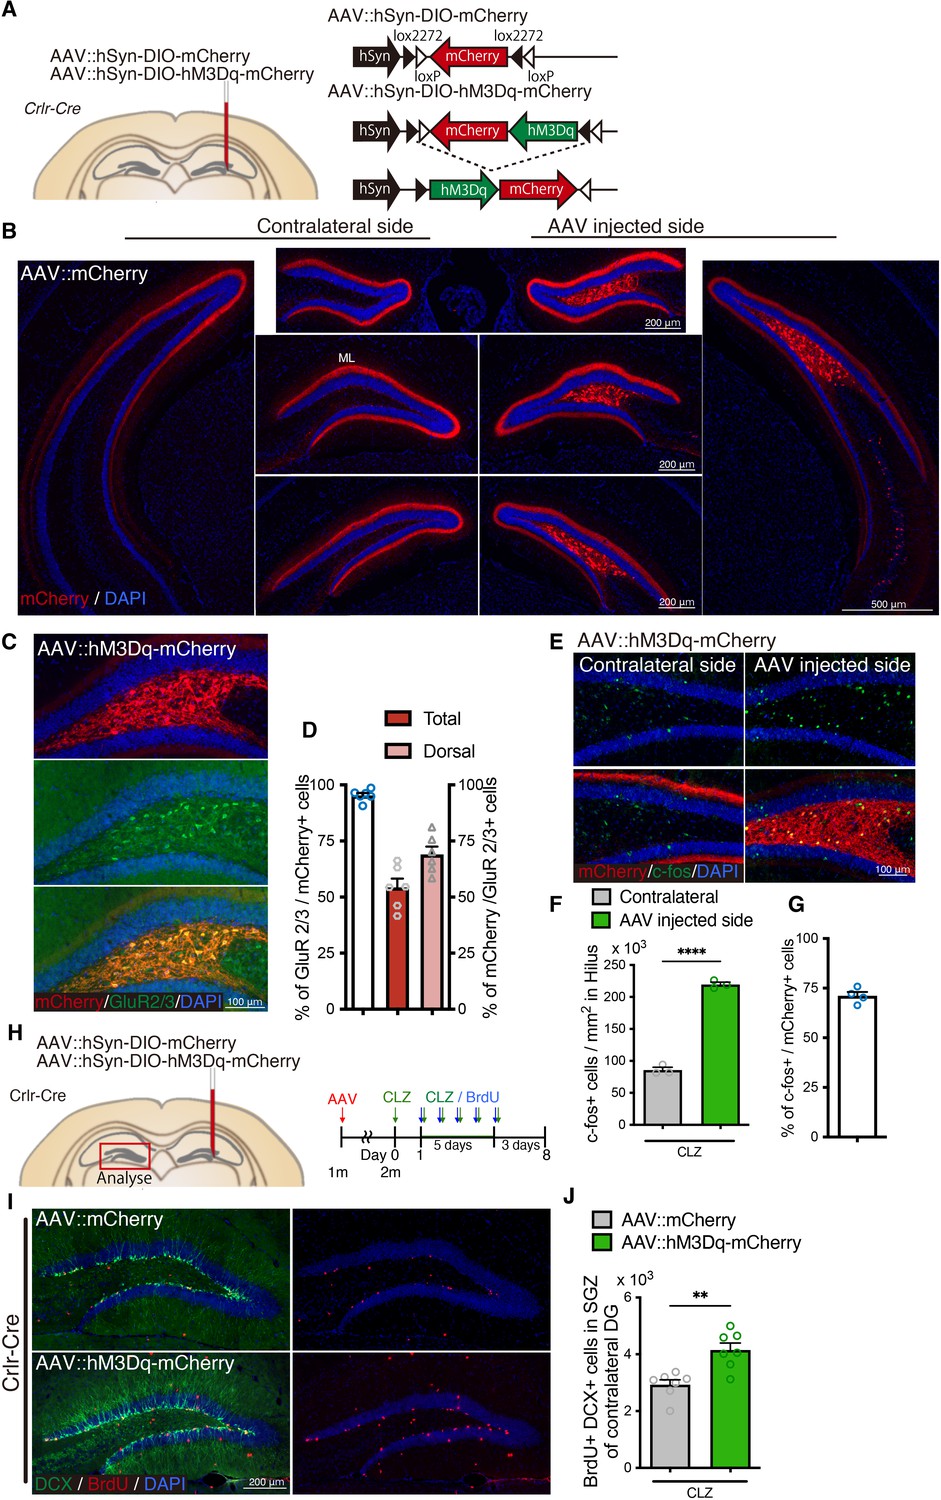
Neuronal activity of mossy cells induces neurogenesis in the contralateral dentate gyrus (DG).
(A) Schematic of adeno-associated virus (AAV) injection into the dorsal DG of Crlr-Cre mice. Either AAV::hSyn-DIO-mCherry (AAV::mCherry, as control) or AAV::hSyn-DIO-hM3Dq-mCherry (AAV::hM3Dq-mCherry) was injected into the dorsal DG of Crlr-Cre mice. (B) Representative immunofluorescence images of AAV::mCherry infection (red) in the DG of Crlr-Cre mice ipsilateral and contralateral to the AAV injection site. Projections of mossy cells were observed in the molecular layer (ML) in the contralateral DG. (C) Representative immunofluorescence images of AAV::hM3Dq-mCherry infection (red) in GluR2/3+ mossy cells (green) in the AAV-injected DG of Crlr-Cre mice. (D) Quantification of AAV::hM3Dq-mCherry infection specificity (% of GluR2/3+ mossy cells in mCherry+ infected cells) and fraction (% of mCherry+ infected cells in GluR2/3+ mossy cells) in GluR2/3+ mossy cells in the AAV-injected side of the entire (total) and dorsal DG of Crlr-Cre mice (n = 6 mice). Values represent mean ± standard error of the mean (SEM). (E) Representative immunofluorescence images of neuronal activation in the hilus of AAV::hM3Dq-mCherry-injected Crlr-Cre mice 1.5 hr after CLZ injection. (F) Quantification of c-fos+ cells in the hilus of AAV::hM3Dq-mCherry-injected Crlr-Cre mice 1.5 hr after CLZ injection. Values represent mean ± SEM; ****p < 0.0001. Unpaired t-test (two-tailed, n = 3 mice per group). (G) Induction rate of neuronal activation in the hM3Dq expressing infected cells (% of c-fos+ cells in mCherry+ cells in the hilus) in the DG ipsilateral to AAV injections in AAV::hM3Dq-mCherry-injected Crlr-Cre mice (n = 4 mice). Values represent mean ± SEM. (H) Experimental scheme for AAV injection and analysis of neurogenesis by 5-bromo-2′-deoxyuridine (BrdU) pulse labeling in Designer Receptors Exclusively Activated by Designer Drugs (DREADD)-mediated neuronal activation. AAV was injected into 1-month-old Crlr-Cre mice. After 3–4 weeks recovery, mice were administered with CLZ for 6 days. Starting on the second day of CLZ administration, mice concomitantly received BrdU for 5 days and were analyzed 3 days after last BrdU injection, neurogenesis in the contralateral DG was analyzed. (I) Representative immunofluorescence images for DCX+ (green) BrdU+ (red) newborn neurons produced after DREADD-induced neuronal activation of mossy cells in the SGZ of the contralateral DG. (J) Quantification of newborn neurons in the SGZ of contralateral DG in AAV-injected Crlr-Cre mice. Values represent mean ± SEM; **p < 0.01. Unpaired t-test (two-tailed, n = 7 mice per group).
-
Figure 4—figure supplement 2—source data 1
Raw data for counts.
- https://cdn.elifesciences.org/articles/91263/elife-91263-fig4-figsupp2-data1-v1.xlsx
Figure 4—figure supplement 3
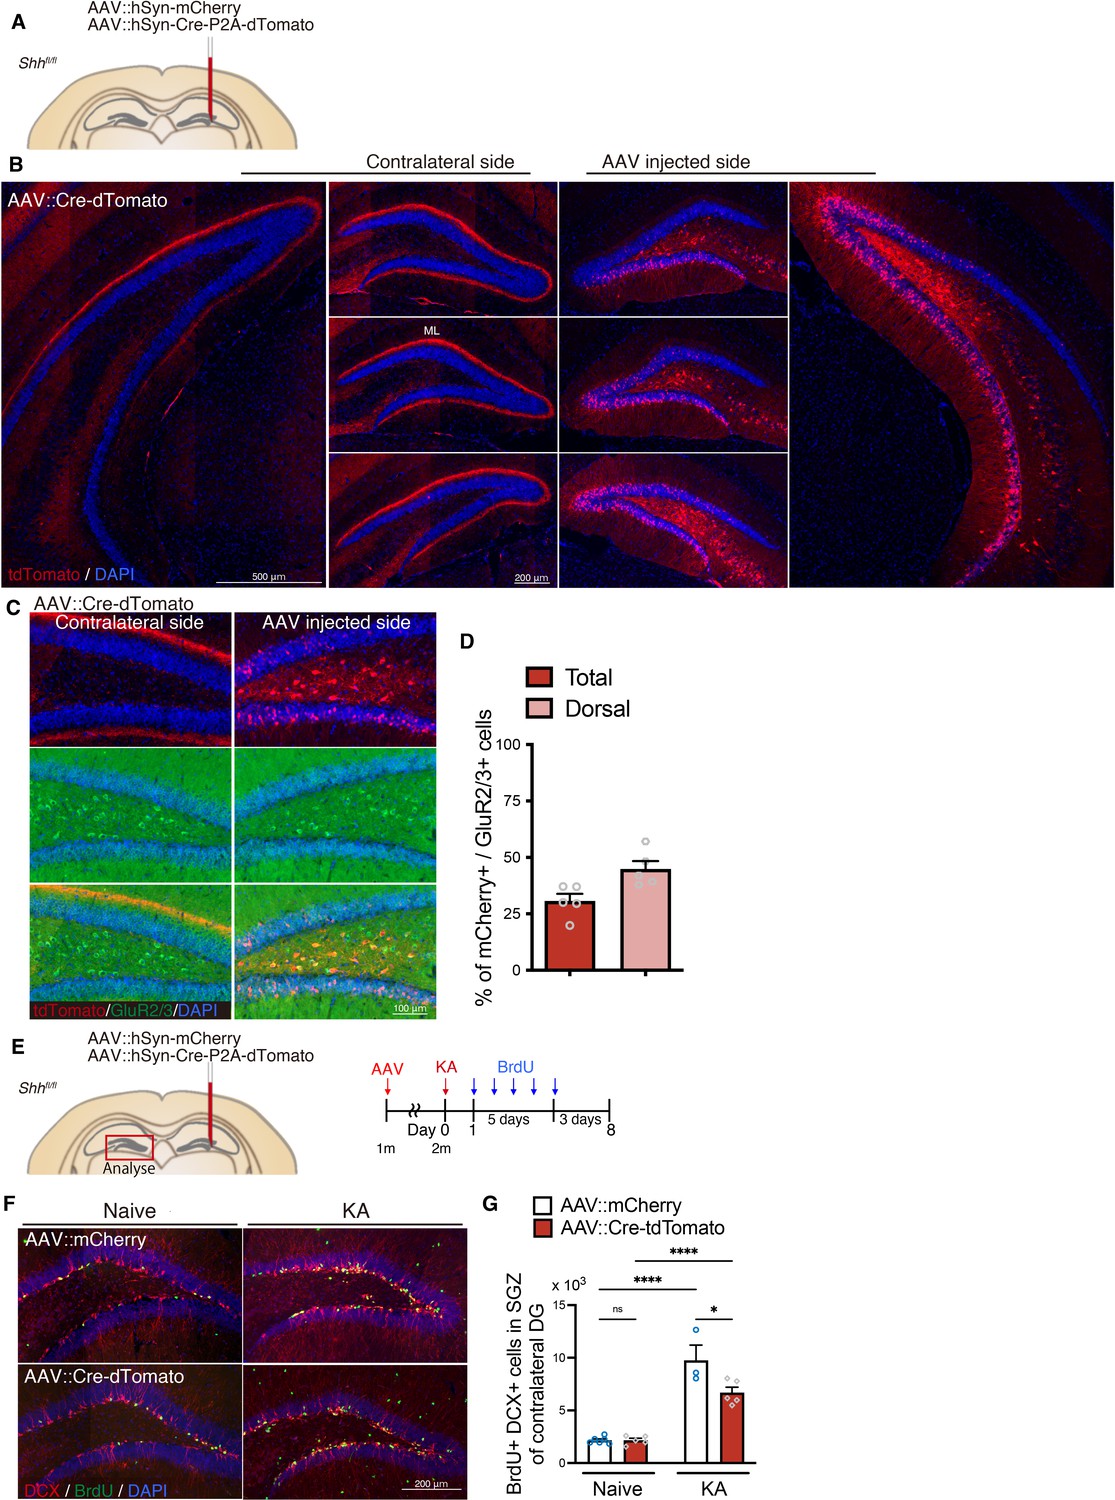
Deletion of Shh attenuates seizure-induced neurogenesis in the contralateral dentate gyrus (DG).
(A) Schematic of adeno-associated virus (AAV) injection into the dorsal DG of Crlr-Cre mice. Either AAV::hSyn-mCherry (AAV::mCherry, as control) or AAV::hSyn-Cre-P2A-tdTomato (AAV::Cre-tdTomato) was injected into the dorsal DG of Shhfl/fl mice. (B) Representative immunofluorescence images of AAV::Cre-tdTomato infection (red) in the AAV-injected side and contralateral DG. AAV infection was observed in the hilus of dorsal DG. Contralateral projection of mossy cells was observed in the molecular layer (ML) of contralateral DG. (C) Representative immunofluorescence images of GluR2/3+ (green) mossy cells infected with AAV::Cre-tdTomato (red) in the AAV-injected side and contralateral DG. (D) Quantification of infection in GluR2/3+ mossy cells (% of mCherry+ infected cells in GluR2/3+ mossy cells) in the entire (total) and dorsal DG of AAV-injected side (n = 5 mice). Values represent mean ± standard error of the mean (SEM). (E) Experimental scheme of AAV injection and analyzing neurogenesis by 5-bromo-2′-deoxyuridine (BrdU) pulse labeling after seizure induction by kainic acid (KA). AAV was injected into 1-month-old Shhfl/fl mice. After 3–4 weeks recovery, seizure was induced by KA administration. One day after seizure induction, mice were given BrdU for 5 days and analyzed 3 days after last BrdU injection. Neurogenesis in the contralateral DG was analyzed. (F) Representative immunofluorescence images for DCX+ (red) BrdU+ (green) newborn neurons produced after seizure in the SGZ of the contralateral DG in AAV-injected Shhfl/fl mice. (G) Quantification of newborn neurons in the SGZ of the contralateral DG in AAV-injected Shhfl/fl mice. Values represent mean ± SEM; ns: p > 0.05, *p < 0.05, ****p < 0.0001. Two-way analysis of variance (ANOVA) with Tukey’s multiple comparison test (naive: AAV::mCherry n = 6, AAV::Cre-tdTomato n = 5, KA: AAV::mCherry n = 3, AAV::Cre-tdTomato n = 5 mice).
-
Figure 4—figure supplement 3—source data 1
Raw data for counts.
- https://cdn.elifesciences.org/articles/91263/elife-91263-fig4-figsupp3-data1-v1.xlsx
Figure 5
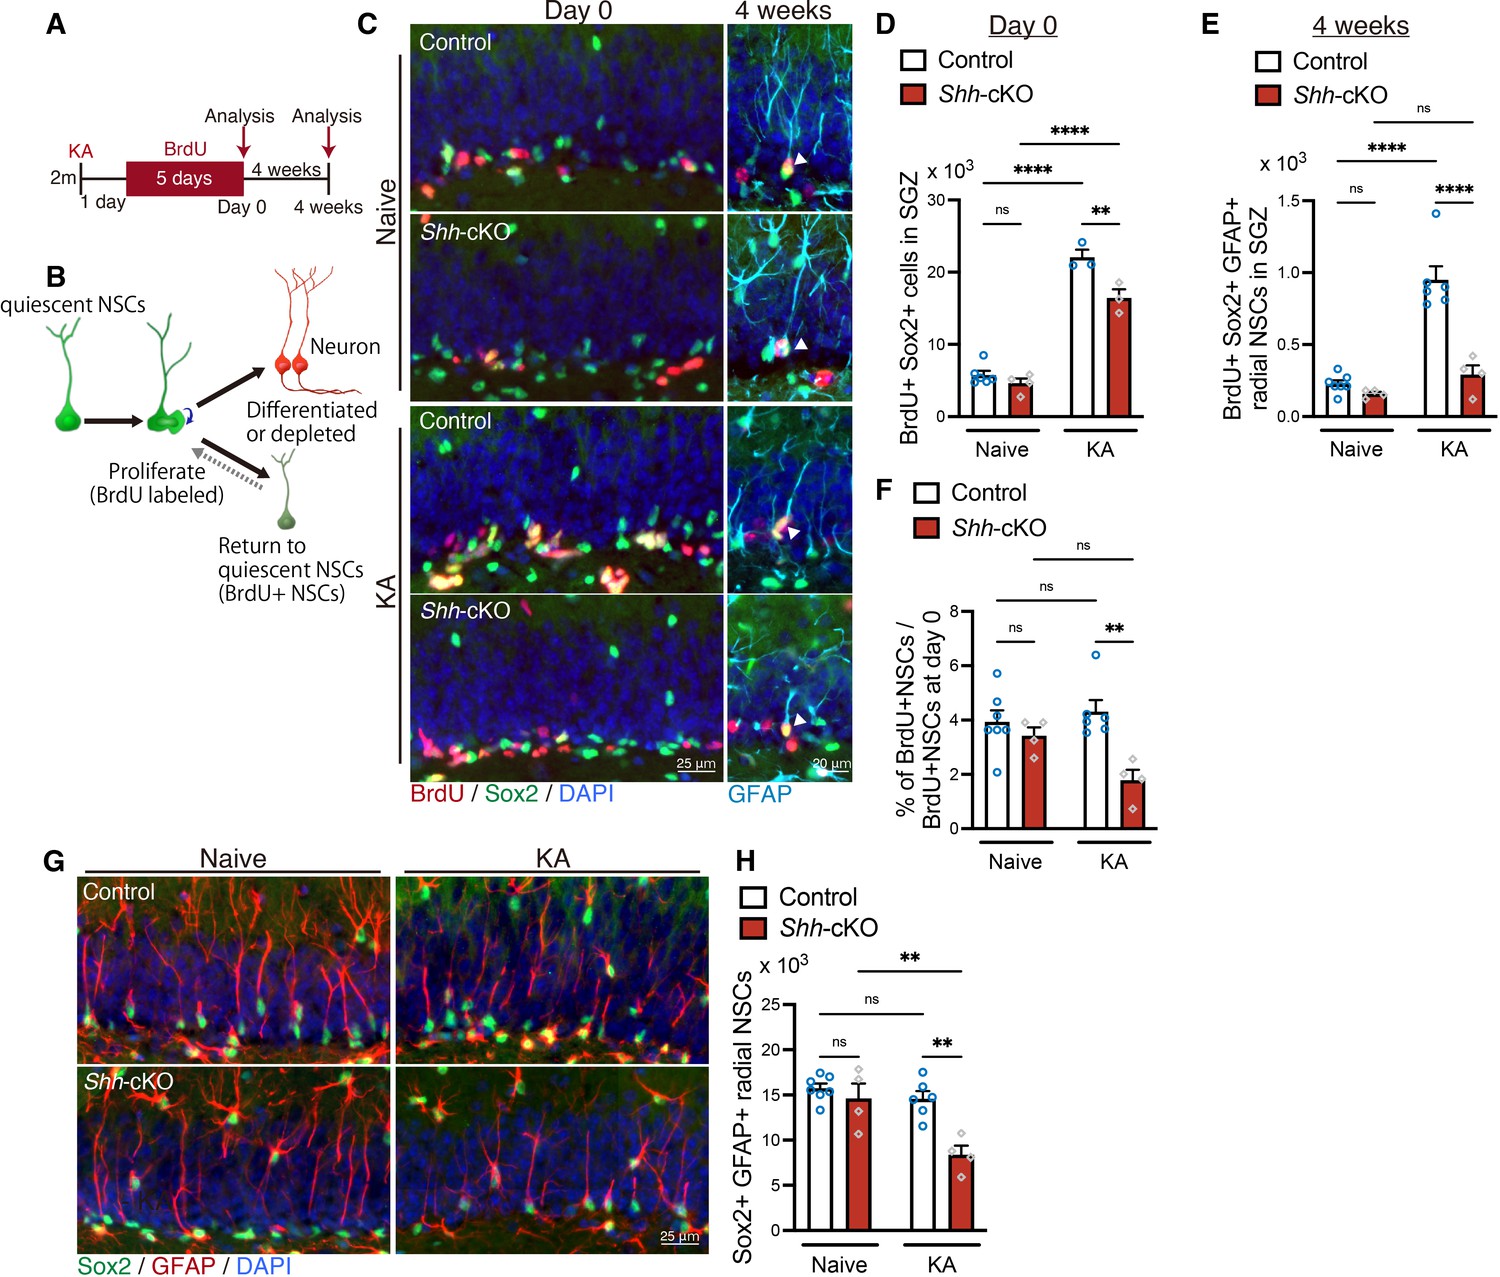
Sonic hedgehog (Shh) from mossy cells maintains neural stem cell (NSC) pool after seizure-induced neurogenesis.
(A) Experimental scheme of long-term tracing of NSCs that proliferate after seizure induction. Seizures were induced in 2-month-old (2 m) control and Shh-cKO mice by kainic acid (KA) injections. One day after seizure induction, mice received 5-bromo-2′-deoxyuridine (BrdU) via drinking water for 5 days and were analyzed on the last day of BrdU administration (day 0) and at 4 weeks after BrdU administration. (B) Schematic of NSC fate after proliferation. (C) Representative immunofluorescence images of proliferating Sox2+ (green) NSCs labeled with BrdU (red) on day 0 and radial GFAP+ (cyan) Sox2+ (green) NSCs retaining BrdU (red) at 4 weeks after BrdU administration, which are indicated by white arrowheads. (D) Quantification of Sox2+ BrdU+ proliferating NSCs after seizure induction on day 0. Values represent mean ± standard error of the mean (SEM); ns: p > 0.05, **p < 0.01, ****p < 0.0001. Two-way analysis of variance (ANOVA) with Tukey’s multiple comparison test (naive: control n = 6, Shh-cKO n = 4, KA: control n = 3, Shh-cKO n = 3 mice). (E) Quantification of Sox2+ GFAP+ radial NSCs retaining BrdU at 4 weeks after BrdU administration. Values represent mean ± SEM; ns: p > 0.05, ****p < 0.0001. Two-way ANOVA with Tukey’s multiple comparison test (naive: control n = 7, Shh-cKO n = 4, KA: control n = 6, Shh-cKO n = 4 mice). (F) Quantification of NSC persistence 4 weeks after BrdU administration in naive and KA-induced mice. Values represent mean ± SEM; ns: p > 0.05, **p < 0.01. Two-way ANOVA with Tukey’s multiple comparison test (naive: control n = 7, Shh-cKO n = 4, KA: control n = 6, Shh-cKO n = 4 mice). (G) Representative immunofluorescence images of Sox2+ (green) GFAP+ (red) radial NSCs at 4 weeks after BrdU administration (5 weeks after KA-induced seizure). (H) Quantification of Sox2+ GFAP+ radial NSCs at 5 weeks after seizure induction in control and Shh-cKO mice. Values represent mean ± SEM; ns: p > 0.05, **p < 0.01. Two-way ANOVA with Tukey’s multiple comparison test (naive: control n = 7, Shh-cKO n = 4, KA: control n = 6, Shh-cKO n = 4 mice).
-
Figure 5—source data 1
Raw data for counts.
- https://cdn.elifesciences.org/articles/91263/elife-91263-fig5-data1-v1.xlsx
Figure 6 with 1 supplement
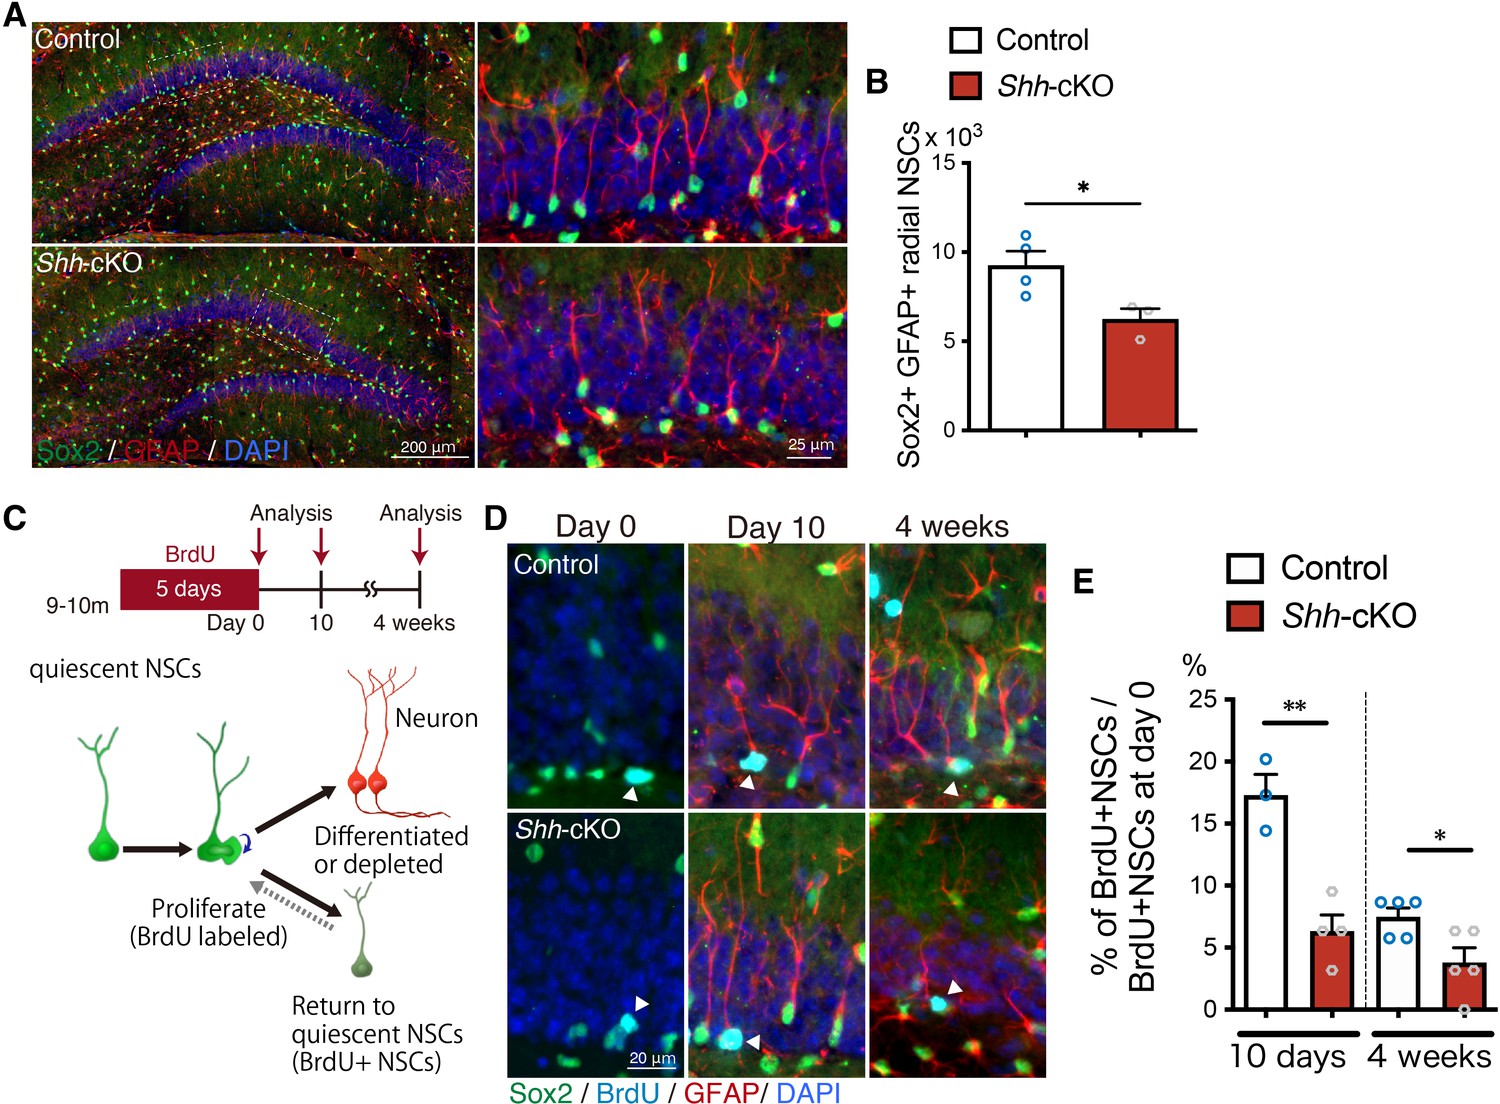
Deletion of Shh in mossy cells increases age-related NSC decline.
(A) Representative immunofluorescence images of Sox2+ (green) GFAP+ (red) radial NSCs in 9- to 11-month-old control and Shh-cKO mice. High magnification of inset images are shown in the right panels. (B) Quantification of Sox2+ GFAP+ radial NSCs. Values represent mean ± standard error of the mean (SEM); *p < 0.05. Unpaired t-test (two-tailed, control: n = 4, Shh-cKO: n = 3 mice). (C) Experimental scheme of long-term tracing of proliferating NSCs in aged mice. Nine- to eleven-month-old control and Shh-cKO mice were administrated with 5-bromo-2′-deoxyuridine (BrdU) via drinking water for 5 days and were analyzed on the last day of BrdU administration (day 0), and at 10 days and 4 weeks after BrdU administration. Schematic of NSC fate after proliferation. (D) Representative immunofluorescence images of proliferating Sox2+ (green) NSCs labeled with BrdU (cyan) at day 0 and radial Sox2+ (green) GFAP+ (red) NSCs retaining BrdU (cyan) at 10 days and 4 weeks after BrdU administration. (E) Quantification of the fraction of NSCs retaining BrdU until 10 days and 4 weeks after BrdU administration in aged control and Shh-cKO mice. Values represent mean ± SEM; *p < 0.05, **p < 0.01. Unpaired t-test (two-tailed, 10 days: control: n = 3, Shh-cKO: n = 4, 4 weeks: control: n = 5, Shh-cKO: n = 5 mice mice).
-
Figure 6—source data 1
Raw data for counts.
- https://cdn.elifesciences.org/articles/91263/elife-91263-fig6-data1-v1.xlsx
Figure 6—figure supplement 1
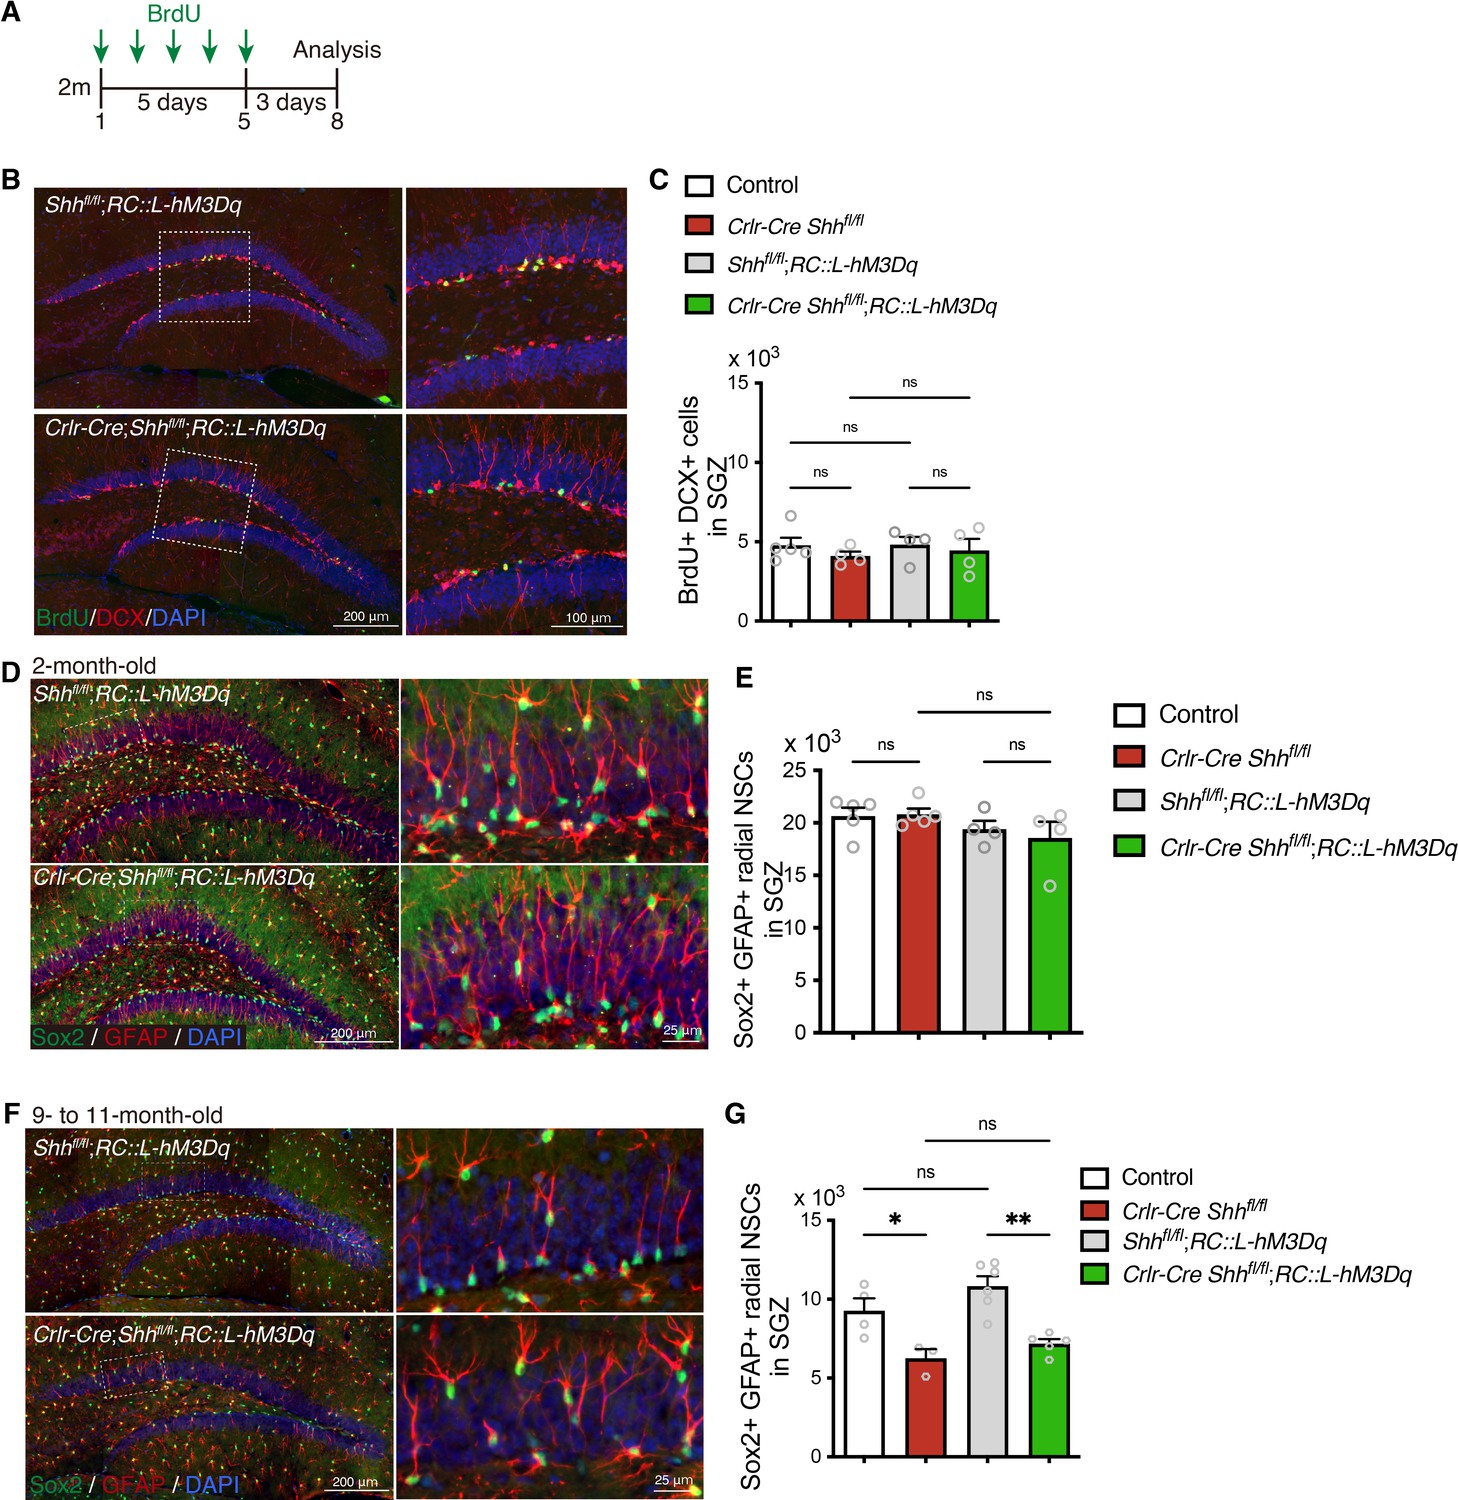
Expressing Designer Receptors Exclusively Activated by Designer Drugs (DREADD) activator does not affect neurogenesis and number of NSCs of Crlr-Cre Shh mice.
(A) Experimental scheme of analyzing neurogenesis by 5-bromo-2′-deoxyuridine (BrdU) pulse labeling. The mice were injected with BrdU for 5 days and analyzed 3 days after last BrdU injection. (B) Representative immunofluorescence images for newborn neurons labeled with BrdU (green), DCX (red), and 4′,6-diamidino-2-phenylindole, dihydrochloride (DAPI; blue) in the SGZ of control (Cre-negative mice), Crlr-Cre;Shhfl/fl, Shhfl/fl;RosaDIO-hM3Dq, and Crlr-Cre;Shhfl/fl;RosaDIO-hM3Dq mice without CLZ administration. (C) Quantification of newborn neurons in the SGZ. Values represent mean ± standard error of the mean (SEM); ns: p > 0.05. One-way analysis of variance (ANOVA) with Tukey’s multiple comparison test (control: n = 5, Crlr-Cre;Shhfl/fl: n = 4, Shhfl/fl;RosaDIO-hM3Dq: n = 4, Crlr-Cre;Shhfl/fl;RosaDIO-hM3Dq: n = 4 mice). (D) Representative immunofluorescence images of radial NSCs labeled with Sox2 (green), GFAP (red), and DAPI (blue) in the SGZ of 2-month-old mice. (E) Quantification of Sox2+ GFAP+ radial NSCs in the SGZ. Values represent mean ± SEM; ns: p > 0.05. One-way ANOVA with Tukey’s multiple comparison test (control: n = 5, Crlr-Cre;Shhfl/fl: n = 5, Shhfl/fl;RosaDIO-hM3Dq: n = 4, Crlr-Cre;Shhfl/fl;RosaDIO-hM3Dq: n = 4 mice). (F) Representative immunofluorescence images of radial NSCs labeled with Sox2 (green), GFAP (red), and DAPI (blue) in the SGZ of 9- to 11-month-old mice. (G) Quantification of number of GFAP+ Sox2+ radial NSCs in the SGZ. Values represent mean ± SEM; ns: p > 0.05, *p < 0.05, **p < 0.01. One-way ANOVA with Tukey’s multiple comparison test (control: n = 4 , Crlr-Cre;Shhfl/fl: n = 3, Shhfl/fl;RosaDIO-hM3Dq: n = 6, Crlr-Cre;Shhfl/fl;RosaDIO-hM3Dq: n = 5 mice).
-
Figure 6—figure supplement 1—source data 1
Raw data for counts.
- https://cdn.elifesciences.org/articles/91263/elife-91263-fig6-figsupp1-data1-v1.xlsx
Additional files
Download links
A two-part list of links to download the article, or parts of the article, in various formats.
Downloads (link to download the article as PDF)
Open citations (links to open the citations from this article in various online reference manager services)
Cite this article (links to download the citations from this article in formats compatible with various reference manager tools)
Shh from mossy cells contributes to preventing NSC pool depletion after seizure-induced neurogenesis and in aging
eLife 12:RP91263.
https://doi.org/10.7554/eLife.91263.2


