BMP2 and BMP7 cooperate with H3.3K27M to promote quiescence and invasiveness in pediatric diffuse midline gliomas
- Childhood Cancer & Cell Death (C3) team, LabEx DEVweCAN, Institut Convergence Plascan, Centre Léon Bérard, Centre de Recherche en Cancérologie de Lyon (CRCL), Université Claude Bernard Lyon 1, INSERM 1052, CNRS 5286, France
- University of Lille, CNRS, Inserm, CHU Lille, UMR9020-U1277-CANTHER Cancer Heterogeneity Plasticity and Resistance to Therapies, Centre Oscar Lambret, France
- Université Paris Cité, CNRS, Institut Jacques Monod, France
- Multisite Institute of Pathology, Groupement Hospitalier Est du CHU de Lyon, Hôpital Femme-Mère Enfant, France
- Platform of Cancer Genomics, Centre Léon Bérard, France
- Preclinical Therapeutics and Drug Delivery Research Program, Department of Oncology, Hospital Sant Joan de Déu, Spain
- Centre de Recherche en Cancérologie de Marseille (CRCM), Université Aix-Marseille, Institut Paoli- Calmettes, Centre de Lutte Contre le Cancer de la région PACA, INSERM 1068, CNRS 7258, France
- Department of Pediatric Oncology, Institute of Pediatric Hematology and Oncology (IHOPe), Centre Léon Bérard, France
- GLIMMER Of lIght (GLIoblastoma MetabolisM, HetERogeneity, and OrganoIds) team, Centre Léon Bérard, Centre de Recherche en Cancérologie de Lyon (CRCL), Université Claude Bernard Lyon 1, INSERM 1052, CNRS 5286, France
Figures
Figure 1 with 1 supplement
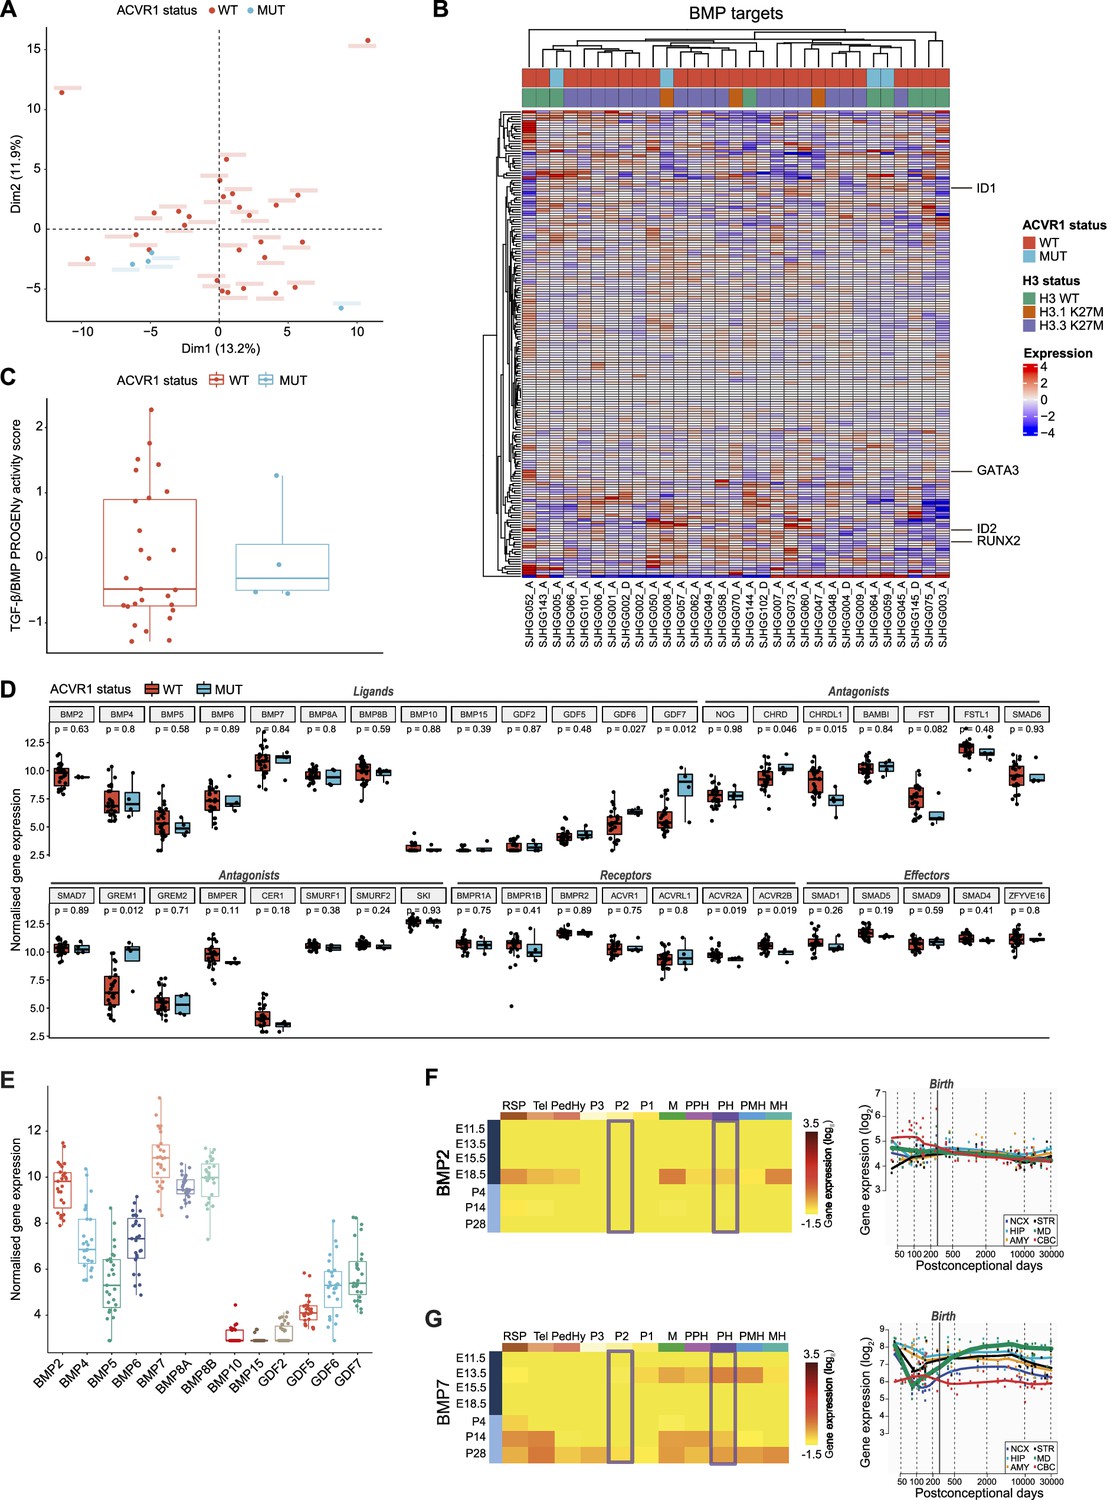
Bone morphogenetic protein (BMP) pathway activation coincides with high BMP2/7 levels in ACVR1 WT-H3.3K27M pDMG.
(A) Principal component analysis (PCA) of ACVR1 WT (red) and mutant pediatric diffuse midline gliomas (pDMG) (blue) samples based on transcriptomic data from cohort 1. (B) Heatmap representing the transcriptomic expression levels of BMP target genes between ACVR1 WT (red) and mutant pDMG (blue) in cohort 1. H3 mutational status is specified as wild-type (WT) (green), mutated on variant H3.1 (brown) or H3.3 (purple). Normalized and centered gene expression levels are color-coded with a blue (low expression) to red (high expression) gradient. Samples in columns are clustered using Euclidean distance. The BMP targets gene list is presented in Supplementary file 1a. (C) TGF-β/BMP pathway activity inferred from a specific genes-response signature using PROGENy algorithm in ACVR1 WT (red) versus mutant pDMG (blue) (cohort 1). No significant difference was observed between both groups. (D) Comparison of the expression level of BMP ligands, antagonists, receptors, and effectors between ACVR1 WT (red) versus mutant pDMG (blue) in cohort 1. p-values are indicated for each gene. (E) Boxplot of BMP ligands expression (vst-normalized) in cohort 1. (F–G) Pattern of expression of BMP2 and 7 in developing brain. Left panel: heatmaps showing relative BMP2 (F) and BMP7 (G) expression by in situ hybridization (ISH) in murine brain across development obtained from the ALLEN Developing Mouse Brain Atlas. Normalized and scaled gene expression levels are color-coded with a yellow (low expression) to red (high expression) gradient. Developmental stage is mentioned in rows with pre- and post-natal stages color-coded in dark and light blue, respectively. Different brain regions are indicated in columns as follows: RSP: rostral secondary prosencephalon; Tel: telencephalic vesicle; PedHy: peduncular caudal hypothalamus; P3: prosomere 3; P2: prosomere 2; P1: prosomere 1; M: midbrain; PPH: prepontine hindbrain; PH: pontine hindbrain; PMH: pontomedullary hindbrain; MH: medullary hindbrain (medulla). Right panel: spatiotemporal gene expression data of BMP2 (F) and BMP7 (G) expression from human developing and adult brain samples obtained from the Human Brain Transcriptome (Hino et al., 2015). The vertical line indicates birth at 266 days. Each curve represents a part of the brain as following: NCX: neocortex (dark blue); HIP: hippocampus (light blue); AMY: amygdala (orange); STR: striatum (black); MD: mediodorsal nucleus of the thalamus (green, in bold); CBC: cerebellar cortex (red).
Figure 1—figure supplement 1
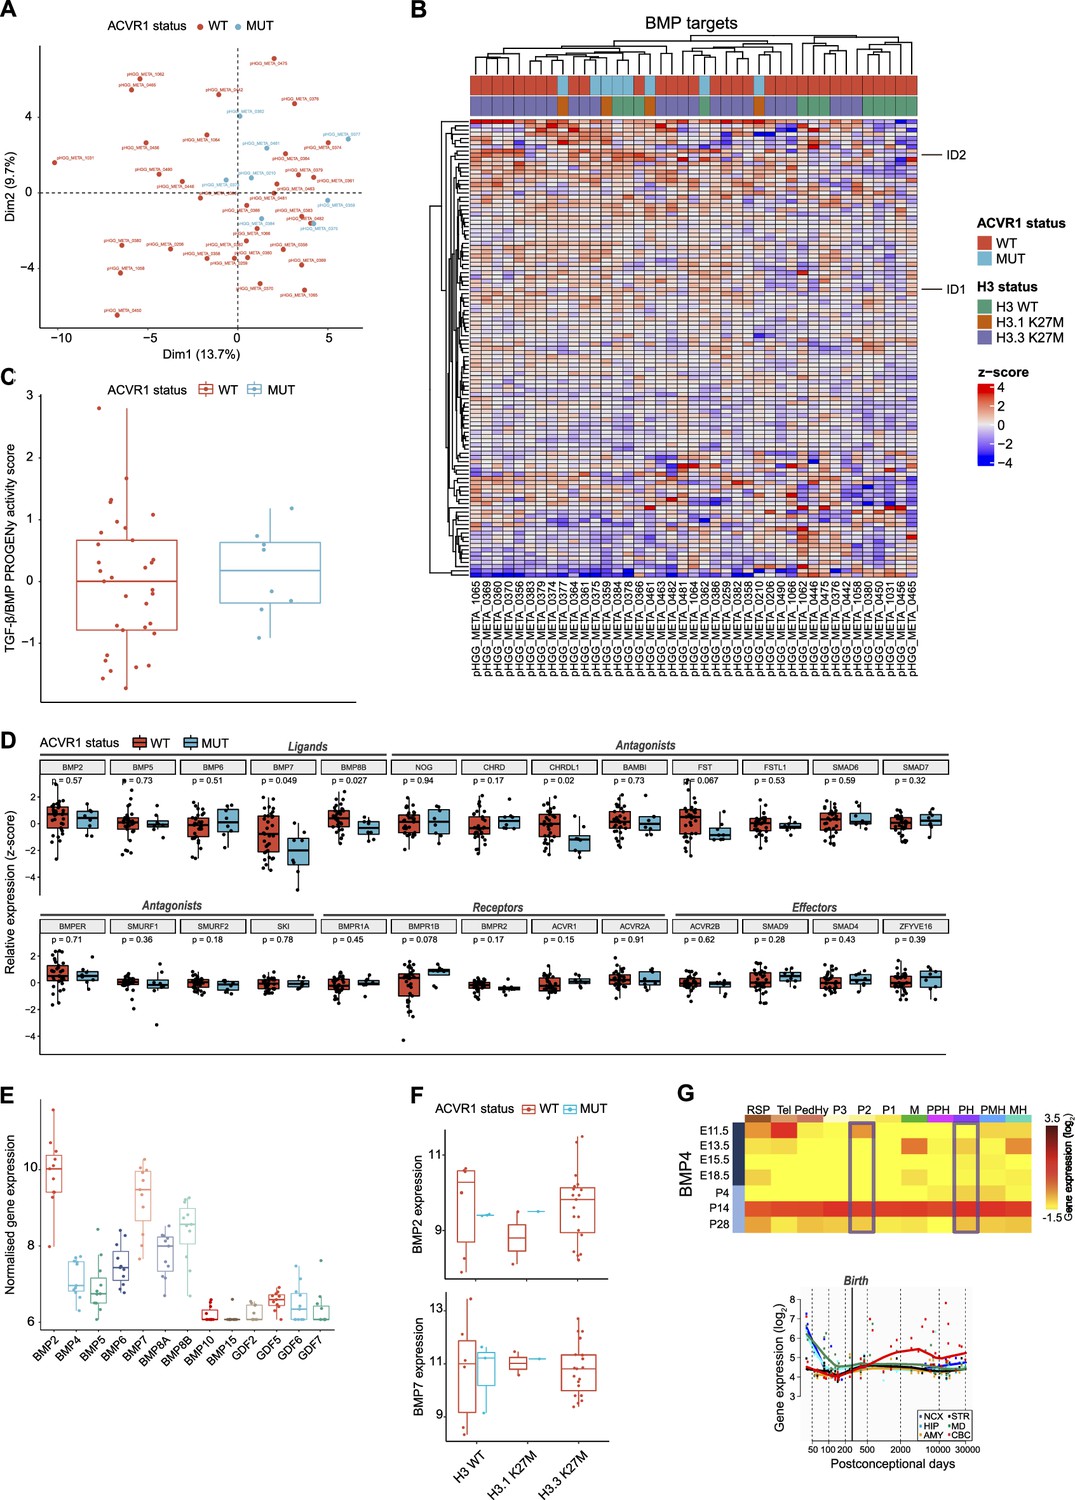
Bone morphogenetic protein (BMP) pathway activation coincides with high BMP2/7 levels in ACVR1 WT-H3.3K27M pDMG.
(A) Principal component analysis (PCA) of ACVR1 WT (red) and mutant pediatric diffuse midline gliomas (pDMG) (blue) samples based on transcriptomic data from cohort 2. (B) Heatmap representing the transcriptomic expression levels of BMP target genes between ACVR1 WT (red) and mutant pDMG (blue) in cohort 2. H3 mutational status is specified as wild-type (WT) (green), mutated on variant H3.1 (brown) or H3.3 (purple). Normalized and centered gene expression levels are color-coded with a blue (low expression) to red (high expression) gradient. Samples in columns are clustered using Euclidean distance. The BMP targets gene list is presented in the Supplementary file 1a. (C) TGF-β/BMP pathway activity inferred from a specific genes-response signature using PROGENy algorithm in ACVR1 WT (red) versus mutant pDMG (blue) (cohort 2). No significant difference was observed between both groups. (D) Comparison of the expression levels of BMP ligands, antagonists, receptors, and effectors between ACVR1 WT (red) versus mutant pDMG (blue) in cohort 2. p-values are indicated for each gene. (E) Boxplot of BMP ligands expression (vst-normalized) in cohort 3. (F) Boxplot of BMP2 and 7 expressions (vst-normalized) in cohort 1, according to ACVR1 and H3 status. (G) Pattern of expression of BMP4 in developing brain. Left panel: heatmaps showing relative BMP4 expression by in situ hybridization (ISH) in murine brain across development obtained from the ALLEN Developing Mouse Brain Atlas. Normalized and scaled gene expression levels are color-coded with a yellow (low expression) to red (high expression) gradient. Developmental stage is mentioned in rows with pre- and post-natal stages color-coded in dark and light blue, respectively. Different brain regions are indicated in columns as follows: RSP: rostral secondary prosencephalon; Tel: telencephalic vesicle; PedHy: peduncular caudal hypothalamus; P3: prosomere 3; P2: prosomere 2; P1: prosomere 1; M: midbrain; PPH: prepontine hindbrain; PH: pontine hindbrain; PMH: pontomedullary hindbrain; MH: medullary hindbrain (medulla). Right panel: spatiotemporal gene expression data of BMP4 expression from human developing and adult brain samples obtained from the Human Brain Transcriptome (Hino et al., 2015). The vertical line indicates birth at 266 days. Each curve represents a part of the brain as following: NCX: neocortex (dark blue); HIP: hippocampus (light blue); AMY: amygdala (orange); STR: striatum (black); MD: mediodorsal nucleus of the thalamus (green, in bold); CBC: cerebellar cortex (red).
Figure 2 with 1 supplement
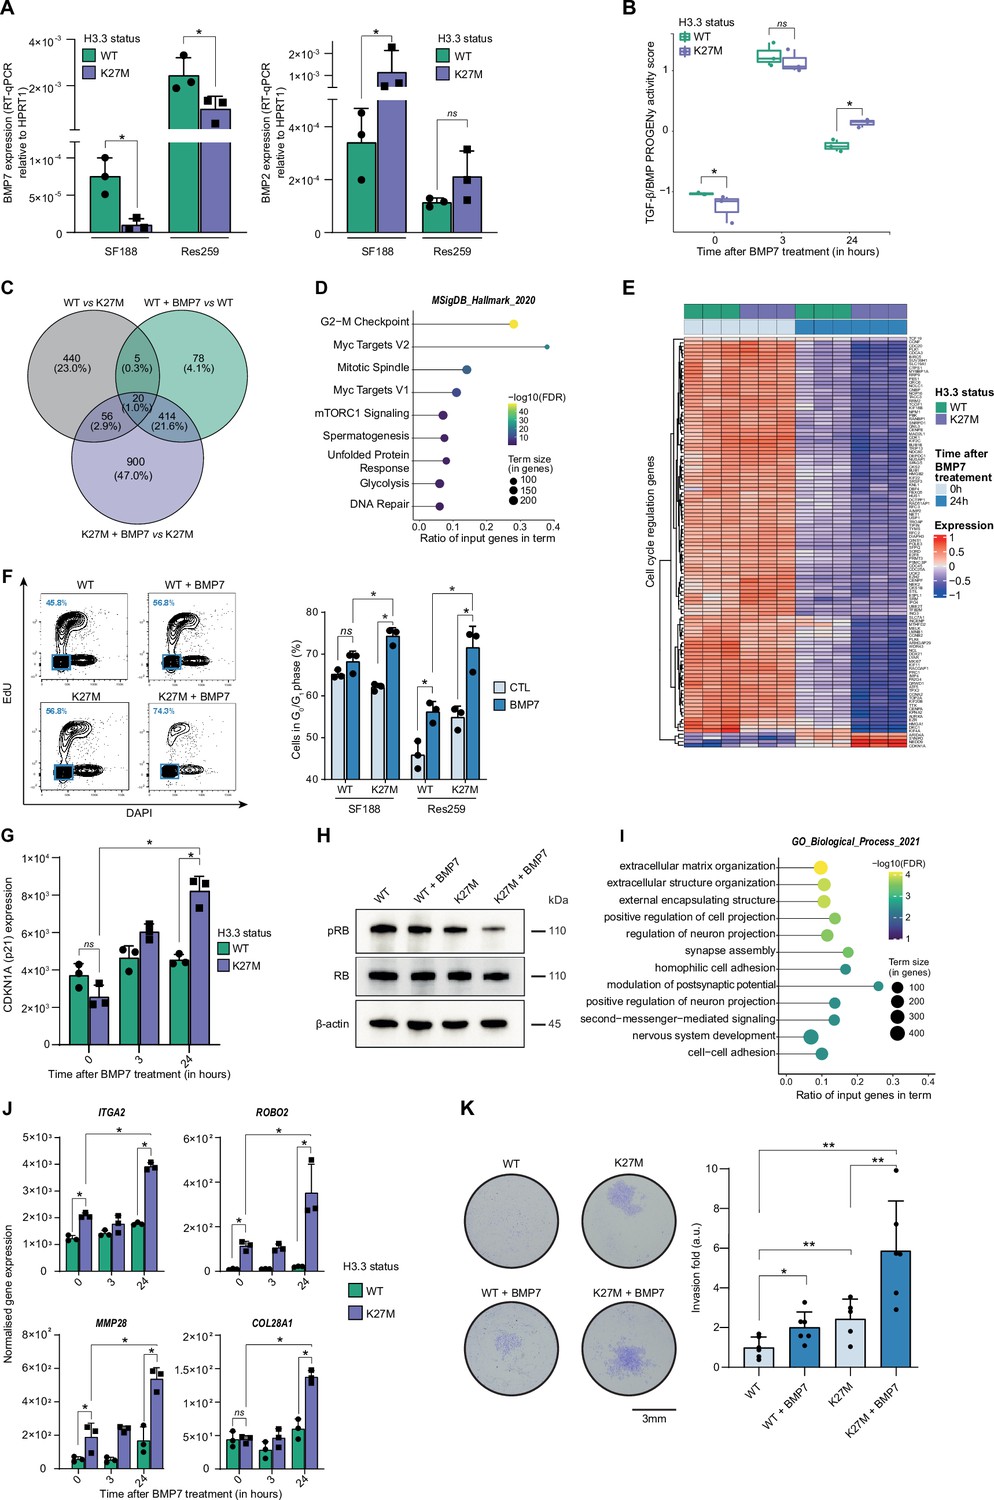
BMP7 induces a specific transcriptomic and phenotypic switch in a H3.3K27M mutant glioma context.
(A) BMP7 (left) and BMP2 (right) expressions in H3.3WT (green) versus H3.3K27M (purple) SF188 and Res259 cells. Gene expressions were analyzed by qRT-PCR relative to HPRT1 expression. Means ± std are represented (n=3). * p<0.05, ns: non-significant. (B) TGF-β/BMP pathway activity inferred from a specific genes-response signature using the PROGENy algorithm in Res259-H3.3WT (green) and H3.3K27M (purple) after 0, 3 and 24 hr of BMP7 treatment (n=3). *p<0.05, ns: non-significant. (C) Venn diagram showing the number of differentially expressed genes (DEG) and the corresponding percentages compared to all DEG in each condition: Res259-H3.3WT versus Res259-H3.3K27M without BMP7 treatment (grey), Res259-H3.3WT versus Res259-H3.3WT treated with BMP7 for 24 hr (green), Res259-H3.3K27M versus Res259-H3.3K27M treated with BMP7 for 24 hr (purple). (D) Functional enrichment of DEG specifically between Res259-H3.3K27M versus Res259-H3.3K27M treated with BMP7 for 24 hr. Dots are colored according to their false discovery rate with a blue (lower significance) to yellow (higher significance) gradient and sized by the count number of genes matching the biological process. (E) Heatmap representing the transcriptomic expression levels of genes associated with cell cycle regulation between Res259-H3.3WT (green) and Res259-H3.3K27M (purple) cells, with (dark blue) or without (light blue) BMP7 treatment. Normalized and centered gene expression levels are color-coded with a blue (low expression) to red (high expression) gradient. (F) Flow cytometry analyses of cell cycle in Res259/SF188-H3.3WT and H3.3K27M upon BMP7 treatment. Left panel: representative density plots with outliers (dots) with 5-ethynyl-2′-deoxyuridine (EdU) staining on the y-axis and with DAPI staining on the x-axis for the indicated conditions on Res259 cell lines. Quantification of cells in G0/G1 phase (blue square, low EdU, and low DAPI stainings) appear in the lower left corner for the presented graph. Right panel: quantification of cells in G0/G1 phase for SF188- and Res259-H3.3WT or H3.3K27M without BMP7 treatment (light blue) or after 24 hr treatment (dark blue). Means ± std are represented (n=3). *p<0.05, ns: non-significant. (G) CDKN1A (encoding p21) normalized expression from transcriptomic data of Res259-H3.3WT (green) and Res259-H3.3K27M (purple) after 0, 3, or 24 hr of BMP7 treatment. Means ± std are represented (n=3). *p<0.05, ns: non-significant. (H) Western-blot analysis of RB phosphorylation on S780 (pRB) in Res259-H3.3WT or H3.3K27M upon BMP7 treatment. Total RB and β-actin are used as controls. One representative experiment out of 3 is shown. (I) Functional enrichment of DEG specific for the K27M/BMP7 condition, according to the decision tree algorithm presented in Figure 2—figure supplement 1J. Dots are colored according to their false discovery rate with a blue (lower significance) to yellow (higher significance) gradient and sized by the count number of genes matching the biological process. (J) ITGA2, ROBO2, MMP28, and COL28A1 normalized expression from transcriptomic data of Res259-H3.3WT (green) and Res259-H3.3K27M (purple) after 0, 3 or 24 hr of BMP7 treatment. Means ± std are represented (n=3). *p<0.05, ns: non-significant. (K) Impact of BMP7 treatment on invasion in Res259-H3.3WT versus H3.3K27M. Left panel: representative pictures of a transwell invasion assay of Res259-H3.3WT or H3.3K27M, with and without BMP7 treatment. Scale bar = 3 mm. Right panel: invasion was quantified as the mean value of five independent experiments and represented as a graph. Means ± std are represented. *p<0.05, **p<0.01.
-
Figure 2—source data 1
Uncropped and labeled gels for Figure 2.
- https://cdn.elifesciences.org/articles/91313/elife-91313-fig2-data1-v1.zip
-
Figure 2—source data 2
Raw unedited gels for Figure 2.
- https://cdn.elifesciences.org/articles/91313/elife-91313-fig2-data2-v1.zip
Figure 2—figure supplement 1
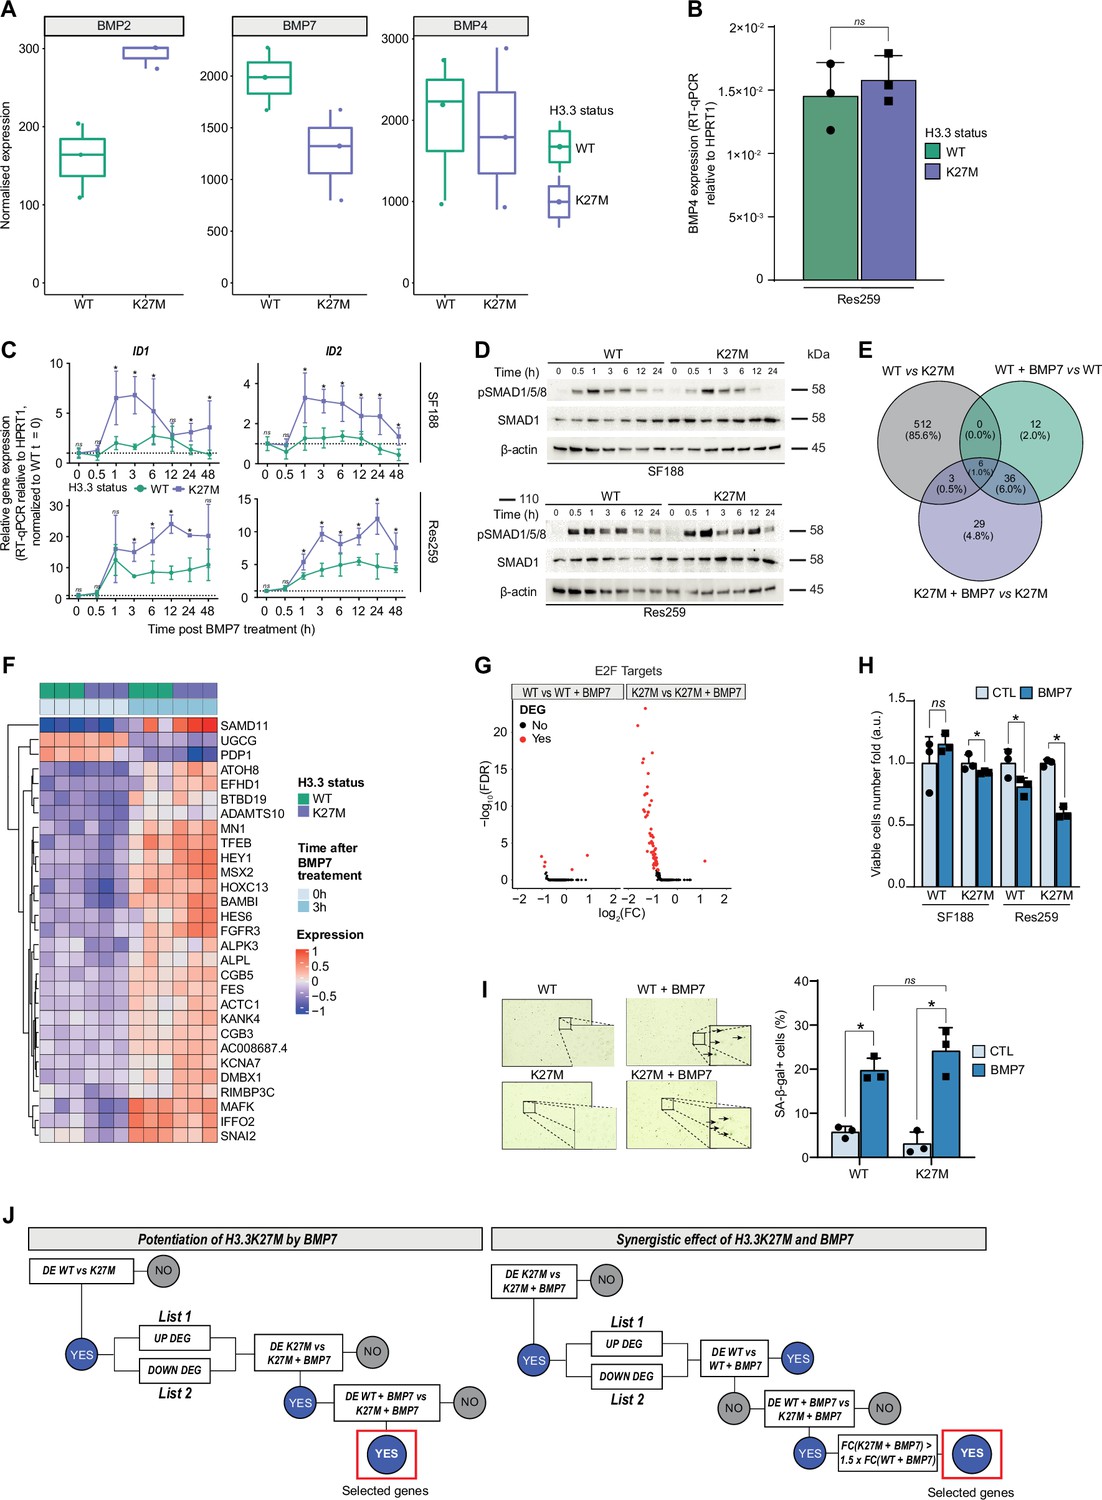
H3.3K27M mutant context potentiates BMP7-induced transcriptomic and phenotypic switch in a glioma model.
(A) BMP2, BMP7, and BMP4 normalized expression from transcriptomic data of Res259-H3.3WT (green) versus Res259-H3.3K27M (purple). Means ± std are represented (n=3). (B) BMP4 expression between Res259-H3.3WT (green) and H3.3K27M (purple). Gene expression was analyzed by qRT-PCR relative to HPRT1 expression. Means ± std are represented (n=3). ns: non-significant p-value. (C) ID1 and ID2 expressions between SF188- (upper panel) and Res259- (bottom panel) H3.3WT (green) and H3.3K27M (purple) following BMP7 treatment at indicated time points from 0 to 48 hr (x-axis). Means ± std are represented (n=3). *p< 0.05, ns: non-significant. (D) Western-blot analysis of SMAD1/5/8 phosphorylation on Ser463/465 (SMAD1/5) and Ser465/467 (SMAD8) (pSMAD1/5/8) levels in SF188- and Res259-WT and H3.3K27M upon BMP7 treatment. Total SMAD1 and β-actin are used as loading control for the indicated conditions (n=3). A representative experiment is shown. (E) Venn diagram showing the number of differentially expressed genes (DEG) and the corresponding percentages compared to all DEG in each condition: Res259-H3.3WT versus Res259-H3.3K27M without BMP7 treatment (grey), Res259-H3.3WT versus Res259-H3.3WT treated with BMP7 for 3 hr (green), Res259-H3.3K27M versus Res259-H3.3K27M treated with BMP7 for 3 hr (purple). (F) Heatmap representing the transcriptomic expression levels of the 29 DEG specifically in Res259-H3.3K27M (n=3) versus Res259-H3.3K27M treated with BMP7 for 3 hr (n=3). Samples are placed in columns such as Res259-H3.3WT (green) and -H3.3K27M (purple), control (light blue), or 3 hr BMP7 treatment (blue). Normalized and centered gene expression levels are color-coded with a blue (low expression) to red (high expression) gradient. (G) Volcano plots of DEG in the E2F target signature between Res259-H3.3WT control versus BMP7-treated (left panel) and Res259-H3.3K27M control versus BMP7-treated (right panel). Fold change is indicated on the x-axis and statistical significance on the y-axis. Black dots: non-differentially expressed. Red dots: differentially expressed. (H) Viable cell count of SF188- and Res259-H3.3WT and H3.3K27M after 72 hr of BMP7 treatment (dark blue), normalized to non-treated condition (light blue). Means ± std are represented (n=3). *p< 0.05, ns: non-significant. (I) Senescence-associated beta-galactosidase activity (SA-β-gal) assessment experiment on Res259-H3.3WT and Res259-H3.3K27M control or treated with BMP7 for 72 hr with SA-β-gal staining. Right panel: representative microscopic photos. Arrows indicate SA-β-gal+ cells. Left panel: quantification of cells positive for SA-β-gal activity. Means ± std are represented (n=3). *r< 0.05, ns: non-significant. (J) Decisional tree algorithm to study the specific impact of potentiation of H3.3K27M by BMP7 (left) and the synergy of both (right). DE: differentially expressed. DEG: differentially expressed genes. FC: fold-change. K27M: H3.3K27M mutation. WT: H3.3wt. For the last step of decisional tree 2 (right panel), genes are selected such as log2(FC(K27M+BMP7)/(K27M))>1.5 x log2(FC(WT + BMP7)/(WT)).
-
Figure 2—figure supplement 1—source data 1
Uncropped and labeled gels for Figure 2—figure supplement 1.
- https://cdn.elifesciences.org/articles/91313/elife-91313-fig2-figsupp1-data1-v1.zip
-
Figure 2—figure supplement 1—source data 2
Raw unedited gels for Figure 2—figure supplement 1.
- https://cdn.elifesciences.org/articles/91313/elife-91313-fig2-figsupp1-data2-v1.zip
Figure 3 with 1 supplement
Combined tumor-autonomous BMP2/BMP7 expression drives a quiescent-invasive tumor cell state in pediatric diffuse midline gliomas (pDMG).
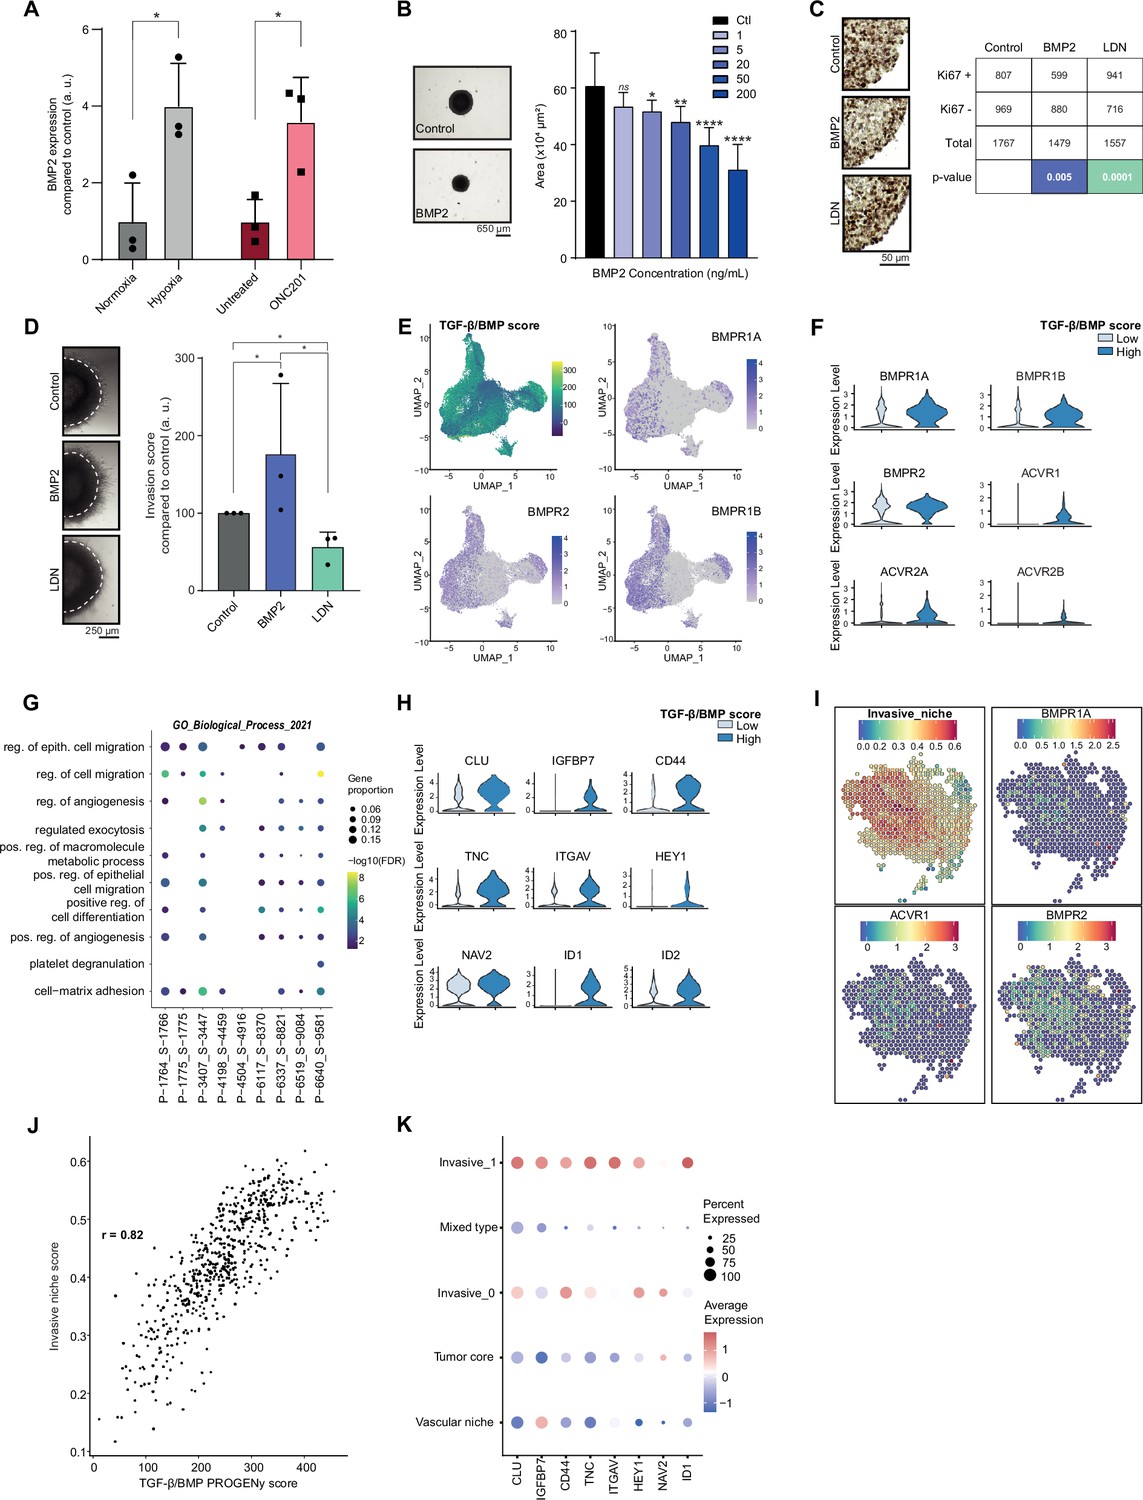
(A) BMP2 expression after hypoxia or ONC201 treatment. Gene expression was analyzed by QRT-PCR relative to HPRT1 expression. Means ± std are represented (n=3). *p<0.05. (B) Growth monitoring of HSJD-DIPG-012 following recombinant BMP2 treatment. Means± std are represented (n=3). *p<0.05, **p<0.01, ****p<0.0001, ns: non-significant. Scale bar = 650µm. (C) Impact of BMP2 or LDN treatment on KI67-positive staining in HSJD-DIPG-012. Left panel: representative images of Ki67 immunohistochemistry on HSJD-DIPG-012 spheroids treated or not with either BMP2 or LDN-193189. Scale bar = 50 µm. Right panel: quantification of Ki67-positive and negative cells. p-values were computed using Fisher’s exact test. BMP2: 200 ng/mL, LDN-193189: 1 µM. (D) Impact of BMP2 or LDN treatment on tumor cells invasion. Left panel: representative images of HSJD-DIPG-012 spheroids embedded in Matrigel, after 48 hr of BMP2 or LDN-193189 treatment. Scale bar = 250 µm. Right panel: Invasion was quantified as the mean value of four independent experiments and represented as a graph. *p<0.05. BMP2: 10 ng/mL, LDN-193189: 1 µM. (E) UMAP (uniform manifold approximation and projection) computed on harmony embeddings of the tumor cells of 10 ACVR1 WT-H3.3K27M pDMGs from the scRNA-seq data published by Jessa et al., 2022. PROGENy TGF-β/BMP score is colored from blue (low activity score) to yellow (high activity score). Expression of the bone morphogenetic protein (BMP) receptors BMPR1A, BMPR2 and BMPR1B is colored from grey (low expression values) to purple (high expression values). (F) Violin plots of BMP receptors in one (P-1775_S-1775) of the 10 samples based on the TGF-β/BMP PROGENy score. The TGF-β/BMP-low and high groups are colored respectively in light and dark blue. All p-value are lower than 7.357206e-13 (ACVR2A). (G) Dotplot of the first 10 significantly enriched pathways (FDR ≤ 0.05) in TGF-β/BMP-high cells for each of the 10 ACVR1 WT-H3.3K27M pDMGs, ranked by number of samples with a significant enrichment, using the GO Biological Process database. Only dots of significant enrichments are shown for each sample. Dot color represents the -log10 (p-value) and ranges from blue (high p-value) to yellow (low p-values). Dot size is proportional to the overlap of differentially expressed (DE) genes and the genes of a geneset. (H) Violin plots of invasion-related genes in one (P-3407_S-3447) of the 10 samples based on the TGF-β/BMP-high/low score. The TGF-β/BMP-low group and high group are respectively colored in light and dark blue. All p-value are lower than 1.34e-8 (HEY1). (I) ‘Invasive niche’ score from Ren et al., 2023, and associated expression of the BMP receptors BMPR1A, ACVR1, and BMPR2. Color ranges from blue (low score/expression value) to red (high score/expression value). (J) Scatter plot correlating the PROGENy TGF-β/BMP pathway activity score with the ‘Invasive niche’ score for each Visium spot of pDMG Sample-1. The correlation coefficient was computed using Pearson’s method. ****p-value < 2.e-16. (K) Scaled expression of invasion-related genes in pDMG Sample-1 for each identified area. Dot size represents the proportion of cells expressing the gene. Color ranges from blue (low expression) to red (high expression).
Figure 3—figure supplement 1
Combined tumor-autonomous BMP2/BMP7 expression drives a quiescent-invasive tumor cell state in pediatric diffuse midline gliomas (pDMG).
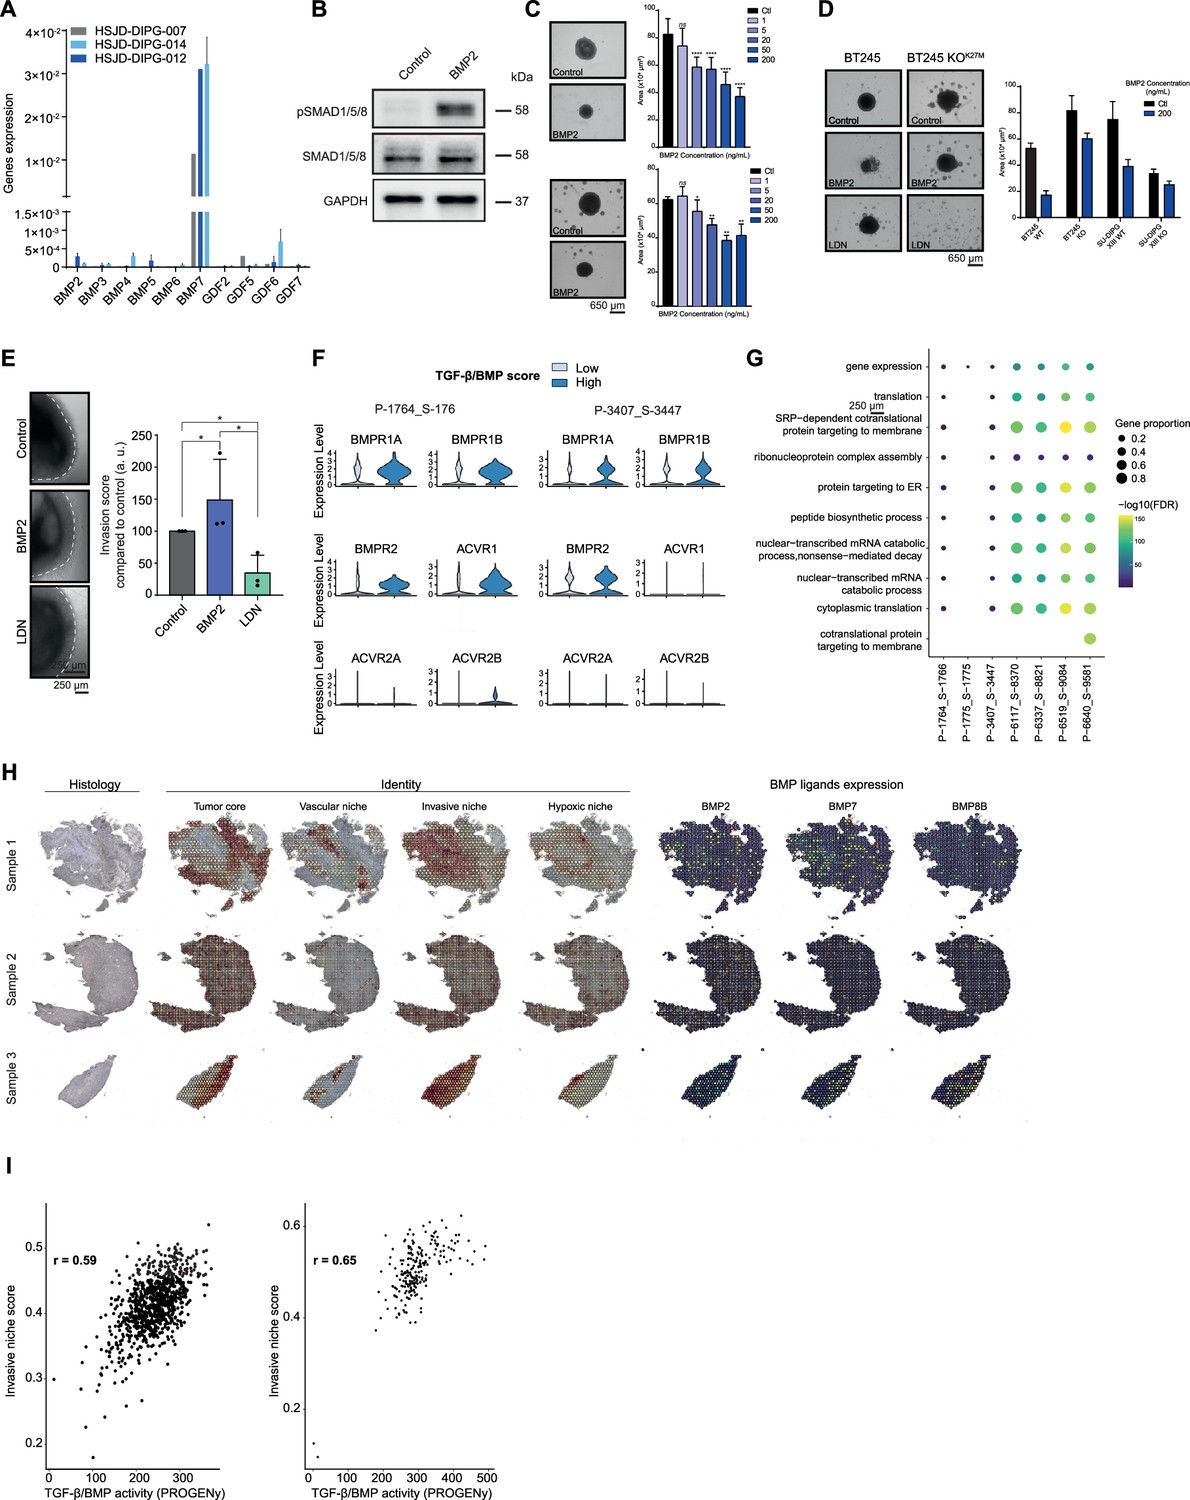
(A) Bone morphogenetic protein (BMP) ligands expression analyzed by qRT-PCR relative to five housekeeping genes levels in three different Diffuse Intrinsic Pontine Gliomas (DIPG) cell lines. HSJD-DIPG-007: ACVR1 mutant (grey). HSJD-DIPG-012: ACVR1 WT (dark blue). HSJD-DIPG-014: ACVR1 WT (light blue). Means ± std are represented (n=2). (B) Western-blot analysis of pSMAD1/5/8, total SMAD1/5/8 on HSJD-DIPG-012 spheroids, treated or not with BMP2. GAPDH was used as a loading control. A representative experiment out of 3 is shown. (C) Growth monitoring of HSJD-DIPG-014 (top panel) and HSJD-DIPG-013 (bottom panel) following recombinant BMP2 treatment. Means ± std are represented. *p<0.05, **p<0.01, ***p<0.001. Scale bar = 650µm. (D) Growth monitoring of BT245 and DIPGXIII, before and after (KOK27M) edition of the H3.3K27M mutation. Representative pictures of BT245 are shown on the left. Means ± std are represented on the right. Scale bar = 650µm. (E) Impact of BMP2 or LDN treatment on tumor cells invasion. Left panel: representative images of HSJD-DIPG-013 spheroids embedded in Matrigel, after 48 hr of BMP2 or LDN-193189 treatment. Scale bar = 250 µm. Right panel: Invasion was quantified as the mean value of four independent experiments and represented as a graph. *p<0.05. BMP2: 10 ng/mL. LDN:1 µM. (F) Violin plots of BMP receptors in two (P-1764_S-1766 and P-3407_S-3447) of the 10 samples based on the TGF-β/BMP score. The TGF-β/BMP-low group is colored in light blue and the TGF-β/BMP-high group is colored in blue. (G) Dotplot of the first 10 significantly enriched pathways (FDR ≤ 0.05) in TGF-β/BMP-low cells for each of the 10 ACVR1 WT-H3.3K27M pDMG, ranked by number of samples with a significant enrichment, using the GO Biological Process database. Only dots of significant enrichments are shown for each sample. Dot color represents the -log10(p-value) and ranges from blue (high p-value) to yellow (low p-values). Dot size is proportional to the overlap of differentially expressed (DE) genes and the genes of a geneset. (H) Score of the pDMG niche signatures identified by Ren et al., 2023, namely: ‘Tumor core,’ ‘Vascular niche,’ ‘Invasive niche’ and ‘Hypoxic niche’ in each of the three Visium samples. Color ranges from blue (low score value) to red (high score value). (I) Scatter plots correlating PROGENy TGF-β/BMP pathway activity with the ‘Invasive niche’ score for each Visium spot of Sample-2 and Sample-3. The correlation coefficient was computed using Pearson’s method. ****p-value < 2.e-16.
-
Figure 3—figure supplement 1—source data 1
Uncropped and labeled gels for Figure 3—figure supplement 1.
- https://cdn.elifesciences.org/articles/91313/elife-91313-fig3-figsupp1-data1-v1.zip
-
Figure 3—figure supplement 1—source data 2
Raw unedited gels for Figure 3—figure supplement 1.
- https://cdn.elifesciences.org/articles/91313/elife-91313-fig3-figsupp1-data2-v1.zip
Additional files
-
Supplementary file 1
Analysis of the profile of expression of BMP pathway in pDMG.
(a) List of the BMP target genes used for the heatmaps shown in Figure 1B and Figure 1—figure supplement 1B. (b) Average BMP ligand expression (natural log) per sample in the spatial transcriptomic dataset of DMG samples. (c) Normalized expression matrix (vst) of BMP pathway genes from cohort 3, including those shown in Figure 1—figure supplement 1E. (d) Histone mutation of samples from cohort 3.
- https://cdn.elifesciences.org/articles/91313/elife-91313-supp1-v1.xlsx
-
MDAR checklist
- https://cdn.elifesciences.org/articles/91313/elife-91313-mdarchecklist1-v1.pdf
Download links
A two-part list of links to download the article, or parts of the article, in various formats.
Downloads (link to download the article as PDF)
Open citations (links to open the citations from this article in various online reference manager services)
Cite this article (links to download the citations from this article in formats compatible with various reference manager tools)
BMP2 and BMP7 cooperate with H3.3K27M to promote quiescence and invasiveness in pediatric diffuse midline gliomas
eLife 12:RP91313.
https://doi.org/10.7554/eLife.91313.3


