Neuron-specific RNA-sequencing reveals different responses in peripheral neurons after nerve injury
- Institute of Neurosciences, and Department Cell Biology, Physiology and Immunology, Universitat Autònoma de Barcelona, Spain
- Centro de Investigación Biomédica en Red sobre Enfermedades Neurodegenerativas, Instituto de Salud Carlos III, Spain
- Peripheral Nervous System, Vall d'Hebron Institut de Recerca (VHIR), Vall d'Hebron Hospital Universitari, Vall d'Hebron Barcelona Hospital Campus, Spain
- Division of Neurology, Department of Medicine and the Neuroscience and Mental Health Institute, University of Alberta, Canada
Figures
Figure 1 with 2 supplements

Regeneration rate of peripheral neurons.
(A) Schematic representation of the transgenic mice and experimental design used in this study. (B) Microscope images of longitudinal sections of regenerating nerves in the different Cre/Ai9 animals 7 days after injury. Images show a representative example of distal regeneration at 9 days postinjury (dpi). (C) Quantification of the number of axons that regenerated at 12 mm (smooth bars) and 17 mm (stripped bars) at 7 or 9 dpi. Each color represents a different neuron subtype (purple: proprioceptors; blue: cutaneous mechanoreceptors; orange: nociceptors; green: motoneurons). *p<0.05, **p<0.01, ***p<0.001 vs each control group as calculated by two-way ANOVA followed by Bonferroni’s correction for multiple comparisons. (D) Relative number of regenerated axons normalized by the control number of axons in each neuron type. *p<0.05, **p<0.01, ***p<0.001, ****p<0.0001 as calculated by two-way ANOVA followed by Bonferroni’s correction for multiple comparisons. n7 days = 7/group; n9 days = 7/group; ncontrol = 3 (each sensory group) or 6 (motoneurons). Scale bar: 100 µm.
Figure 1—figure supplement 1
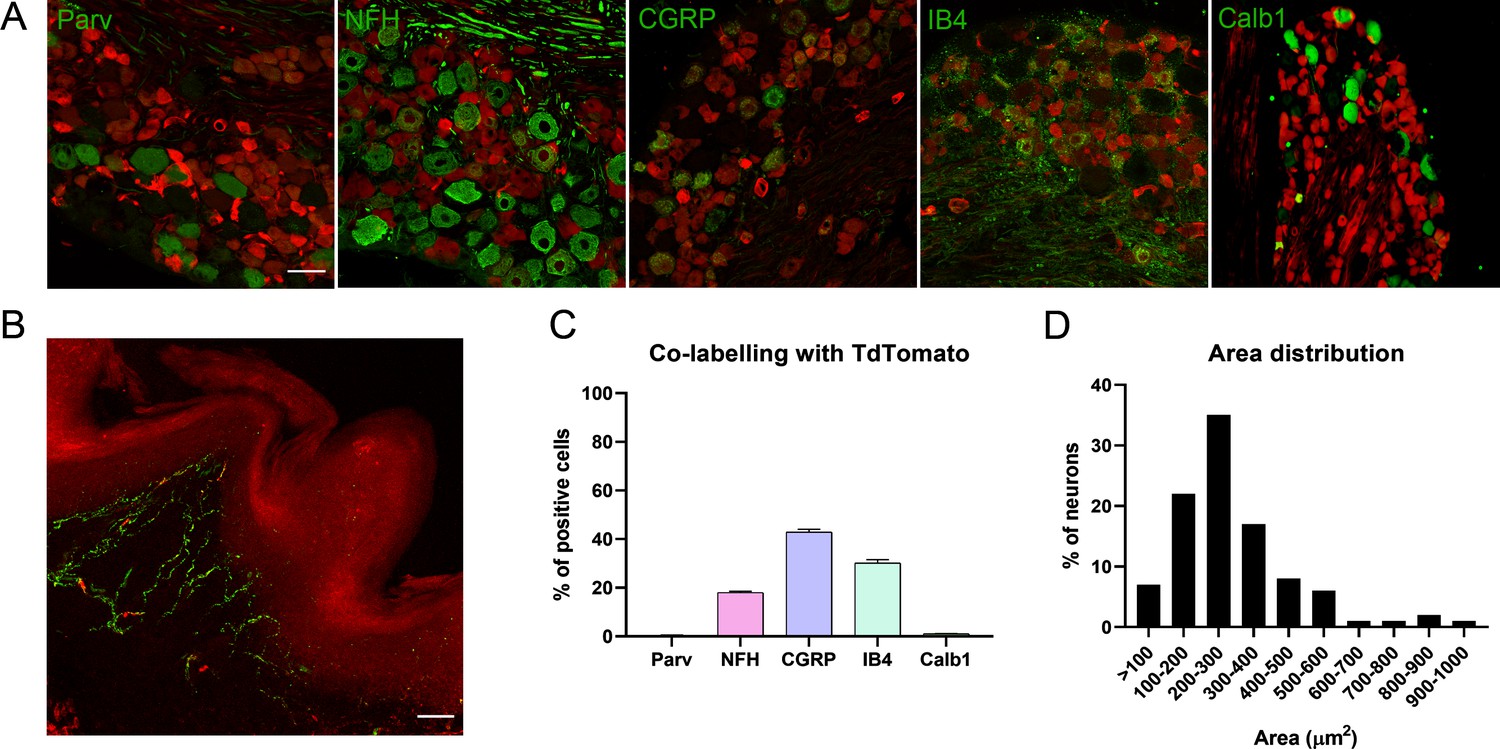
Characterization of TRPV1-Cre/Ai9 mice.
(A) Immunofluorescence with different markers (parvalbumin, Parv; neurofilament heavy chain, NFH; calcitonin gene-related peptide, CGRP; isolectin IB4, IB4; calbindin-1, Calb1). (B) Microscope image of a footpad showing free endings (TdTomato in red, PGP9.5 in green). (C) Percentage of co-labeling with different markers. (D) Frequency distribution showing the size of TRPV1+ neurons in the dorsal root ganglia (DRG). n = 3.
Figure 1—figure supplement 2

In vitro neurite extension in dorsal root ganglia (DRG) explants.
(A) Microscope images of cultured DRGs from the different Cre/Ai9 mice. (B) Neurite distribution by their length in each neuron type. (C, D) Quantification of the longest neurite and mean neurite length in DRG explants. *p<0.05, ***p<0.001, and ****p<0.0001 as calculated by Kruskal-Wallis test followed by Dunn’s multiple comparisons test. Scale bar: 100 μm.
Figure 2 with 3 supplements
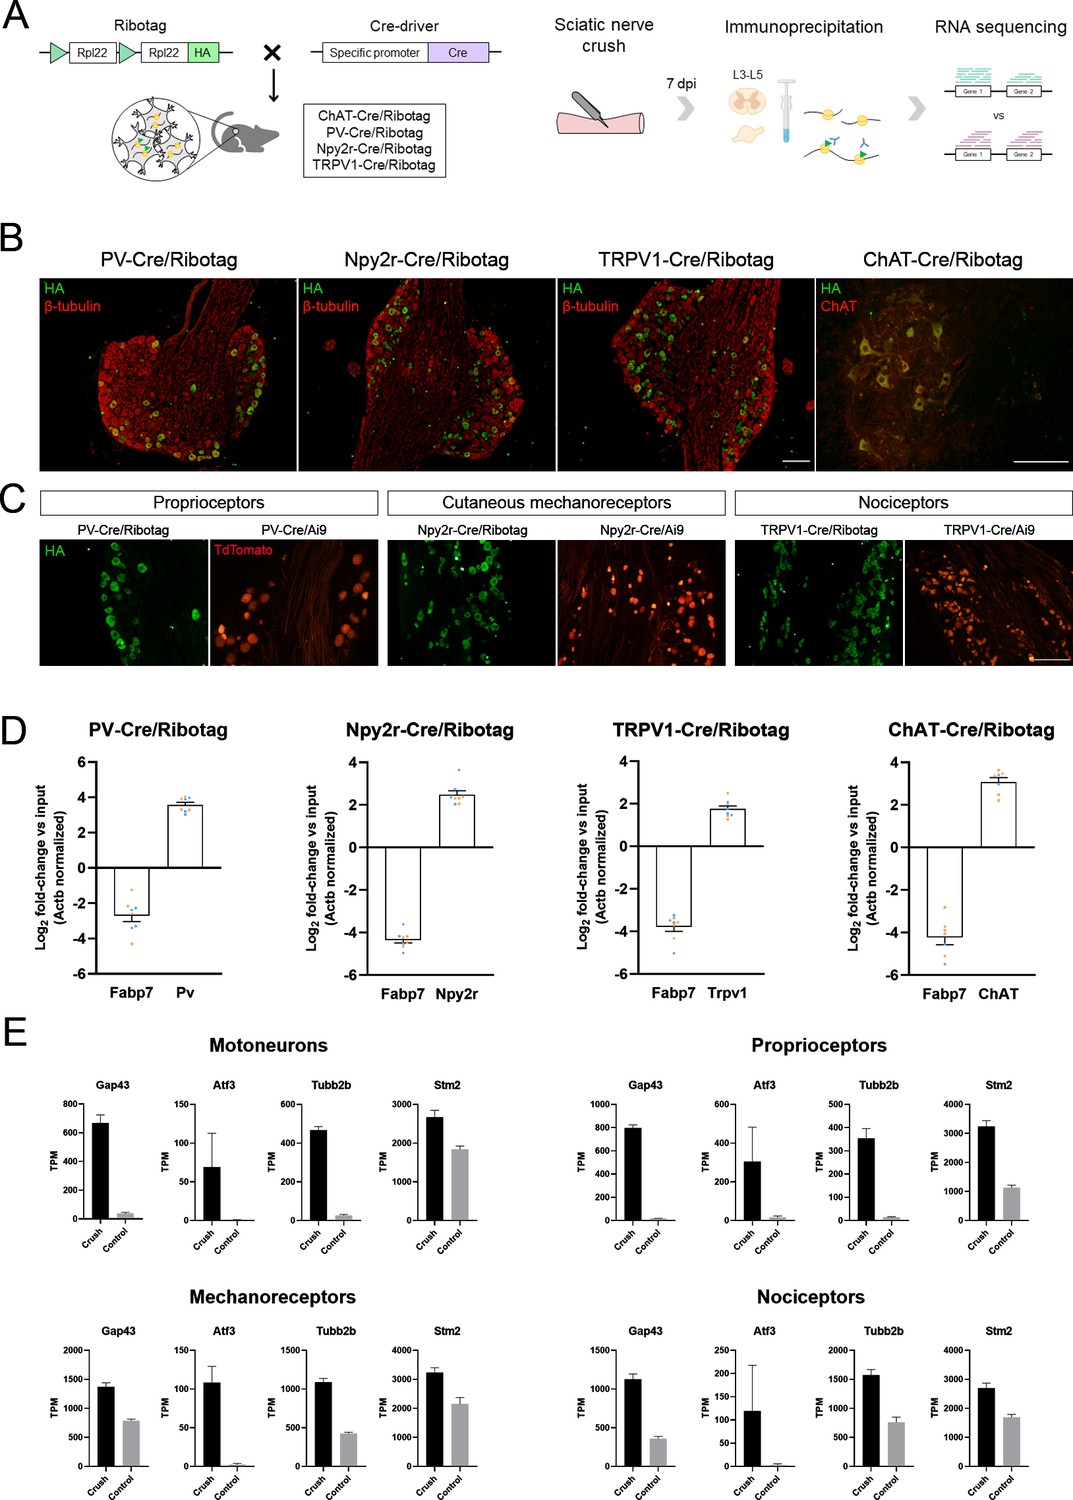
Validation of the specificity of PV-Cre/Ribotag, Npy2r-Cre/Ribotag, TRPV1-Cre/Ribotag, and ChAT-Cre/Ribotag mice.
(A) Schematic representation of the mice and experimental design used in this experiment. (B) Immunostaining against hemagglutinin (HA, green) shows the expression of tagged ribosomes in neuronal cells in the dorsal root ganglia (DRG) (PV-Cre/Ribotag, Npy2r-Cre/Ribotag, and TRPV1-Cre/Ribotag) and in the motoneurons in the spinal cord (ChAT-Cre/Ribotag). In red, β-tubulin labels all cells in the DRG, and ChAT labels motoneurons in the spinal cord. (C) Cre/Ribotag mice expresses HA (in green) in a similar pattern to the expression of TdTomato in Cre/Ai9 mice (in red). (D) RT-qPCR reveals the enrichment of cell type-specific transcripts in each immunoprecipitate (Pv, Npy2r, Trpv1, ChAT) and the depletion of the glial transcript Fabp7 in immunoprecipitates from all neuron populations. In orange, samples from female mice; in blue, samples from male mice. (E) Transcripts per million (TPM) of regeneration markers. The expression of the transcripts Gap43, Atf3, Tubb2b, and Stm2 is enriched in the immunoprecipitates from injured mice compared to control mice in all populations. Scale bar: 150 µm.
Figure 2—figure supplement 1
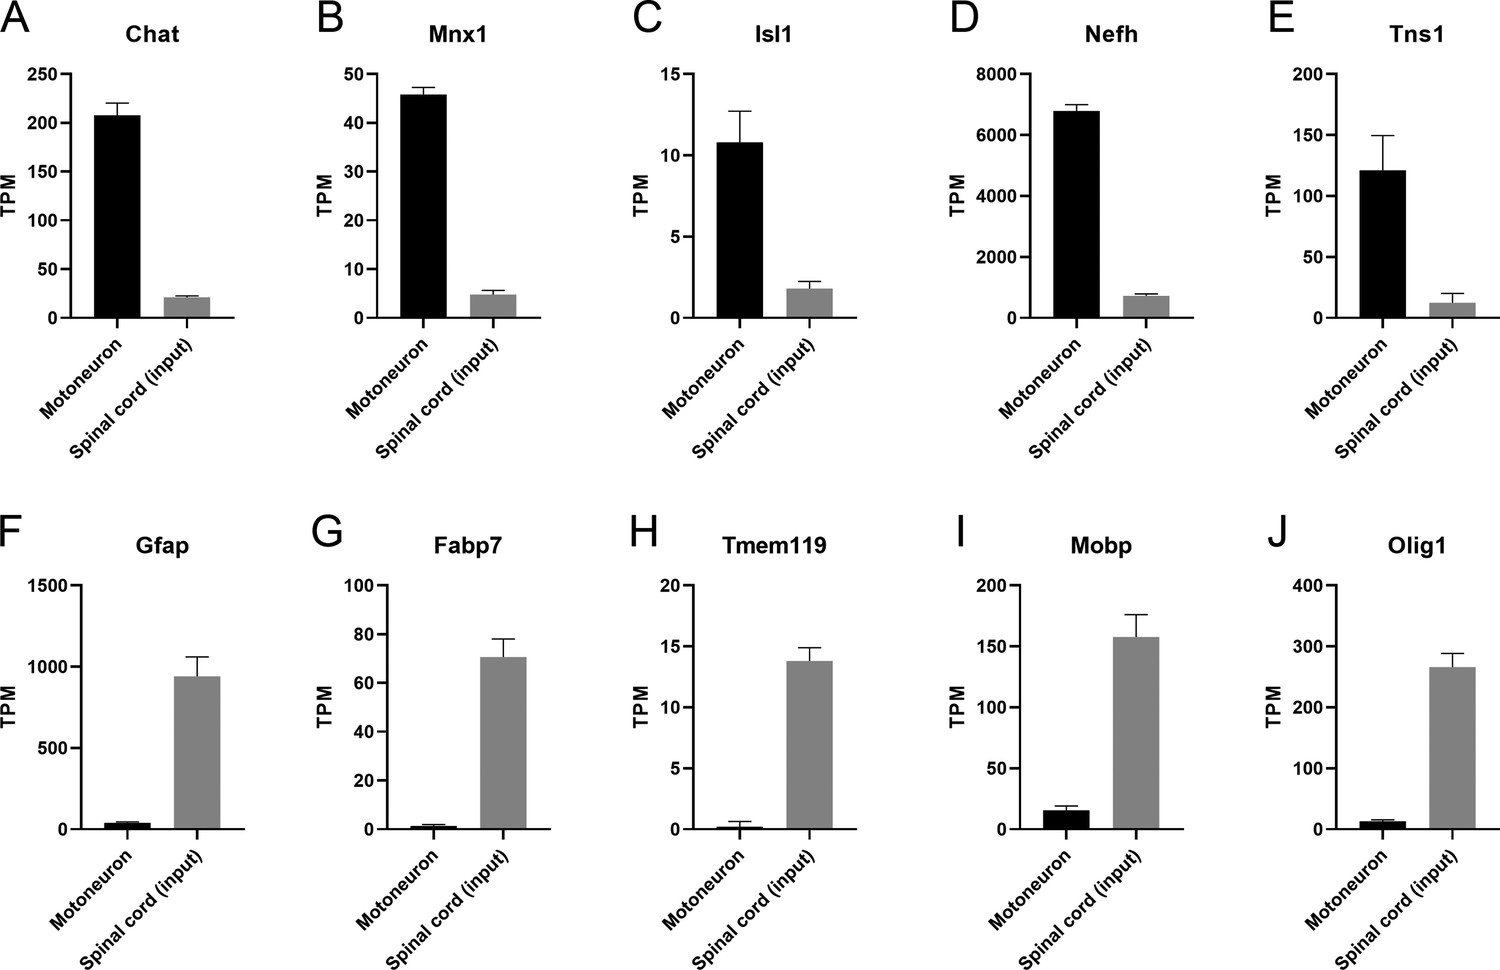
Transcripts per million (TPM) of cell type-specific transcripts in the spinal cord.
(A–E) Motoneuron-specific transcripts Chat, Mnx1, Isl1, Nefh, and Tns1 are found enriched in the immunoprecipitates compared to the inputs. (F–J) Glial-specific transcripts Gfap, Fabp7, Tmem119, Mobp, and Olig1 are found mostly in the inputs.
Figure 2—figure supplement 2
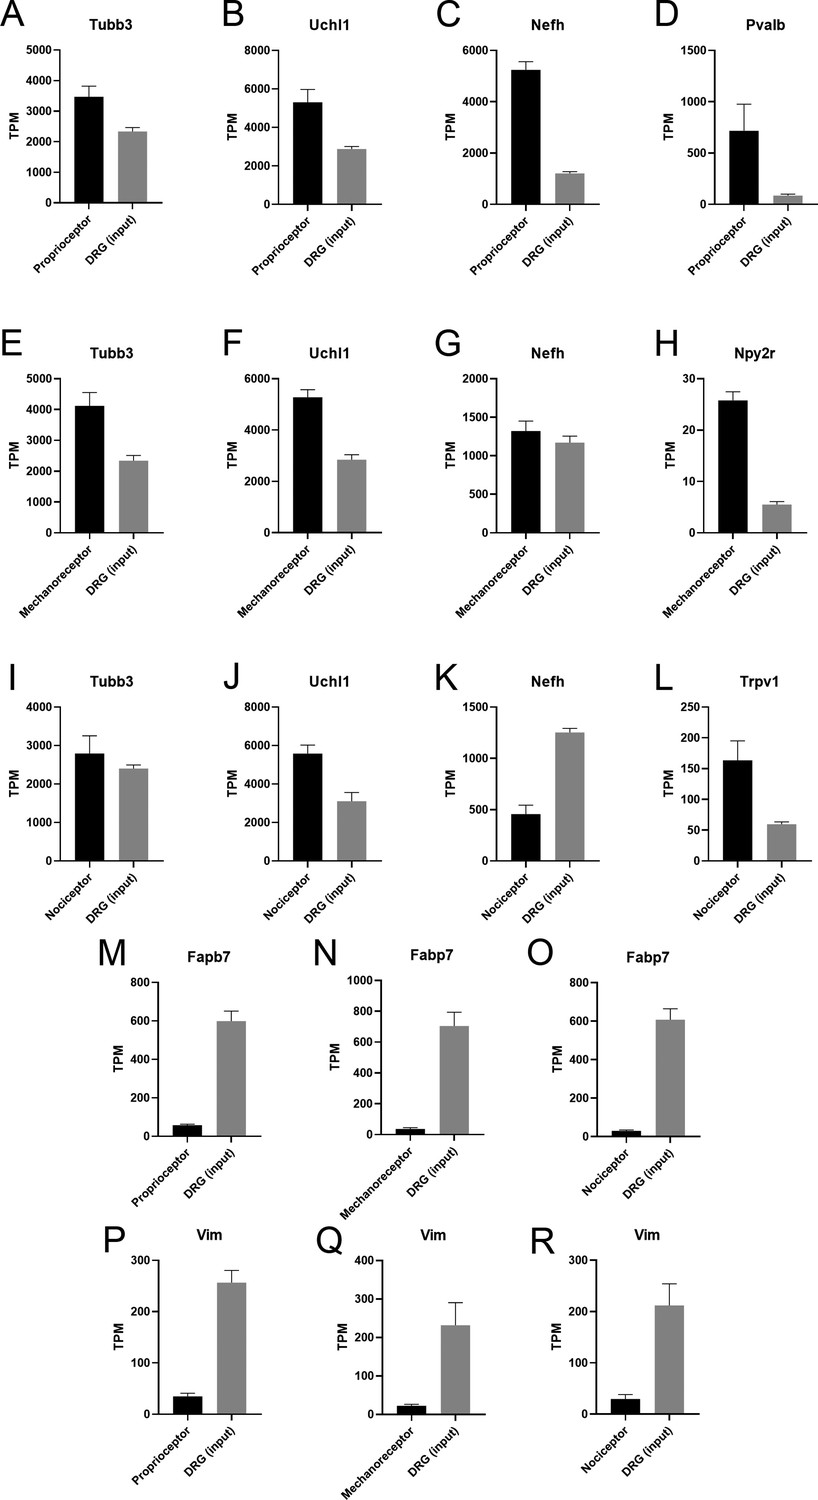
Transcripts per million (TPM) of cell type-specific transcripts in the dorsal root ganglia (DRG).
(A–D) Immunoprecipitates from proprioceptors have pan-neuron (Tubb3, Uchl1), myelinated-neuron (Nefh), and proprioceptive (Pvalb) specific transcripts enriched. (E–H) Cutaneous mechanoreceptors show enrichment of Tubb3, Uchl1, and Npy2r. (I–L) Nociceptors also show an enrichment of neuron-specific transcripts (Tubb3, Uchl1, Trpv1). (M–R) Glial transcripts (Fabp7, Vim) are depleted in all neuron subtypes.
Figure 2—figure supplement 3
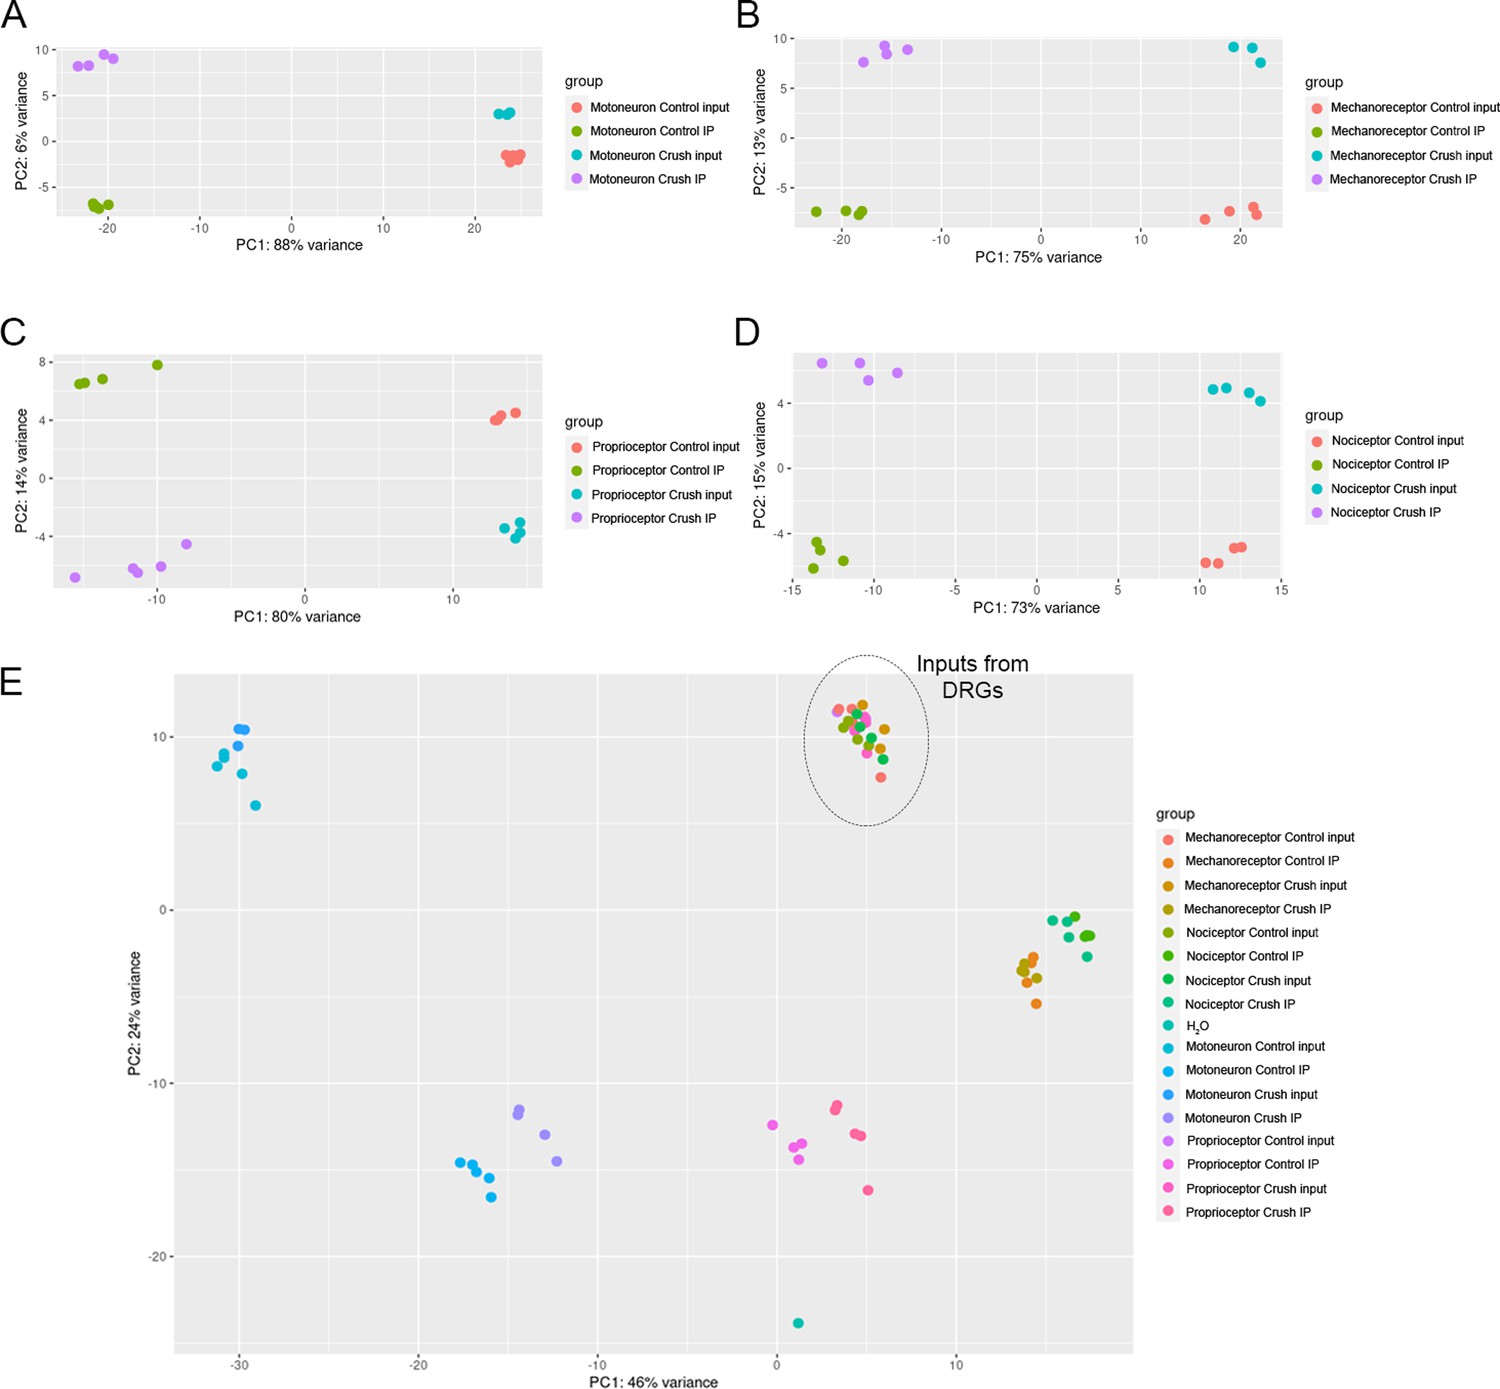
Principal component analysis (PCA) shows distinct transcriptome segregation according to the experimental group.
(A–D) PCA from immunoprecipitates (IPs) and inputs from ChAT-Cre/Ribotag (A), PV-Cre/Ribotag (B), Npy2r-Cre/Ribotag (C), and TRPV1-Cre/Ribotag (D) mice. (E) PCA including all samples from the four different transgenic mice.
Figure 3 with 4 supplements
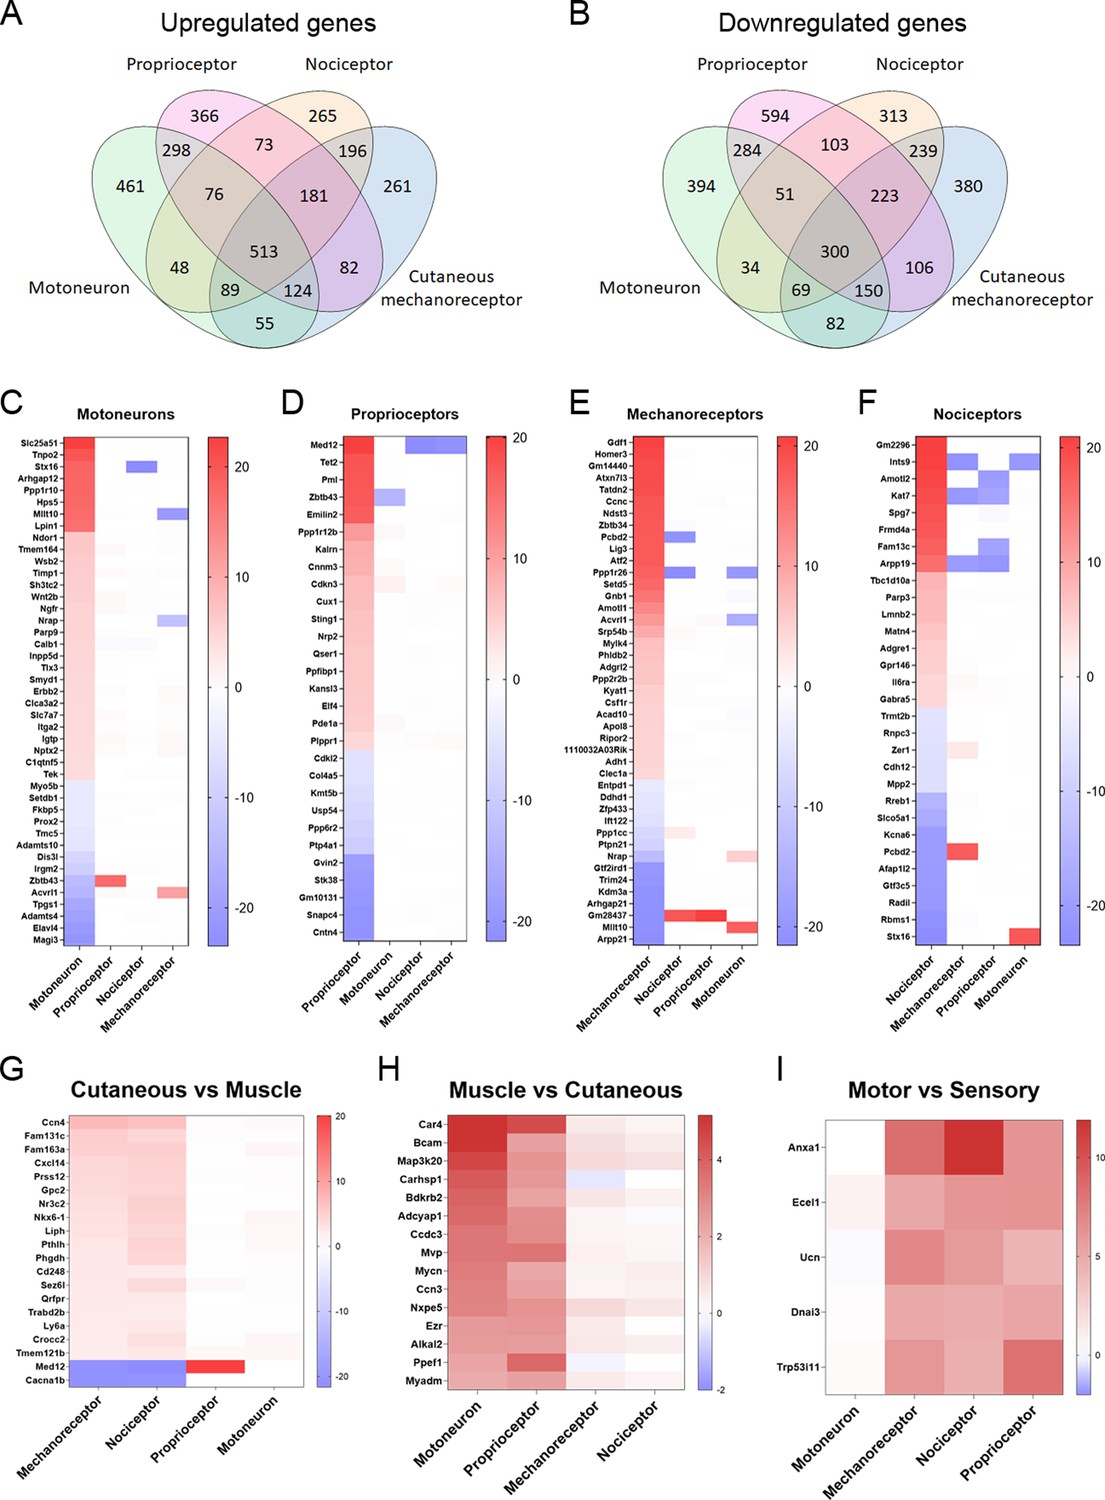
Differentially expressed genes (DEGs) vary between neuronal subtypes.
(A–B) Number of genes that were commonly upregulated or downregulated between populations or uniquely expressed in one of the neuron subtypes. (C–F) Significantly up- or downregulated genes in each population with a log2(fold-change) (log2(FC)) above 4 or below −4. The genes shown in these graphs exclude those that are significantly regulated above |1| in the same direction in two or more neuron types. (G–I) DEGs in groups of neuronal populations. DEGs with a log2(FC) above 2 or below −2 in cutaneous neurons (G), muscle neurons (H), or sensory neurons (I) are plotted from more upregulated to more downregulated.
Figure 3—figure supplement 1
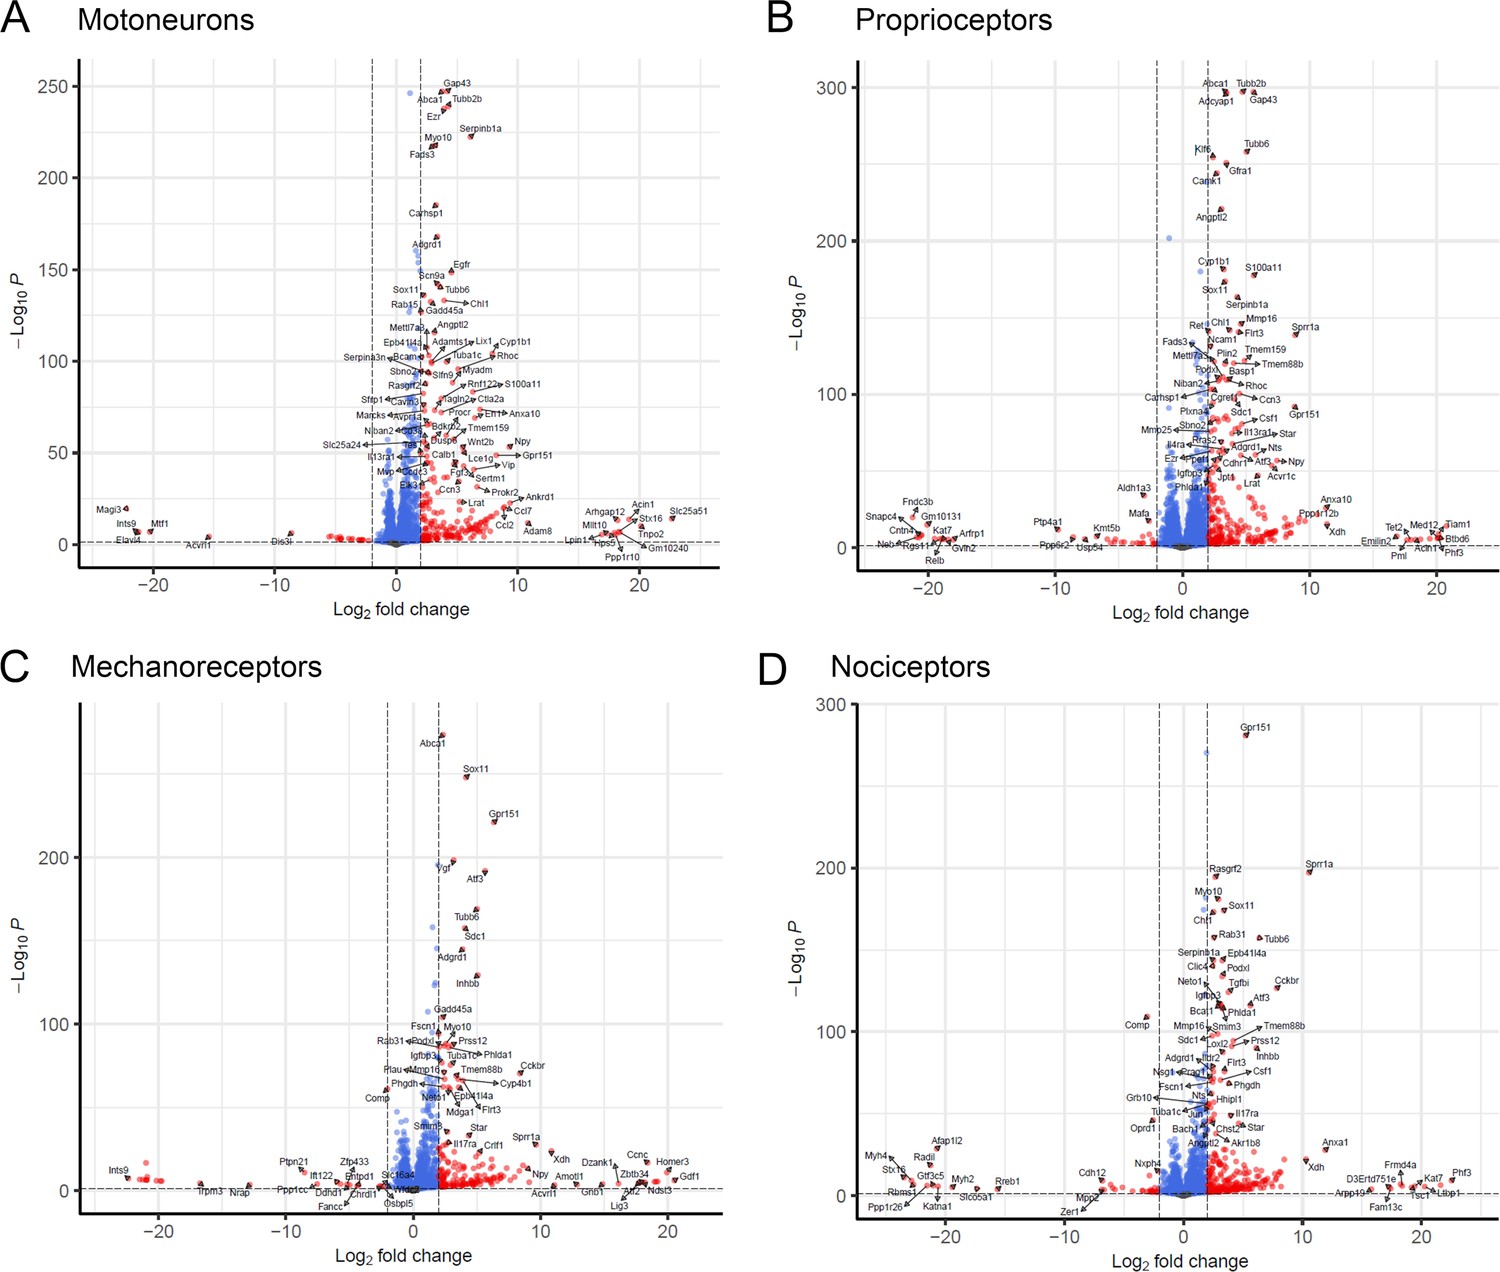
Volcano plots showing genes significantly up- or downregulated in each population.
Volcano plots showing genes significantly up- or downregulated in motoneurons (A), proprioceptors (B), cutaneous mechanoreceptors (C), and nociceptors (D) after a nerve injury. In red, those genes with p adjusted value below 0.05 and a log2 fold-change ≥ |2|.
Figure 3—figure supplement 2
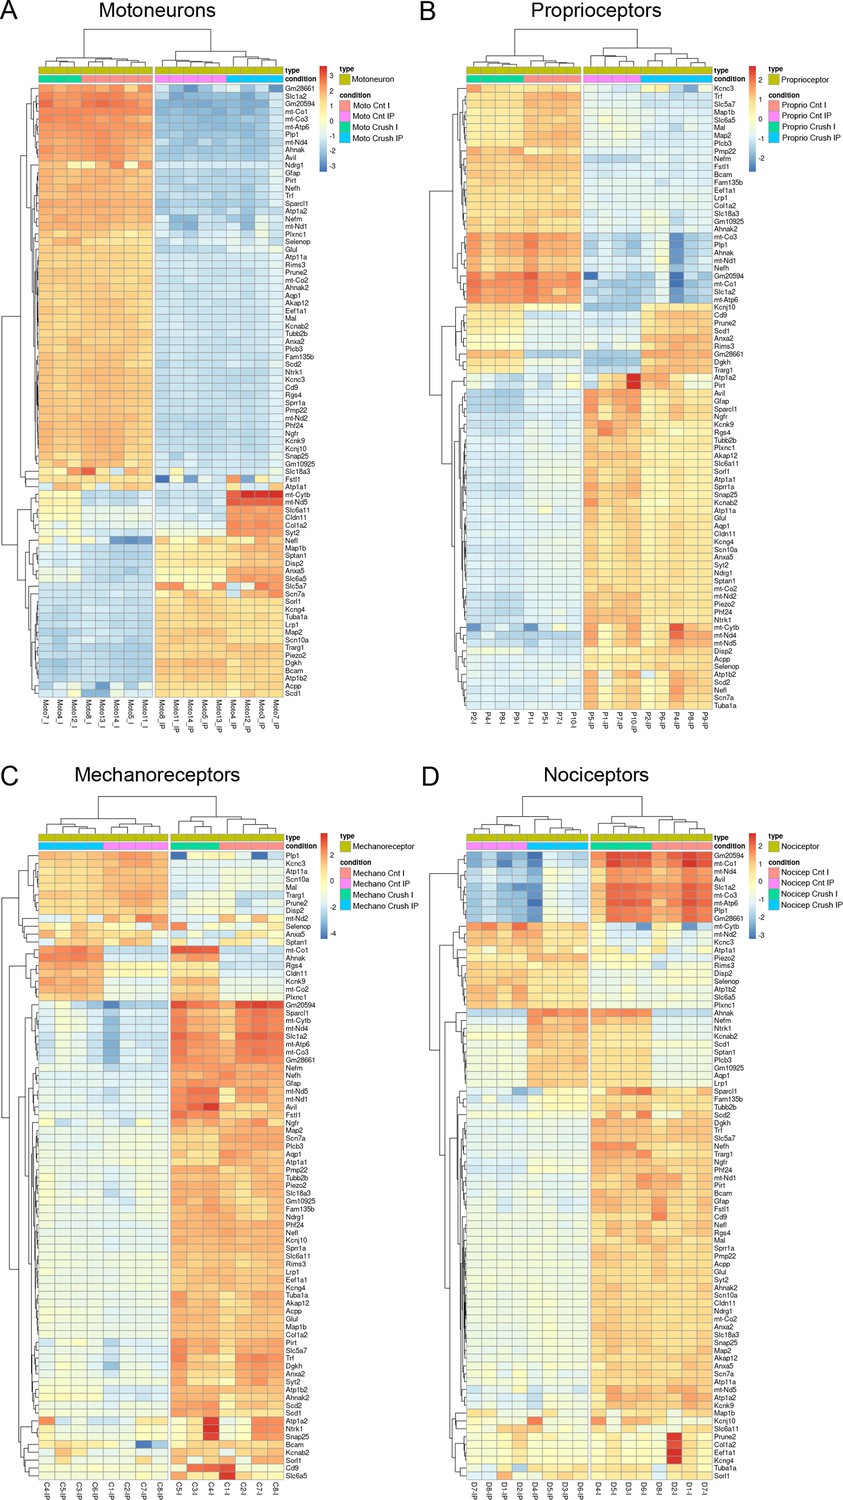
Hierarchical clustering of the 80 most variable genes in each population.
Hierarchical clustering of the 80 most variable genes in motoneurons (A), proprioceptors (B), cutaneous mechanoreceptors (C), and nociceptors (D) after a nerve injury. Analysis shows that samples cluster according to the experimental condition (crush vs control) and the group (IPs, immunoprecipitated vs I, input).
Figure 3—figure supplement 3
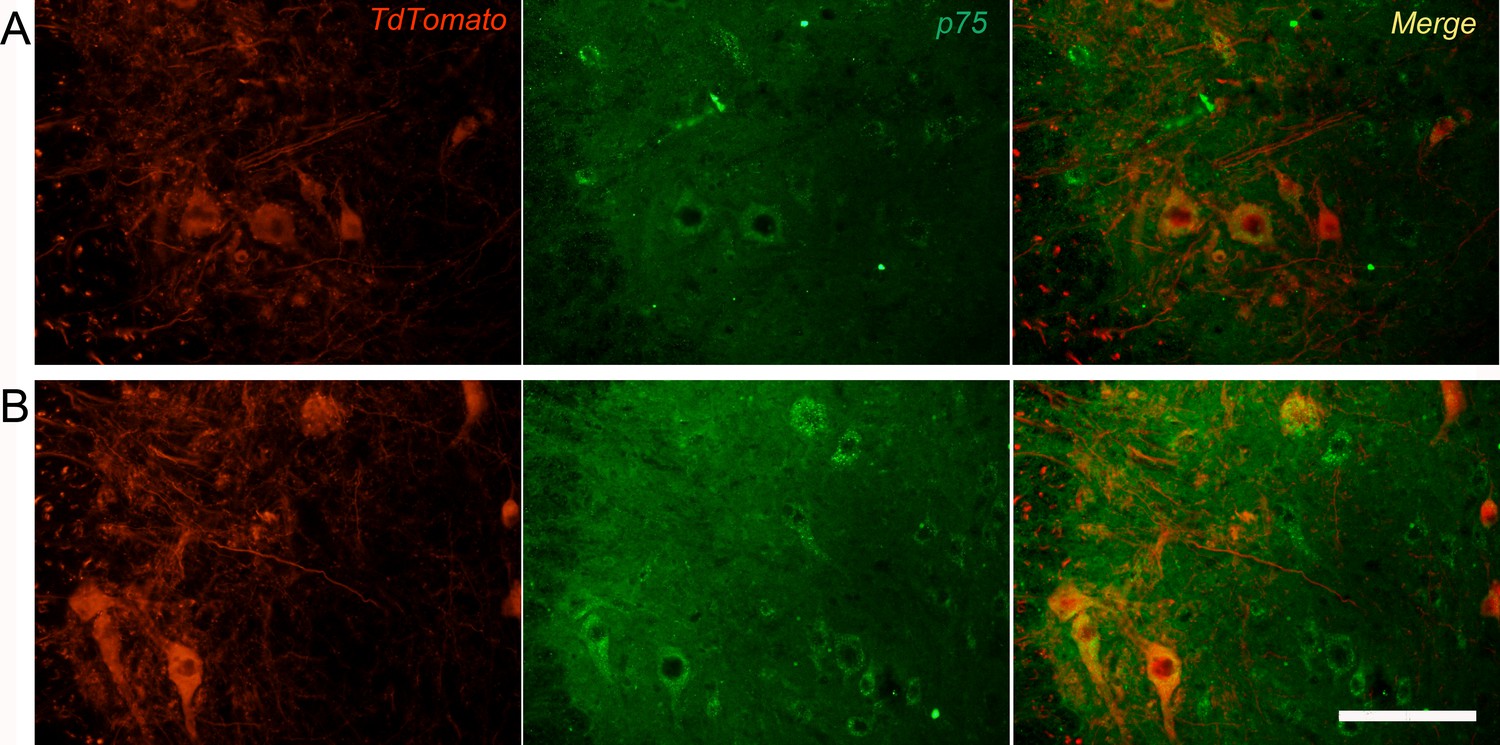
Overexpression of p75 on motoneurons 7 days after crush injury.
(A) Microscope images showing contralateral uninjured (A) or axotomized (B) motoneurons in the lumbar spinal cord, stained with p75 (TdT tomato, red; p75, green; merge, yellow). After injury, an upregulation of p75 in motoneurons is observed. Scale bar: 100 μm.
Figure 3—figure supplement 4
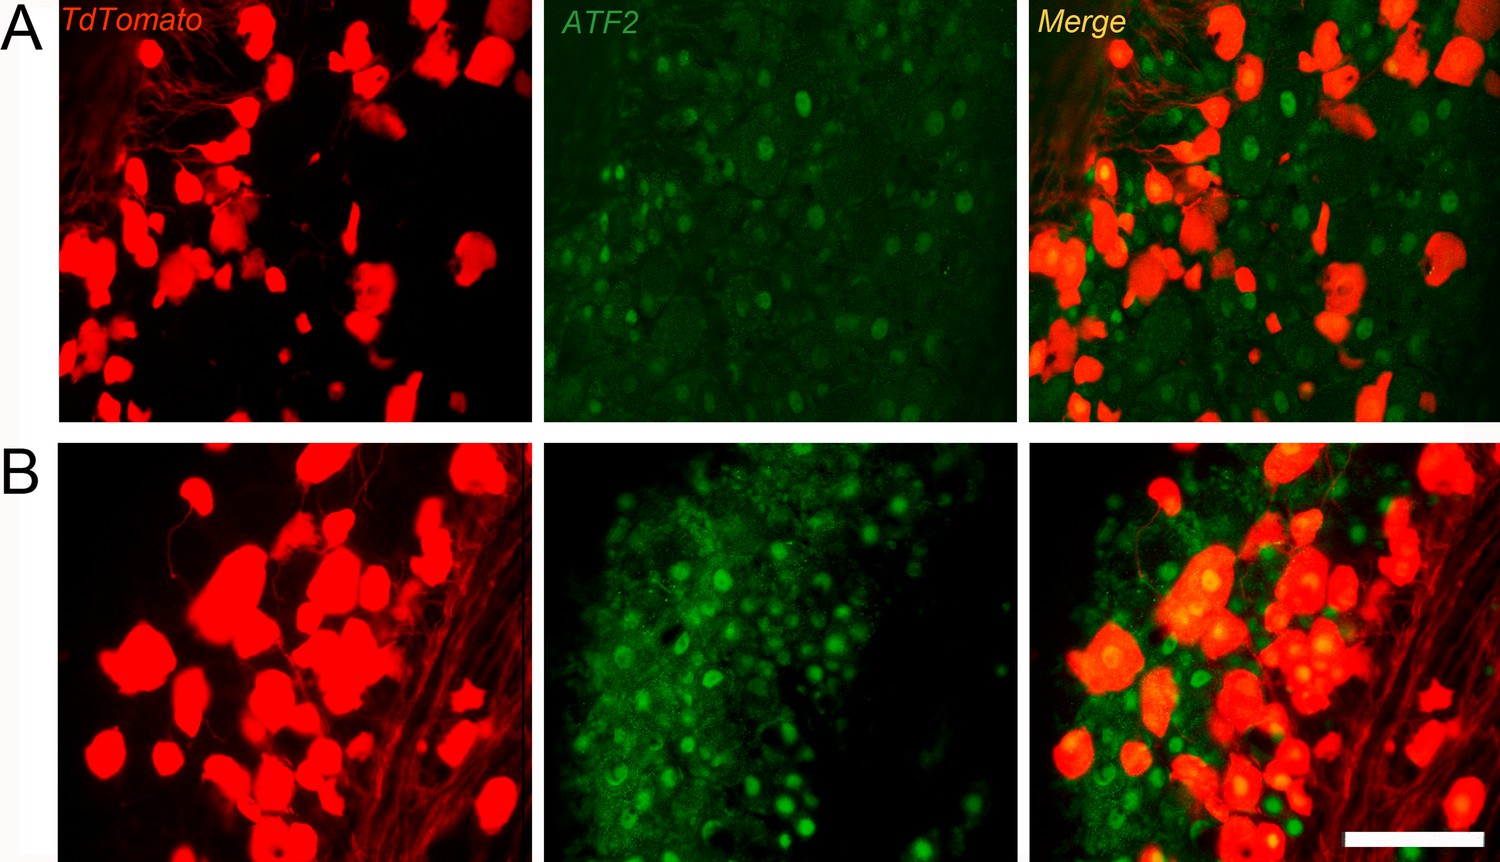
Overexpression of AFT2 on cutaneous mechanoreceptors 7 days after crush injury.
Microscope images showing contralateral uninjured (A) or axotomized (B) cutaneous mechanoreceptors (G–L) in dorsal root ganglia (DRG) stained with ATF2 (TdT tomato, red; ATF2, green; merge, yellow). After injury, an increased number of ATF2-positive nuclei in cutaneous mechanoreceptors are observed. Scale bar: 50 μm.
Figure 4
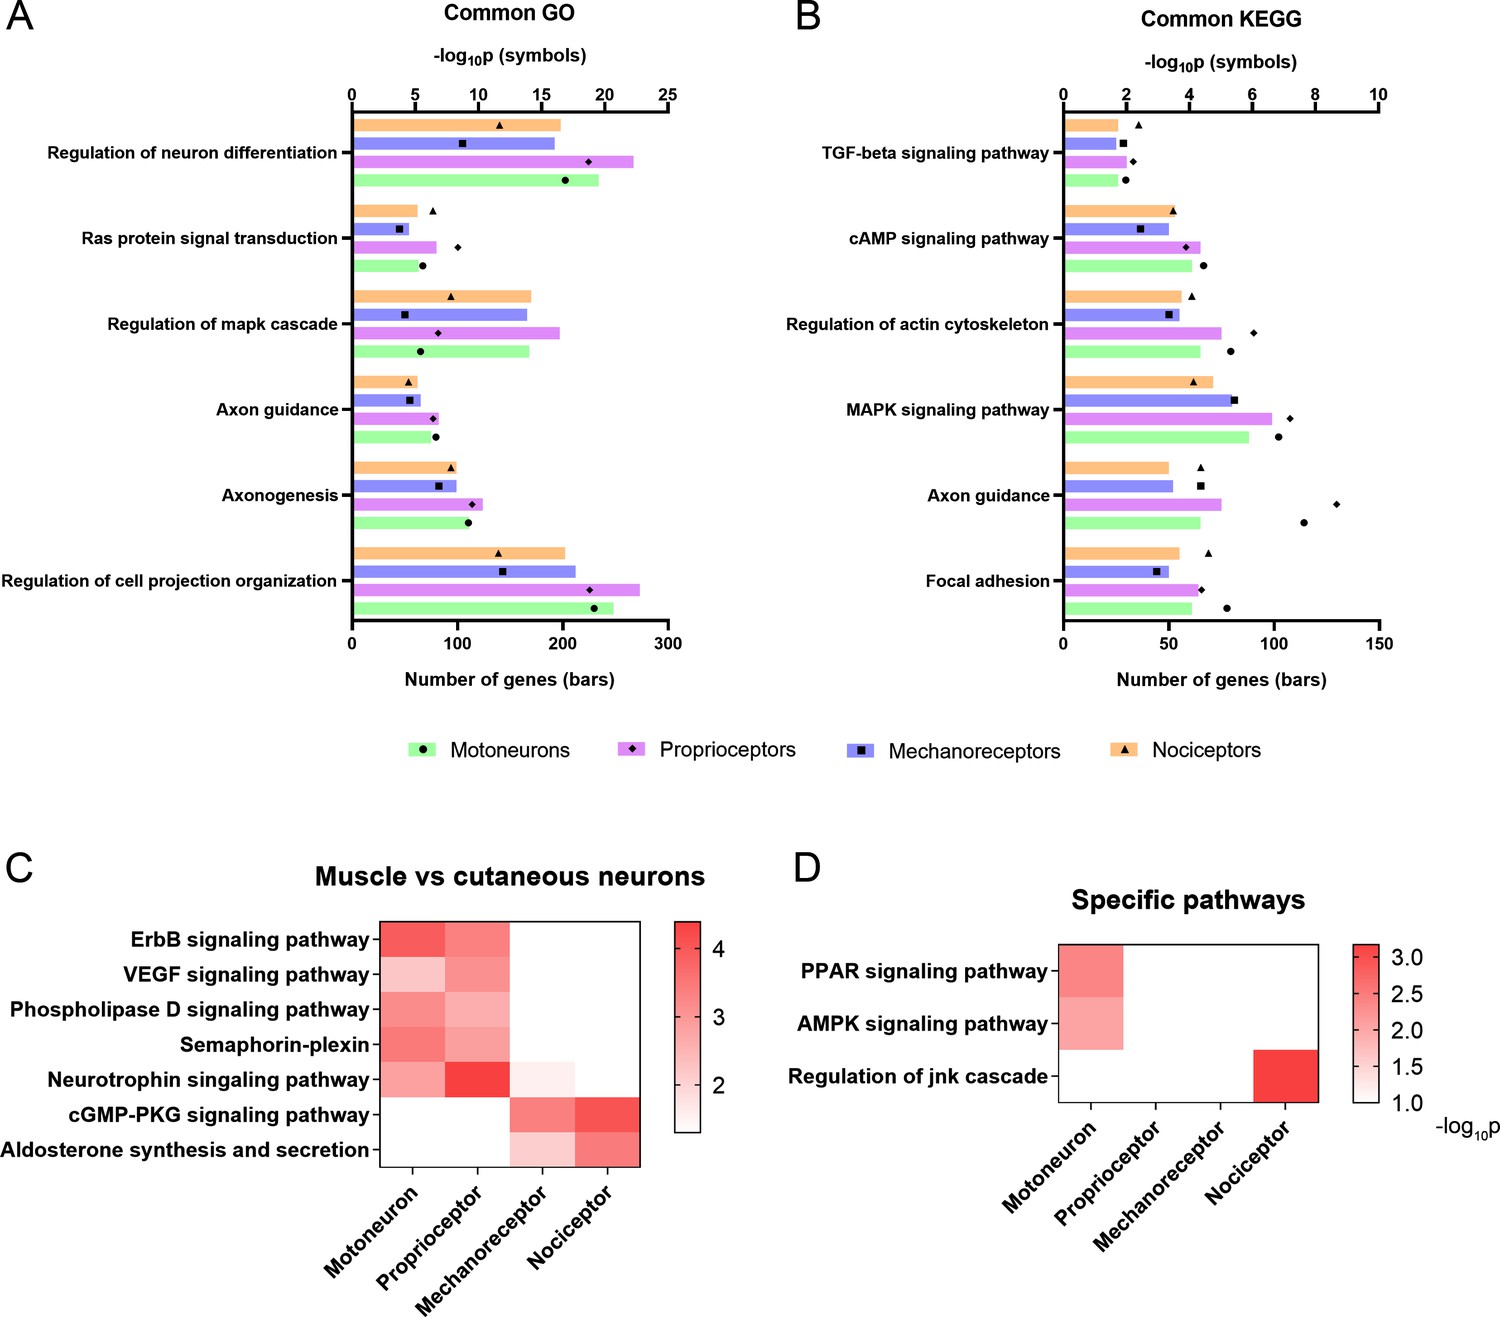
Activation of relevant pathways in axon regeneration.
(A) Six of the most relevant Gene Ontology (GO) processes that are significantly activated by all the studied neurons after injury. (B) Selection of relevant pathways enriched in neurons after injury according to the Kyoto Encyclopedia of Genes and Genomes (KEGG) database. (C) Some GO processes (semaphoring-plexin) and KEGG pathways (all the others) enriched in specific neuron groups. (D) Examples of relevant pathways enriched in a specific neuron subtype. TGF: transforming growth factor, cAMP: cyclic adenosine monophosphate, MAPK: mitogen-activated protein kinases, VEGF: vascular endothelial growth factor, cGMP-PKC: cyclic guanosine monophosphate-protein kinase C, PPAR: peroxisome proliferator-activated receptor, AMPK: AMP-activated protein kinase, JNK: c-Jun N-terminal kinase.
Figure 5 with 1 supplement
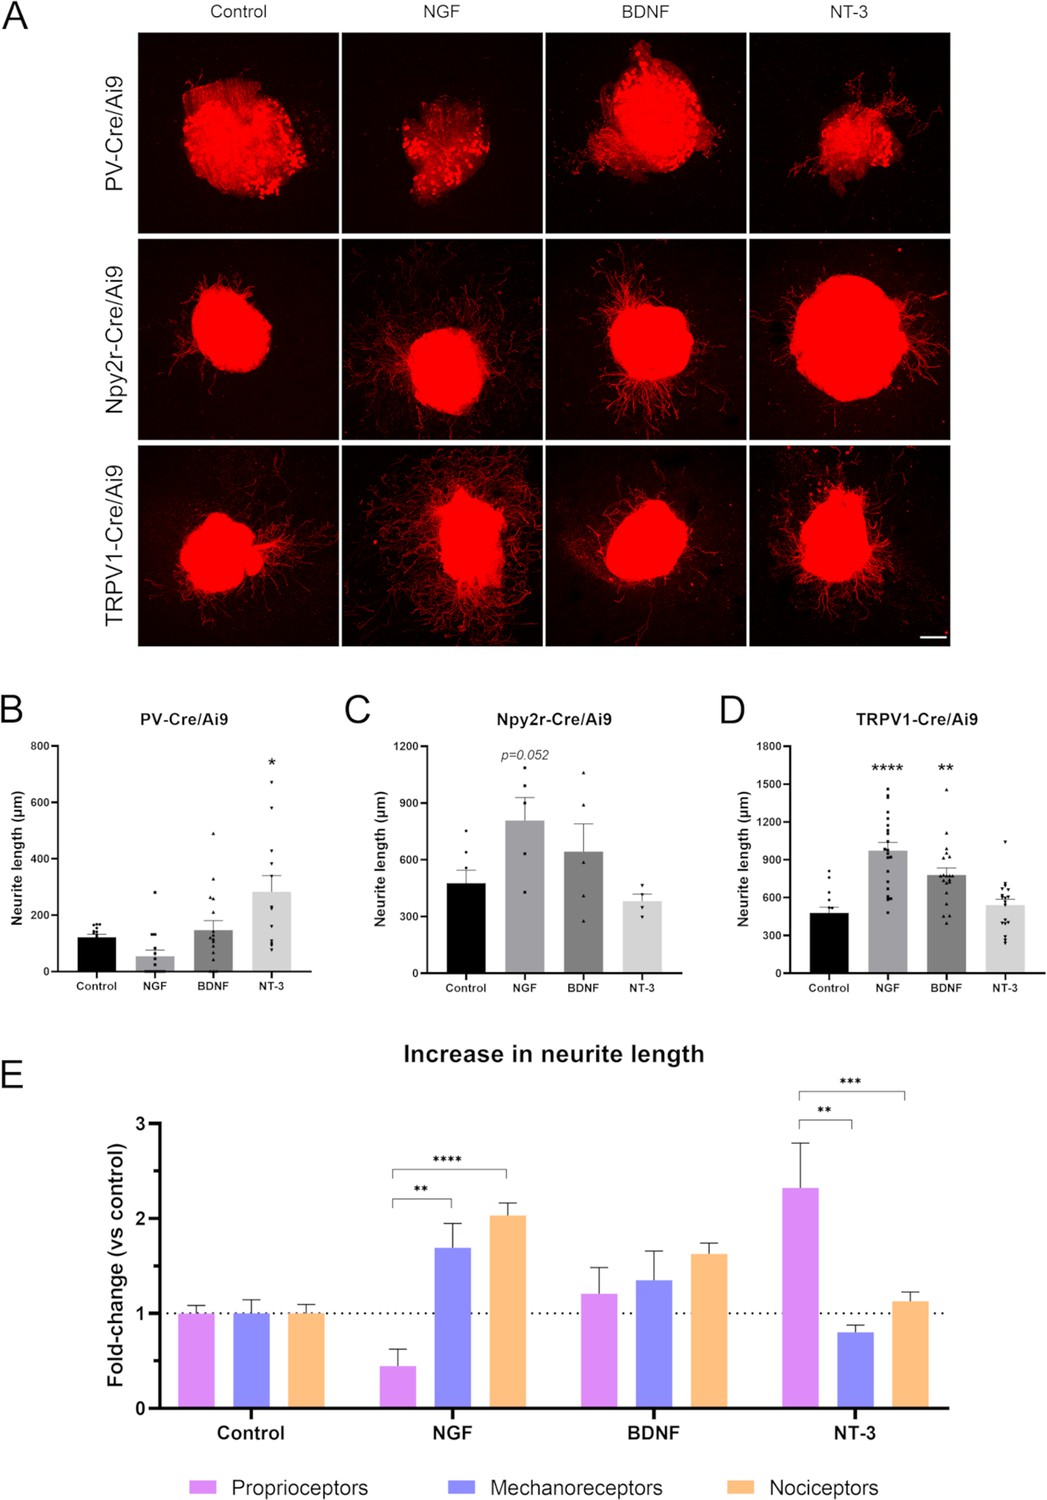
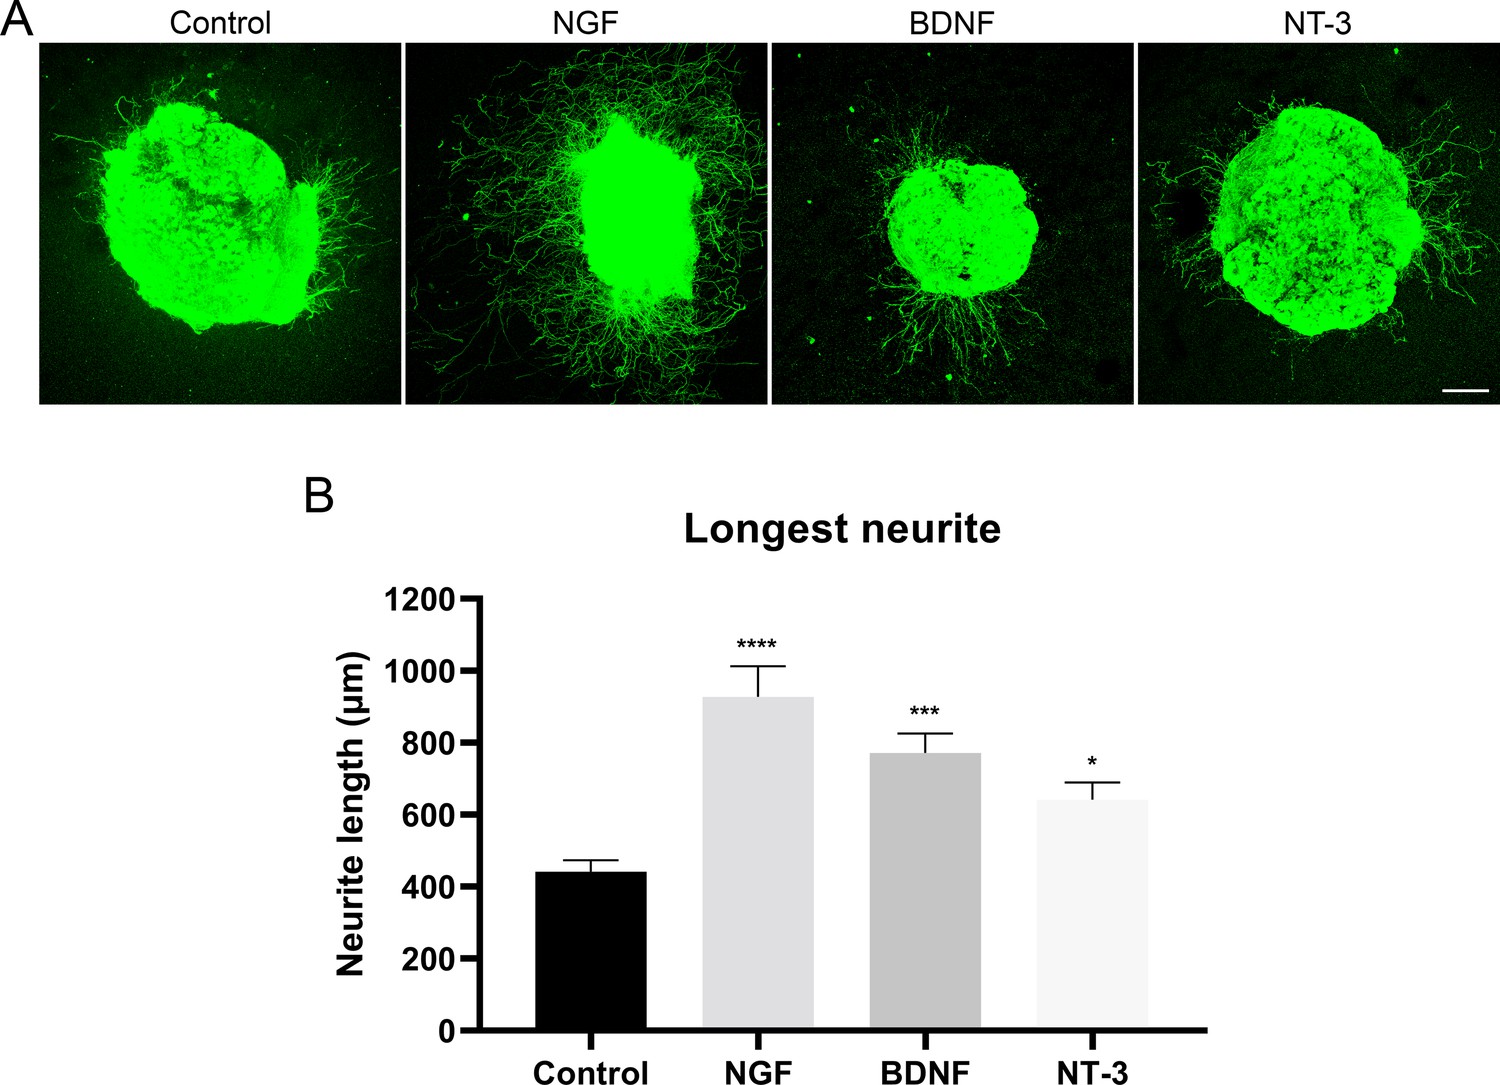
Neurite extension in PV-Cre/Ai9, Npy2r-Cre/Ai9, and TRPV1-Cre/Ai9 dorsal root ganglia (DRG) explants.
(A) Microscope images of the neurite outgrowth of each neuron population in explants with nerve growth factor (NGF), brain-derived neurotrophic factor (BDNF), and neurotrophin-3 (NT-3). (B–D) Quantification of the longest neurite in each condition. *p<0.05 vs control as calculated by one-way ANOVA followed by Bonferroni’s multiple comparisons test (PV-Cre/Ai9 and Npy2r-Cre/Ai9) or by Kruskal-Wallis test followed by Dunn’s multiple comparisons test (TRPV1-Cre/Ai9). (D) Comparison of the increase in neurite length in proprioceptors, mechanoreceptors, and nociceptors. The increase is plotted as a fold-change vs each control to compare the effect of the neurotrophic factors. **p<0.01, ***p<0.001, ****p<0.0001 vs proprioceptors as calculated by a two-way ANOVA and followed by a Tukey’s post hoc test. Scale bar: 200 µm.
Figure 5—figure supplement 1
Neurite extension in the dorsal root ganglia (DRG).
(A) Microscope images of the neurite outgrowth in DRG explants with nerve growth factor (NGF), brain-derived neurotrophic factor (BDNF), and neurotrophin-3 (NT-3). Neurites were stained with PGP 9.5 (in green). (B) Quantification of the longest neurite in each condition (n=28–38/group). *p<0.05, ***p<0.001, ****p<0.0001 vs control as calculated by a Kruskal-Wallis test followed by Dunn’s multiple comparisons test. Scale bar: 200 µm.
Figure 6 with 1 supplement
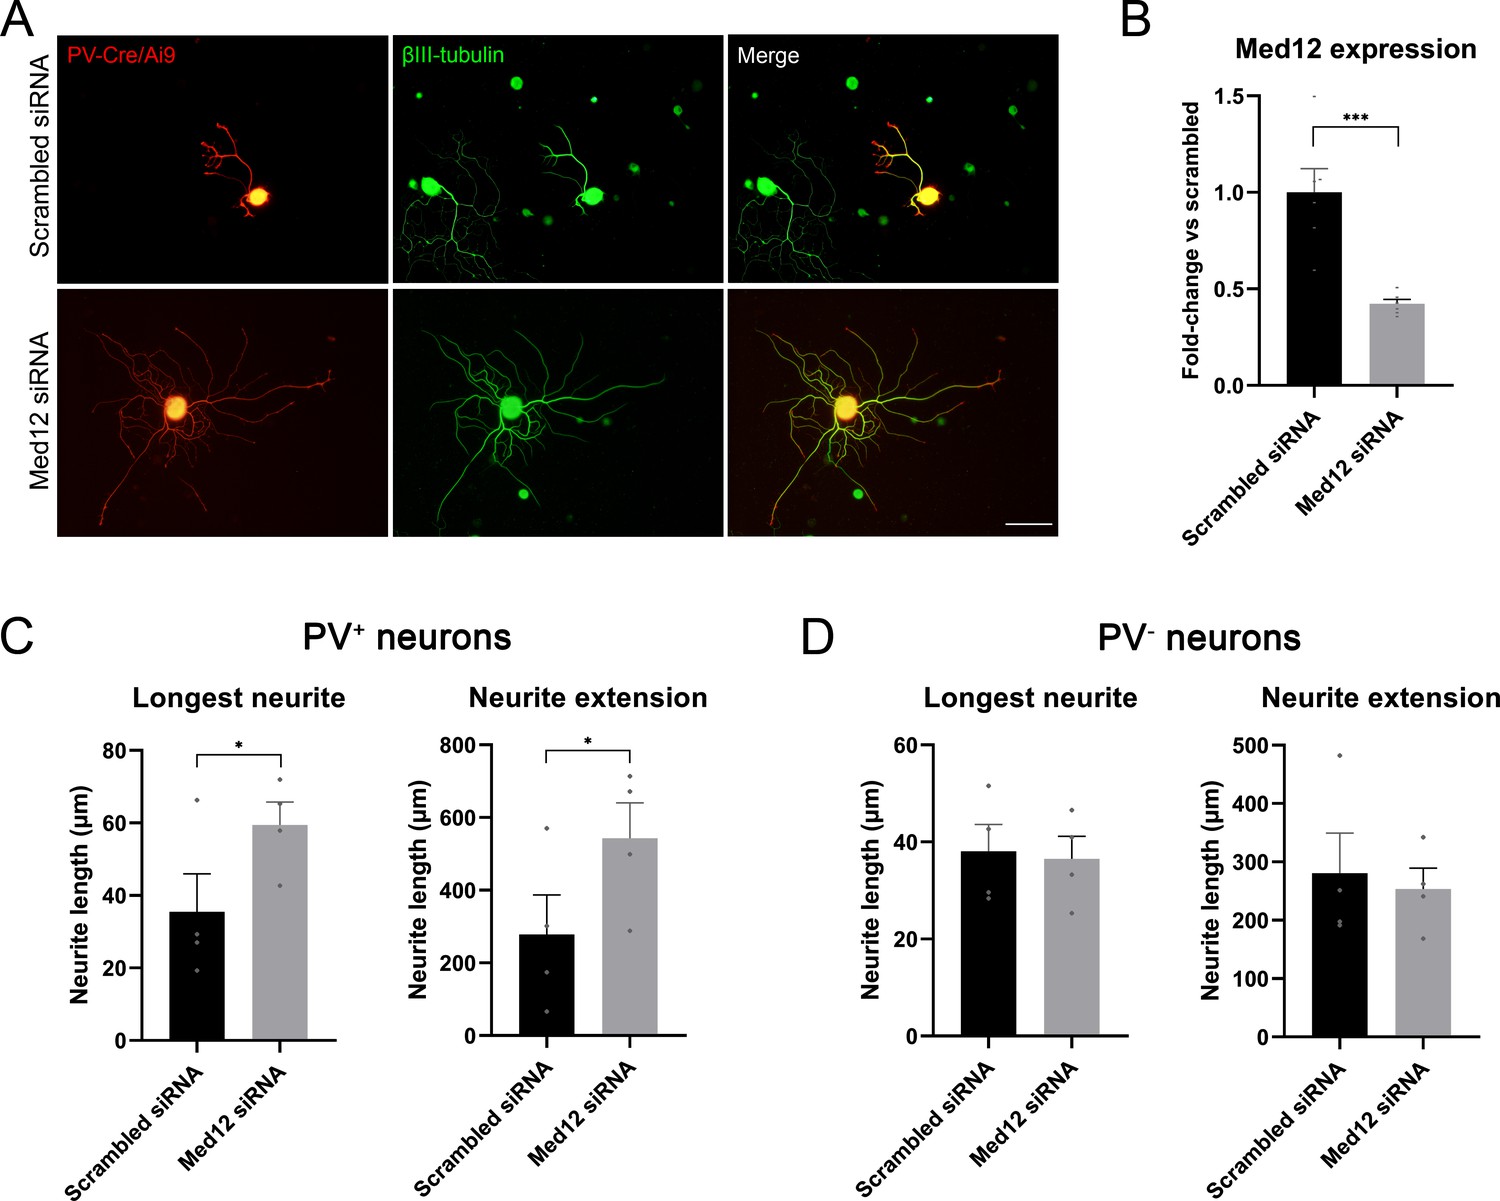
Knockdown of Med12 in dissociated dorsal root ganglia (DRG) cultures.
(A) Microscope images from proprioceptors (in red) in cultures with scrambled or Med12 siRNA. βIII-tubulin was used as a pan-neuronal marker (in green). (B) Med12 expression measured by qPCR and expressed as fold-change vs scrambled. (C) Quantification of the neurite length in PV+ neurons (fluorescent neurons in PV-Cre/Ai9). The mean of the longest neurite and the total length per neuron in each culture are plotted. (D) Quantification of neurite length in PV− neurons, labeled by βIII-tubulin. *p<0.05, ***p<0.001 as calculated by t-test. Scale bar: 100 µm.
Figure 6—figure supplement 1
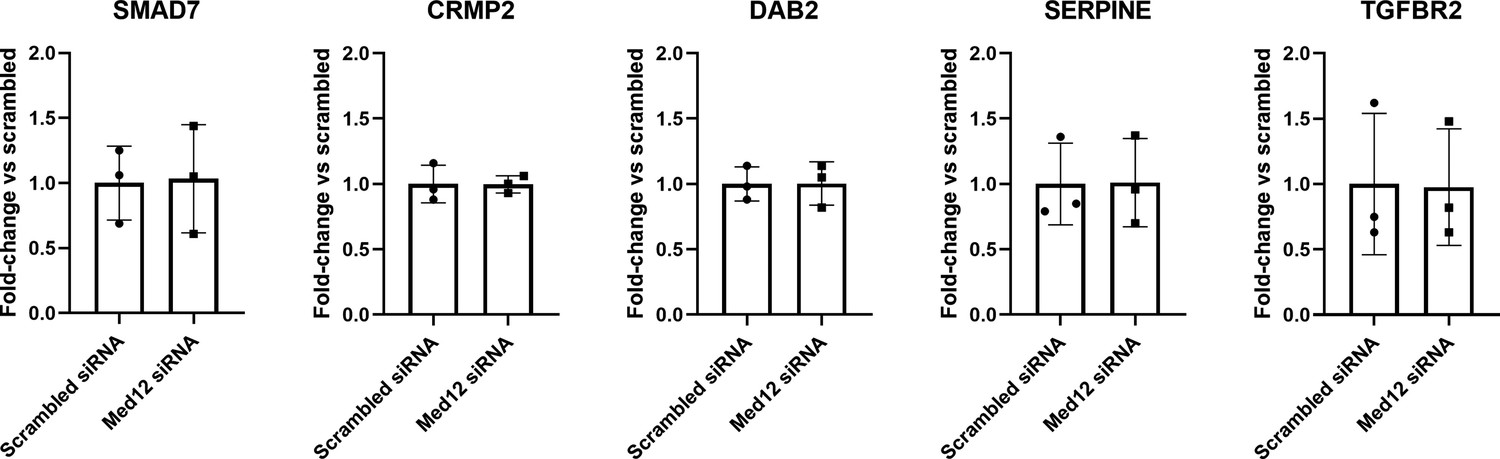
Gene expression of TGF-β pathway mediators measured by qPCR and expressed as fold-change vs scrambled.
Tables
Table 1
Antibodies used for histological validation of TRPV1-Cre/Ai9.
| Sample | Thickness | Immunofluorescence |
|---|---|---|
| DRG | 15 µm | Parvalbumin (1:1000; Swant Cat# PV-28, RRID:AB_2315235) Neurofilament H (1:1000; BioLegend Cat# 801701, RRID:AB_2715852) CGRP (1:200; Millipore Cat# PC205L, RRID:AB_2068524) Calbindin D-28K (1:200, Millipore Cat# AB1778, RRID:AB_2068336) Isolectin B4 (10 µg/mL; Vector Laboratories Cat# L-1104, RRID:AB_2336498) Anti-lectin I (1:500; Vector Laboratories Cat# AS-2104, RRID:AB_2314660) |
| Skin | 50 m | PGP 9.5 (1:500; Spring Bioscience Cat# E3340, RRID:AB_1661545) |
Table 2
Number of pools of each type used for the RNA-sequencing analysis.
| Control | Crush | |||||
|---|---|---|---|---|---|---|
| Female | Male | Total | Female | Male | Total | |
| ChAT-Cre/Ribotag | 3 | 2 | 5 | 2 | 2 | 4 |
| PV-Cre/Ribotag | 2 | 2 | 4 | 3 | 2 | 5 |
| Npy2r-Cre/Ribotag | 2 | 2 | 4 | 2 | 2 | 4 |
| TRPV1-Cre/Ribotag | 2 | 2 | 4 | 2 | 2 | 4 |
Table 3
Sequences of the siRNAs used in the cultures.
| siRNA | Sequence |
|---|---|
| Scrambled | CCUAAGGUUAAGUCGCCCUCG |
| CGAGGGCGACUUAACCUUAGG | |
| Med12_1 | AAGAACACCAUCUACUGUAAC |
| GUUACAGUAGAUGGUGUUCUU | |
| Med12_2 | AAGAACGUCAACUUCAAUCCU |
| AGGAUUGAAGUUGACGUUCUU | |
| Med12_3 | AAGCAGCUAAUGCAUGAGGCA |
| UGCCUCAGCAUUAGCUGCUU | |
| Med12_4 | AAGUGAAAGUGAGCGAGUAGA |
| UCUACUCGCUCACUUUCACUU |
Table 4
Primers used for qPCR analysis.
| Gene | Direction | Sequence |
|---|---|---|
| Actin | Forward | ctaaggccaaccgtgaaaag |
| Reverse | accagaggcatacagggaca | |
| Med12 | Forward | agaaggttcaccaactgt |
| Reverse | ctccttcttgaagatggaat | |
| Smad7 | Forward | cacagaggatcttgtccccg |
| Reverse | ctggtctttcctcctgcgtt | |
| Crmp2 | Forward | cacacccagctagggagactt |
| Reverse | gtttaccccgtggtccttca | |
| Dab2 | Forward | tcctggagagtcctcagagc |
| Reverse | acctttgaacctggccaaca | |
| Serpine | Forward | atcgctgcaccctttgagaa |
| Reverse | atgcgggctgagatgacaaa | |
| Tgfbr2 | Forward | aaatggaagcccagaaagatgc |
| Reverse | tgcaggacttctggttgtcg |
Additional files
-
Supplementary file 1
Expression of neurotrophin and GDNF receptors in immunoprecipitates compared to inputs.
- https://cdn.elifesciences.org/articles/91316/elife-91316-supp1-v1.xlsx
-
Supplementary file 2
Differentially expressed gene (DEG) in each neuron subpopulation.
- https://cdn.elifesciences.org/articles/91316/elife-91316-supp2-v1.xlsx
-
Supplementary file 3
Pathway enrichment of each neuron subpopulation in response to injury.
- https://cdn.elifesciences.org/articles/91316/elife-91316-supp3-v1.xlsx
-
MDAR checklist
- https://cdn.elifesciences.org/articles/91316/elife-91316-mdarchecklist1-v1.pdf
Download links
A two-part list of links to download the article, or parts of the article, in various formats.
Downloads (link to download the article as PDF)
Open citations (links to open the citations from this article in various online reference manager services)
Cite this article (links to download the citations from this article in formats compatible with various reference manager tools)
Neuron-specific RNA-sequencing reveals different responses in peripheral neurons after nerve injury
eLife 12:RP91316.
https://doi.org/10.7554/eLife.91316.3


