Regulation of chromatin architecture by transcription factor binding
- Department of Chemistry, 100 Washington Square East, Silver Building, New York University, United States
- Simons Center for Computational Physical Chemistry, 24 Waverly Place, Silver Building, New York University, United States
- Courant Institute of Mathematical Sciences, New York University, United States
- New York University-East China Normal University Center for Computational Chemistry, New York University Shanghai, China
Figures
Figure 1 with 7 supplements

Transcription factor (TF) binding location drives the formation of microdomains.
50-nucleosome chromatin fibers with: (A) 44 bp linkers, (B) 62 bp linkers, (C) 26 bp linkers, and (D) Nonuniform linkers simulated with four different TF topologies. At the top, for the 44 bp system, we show an ideal zigzag fiber coloring in red the DNA with TF binding regions. Arcs show the possible binding geometries. The binding positions and geometries that define each topology are the same in all systems. For each system, we show the cumulative contact map calculated from 10 independent trajectories and a representative fiber structure also showing in red the TF binding regions. Additional representative structures are shown in Figure 1—figure supplements 3–6.
Figure 1—figure supplement 1
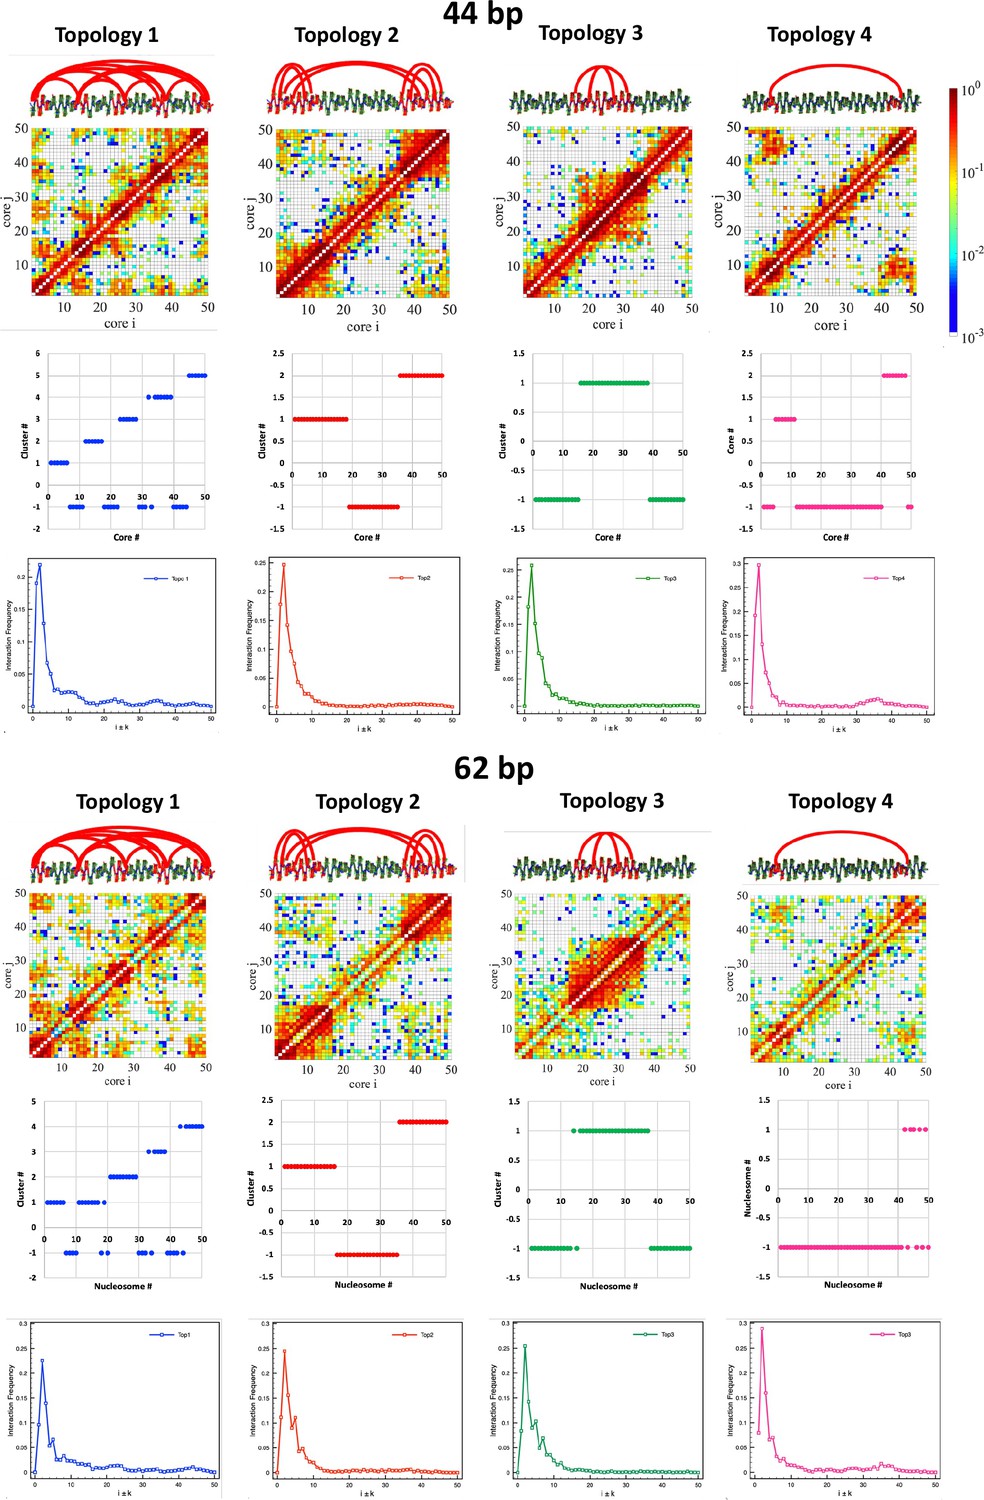
DBSCAN clustering supports the formation of microdomains.
DBSCAN clustering (Ester et al., 1996) was performed on distance matrices obtained from the contact maps with nucleosome resolution (d=1/freq) and using minpoint = 5 and epsilon = 3 and 2 for the 62 and 44 bp systems, respectively. Internucleosome interactions in one dimension are plotted as Int.Freq. vs. i±k.
Figure 1—figure supplement 2
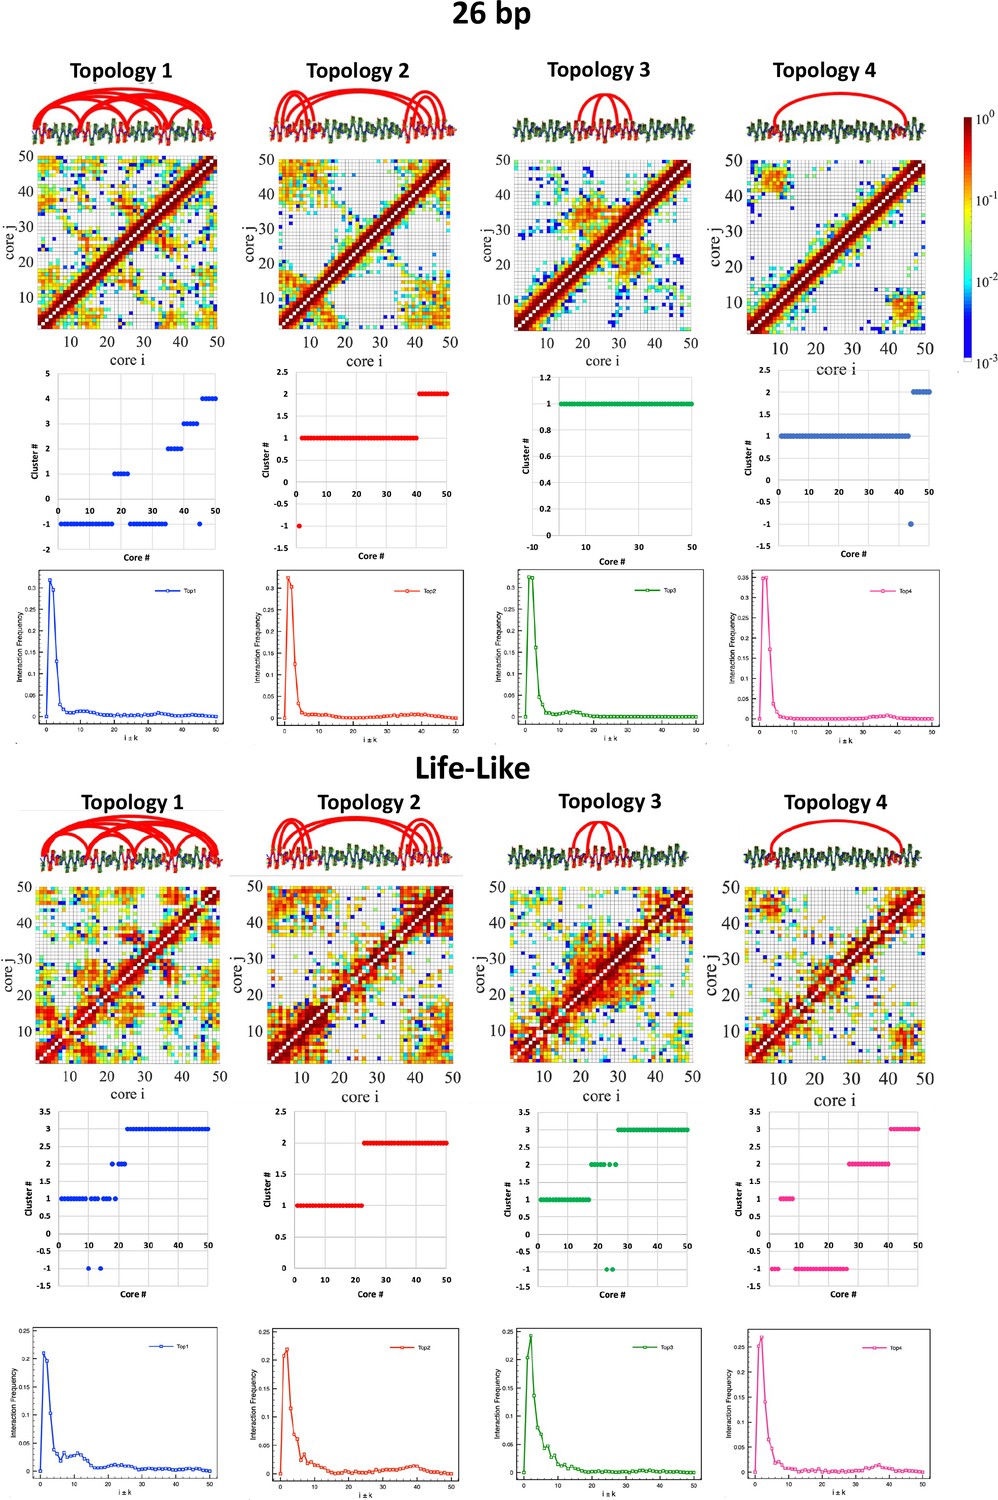
DBSCAN clustering supports the formation of microdomains.
DBSCAN clustering (Ester et al., 1996) was performed on distance matrices obtained from the contact maps with nucleosome resolution (d=1/freq) and using minpoint = 5 and epsilon = 2 and 1.4 for the life-like and 26 bp system, respectively. Internucleosome interactions in one dimension are plotted as Int.Freq. vs. i±k.
Figure 1—figure supplement 3
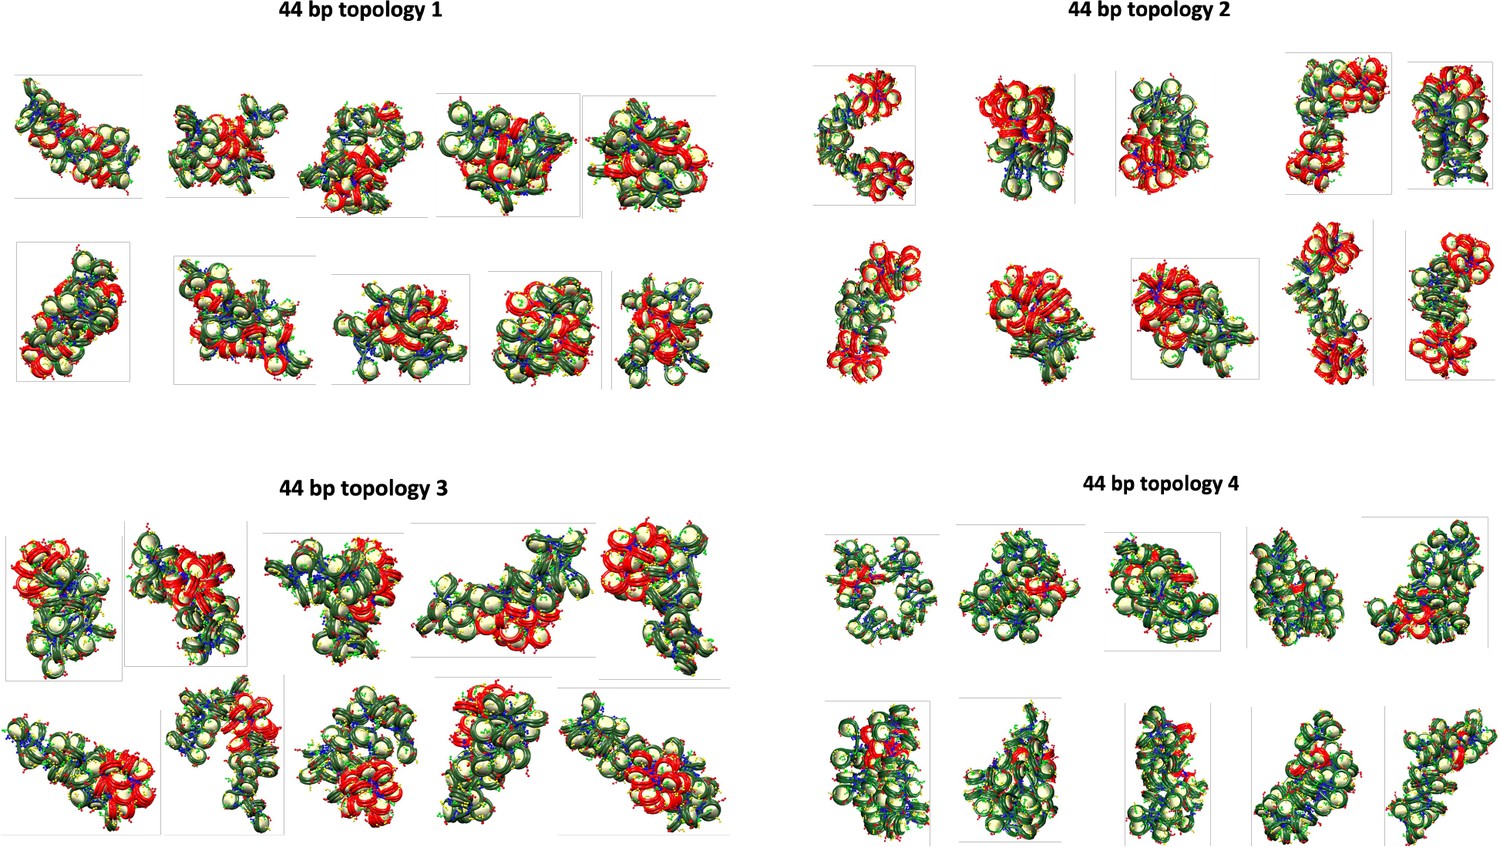
Final configurations for each of the 10 independent trajectories of the 44 bp system with four different transcription factor (TF) binding topologies.
Figure 1—figure supplement 4
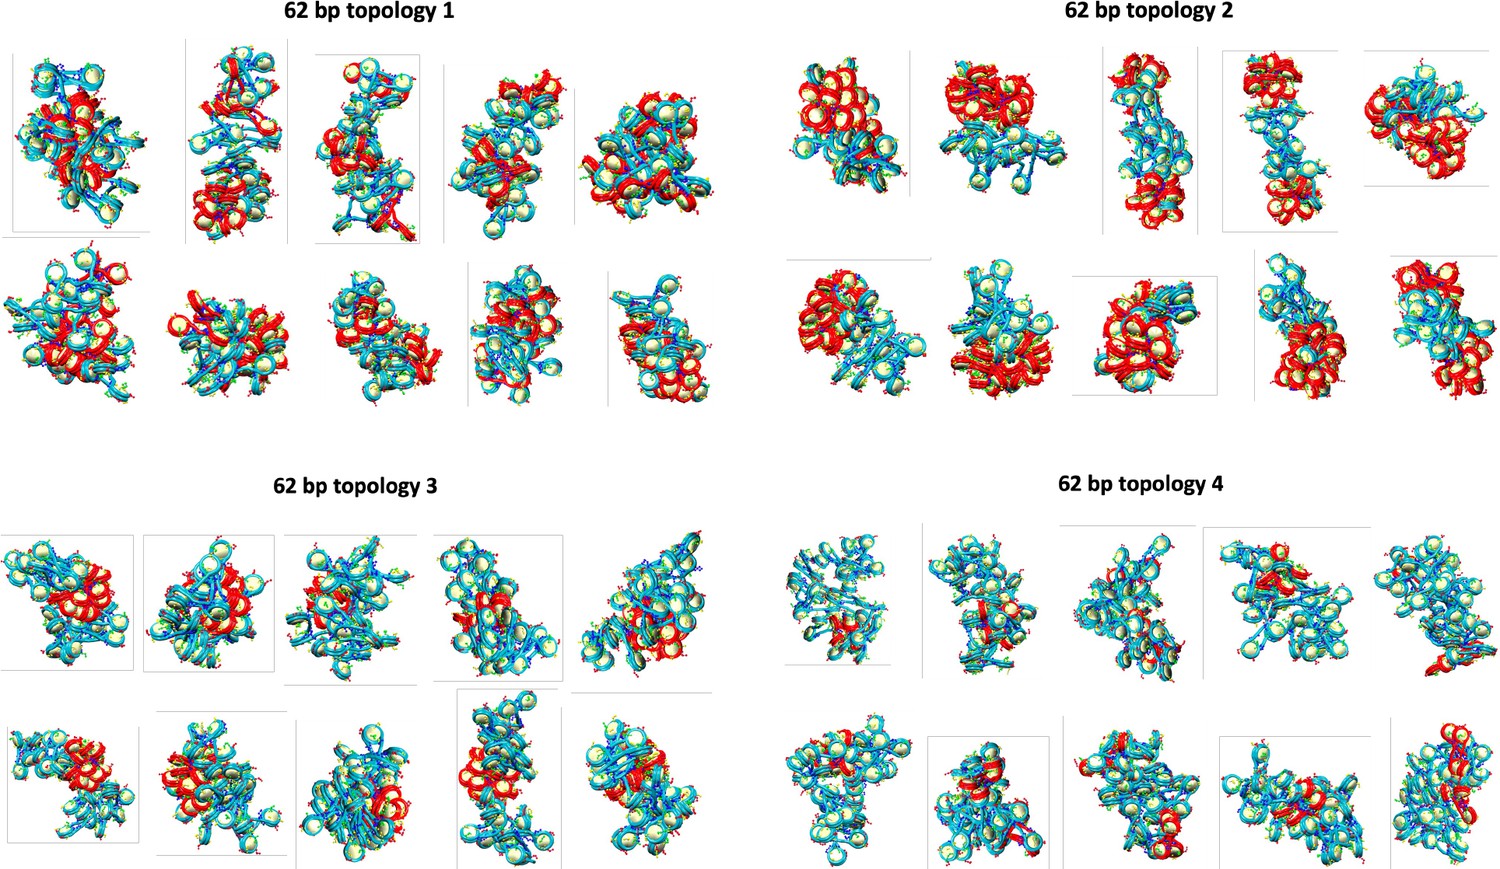
Final configurations for each of the 10 independent trajectories of the 62 bp system with four different transcription factor (TF) binding topologies.
Figure 1—figure supplement 5
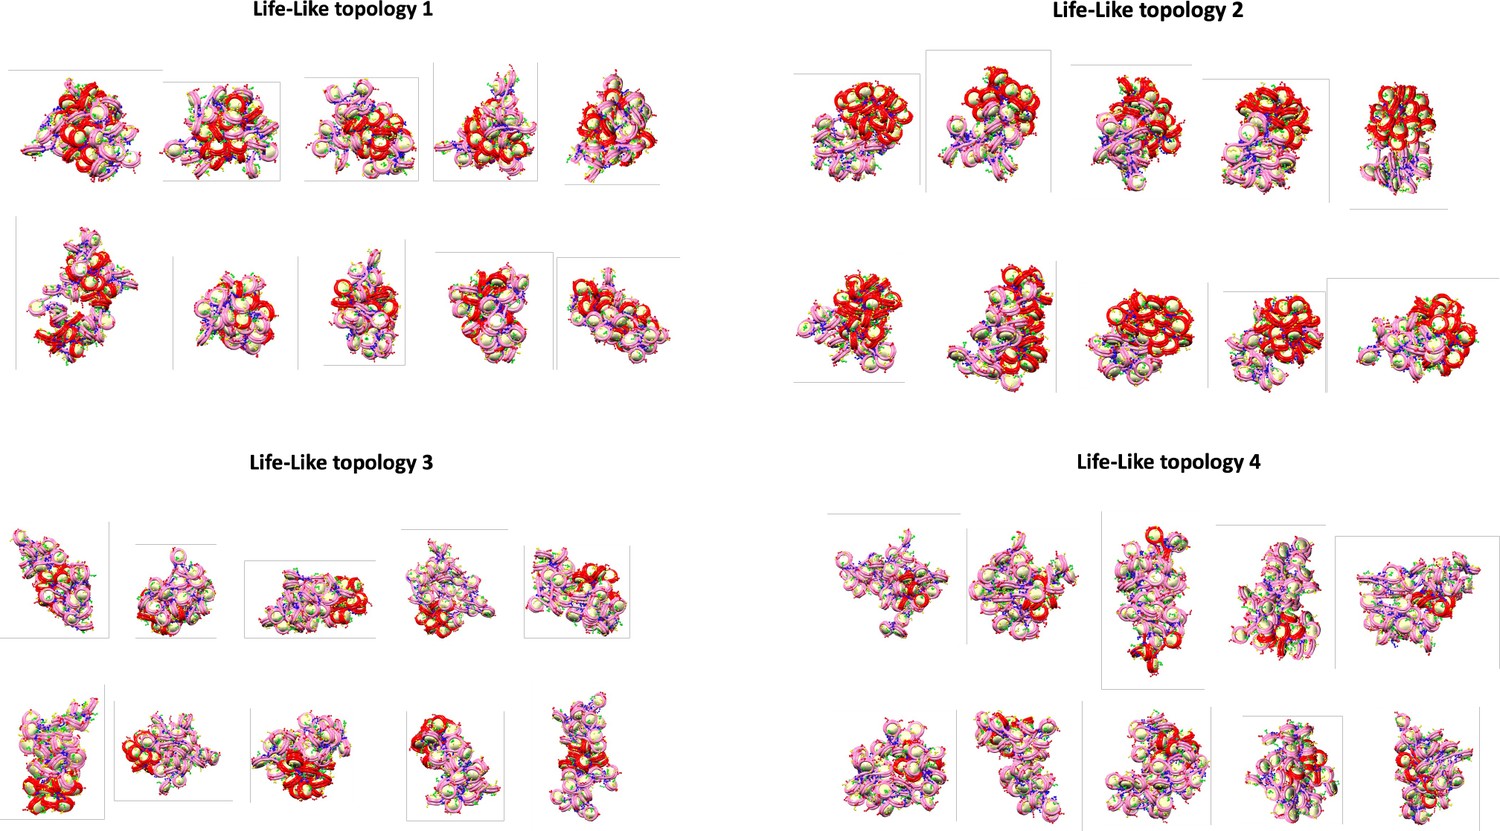
Final configurations for each of the 10 independent trajectories of the life-like system with four different transcription factor (TF) binding topologies.
Figure 1—figure supplement 6
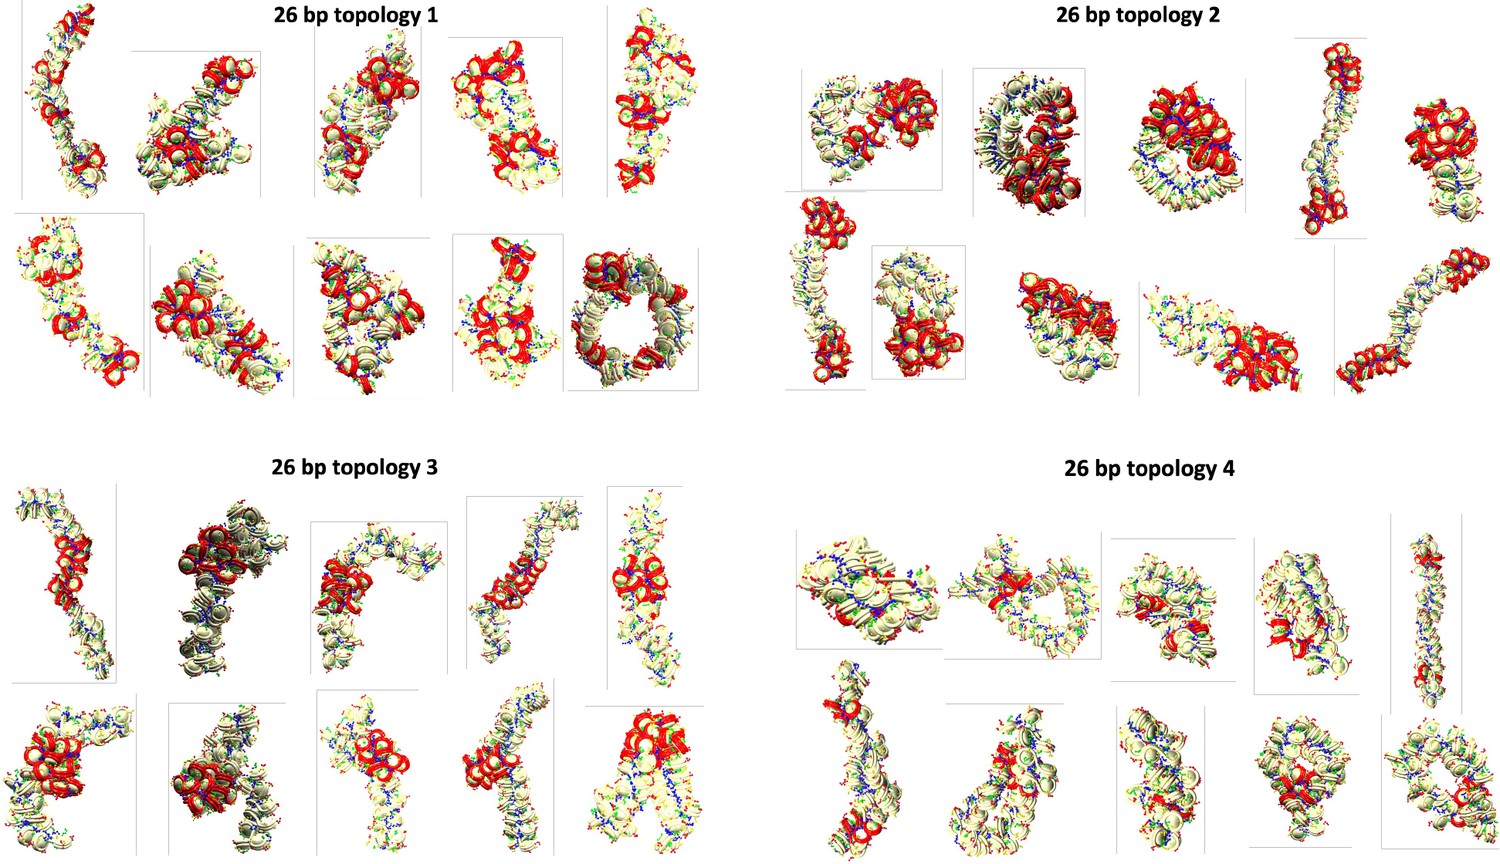
Final configurations for each of the 10 independent trajectories of the 26 bp system with four different transcription factor (TF) binding topologies.
Figure 1—figure supplement 7
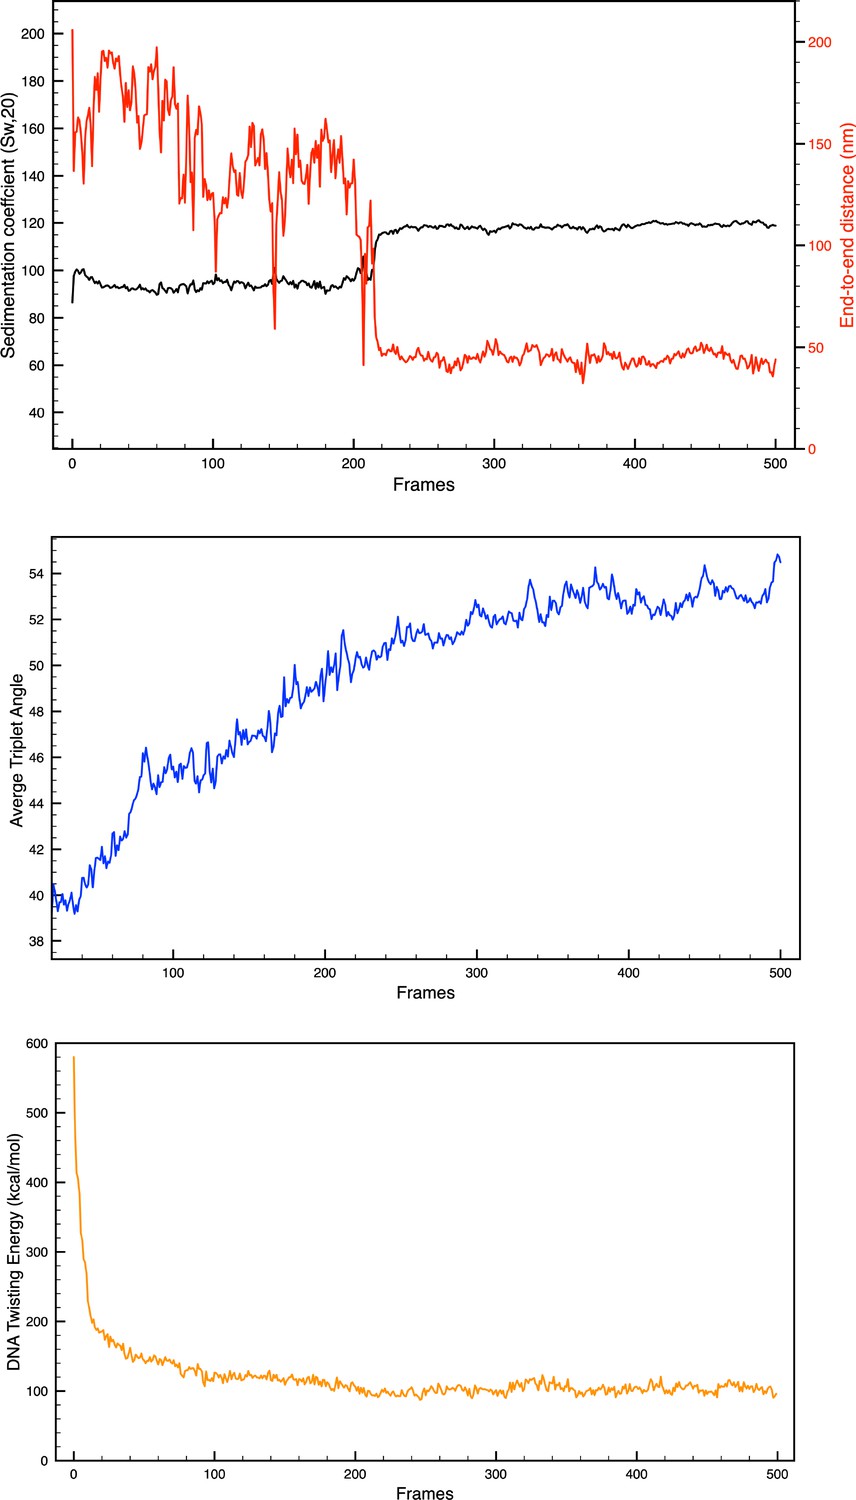
Convergence check.
(Top) Sedimentation coefficient and end-to-end distance evolution; (Middle) average triplet angle evolution; and (Bottom) sample energy evolution for the 26 bp system with five transcription factor (TF) binding regions.
Figure 2
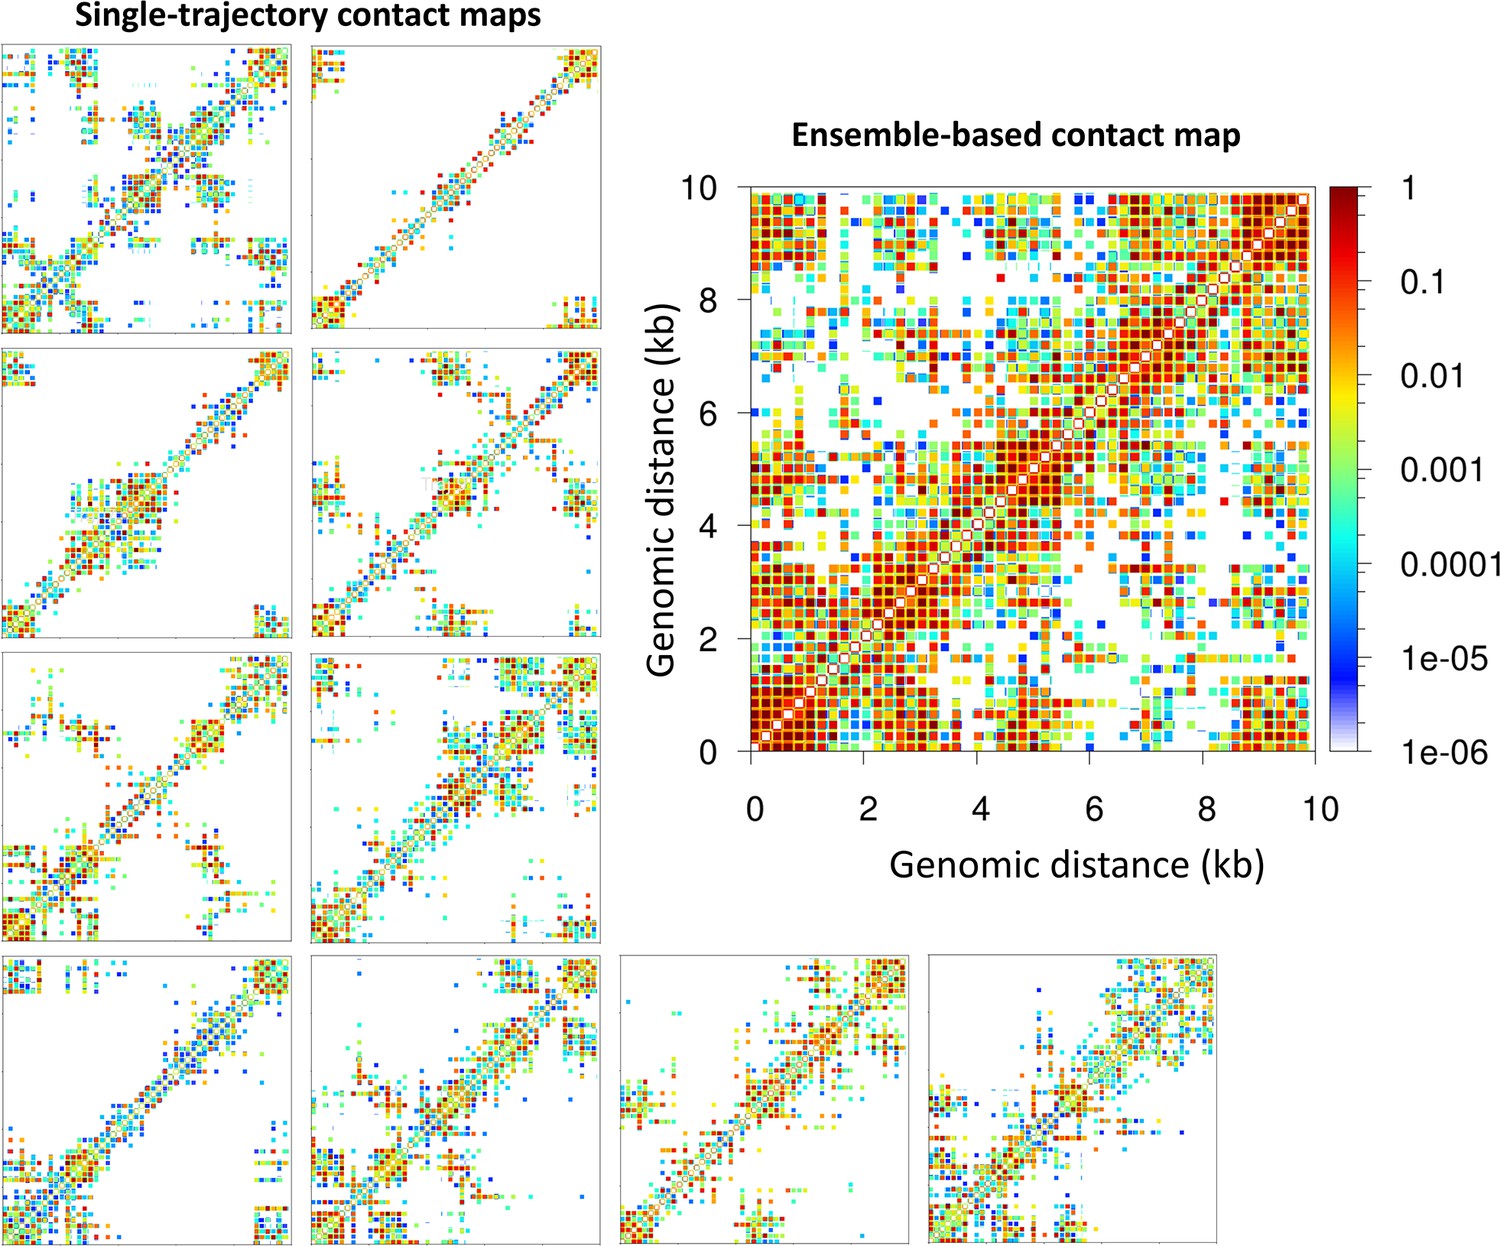
Microdomains emerge only from ensemble-based contact maps.
The 10 single-trajectory contact maps for the 62 bp system Topology 1 (five Transcription factor (TF) binding regions) at left reveals various microdomains. The large ensemble-based contact map at right obtained by summing the 10 individual contact maps reveals all possible microdomains contacts.
Figure 3 with 1 supplement
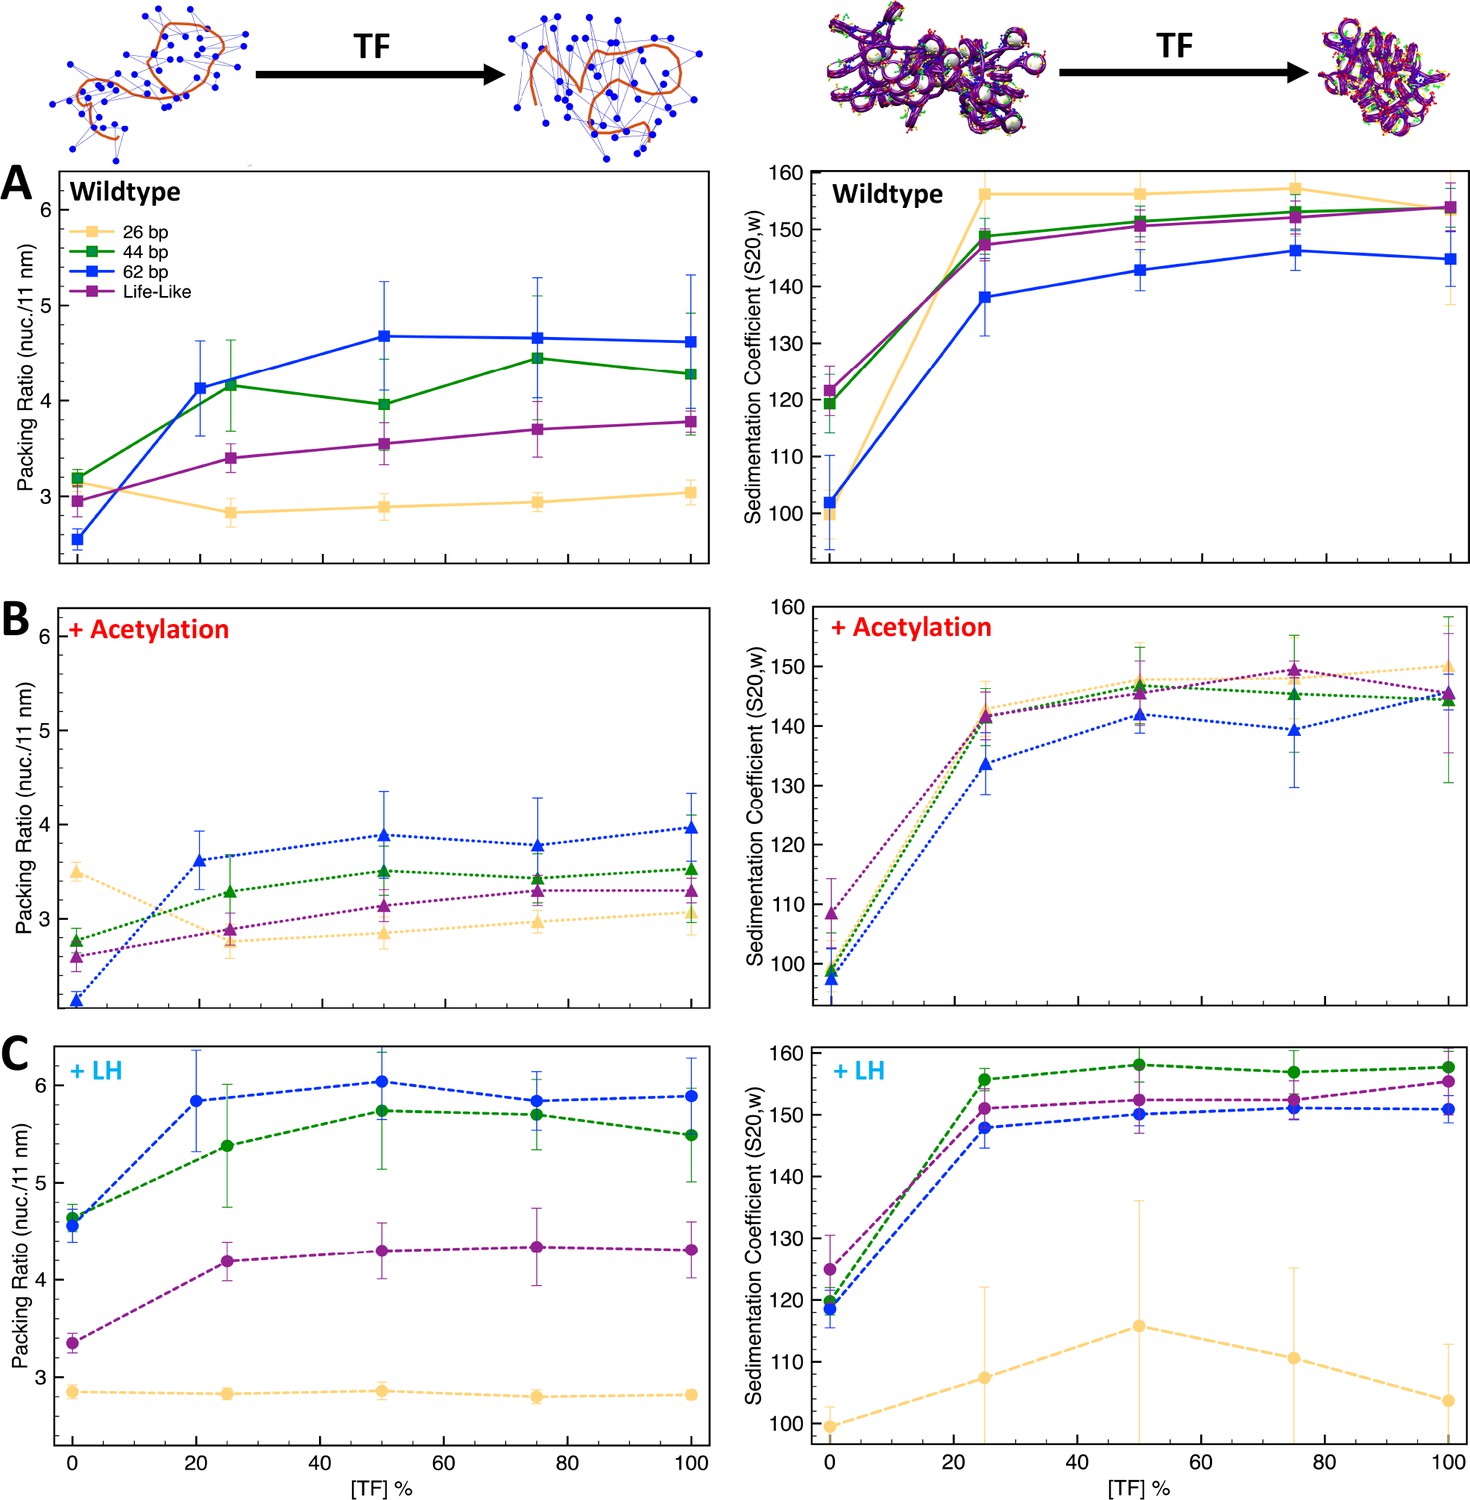
Transcription factor (TF) saturation curves are affected by histone acetylation and linker histone (LH).
Graphs (A–C) show packing ratios and sedimentation coefficients as a function of TF concentration for the 26 bp, 44 bp, 62 bp, and life-like fibers in different conditions: (A) systems without LH and acetylation; (B) systems with four acetylation islands; and (C) systems with LH density ρ = 1. Average and standard deviation values are obtained from ensembles of 1000 structures. At the top left, we show the fiber axis (red trace) and position of nucleosomes (blue dots) for a 70 bp chromatin fiber to illustrate the increase of packing ratio (number of nucleosomes per 11 nm of fiber length) upon TF binding. At the top right, we show a 70 bp linker chromatin fiber to illustrate the decrease of chromatin global size upon TF binding. Results including uniform systems with 35, 53, 70, and 80 bp are shown in Figure 3—figure supplement 1.
Figure 3—figure supplement 1
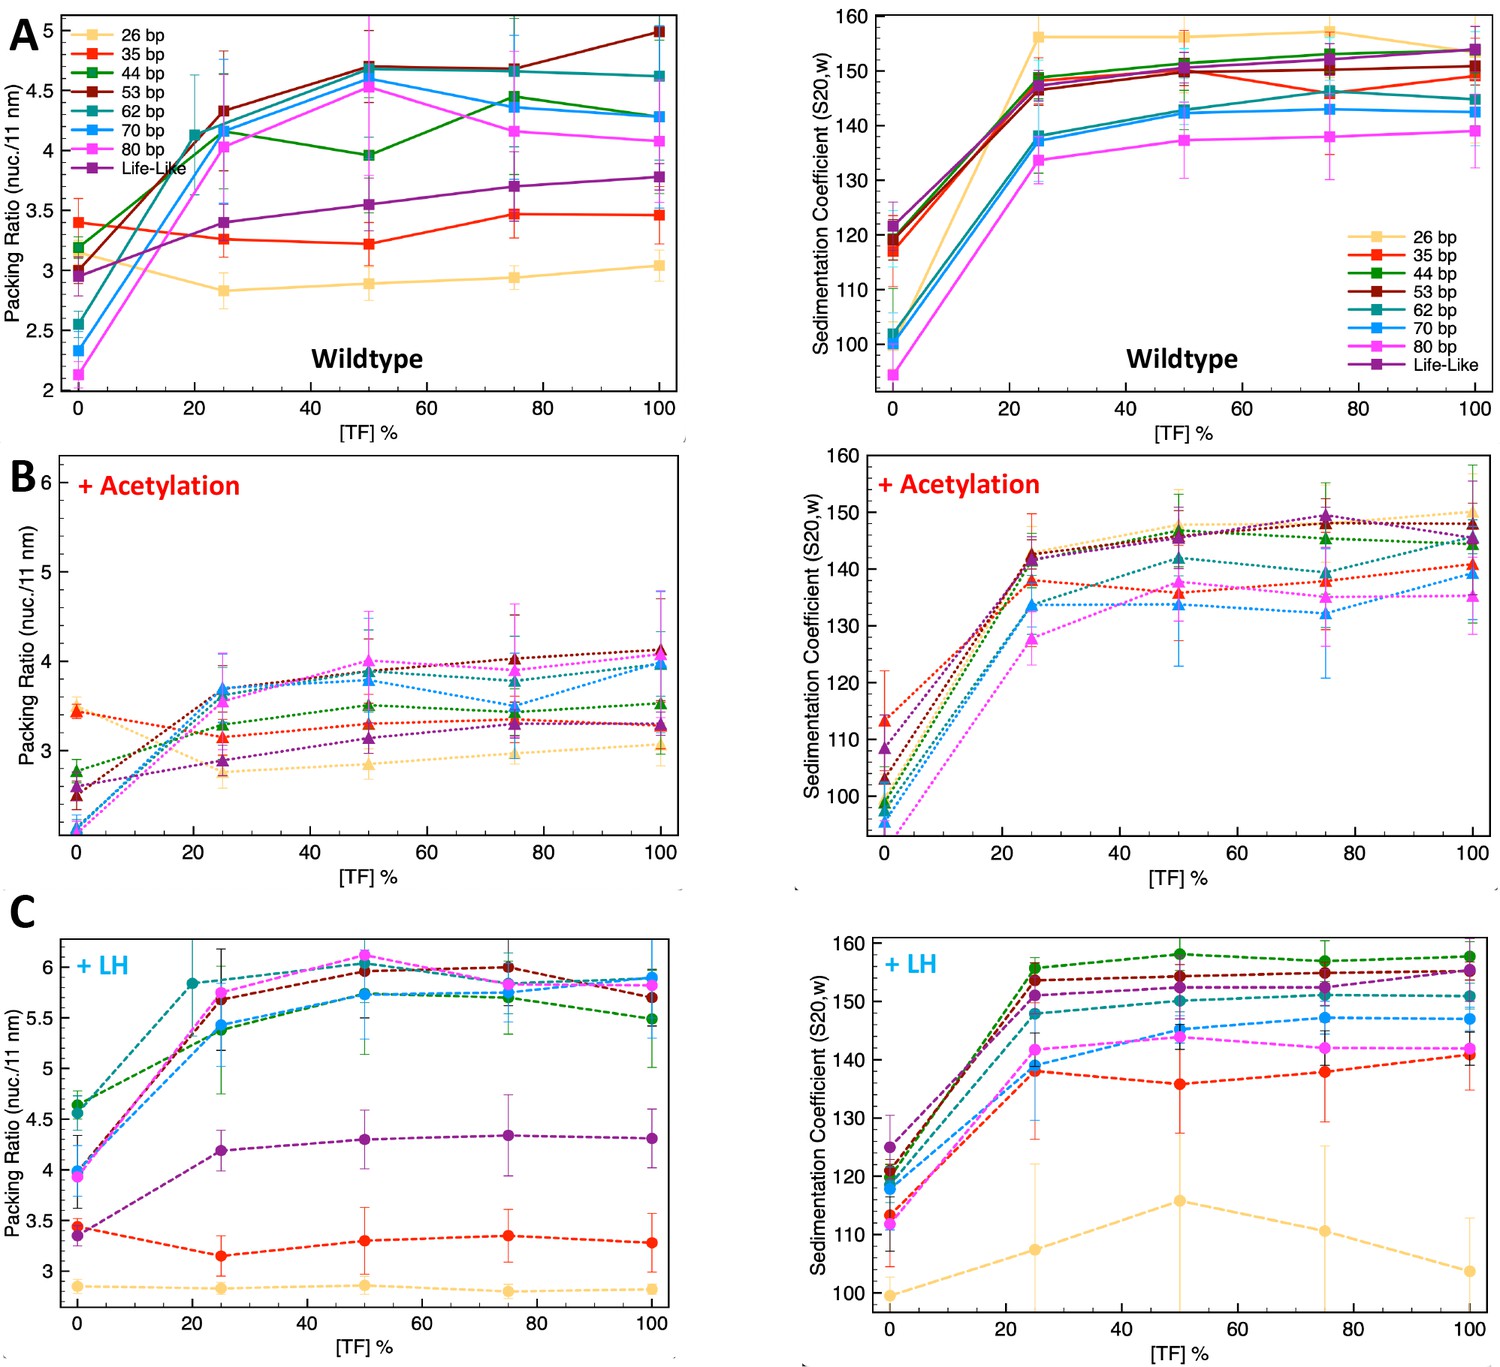
Transcription factor (TF) saturation curves for the uniform systems of 26, 35, 44, 53, 62, 70, and 80 bp, as well as for the life-like fiber.
(A) Systems without linker histone (LH) and acetylation; (B) systems with four acetylation islands; and (C) systems with LH density ρ = 1.
Figure 4

Transcription factor (TF) binding affects chromatin architecture.
Chromatin uniform fibers of 44, 62, and 26 bp linkers, as well as nonuniform life-like fibers at increasing TF concentration. Wildtype (WT) shows structures of the wildtype systems (no acetylation and no LH). +Ac shows structures of the acetylated systems with acetylated tails drawn in red and wildtype tails in blue. +Linker histone (LH) shows structures of systems with an LH density of 1 LH/nucleosome, with LHs drawn in cyan.
Figure 5 with 1 supplement
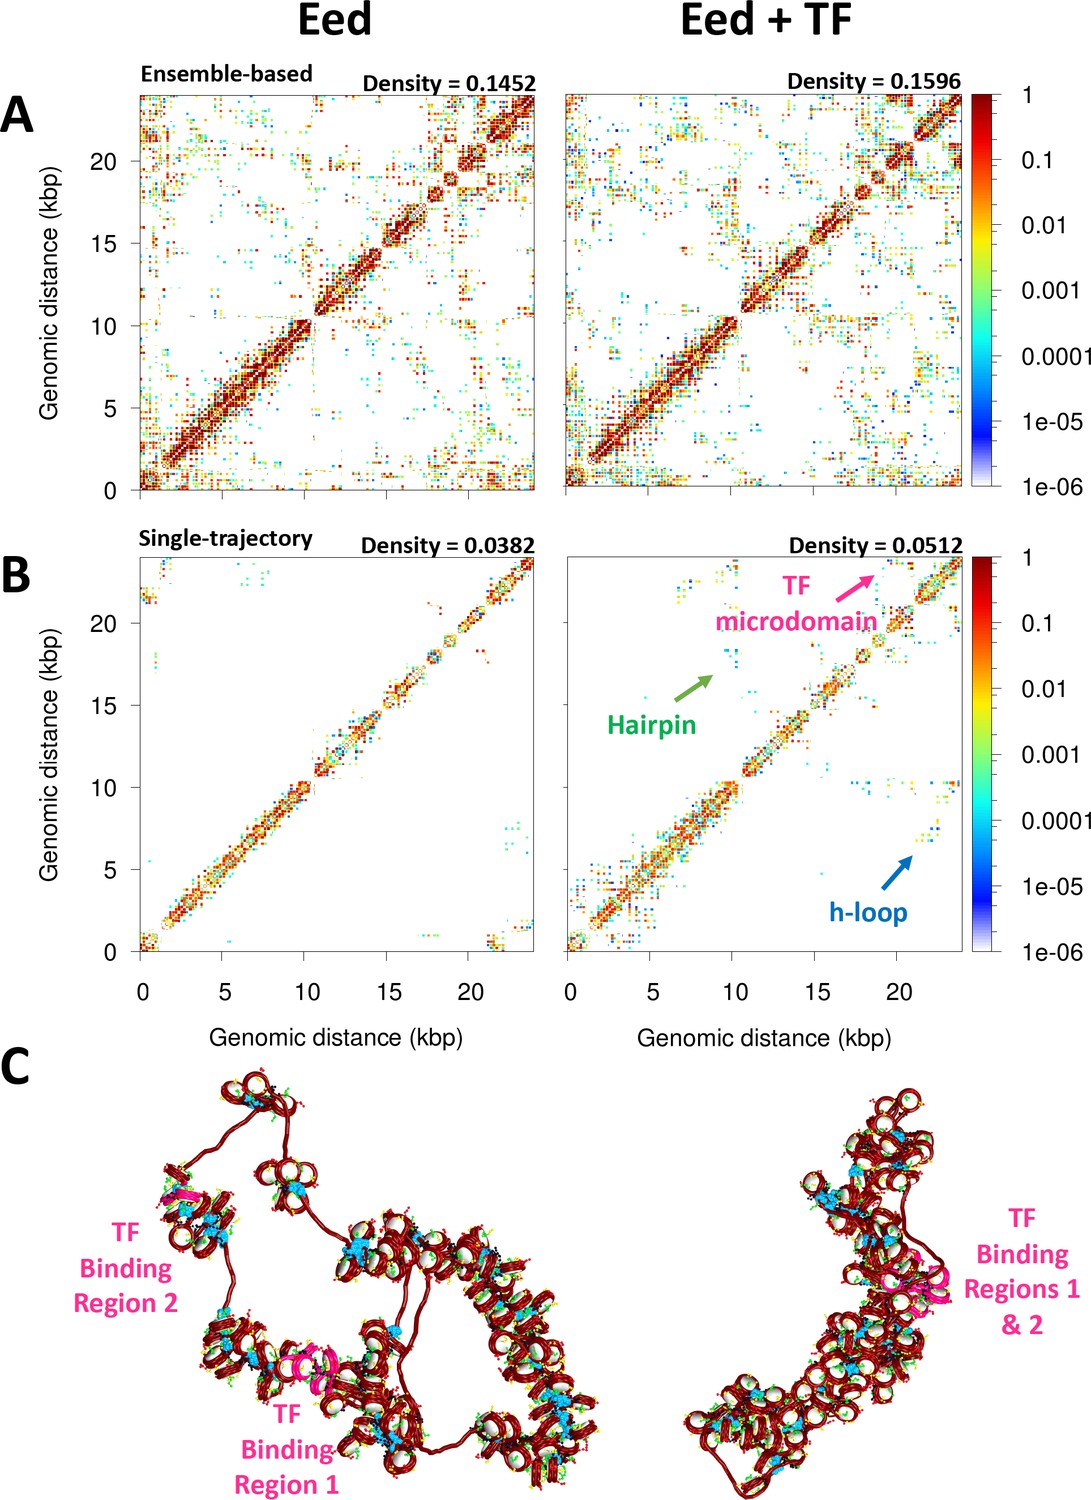
Transcription factor (TF) binding represses the Eed gene loci.
(A) Ensemble-based nucleosome contact maps obtained from 20 independent trajectories of the Eed gene in the absence and presence of TF binding. (B) Nucleosome contact maps obtained from a single trajectory of the Eed gene in the absence and presence of TF binding. (C) Representative chromatin fibers of the Eed gene in the absence and presence of TF binding. In magenta are shown the TF binding regions. Linker histones (LHs) are shown in cyan.
Figure 5—figure supplement 1
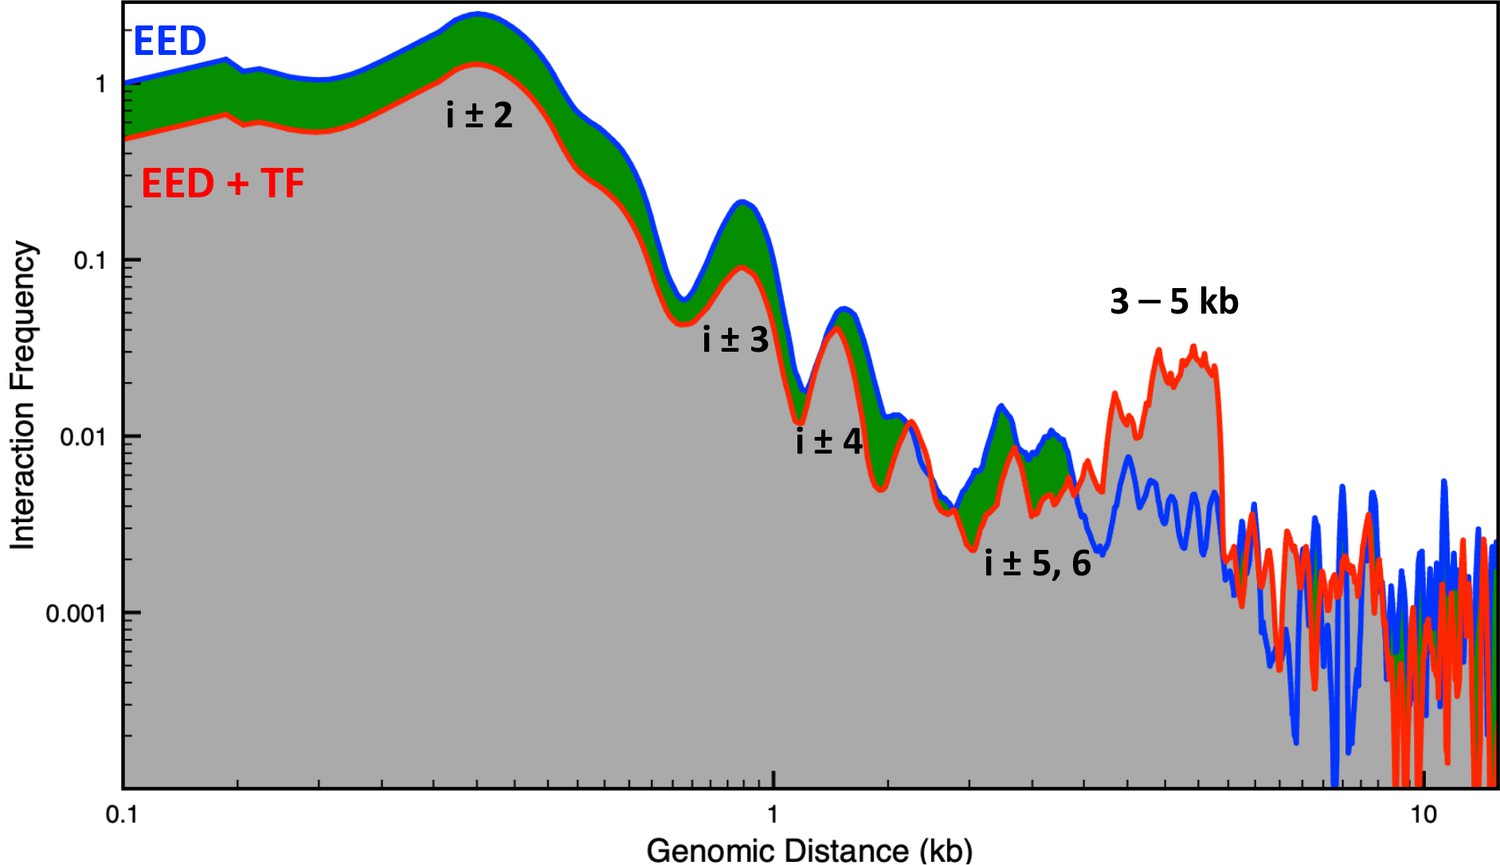
Genomic interaction frequency vs. genomic distance for the Eed gene with and without transcription factor (TF) bound.
Figure 6 with 1 supplement

Activation of the Eed gene loci depends on linker histone (LH) density.
(A) Ensemble-based nucleosome contact maps obtained from 20 independent trajectories of the Eed gene with an LH density of 0.8 LH/nucleosome in the absence and presence of transcription factor (TF) binding. (B) Representative chromatin fibers of the Eed gene in the absence and presence of TF binding showing that the two TF binding regions remain apart upon TF binding. In magenta are shown the TF binding regions. LHs are shown in cyan.
Figure 6—figure supplement 1
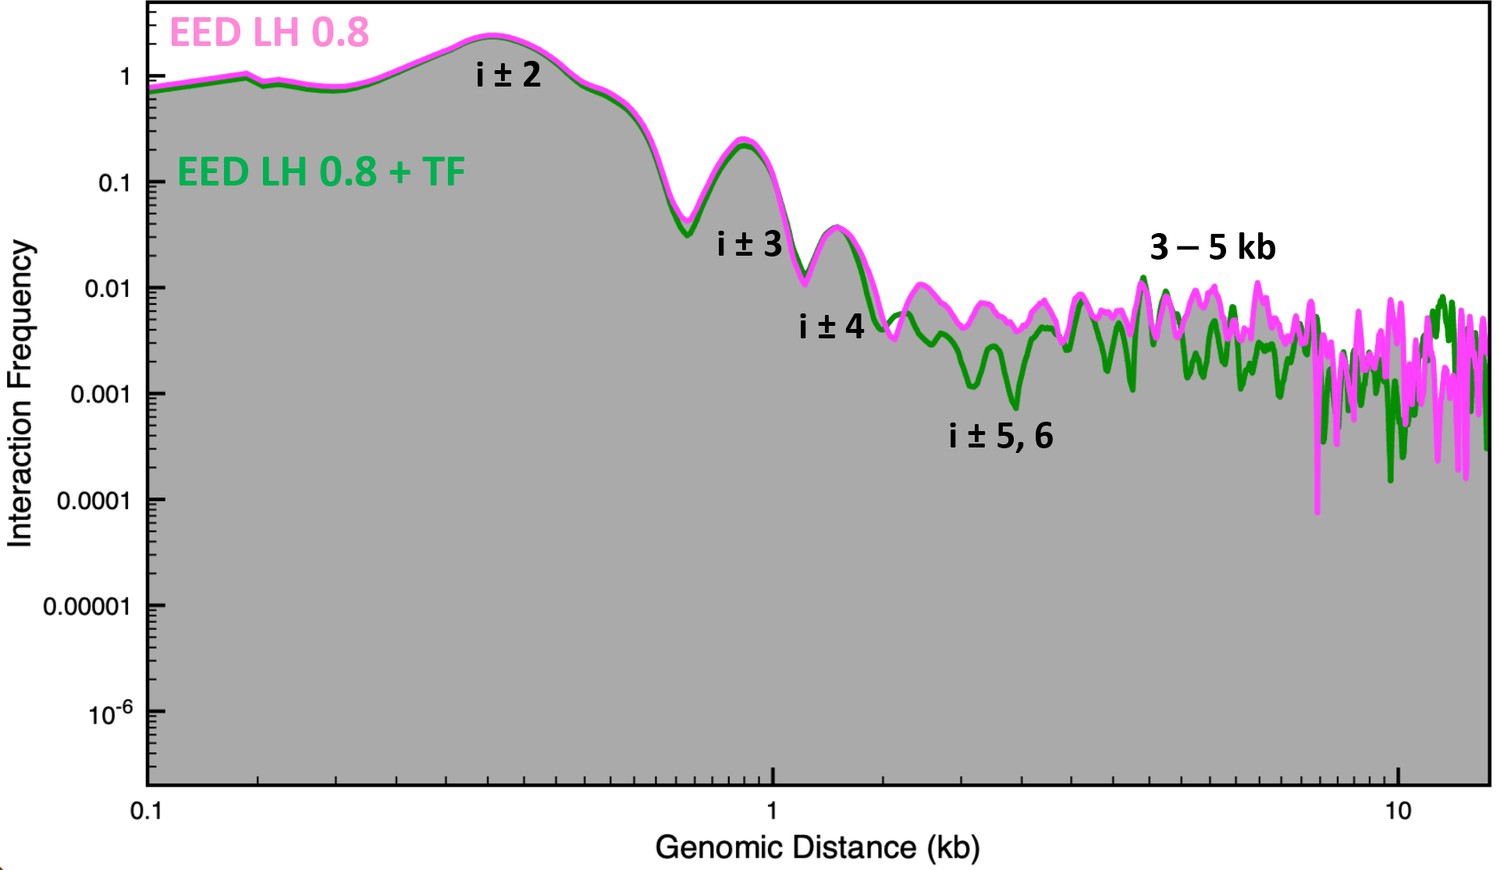
Genomic interaction frequency vs. genomic distance for the Eed gene with an linker histone (LH) density of 0.8 with and without transcription factor (TF) bound.
Figure 7
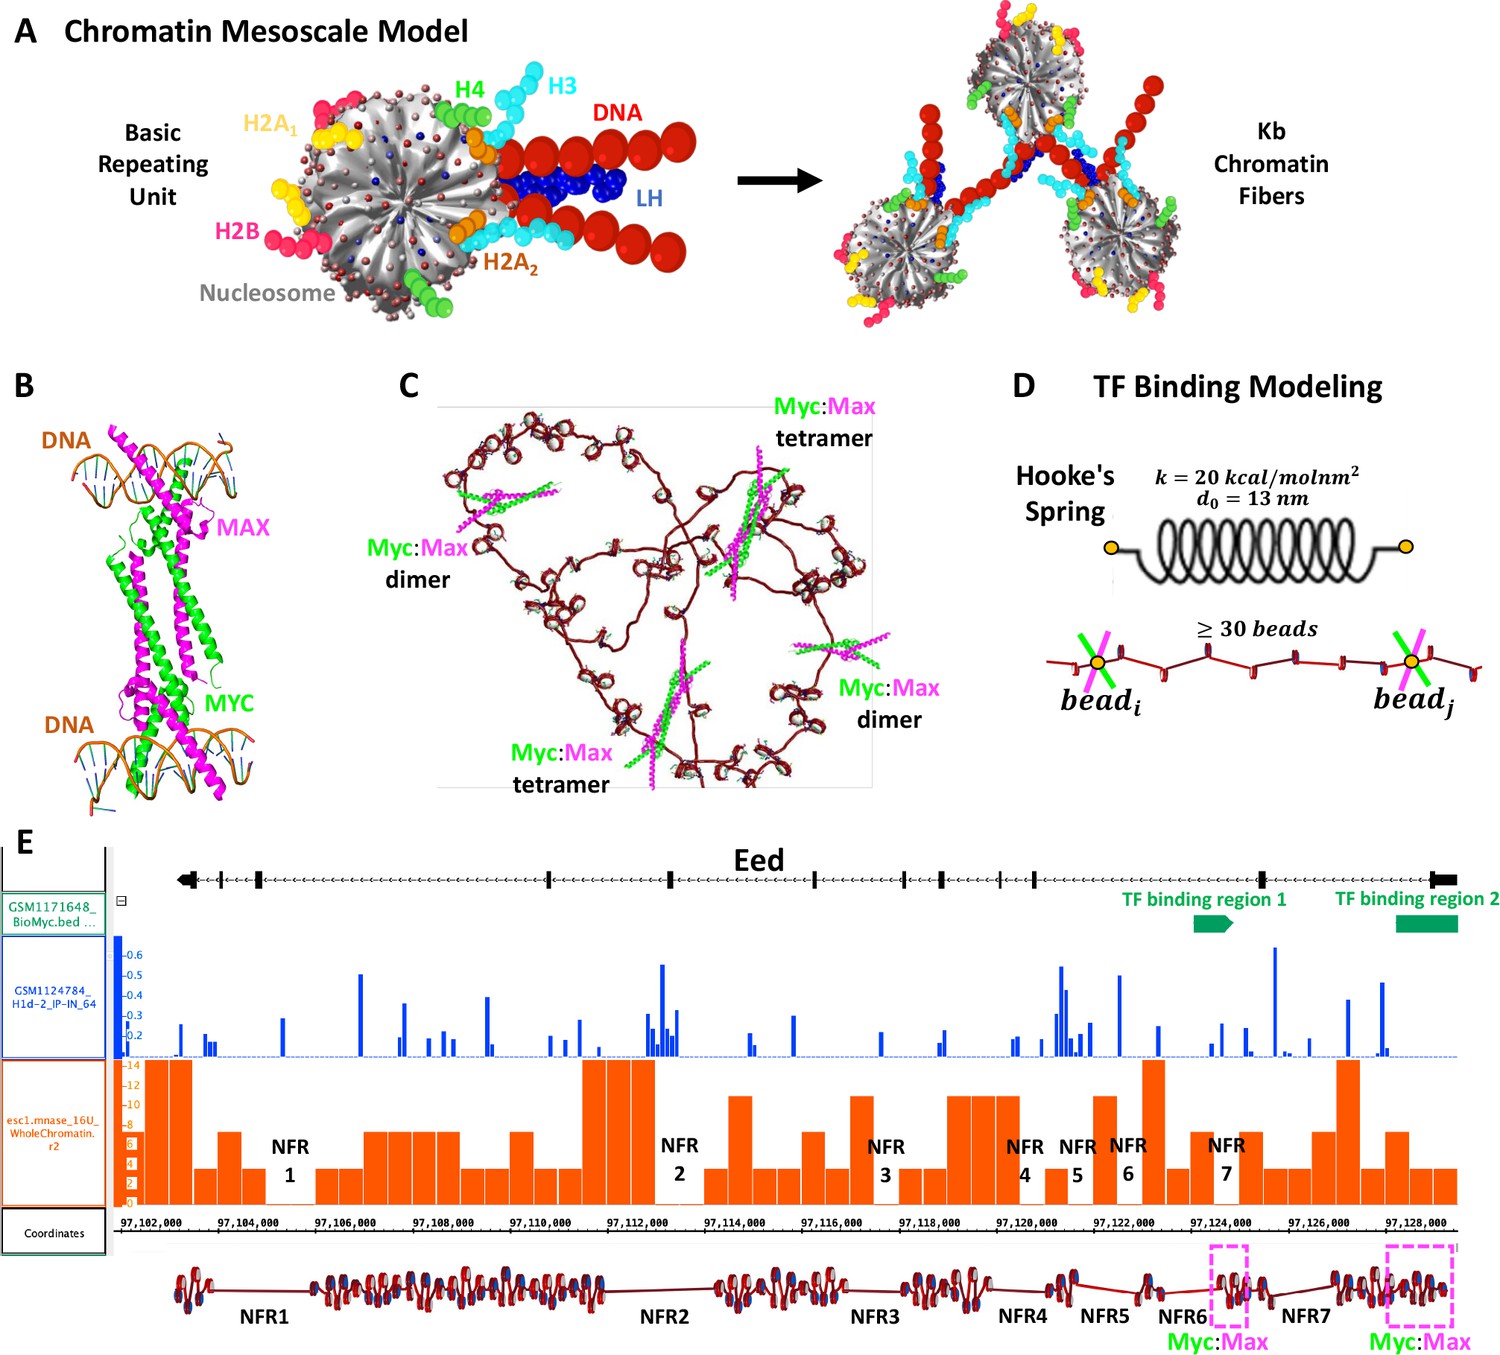
Our chromatin mesoscale model and modeling of Myc:Max binding to chromatin and the Eed gene.
(A) Coarse-grained chromatin elements (nucleosome core, linker DNA, histone tails, and linker histone, LH) form chromatin fibers at the kb level. (B) Crystal structure of Myc:Max forming a heterotetramer that binds to sequence-distant DNA regions. (C) Schematic representation of Myc:Max heterodimers and heterotetramers. (D) Illustration of our implicit modeling of Myc:Max binding to chromatin fibers: distance constraints following Hooke’s spring law are enforced when two linker DNAs with Myc:Max bound are in close spatial proximity (20 nm) and at at least 30 linker DNAs apart. (E) Design of the Eed gene loci using Mnase-seq data to position nucleosome free regions (NFRs) (orange track) and Chip-seq data to position LHs (blue track) and Myc:Max binding regions (green track).
Tables
Table 1
Compaction parameters: Sedimentation coefficient and radius of gyration for the entire Eed system, and area and volume for the promoter region of Eed.
| Fiber Rg (nm) | Fiber Sc (S20,w) | Promoter area (nm2) | Promoter volume (nm3) | |
|---|---|---|---|---|
| Eed | 62 ± 14 | 162 ± 19 | 252 ± 45 | 1753 ± 239 |
| Eed + TF | 60 ± 13 | 171 ± 18 | 171 ± 42 | 1262 ± 202 |
| Eed + 0.8 LH | 61 ± 9 | 173 ± 15 | 196 ± 47 | 1447 ±123 |
| Eed + 0.8 LH + TF | 57 ± 8 | 175 ±16 | 210 ± 46 | 1420 ± 104 |
Additional files
-
Supplementary file 1
EED gene system setup.
- https://cdn.elifesciences.org/articles/91320/elife-91320-supp1-v1.docx
-
MDAR checklist
- https://cdn.elifesciences.org/articles/91320/elife-91320-mdarchecklist1-v1.docx
Download links
A two-part list of links to download the article, or parts of the article, in various formats.
Downloads (link to download the article as PDF)
Open citations (links to open the citations from this article in various online reference manager services)
Cite this article (links to download the citations from this article in formats compatible with various reference manager tools)
Regulation of chromatin architecture by transcription factor binding
eLife 12:RP91320.
https://doi.org/10.7554/eLife.91320.3


