Hyperactivity of mTORC1- and mTORC2-dependent signaling mediates epilepsy downstream of somatic PTEN loss
- Department of Neurological Sciences, Larner College of Medicine, University of Vermont, United States
- Fralin Biomedical Research Institute at VTC, Center for Neurobiology Research, United States
- Translational Biology, Medicine, and Health Graduate Program, United States
- School of Neuroscience, Virginia Polytechnic and State University, United States
Figures
Figure 1 with 2 supplements
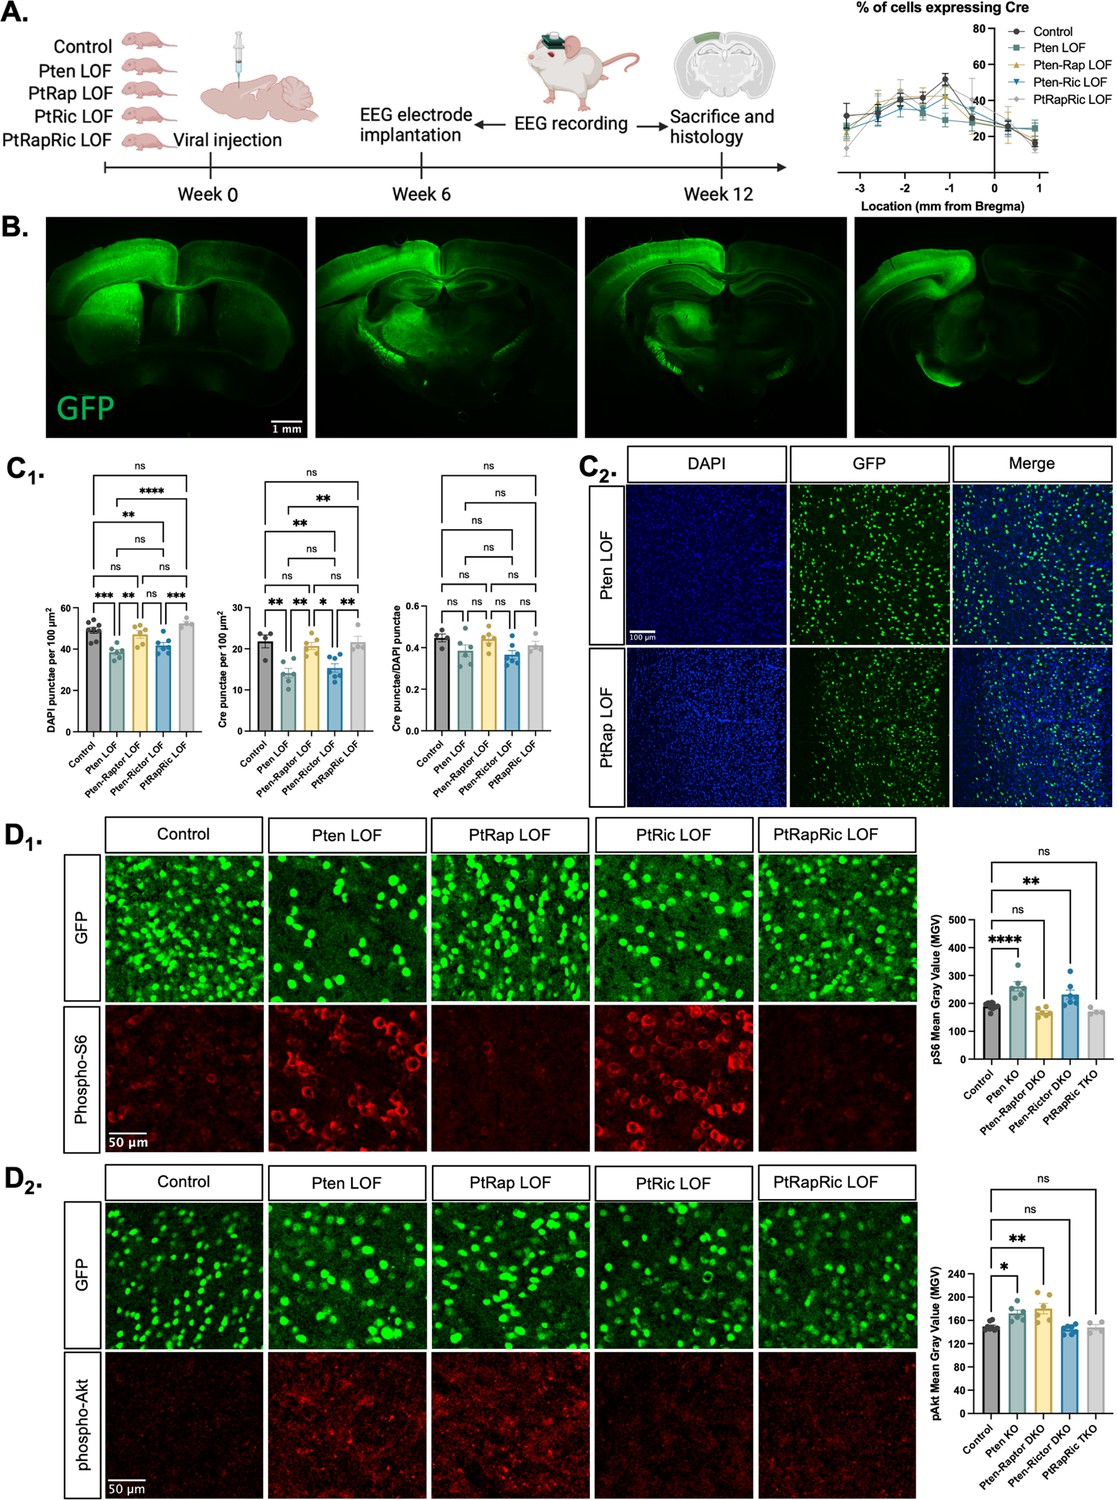
Histological characterization of the focal cortical Pten loss-of-function (LOF) model.
(A) Experimental timeline showing induction of hSyn-Cre-GFP or Control hSyn-GFP AAV at P0 and EEG recording in adulthood. The location of cortical Cre expression relative to Bregma did not differ between groups. (B) Representative images of green fluorescent protein (GFP) expression in a Control mouse brain, demonstrating expression predominantly in one hemisphere of the cortex. Projections from affected neurons can be seen in white matter tracts including the fornix, internal capsule, corpus callosum, and cerebral peduncle. (C1) Quantification of lesion severity and neuron density in Cre-expressing animals. There were fewer Cre-expressing neurons per unit area in the Pten LOF and Pten-Ric LOF groups, which was at least partially attributable to a decrease in cell density in these groups. No significant differences in Cre expression remained when Cre expression was calculated based on cell density rather than area. (C2) Representative images of DAPI and Cre fluorescence in the cortex of Pten LOF and Pten-Rap LOF animals. Cell density and Cre density in Pten-Rap LOF animals were indistinguishable from Controls. (D1) Phospho-S6, a marker of mTORC1 activity, was increased by Pten LOF and reduced to control levels by concurrent Rptor loss. Phospho-S6 was also increased from Control levels in Pten-Ric LOF, indicating that mTORC1 hyperactivity was not normalized by Rictor loss. Combined Rptor/Rictor loss also normalized phospho-S6 expression. (D2) Phospho-Akt, a marker of mTORC2 activity, was increased in Pten LOF and normalized by Rictor loss, but not by Rptor. Combined Rptor/Rictor loss also normalized phospho-Akt expression. Error bars show mean ± SEM. ns indicates p>0.05, * indicates p<0.05, ** indicates p<0.01, *** indicates p<0.001, and **** indicates p<0.0001 as assessed by statistical tests indicated in Table 3. Panel A created with BioRender.com, and published using a CC BY-NC-ND license with permission.
© 2024, BioRender Inc. Figure 1 panel A was created using BioRender, and is published under a CC BY-NC-ND 4.0
-
Figure 1—source data 1
File containing data used to generate graphs in Figure 1.
- https://cdn.elifesciences.org/articles/91323/elife-91323-fig1-data1-v1.xlsx
Figure 1—figure supplement 1

Analysis of Cre expression in the hippocampus and its impact on outcome measures.
Although the virus injection was targeted to the cortex, sparse green fluorescent protein (GFP) expression was also observed in the dorsal hippocampus, most prominently in CA1 and the dentate gyrus. (A) Representative images showing GFP expression in the dorsal hippocampus. (B) Summary data showing that hippocampal Cre expression did not differ between groups and was not related to generalized seizure development. (C) Phospho-S6 and phospho-Akt in the hippocampus were not significantly elevated from Control values in any group, but PtRapRic LOF animals had significantly lower phospho-S6 expression than Pten LOF animals. (D) Representative images and summary data showing that soma size in the hippocampus was increased in Pten LOF and PtenRic LOF animals, as was also observed in the cortex. Error bars show mean ± SEM. ns indicates p>0.05, * indicates p<0.05, ** indicates p<0.01, *** indicates p<0.001 as assessed by one-way ANOVA with Tukey multiple comparisons correction.
Figure 1—figure supplement 2

Cre virus exposure does not significantly impact cortical morphology or baseline EEG.
C57B6/J mice with no floxed genes were injected with the Cre virus as an additional control group. These mice did not have generalized seizure (GS) or spike-and-wave discharges (SWDs). They were also not different from Ptenfl/fl injected with the Control virus, except for significantly different brain weights. The brain weight/body weight ratio did not differ between the groups.
Figure 2
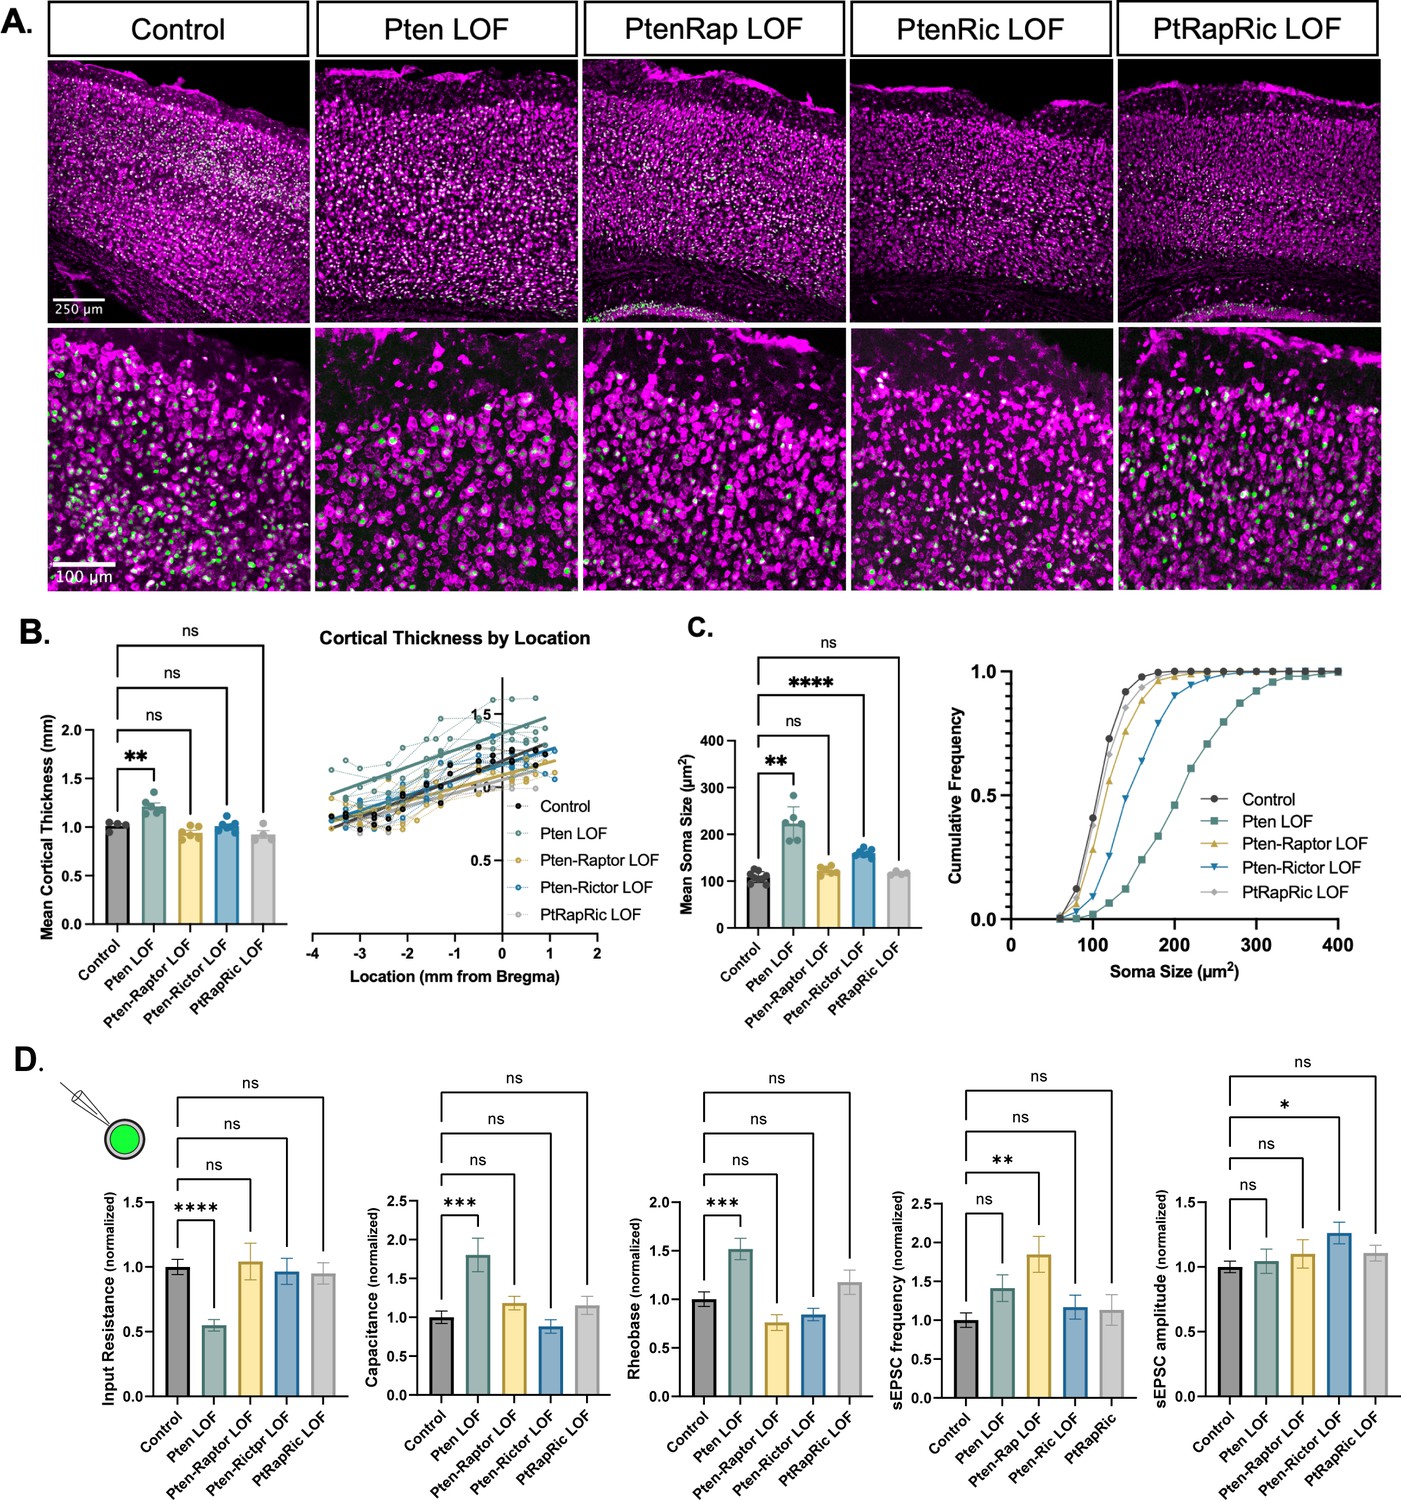
Independent mTORC1 or mTORC2 inactivation prevents most cellular effects of Pten loss-of-function (LOF), but only dual mTORC1/2 inactivation prevents all.
(A) Example images showing fluorescent Nissl stain (magenta) and green fluorescent protein (GFP) expression (green) in cortical neurons. The top row shows the cortical thickness in all five groups and the bottom row shows zoomed-in images depicting the differences in soma size across groups. (B) The mean cortical thickness was increased in Pten LOF throughout the cortex. Pten-Rap, Pten-Ric, and PtRapRic LOF cortical thickness did not differ significantly from Controls. (C) The mean soma size was strongly increased in Pten LOF and to a smaller extent in Pten-Ric LOF. Pten-Rap LOF and PtRapRic LOF groups did not differ significantly from Controls. (D) Whole-cell patch clamp analysis of GFP+ neurons showed that capacitance and rheobase were increased in Pten LOF neurons, whereas input resistance was decreased. These changes were not found in in Pten-Rap LOF, Pten-Ric LOF, and PtRapRic LOF groups. The frequency of spontaneous EPSCs was elevated in Pten-Rap LOF neurons, and their amplitude was larger in Pten-Ric neurons. Patch data is normalized to values from littermate controls. Error bars show mean ± SEM. ns indicates p>0.05, * indicates p<0.05, ** indicates p<0.01, and **** indicates p<0.0001 as assessed by statistical tests indicated in Table 3.
-
Figure 2—source data 1
File containing raw data used to generate all graphs in Figure 2.
- https://cdn.elifesciences.org/articles/91323/elife-91323-fig2-data1-v1.xlsx
Figure 3 with 1 supplement
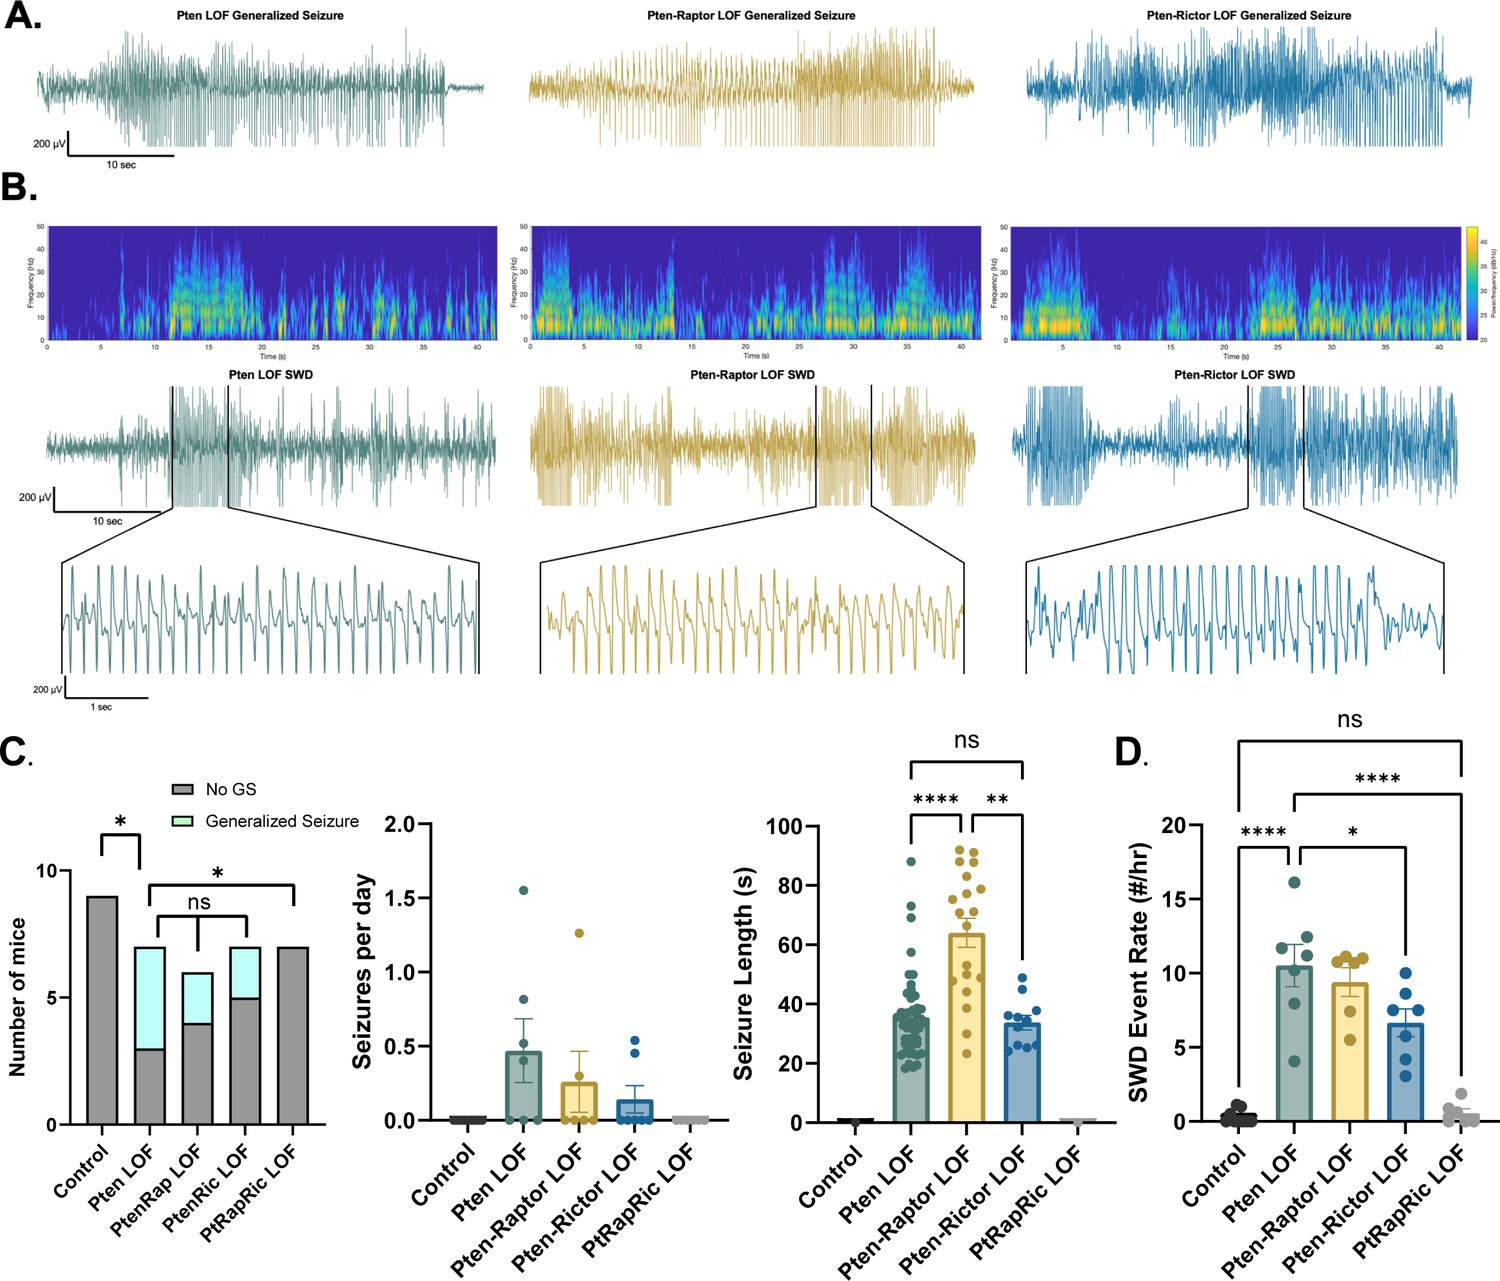
Combined mTORC1 and mTORC2 inactivation, but neither alone, rescues epilepsy in the focal Pten loss-of-function (LOF) model.
Spontaneous seizures and interictal spike activity were assessed in Pten LOF, Pten-Rap LOF, Pten-Ric LOF, PtRapRic LOF, and Control mice. (A) Representative traces of generalized seizures (GS) in a subset of animals in Pten LOF, Pten-Rap LOF, and Pten-Ric LOF groups. (B) Spectrograms (top) and traces depicting example spike-and-wave discharge (SWD) event trains. (C) Summary data showing the occurrence of GS per animal, number of GS per day, and GS length. GS events were significantly longer in the Pten-Rap LOF group than the other groups. In the Pten LOF group, 19% of GS events (9/48) exceeded 45 s in length, and these events were observed in 2/4 Pten LOF GS+ animals. 79% of GS events (15/19) in the Pten-Rap LOF group exceeded 45 s, and these events were observed in 2/2 GS+ Pten-Rap LOF animals. 1/11 GS events in the Pten-Ric LOF group exceeded this threshold. (D) Summary data showing the SWD rate in all animals. Error bars show mean ± SEM. ns indicates p>0.05, * indicates p<0.05, ** indicates p<0.01, *** indicates p<0.001, and **** indicates p<0.0001 as assessed by tests indicated in Table 3.
-
Figure 3—source data 1
File containing raw data used to generate graphs in Figure 3.
- https://cdn.elifesciences.org/articles/91323/elife-91323-fig3-data1-v1.xlsx
Figure 3—figure supplement 1
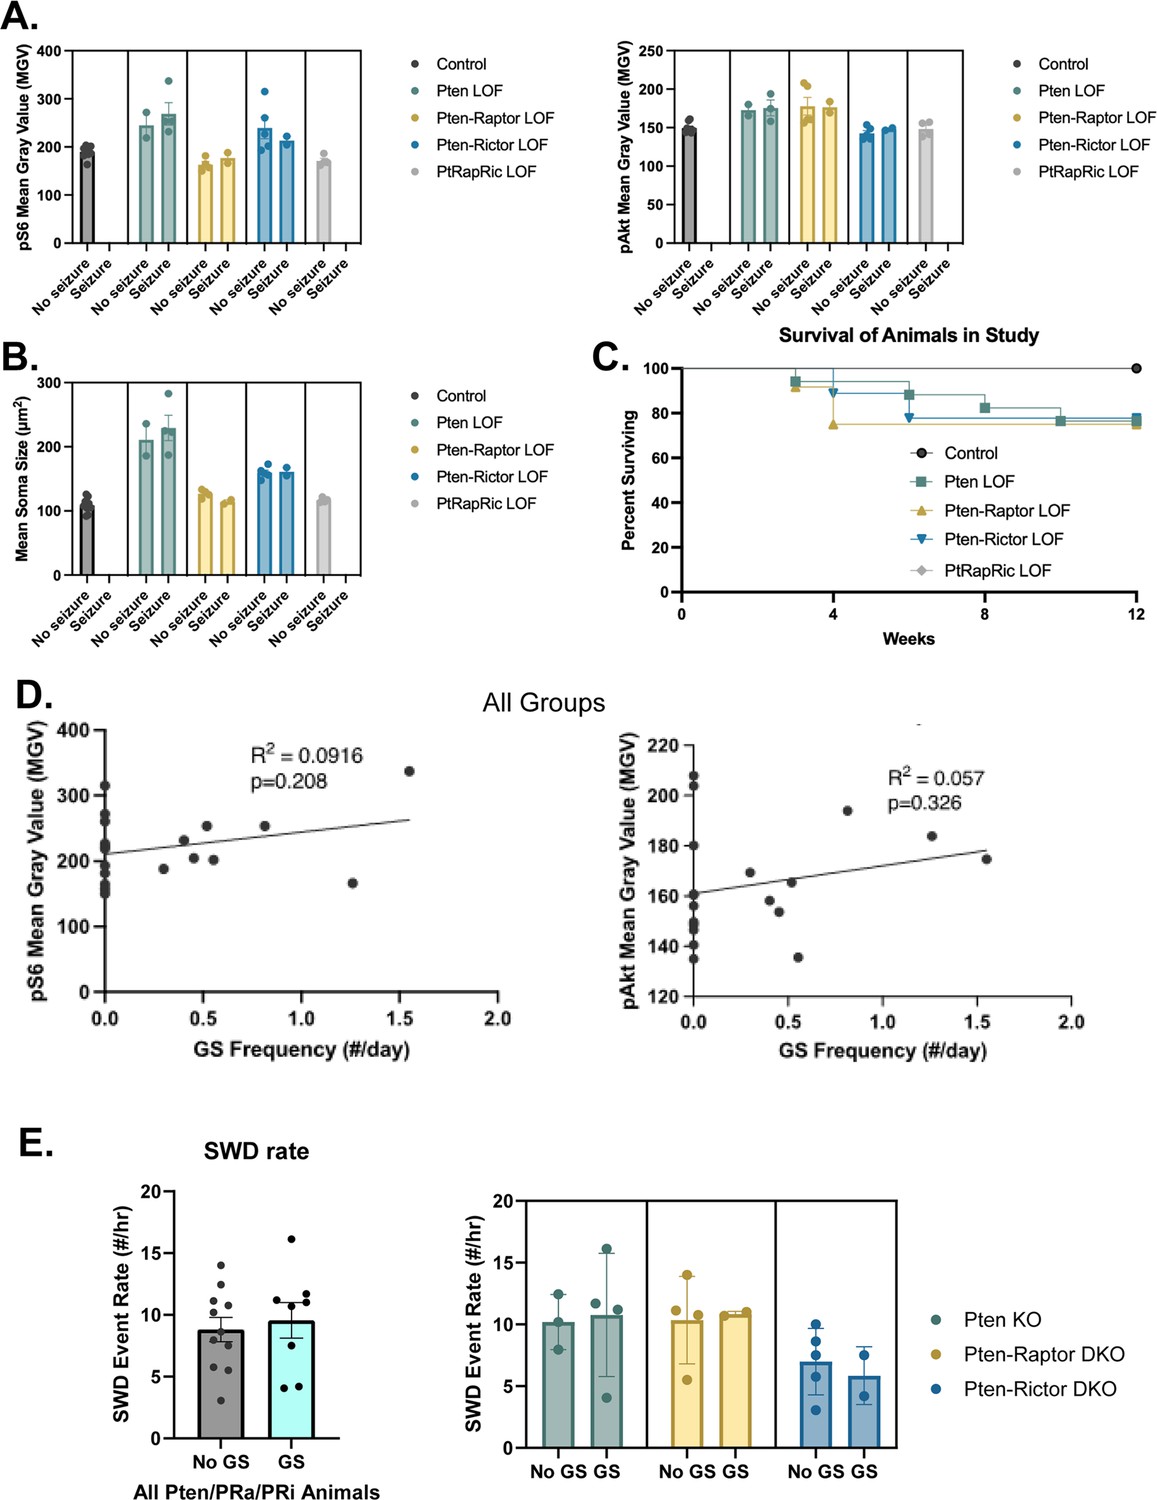
Focal cortical Pten loss-of-function (LOF), Pten-Rap LOF, and Pten-Ric LOF cause a spectrum of outcomes.
A subset of animals in the Pten LOF, Pten-Rap LOF, and Pten-Ric LOF groups displayed spontaneous epileptiform activity, but not generalized seizures (GS). When compared side by side, animals within each genotype that did and did not display GS showed similar mTOR pathway activity levels (A) and soma sizes (B). Survival plot (C) shows survival of animals in the study by genotype. Some animals in the Pten LOF, Pten-Rap LOF, and Pten-Ric LOF groups were found dead during the study, but no deaths were observed in Control or PtRapRic LOF groups. Mortality often occurred prior to EEG recordings, so we could not ascertain whether early mortality was associated with GS. When all groups with GS were plotted together, there was no significant correlation between pS6 or pAkt levels and the presence of GS (D). There was also no apparent relationship between GS presence and spike-and-wave discharge (SWD) rate (E).
Figure 4
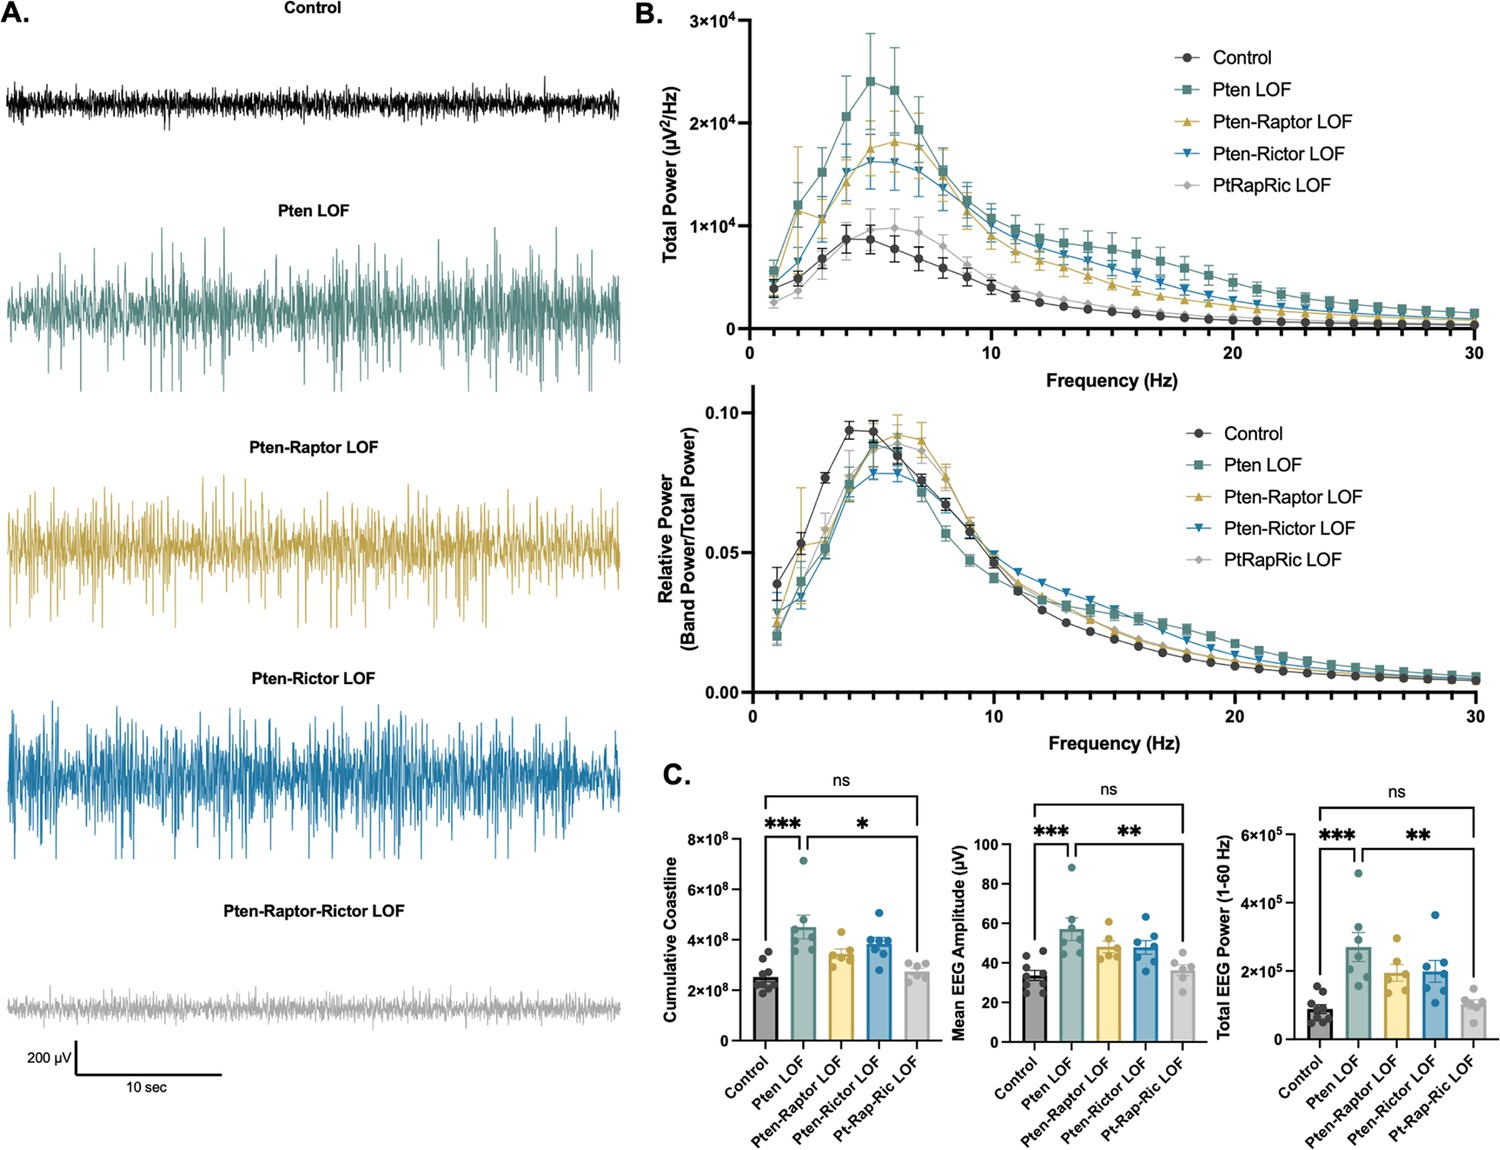
Combined mTORC1 and mTORC2 inactivation, but neither alone, rescues Pten loss-of-function (LOF)-induced abnormalities in the interictal EEG.
(A) Examples of typical EEG traces for each genotype. In EEG epochs that were not characterized as GS or spike-and-wave discharge (SWD) events, Pten LOF animals had higher levels of EEG activity as quantified by EEG line length, absolute mean amplitude, and total power. These changes were not significantly decreased in Pten-Rap LOF or Pten-Ric LOF mice, but were normalized in PtRapRic LOF mice. (B) Total EEG power was increased by Pten LOF and attenuated, but not normalized, in either Pten-Rap or Pten-Ric LOF mice. Relative power was decreased in delta and increased in higher frequencies by Pten LOF. Pten-Rap LOF, Pten-Ric LOF, and PtRapRic LOF animals all showed a milder rightward shift of EEG power. (C) Line length, mean amplitude, and power are increased in Pten LOF and normalized by PtRapRic LOF. Error bars show mean ± SEM. ns indicates p>0.05, * indicates p<0.05, ** indicates p<0.01, *** indicates p<0.001 as assessed by statistical tests indicated in Table 3. Two-way ANOVA p-values for EEG power are reported in Table 2.
-
Figure 4—source data 1
File containing raw data used to generate graphs in Figure 4.
- https://cdn.elifesciences.org/articles/91323/elife-91323-fig4-data1-v1.xlsx
Author response image 1

Tables
Table 1
EEG monitoring.
| Group | Mouse | Sex (M/F ratio) | Total hours | Mean rec. length | Mean rec. age (days) | GS rate | SWD rate |
|---|---|---|---|---|---|---|---|
| Littermate Control (Ptenfl/fl; Control AAV) | 541 | F | 388.738 | 48.592 | 76.25 | 0 | 1.0 |
| 833 | F | 237.772 | 47.554 | 62.2 | 0 | 0 | |
| 834 | F | 229.378 | 45.876 | 66.8 | 0 | 0 | |
| 841 | F | 312.545 | 62.509 | 59.8 | 0 | 0.5 | |
| 844 | M | 218.905 | 43.781 | 61.2 | 0 | 0 | |
| 157 | F | 166.736 | 27.789 | 73.2 | 0 | 0 | |
| 162 | M | 147.056 | 36.764 | 72.25 | 0 | 0 | |
| Mean | 0.29 | 243.019 | 44.695 | 67.714 | 0 | 0.214 | |
| C57/B6 Control (Cre AAV) | 570 | F | 160.217 | 16.022 | 57 | 0 | 1.125 |
| 571 | M | 207.417 | 29.631 | 58.429 | 0 | 0 | |
| Mean | 0.5 | 183.817 | 22.826 | 57.714 | 0 | 0.5625 | |
| Ptenfl/fl;Raptor+/+; Rictor+/+ (Pten LOF) | 576 | M | 265.171 | 44.195 | 88.333 | 0.402 | 11.688 |
| 662 | F | 412.196 | 41.220 | 64.2 | 0.815 | 16.125 | |
| 677 | F | 173.978 | 28.996 | 60.667 | 0 | 10.188 | |
| 681 | M | 324.945 | 64.989 | 71.6 | 1.551 | 4.0625 | |
| 832 | M | 416.008 | 69.335 | 70 | 0.519 | 11.188 | |
| 842 | F | 260.195 | 28.9106 | 59.333 | 0 | 12.438 | |
| 867 | M | 427.933 | 42.793 | 59 | 0 | 7.964 | |
| Mean | 0.57 | 325.775 | 45.777 | 67.590 | 0.470 | 10.522 | |
| Ptenfl/fl;Raptorfl/fl; Rictor+/+ (Pten-Raptor LOF) | 538 | M | 438.481 | 48.720 | 75.667 | 0 | 11.125 |
| 664 | M | 266.227 | 33.278 | 73.25 | 1.262 | 10.688 | |
| 665 | M | 400.567 | 57.224 | 72.429 | 0.299 | 11 | |
| 666 | M | 389.0367 | 64.839 | 67.167 | 0 | 10.75 | |
| 943 | M | 312.383 | 34.709 | 52.667 | 0 | 7.417 | |
| 999 | M | 272.4 | 30.267 | 60.556 | 0 | 5.5 | |
| Mean | 0 | 346.516 | 44.840 | 66.956 | 0.260 | 9.413 | |
| Ptenfl/fl;Raptor+/+; Rictorfl/fl (Pten-Rictor LOF) | 574 | F | 319.483 | 63.897 | 61.8 | 0 | 10 |
| 676 | F | 284.317 | 40.617 | 66 | 0 | 7.5 | |
| 678 | F | 238.584 | 23.858 | 85.6 | 0.453 | 4.1875 | |
| 811 | M | 307.438 | 61.488 | 64 | 0 | 3.0625 | |
| 941 | M | 295.691 | 59.138 | 65.6 | 0 | 5.75 | |
| 41 | F | 397.683 | 36.153 | 64.364 | 0 | 8.625 | |
| 42 | M | 421.85 | 42.185 | 61.1 | 0.554 | 7.5 | |
| Mean | 0.43 | 323.578 | 46.762 | 66.923 | 0.144 | 6.661 | |
| Ptenfl/fl;Raptorfl/fl; Rictorfl/fl (Pten-Raptor-Rictor LOF) | 933 | M | 286.467 | 31.830 | 58.778 | 0 | 1.875 |
| 940 | M | 234.533 | 78.178 | 52.667 | 0 | 0.625 | |
| 997 | M | 209.497 | 19.045 | 54.909 | 0 | 0 | |
| 40 | F | 220.717 | 18.393 | 59.5 | 0 | 0.875 | |
| 158 | F | 154.228 | 20.705 | 73.2 | 0 | 0 | |
| 161 | M | 168.006 | 56.002 | 72 | 0 | 0 | |
| Mean | 0.66 | 203.750 | 34.152 | 61.842 | 0 | 0.5625 |
Key resources table
| Reagent type (species) or resource | Designation | Source or reference | Identifiers | Additional information |
|---|---|---|---|---|
| Genetic reagent (Mus musculus) | Rptor-cKO mice | The Jackson Laboratories | Jackson Labs stock: 013188 | |
| Genetic reagent (Mus musculus) | Rictor-cKO mice | The Jackson Laboratories | Jackson Labs stock: 020649 | |
| Genetic reagent (Mus musculus) | Pten-cKO mice | The Jackson Laboratories | Jackson Labs stock: 006440 | |
| Strain, strain background (Mus musculus) | C57BL/6J | The Jackson Laboratories | Jackson Labs stock: 006440 | |
| Recombinant DNA reagent | AAV9-hSYN-GFP-Cre | Addgene | Addgene_105540 | |
| Recombinant DNA reagent | AAV9-hSYN-GFP | Addgene | Addgene_105539 | |
| Antibody | Guinea pig polyclonal anti-NeuN | Synaptic Systems | Cat #266 004 | 1:1000 |
| Antibody | Rabbit monoclonal anti-pAkt (S473) | Cell Signaling | Cat #4060 RRID:AB_2315049 | 1:1000 |
| Antibody | Rabbit monoclonal anti-pS6 (S240/244) | Cell Signaling | Cat #5364 | 1:1000 |
| Other | Nissl stain | Invitrogen | Invitrogen N21482 | 1:50 |
| Software, algorithm | pClamp | Molecular Devices | RRID:SCR_011323 | |
| Software, algorithm | Sirenia | Pinnacle | RRID:SCR_016183 | |
| Software, algorithm | AxoGraph X | AxoGraph | RRID:SCR_014284 | |
| Software, algorithm | SPSS | SPSS | RRID:SCR_002865 | |
| Software, algorithm | Prism | GraphPad | RRID: SCR_002798 | |
| Software, algorithm | Fiji | NIH | RRID:SCR_002285 | |
| Software, algorithm | MATLAB | Mathworks | RRID:SCR_001622 |
Table 2
EEG power.
| Total power | |||||||
|---|---|---|---|---|---|---|---|
| Band | Two-way ANOVA p-value | ||||||
| Control vs. Pten LOF | Control vs. Pten-Raptor LOF | Control vs. Pten-Rictor LOF | Control vs. Pten-Raptor-Rictor LOF | Pten LOF vs. Pten-Raptor LOF | Pten LOF vs. Pten-Rictor LOF | Pten LOF vs. Pten-Raptor-Rictor LOF | |
| 1 | 0.7215 | 0.9996 | 0.9976 | 0.7021 | 0.8249 | 0.9347 | 0.1485 |
| 2 | 0.0833 | 0.8162 | 0.8509 | 0.7749 | >0.9999 | 0.276 | 0.043 |
| 3 | 0.0657 | 0.4328 | 0.5564 | 0.9949 | 0.5893 | 0.6387 | 0.0543 |
| 4 | 0.1205 | 0.2658 | 0.3091 | >0.9999 | 0.6358 | 0.79 | 0.1219 |
| 5 | 0.0834 | 0.1019 | 0.1838 | 0.9946 | 0.7452 | 0.6116 | 0.1144 |
| 6 | 0.0508 | 0.0779 | 0.127 | 0.8868 | 0.8606 | 0.6302 | 0.0988 |
| 7 | 0.0395 | 0.0829 | 0.0875 | 0.6727 | 0.9963 | 0.8508 | 0.1137 |
| 8 | 0.0321 | 0.0749 | 0.0746 | 0.6353 | >0.9999 | 0.9834 | 0.1093 |
| 9 | 0.0236 | 0.0727 | 0.0766 | 0.8311 | 0.9923 | 0.9993 | 0.0576 |
| 10 | 0.0156 | 0.0605 | 0.0609 | 0.9112 | 0.9096 | 0.9974 | 0.0297 |
| 11 | 0.0148 | 0.0469 | 0.0336 | 0.8046 | 0.7577 | 0.9889 | 0.0275 |
| 12 | 0.017 | 0.0376 | 0.0186 | 0.5816 | 0.7035 | 0.9837 | 0.0321 |
| 13 | 0.0219 | 0.0431 | 0.0138 | 0.5078 | 0.6552 | 0.9572 | 0.0379 |
| 14 | 0.0322 | 0.0298 | 0.0109 | 0.5927 | 0.4738 | 0.9128 | 0.0486 |
| 15 | 0.047 | 0.0172 | 0.0087 | 0.7629 | 0.35 | 0.8344 | 0.0616 |
| 16 | 0.0497 | 0.0133 | 0.0081 | 0.5221 | 0.2767 | 0.7401 | 0.0669 |
| 17 | 0.0386 | 0.0092 | 0.0104 | 0.4807 | 0.2108 | 0.6195 | 0.0524 |
| 18 | 0.0284 | 0.0104 | 0.0129 | 0.4624 | 0.1732 | 0.4864 | 0.0386 |
| 19 | 0.0241 | 0.0166 | 0.0139 | 0.607 | 0.1619 | 0.3975 | 0.0315 |
| 20 | 0.0221 | 0.0132 | 0.0179 | 0.3517 | 0.1556 | 0.368 | 0.0342 |
| 21 | 0.021 | 0.008 | 0.0176 | 0.3236 | 0.1487 | 0.3703 | 0.0334 |
| 22 | 0.0238 | 0.0078 | 0.0188 | 0.3161 | 0.1752 | 0.4039 | 0.0382 |
| 23 | 0.0279 | 0.0093 | 0.021 | 0.3728 | 0.2164 | 0.4387 | 0.0434 |
| 24 | 0.0303 | 0.0131 | 0.0247 | 0.4069 | 0.2433 | 0.4609 | 0.0463 |
| 25 | 0.0314 | 0.0191 | 0.0253 | 0.3983 | 0.2521 | 0.4648 | 0.0479 |
| 26 | 0.0366 | 0.0144 | 0.026 | 0.4339 | 0.2631 | 0.4714 | 0.0552 |
| 27 | 0.0399 | 0.0079 | 0.0264 | 0.4669 | 0.2576 | 0.4914 | 0.0599 |
| 28 | 0.0463 | 0.0064 | 0.0273 | 0.4853 | 0.2697 | 0.5059 | 0.0687 |
| 29 | 0.0559 | 0.0122 | 0.0282 | 0.4671 | 0.3075 | 0.5461 | 0.0831 |
| 30 | 0.0598 | 0.0141 | 0.0287 | 0.4514 | 0.3209 | 0.5616 | 0.0894 |
| Relative power | |||||||
| Band | Two-way ANOVA p-value | ||||||
| Control vs. Pten LOF | Control vs. Pten-Raptor LOF | Control vs. Pten-Rictor LOF | Control vs. Pten-Raptor-Rictor LOF | Pten LOF vs. Pten-Raptor LOF | Pten LOF vs. Pten-Rictor LOF | Pten LOF vs. Pten-Raptor-Rictor LOF | |
| 1 | <0.0001 | <0.0001 | 0.0033 | <0.0001 | 0.4967 | 0.0572 | 0.9743 |
| 2 | <0.0001 | 0.9986 | <0.0001 | <0.0001 | 0.0009 | 0.3614 | 0.9977 |
| 3 | <0.0001 | <0.0001 | <0.0001 | <0.0001 | 0.9337 | 0.9777 | 0.2279 |
| 4 | <0.0001 | <0.0001 | <0.0001 | <0.0001 | 0.997 | 0.8997 | 0.9044 |
| 5 | 0.5938 | 0.4988 | <0.0001 | 0.1852 | >0.9999 | 0.0063 | 0.9593 |
| 6 | 0.9826 | 0.0834 | 0.189 | 0.5724 | 0.3384 | 0.0796 | 0.9046 |
| 7 | 0.6153 | <0.0001 | 0.9878 | 0.0043 | <0.0001 | 0.8905 | <0.0001 |
| 8 | 0.0053 | 0.0074 | >0.9999 | 0.0208 | <0.0001 | 0.0114 | <0.0001 |
| 9 | 0.0065 | 0.9007 | 0.9998 | 0.832 | 0.0006 | 0.0053 | 0.0003 |
| 10 | 0.3806 | 0.9964 | 0.8873 | 0.9994 | 0.2612 | 0.0714 | 0.3248 |
| 11 | >0.9999 | 0.8412 | 0.1377 | 0.9282 | 0.9154 | 0.2466 | 0.9685 |
| 12 | 0.7573 | 0.4594 | 0.0076 | 0.6587 | 0.9923 | 0.2905 | 0.9999 |
| 13 | 0.2732 | 0.3278 | 0.002 | 0.5321 | >0.9999 | 0.5486 | 0.994 |
| 14 | 0.086 | 0.6136 | 0.0015 | 0.6451 | 0.8414 | 0.8216 | 0.819 |
| 15 | 0.0278 | 0.8819 | 0.0033 | 0.7984 | 0.3346 | 0.9894 | 0.4322 |
| 16 | 0.0089 | 0.9533 | 0.0105 | 0.9064 | 0.1119 | 0.9998 | 0.1569 |
| 17 | 0.0059 | 0.9659 | 0.0539 | 0.9184 | 0.0744 | 0.9312 | 0.1137 |
| 18 | 0.0062 | 0.9594 | 0.1831 | 0.9362 | 0.0828 | 0.7147 | 0.1027 |
| 19 | 0.0162 | 0.9653 | 0.4248 | 0.9619 | 0.1467 | 0.6116 | 0.152 |
| 20 | 0.0594 | 0.9772 | 0.6562 | 0.9777 | 0.2931 | 0.6739 | 0.2915 |
| 21 | 0.1876 | 0.9896 | 0.8068 | 0.9836 | 0.5003 | 0.8099 | 0.5378 |
| 22 | 0.397 | 0.9948 | 0.9024 | 0.9905 | 0.706 | 0.9022 | 0.7437 |
| 23 | 0.5863 | 0.996 | 0.9476 | 0.9958 | 0.8445 | 0.9485 | 0.8465 |
| 24 | 0.7443 | 0.998 | 0.972 | 0.998 | 0.9163 | 0.975 | 0.9174 |
| 25 | 0.8341 | 0.9992 | 0.9844 | 0.9988 | 0.9447 | 0.9851 | 0.9517 |
| 26 | 0.8939 | 0.9997 | 0.9931 | 0.9992 | 0.9617 | 0.9887 | 0.972 |
| 27 | 0.9375 | >0.9999 | 0.9965 | 0.9995 | 0.9721 | 0.9934 | 0.9851 |
| 28 | 0.9652 | >0.9999 | 0.9981 | 0.9996 | 0.9815 | 0.9967 | 0.993 |
| 29 | 0.9801 | >0.9999 | 0.9988 | 0.9996 | 0.9879 | 0.9983 | 0.9972 |
| 30 | 0.9886 | >0.9999 | 0.9993 | 0.9995 | 0.9922 | 0.9991 | 0.9991 |
Table 3
Results of statistical tests.
| Cell density (DAPI) | Classic ANOVA | F=12.44, p<0.0001 | ||||||||||
|---|---|---|---|---|---|---|---|---|---|---|
| Group | Control | Pten LOF | PtenRap LOF | PtenRic LOF | PtRapRic LOF | |||||
| Mean ± SEM | 49.09±1.45 | 38.52±1.28 | 47.1±1.83 | 41.78±1.44 | 52.49±0.984 | |||||
| Comparison | Con-Pten | Con-PRa | Con-PRi | Con-PRaRi | Pten-PRa | Pten-PRi | Pten-PRaRi | Pra-PRi | Pra-PRaRi | Pri-PRaRi |
| p-Value | 0.0002 | 0.8627 | 0.0072 | 0.5859 | 0.0044 | 0.5357 | <0.0001 | 0.111 | 0.2043 | 0.001 |
| Cre density | Classic ANOVA | F=10.15, p<0.0001 | ||||||||||
| Group | Control | Pten LOF | PtenRap LOF | PtenRic LOF | PtRapRic LOF | |||||
| Mean ± SEM | 21.79±1.56 | 14.08±1.15 | 20.69±0.876 | 15.33±1.03 | 21.62±1.41 | |||||
| Comparison | Con-Pten | Con-PRa | Con-PRi | Con-PRaRi | Pten-PRa | Pten-PRi | Pten-PRaRi | Pra-PRi | Pra-PRaRi | Pri-PRaRi |
| p-Value | 0.0018 | 0.9684 | 0.0074 | >0.9999 | 0.0027 | 0.9181 | 0.0022 | 0.0131 | 0.9827 | 0.0093 |
| Cre/DAPI ratio | Classic ANOVA | F=2.616, p=0.0629 | ||||||||||
| Group | Control | Pten LOF | PtenRap LOF | PtenRic LOF | PtRapRic LOF | |||||
| Mean ± SEM | 0.447±0.0190 | 0.385±0.0280 | 0.441±0.0184 | 0.366±0.0194 | 0.411±0.0196 | |||||
| Comparison | Con-Pten | Con-PRa | Con-PRi | Con-PRaRi | Pten-PRa | Pten-PRi | Pten-PRaRi | Pra-PRi | Pra-PRaRi | Pri-PRaRi |
| p-Value | 0.3742 | 0.9998 | 0.1294 | 0.8646 | 0.3568 | 0.9622 | 0.9336 | 0.1022 | 0.8935 | 0.6387 |
| Phospho-S6 MGV | Classic ANOVA | F=11.69, p<0.0001 | ||||||||||
| Group | Control | Pten LOF | PtenRap LOF | PtenRic LOF | PtRapRic LOF | |||||
| Mean ± SEM | 190±4.22 | 261±17.0 | 168±5.87 | 232±16.2 | 171±5.34 | |||||
| Comparison | Con-Pten | Con-PRa | Con-PRi | Con-PRaRi | Pten-PRa | Pten-PRi | Pten-PRaRi | Pra-PRi | Pra-PRaRi | Pri-PRaRi |
| p-Value | <0.0001 | 0.1569 | 0.0074 | 0.2862 | <0.0001 | 0.0809 | <0.0001 | 0.0004 | 0.8616 | 0.0023 |
| Phospho-Akt MGV | Kruskal-Wallis test | K=19.92, p=0.0006 | ||||||||||
| Group | Control | Pten LOF | PtenRap LOF | PtenRic LOF | PtRapRic LOF | |||||
| Mean ± SEM | 149±2.46 | 174±6.15 | 177±8.10 | 144±2.75 | 148±4.86 | |||||
| Comparison | Con-Pten | Con-PRa | Con-PRi | Con-PRaRi | Pten-PRa | Pten-PRi | Pten-PRaRi | Pra-PRi | Pra-PRaRi | Pri-PRaRi |
| p-Value | 0.0126 | 0.0077 | 0.3828 | 0.7533 | 0.8739 | 0.0012 | 0.0171 | 0.0007 | 0.0115 | 0.6792 |
| Cortical thickness (µm) | Classic ANOVA | F=16.60, p<0.0001 | ||||||||||
| Group | Control | Pten LOF | PtenRap LOF | PtenRic LOF | PtRapRic LOF | |||||
| Mean ± SEM | 1.01±0.0225 | 1.21±0.0341 | 0.940±0.0254 | 1.01±0.0215 | 0.924±0.0399 | |||||
| Comparison | Con-Pten | Con-PRa | Con-PRi | Con-PRaRi | Pten-PRa | Pten-PRi | Pten-PRaRi | Pra-PRi | Pra-PRaRi | Pri-PRaRi |
| p-Value | 0.0011 | 0.4682 | >0.9999 | 0.3622 | <0.0001 | 0.0002 | <0.0001 | 0.3519 | 0.9956 | 0.2723 |
| Soma size (µm2) | Welch’s ANOVA | W=44.00, p<0.0001 | ||||||||||
| Group | Control | Pten LOF | PtenRap LOF | PtenRic LOF | PtRapRic LOF | |||||
| Mean ± SEM | 109±3.88 | 223±14.6 | 123±3.48 | 160±3.18 | 117±1.90 | |||||
| Comparison | Con-Pten | Con-PRa | Con-PRi | Con-PRaRi | Pten-PRa | Pten-PRi | Pten-PRaRi | Pra-PRi | Pra-PRaRi | Pri-PRaRi |
| p-Value | 0.0021 | 0.1536 | <0.0001 | 0.5204 | 0.0041 | 0.0539 | 0.0055 | <0.0001 | 0.7598 | <0.0001 |
| GS occurrence (binary) | Generalized linear model | Wald = 15.13, p=0.004 | ||||||||||
| Group | Control | Pten LOF | PtenRap LOF | PtenRic LOF | PtRapRic LOF | |||||
| Mean ± SEM | 0/9 | 4/7 | 2/6 | 2/7 | 0/6 | |||||
| Comparison | Con-Pten | Con-PRa | Con-PRi | Con-PRaRi | Pten-PRa | Pten-PRi | Pten-PRaRi | Pra-PRi | Pra-PRaRi | Pri-PRaRi |
| p-Value | 0.023 | 0.833 | .933 | 1 | 1 | 1 | 0.023 | 1 | 0.833 | 0.943 |
| GS frequency (#/day) | Kruskal-Wallis test | K=9.475, p=0.0503 | ||||||||||
| Group | Control | Pten LOF | PtenRap LOF | PtenRic LOF | PtRapRic LOF | |||||
| Mean ± SEM | 0.00±0.00 | 0.470±0.216 | 0.260±0.206 | 0.142±0.0920 | 0.00±0.00 | |||||
| Comparison | Con-Pten | Con-PRa | Con-PRi | Con-PRaRi | Pten-PRa | Pten-PRi | Pten-PRaRi | Pra-PRi | Pra-PRaRi | Pri-PRaRi |
| p-Value | 0.0678 | >0.9999 | >0.9999 | >0.9999 | >0.9999 | >0.9999 | 0.1418 | >0.9999 | >0.9999 | >0.9999 |
| GS length (all events; s) | Kruskal-Wallis test | K=23.29, p<0.0001 | ||||||||||
| Group | Control | Pten LOF | PtenRap LOF | PtenRic LOF | PtRapRic LOF | |||||
| Mean ± SEM | n/a | 35.5±2.02 | 64.1±4.93 | 33.8±2.46 | n/a | |||||
| Comparison | Con-Pten | Con-PRa | Con-PRi | Con-PRaRi | Pten-PRa | Pten-PRi | Pten-PRaRi | Pra-PRi | Pra-PRaRi | Pri-PRaRi |
| p-Value | n/a | n/a | n/a | n/a | <0.0001 | >0.9999 | n/a | 0.0021 | n/a | n/a |
| SWD frequency (#/hour) | Classic ANOVA | F=32.36, p<0.0001 | ||||||||||
| Group | Control | Pten LOF | PtenRap LOF | PtenRic LOF | PtRapRic LOF | |||||
| Mean ± SEM | 0.292±0.156 | 10.5±1.42 | 9.41±0.969 | 6.66±0.930 | 0.563±0.304 | |||||
| Comparison | Con-Pten | Con-PRa | Con-PRi | Con-PRaRi | Pten-PRa | Pten-PRi | Pten-PRaRi | Pra-PRi | Pra-PRaRi | Pri-PRaRi |
| p-Value | <0.0001 | <0.0001 | <0.0001 | 0.9994 | 0.9025 | 0.0258 | <0.0001 | 0.214 | <0.0001 | 0.0003 |
| SWD length (animal mean; s) | Kruskal-Wallis test | K=2.420, p=0.7280 | ||||||||||
| Group | Control | Pten LOF | PtenRap LOF | PtenRic LOF | PtRapRic LOF | |||||
| Mean ± SEM | 5.33±1.59 | 5.15±0.395 | 5.36±0.245 | 5.11±0.283 | 5.14±0.167 | |||||
| Comparison | Con-Pten | Con-PRa | Con-PRi | Con-PRaRi | Pten-PRa | Pten-PRi | Pten-PRaRi | Pra-PRi | Pra-PRaRi | Pri-PRaRi |
| p-Value | >0.9999 | >0.9999 | >0.9999 | >0.9999 | >0.9999 | >0.9999 | >0.9999 | >0.9999 | >0.9999 | >0.9999 |
| Cumulative coastline (line length*108) | Kruskal-Wallis test | K=22.97, p=0.0001 | ||||||||||
| Group | Control | Pten LOF | PtenRap LOF | PtenRic LOF | PtRapRic LOF | |||||
| Mean ± SEM | 2.52±0.186 | 4.51±0.469 | 3.44±0.194 | 3.83±0.260 | 2.74±0.133 | |||||
| Comparison | Con-Pten | Con-PRa | Con-PRi | Con-PRaRi | Pten-PRa | Pten-PRi | Pten-PRaRi | Pra-PRi | Pra-PRaRi | Pri-PRaRi |
| p-Value | 0.0005 | 0.2844 | 0.011 | >0.9999 | >0.9999 | >0.9999 | 0.0128 | >0.9999 | >0.9999 | 0.1179 |
| Mean EEG amplitude (µV) | Classic ANOVA | F=7.223, p=0.0003 | ||||||||||
| Group | Control | Pten LOF | PtenRap LOF | PtenRic LOF | PtRapRic LOF | |||||
| Mean ± SEM | 33.7±2.55 | 57.1±5.71 | 48.2±2.96 | 47.8±3.45 | 36.3±2.78 | |||||
| Comparison | Con-Pten | Con-PRa | Con-PRi | Con-PRaRi | Pten-PRa | Pten-PRi | Pten-PRaRi | Pra-PRi | Pra-PRaRi | Pri-PRaRi |
| p-Value | 0.0004 | 0.0576 | 0.0505 | 0.9851 | 0.4792 | 0.4018 | 0.0049 | >0.9999 | 0.2388 | 0.2322 |
| Mean EEG power (µV2*105) | Classic ANOVA | F=8.123, p=0.0001 | ||||||||||
| Group | Control | Pten LOF | PtenRap LOF | PtenRic LOF | PtRapRic LOF | |||||
| Mean ± SEM | 0.888±0.128 | 2.70±0.426 | 1.95±0.244 | 1.99±0.317 | 1.03±0.134 | |||||
| Comparison | Con-Pten | Con-PRa | Con-PRi | Con-PRaRi | Pten-PRa | Pten-PRi | Pten-PRaRi | Pra-PRi | Pra-PRaRi | Pri-PRaRi |
| p-Value | 0.0002 | 0.0613 | 0.0349 | 0.9954 | 0.3373 | 0.3552 | 0.0019 | >0.9999 | 0.2003 | 0.14 |
Additional files
Download links
A two-part list of links to download the article, or parts of the article, in various formats.
Downloads (link to download the article as PDF)
Open citations (links to open the citations from this article in various online reference manager services)
Cite this article (links to download the citations from this article in formats compatible with various reference manager tools)
Hyperactivity of mTORC1- and mTORC2-dependent signaling mediates epilepsy downstream of somatic PTEN loss
eLife 12:RP91323.
https://doi.org/10.7554/eLife.91323.3


