Early parafoveal semantic integration in natural reading
- Centre for Human Brain Health, School of Psychology, University of Birmingham, United Kingdom
- Department of Psychology, Program in Neuroscience, and the Beckman Institute for Advanced Science and Technology, University of Illinois, United States
Figures
Figure 1
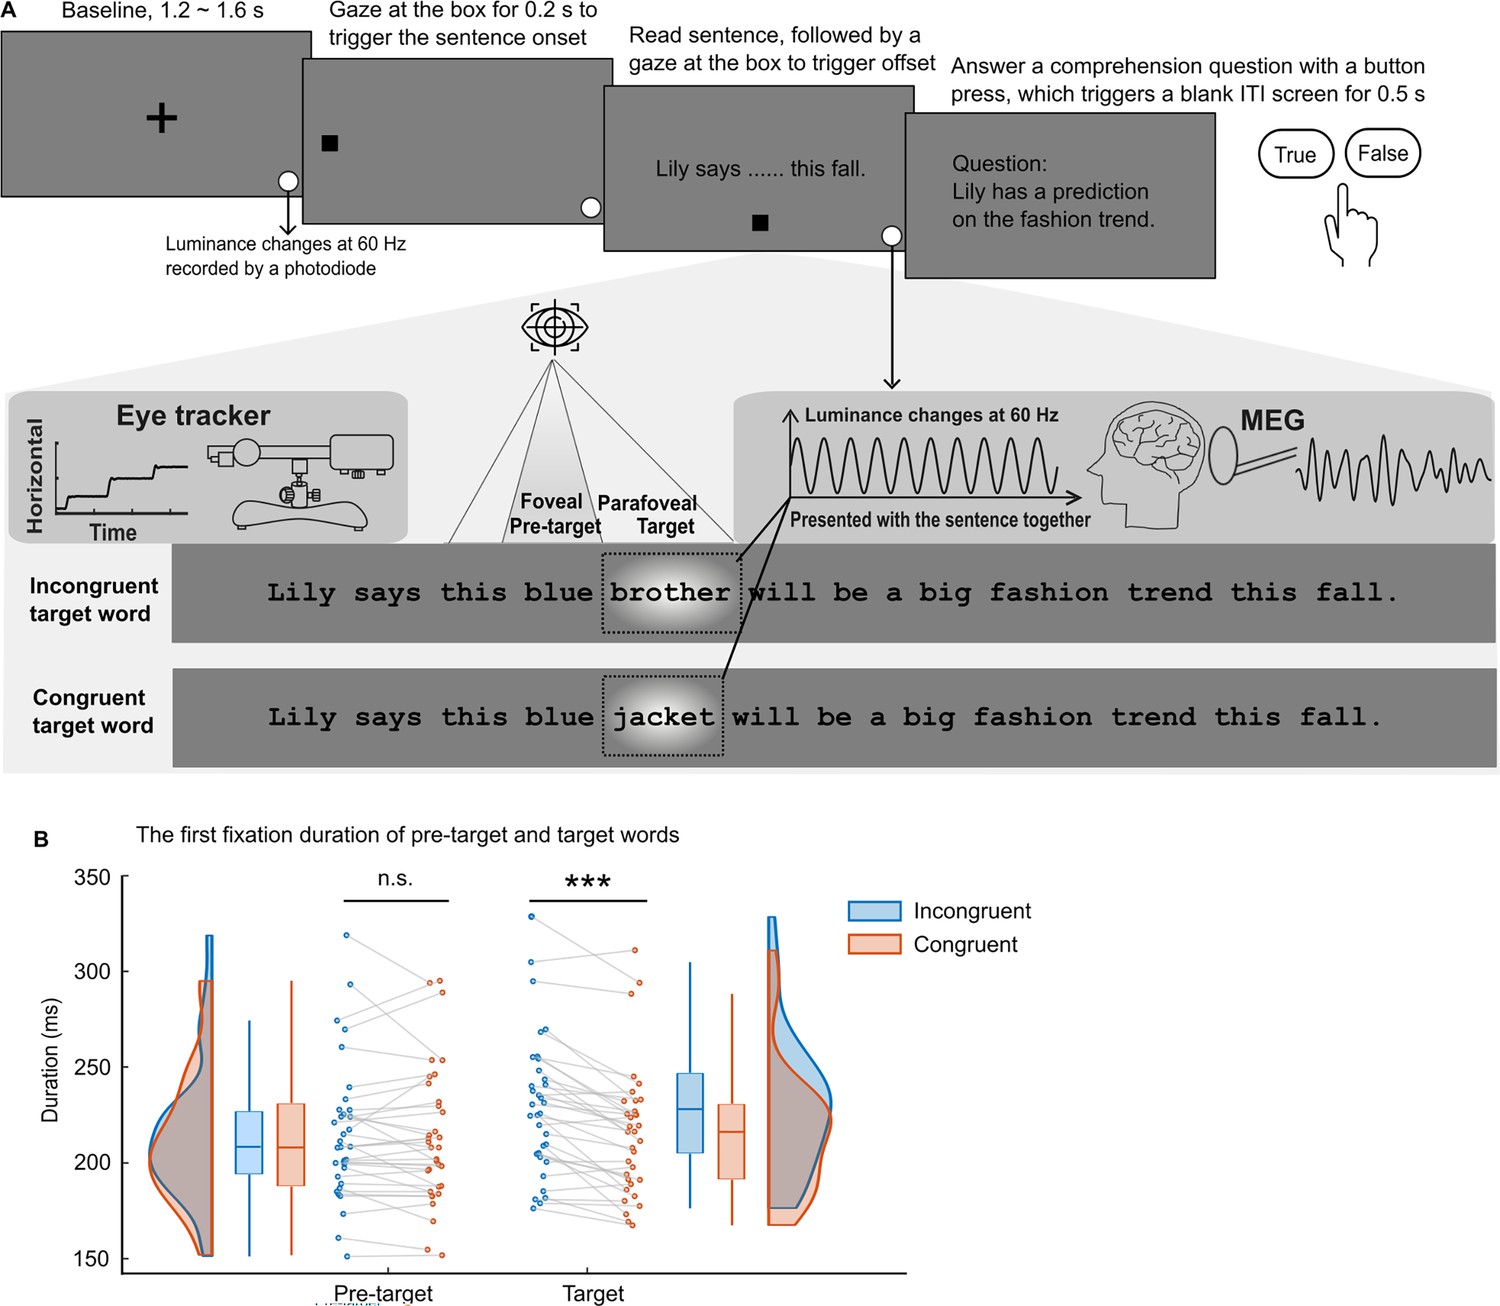
The paradigm and the eye movement metrics.
(A) After the presentation of a cross-fixation at the screen centre for 1.2–1.6 s, a gaze-contingent box appeared near the left edge of the screen. Fixing the box for 0.2 s triggered the full sentence presentation. Participants (n=34) read 160 one-line sentences silently while brain activity and eye movements were recorded. Each sentence was embedded with one congruent or incongruent target word (see the dashed rectangle; not shown in the actual experiment). The target words could not be predicted based on the sentence context and word-level properties of congruent and incongruent targets were balanced by swapping them between two sentence frames. The target words were tagged by changing the luminance of the underlying patch (with a Gaussian mask) in a 60 Hz sinusoid throughout the sentence presentation (depicted as a bright blob, not shown in the actual experiment). Additionally, we included a small disk at the bottom right of the screen that displayed the tagging signal and was recorded by a photodiode throughout each trial. After reading, gazing at the bottom box for 0.2 s triggered the sentence offset. Twelve percent of the sentences were followed by a simple yes-or-no comprehension question. (B) The first fixation durations on the pre-target and target words when the target words were incongruent (in blue) or congruent (in orange) with the sentence context. Each dot indicates one participant (n=34). ***p<0.001; n.s., not statistically significant; ITI, inter-trial interval.
Figure 2
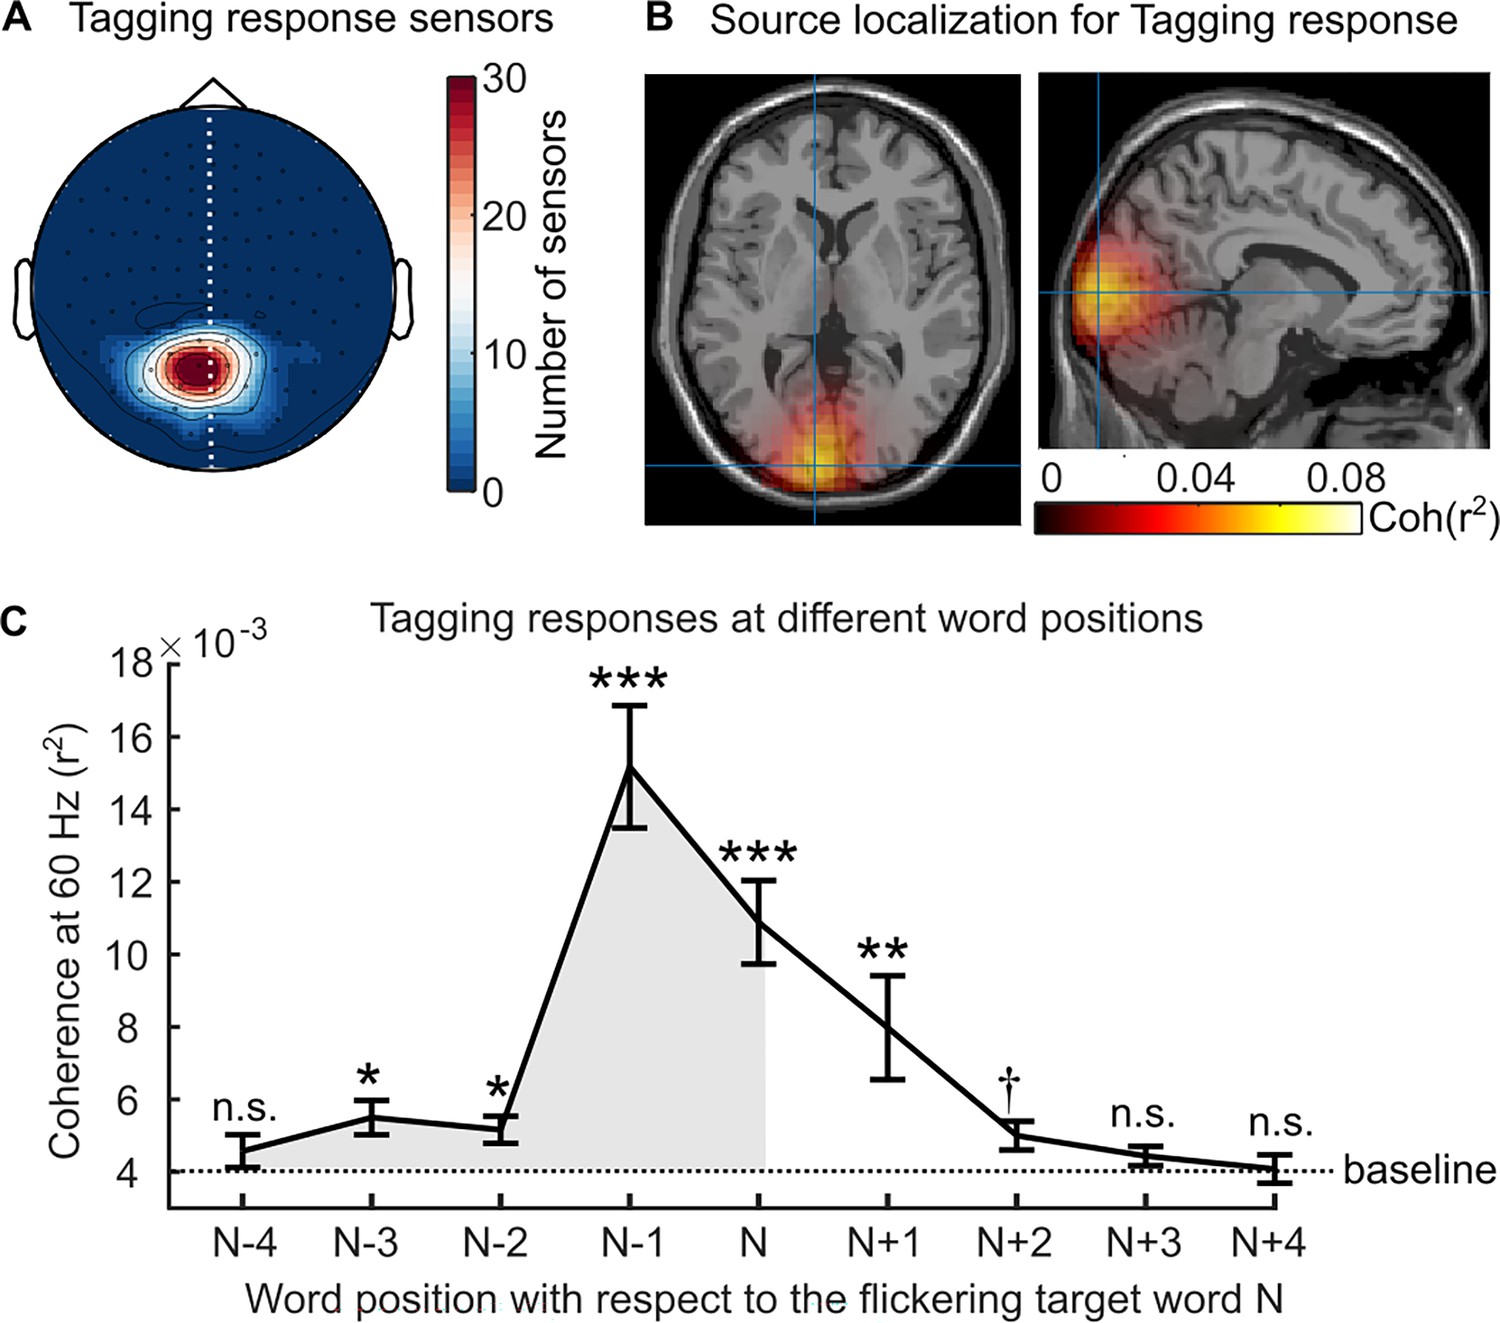
Neural responses to the rapid invisible frequency tagging (RIFT).
(A) Topography of the RIFT response sensors over all participants (7.9±4.5 sensors per participant, M ± SD). These sensors showed significantly stronger coherence to the tagging signal during the pre-target interval (with target words flickering in the parafovea) compared with the baseline interval (no flicker). Further analyses only included participants who had a RIFT response (n=29). (B) The source of the RIFT response sensors was localised to the left visual association cortex (MNI coordinates [-9–97 3] mm, Brodmann area 18). (C) The averaged 60 Hz coherence over the RIFT response sensors when participants fixated on words at different positions, where n indicates the target word and n-1 indicates the pre-target word. Error bars indicate the SE over participants (n=29). The shaded area indicates the RIFT responses when previewing the flickering target words. We compared the RIFT response at each word position with the baseline (the dashed line). ***p<0.001, **p<0.01, *p<0.05, †p=0.051; n.s., not statistically significant.
Figure 3
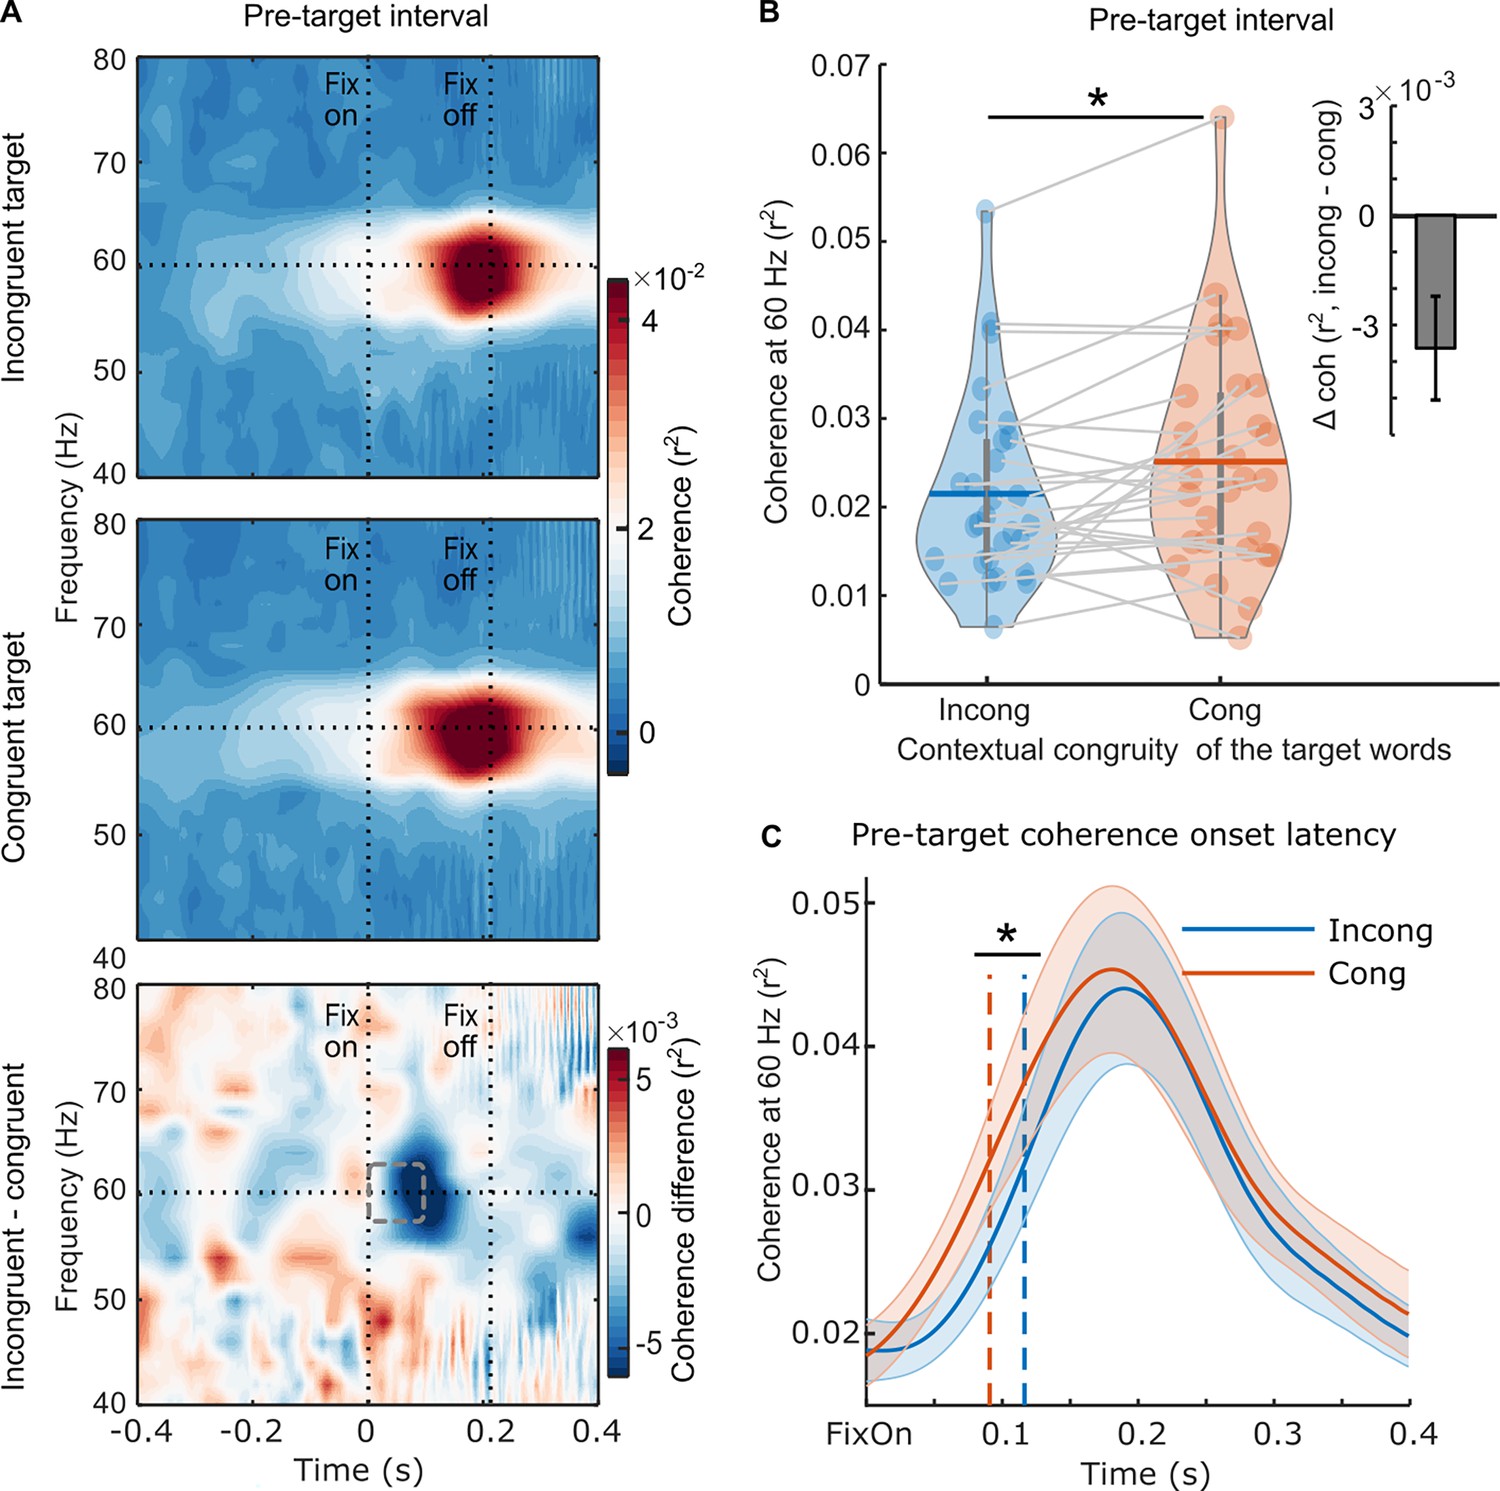
Neural evidence for parafoveal semantic integration.
(A) The pre-target coherence spectrum averaged over the rapid invisible frequency tagging (RIFT) response sensors at the group level (n=29) when the subsequent target words were incongruent with the sentence context (top panel), congruent with the sentence context (middle panel), and the difference between the two conditions (bottom panel). The horizontal line indicates the tagging frequency at 60 Hz. The two vertical lines indicate the first fixation onset of the pre-target words and the average fixation offset. (B) The averaged 60 Hz coherence during the minimum pre-target intervals for each participant (97.4±14.1ms, M ± SD; denoted as a dashed rectangle) with respect to the incongruent and congruent target words. Each dot indicates one participant, the horizontal lines inside of the violins indicate the mean values. The upright inserted figure shows the pre-target coherence difference over participants with the error bar as SE. (C) The onset latency of the pre-target coherence at the group level (n=29). The onset latency refers to the time when the coherence curve reaches its half maximum, denoted by the dotted lines. Zero time-point indicates the first fixation onset of the pre-target words. The shaded area shows SE around the mean value. *p<.05.
Figure 4
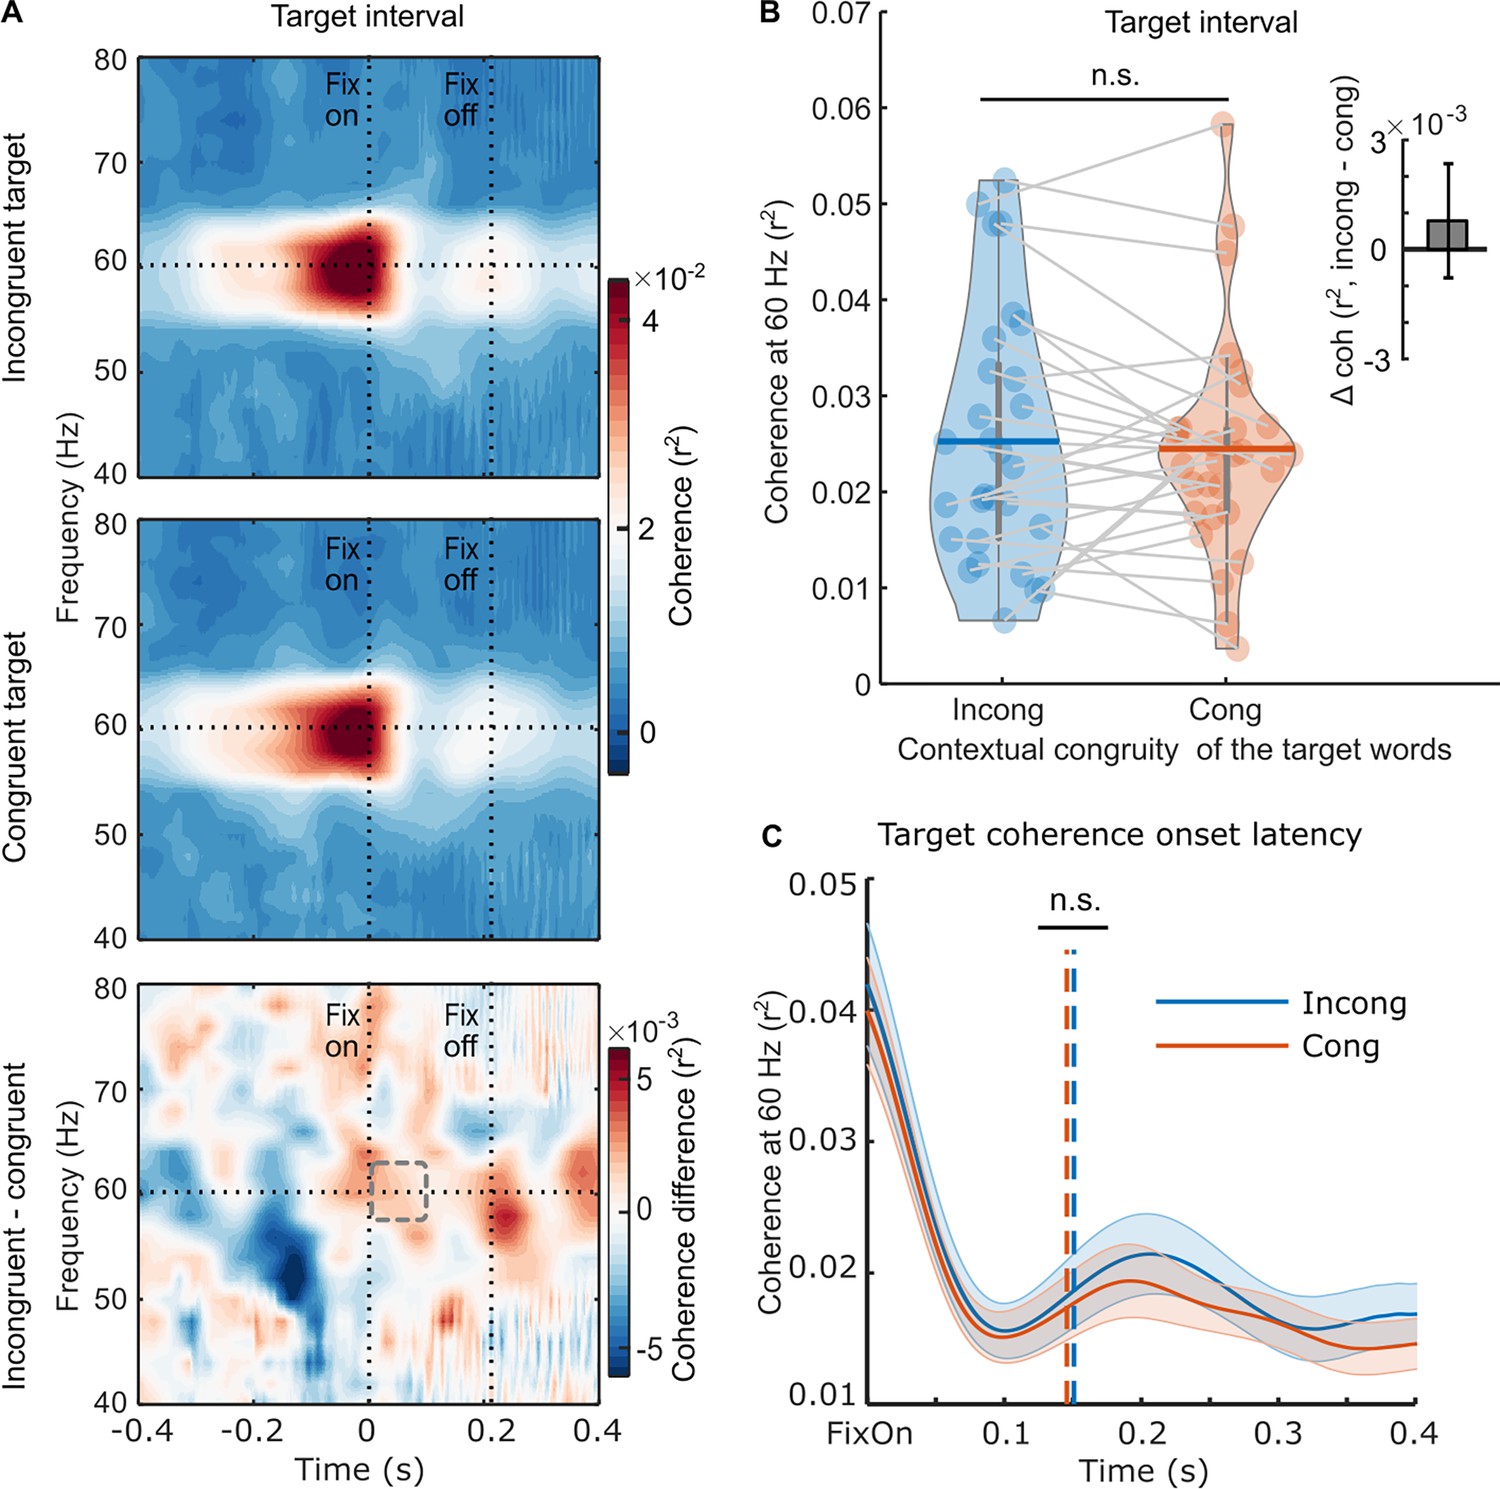
Neural responses to the rapid invisible frequency tagging (RIFT) during the target interval.
(A) The target coherence spectrum averaged over the RIFT response sensors at the group level (n=29) when the target words were incongruent with the sentence context (top panel), or congruent with the sentence context (middle panel); the bottom panel shows the difference between the two conditions. The horizontal line indicates the tagging frequency at 60 Hz. The two vertical lines indicate the first fixation onset of the target words and the averaged fixation offset. (B) We averaged the 60 Hz coherence within the minimum target fixation duration over participants (97.6±15.7 ms, M ± SD; denoted as a dashed rectangle). Each dot indicates one participant, and the horizontal lines inside of the violins indicate the mean values. The upright inserted figure shows the target coherence difference over participants with the error bar as SE. (C) A jackknife-based method was used to calculate the onset latency of the average coherence at the group level. The onset latency refers to the time when the coherence curve reaches its half maximum, denoted by the dotted lines. n.s., not statistically significant.
Figure 5

Individual reading speed is correlated with the magnitude of the rapid invisible frequency tagging (RIFT) congruency effect.
Reading speed was measured as the number of words read per second in the congruent sentences. The RIFT effect was measured as the coherence difference during the pre-target fixations for sentences containing incongruent and congruent target words. Each dot indicates one participant (n=29, Spearman correlation). The shaded area represents the 95% CI.
Appendix 1—figure 1
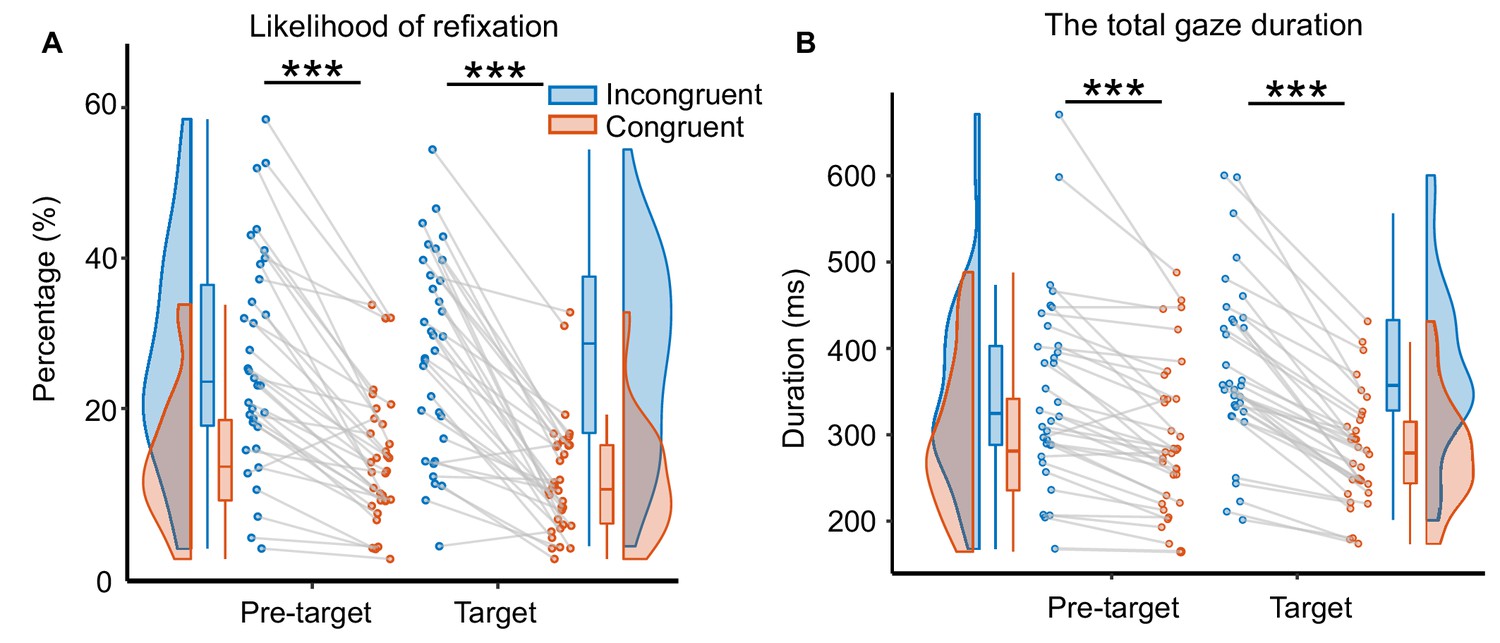
The likelihood of refixation and total gaze duration of eye movement data.
(A) The likelihood of refixation into a word was defined as the proportion of trials that have at least one regression from a later part of the sentence back to that word. We found that when the target words were contextually incongruent with the sentence compared with congruent, there was a significantly higher probability of regression into pre-target words (t(33) = 7.83, p=5.04×10⁻⁹, d=1.34, two-sided pairwise t-test) and target words (t(33) = 9.13, p=1.49×10⁻¹⁰, d=1.57, two-sided pairwise t-test). Each dot indicates one participant. (B) The total gaze duration was defined as the sum of all fixations on a given word, including those fixations during re-reading. Significantly longer total gaze durations were found for pre-target words (t(33) = 5.78, p=1.86×10⁻⁶, d=0.99, two-sided pairwise t-test) and target words (t(33) = 10.55, p=4.20×10⁻¹², d=1.81, two-sided pairwise t-test) when the target words were incongruent with the context compared with congruent. ***p<.001; n.s., not statistically significant.
Tables
Table 1
Characteristics of pre-target, target, and post-target words.
| Pre-target | Target | Post-target | |
|---|---|---|---|
| Word frequency | 124.5 (310.9) | 62.2 (77.0) | 3619.8 (6725.2) |
| Word Length | 5.5 (1.1) | 5.3 (1.1) | 5.4 (2.0) |
| Position in the sentence | 5.4 (3.0) | 6.4 (1.3) | 7.4 (1.3) |
-
Note. Word frequency is reported as the total CELEX frequency per million (Davis, 2005). Word length is the number of letters in a given word. Position in the sentence refers to the location in the sequence of words where a given word is presented. The number of words in each sentence is 11.6±1.7 (mean ± SD). All values shown here are mean with standard deviations in the parentheses. Note that the pre-target and post-target were identical for the congruent and incongruent conditions. The target word was counterbalanced over items such that it was congruent for one item and incongruent for another.
Additional files
Download links
A two-part list of links to download the article, or parts of the article, in various formats.
Downloads (link to download the article as PDF)
Open citations (links to open the citations from this article in various online reference manager services)
Cite this article (links to download the citations from this article in formats compatible with various reference manager tools)
Early parafoveal semantic integration in natural reading
eLife 12:RP91327.
https://doi.org/10.7554/eLife.91327.4


