Inhibiting NINJ1-dependent plasma membrane rupture protects against inflammasome-induced blood coagulation and inflammation
- Saha Cardiovascular Research Center, College of Medicine, University of Kentucky, United States
- Department of Pharmaceutical Sciences, Irma Lerma Rangel School of Pharmacy, Texas A&M University, United States
- Department of Molecular and Cellular Biochemistry, University of Kentucky, United States
- The Gill Heart and Vascular Institute, College of Medicine, University of Kentucky, United States
- Department of Microbiology, Immunology, and Molecular Genetics, College of Medicine, University of Kentucky, United States
- Department of Surgery, College of Medicine, University of Kentucky, United States
Figures
Figure 1 with 3 supplements

NINJ1 is critical for flagellin-induced systemic coagulation, inflammation, and lethality.
(A–E) Mice were injected intravenously with Ctrl (PBS) or Fla (500 ng LFn-Fla plus 3 μg protective agent [PA]). Blood was collected 90 min after Ctrl or Fla injection. Prothrombin time (A), plasma thrombin-antithrombin (TAT) (B), and plasma cytokines (C–E) were measured. Circles represent individual mice, with bars denoting means. **p<0.01 (two-way ANOVA with Holm-Sidak multiple comparisons). (F–G) Mice were injected intravenously with Ctrl or Fla. After 90 min, mice were euthanized and perfused with PBS, and tissues were isolated. (F) Lung sections were stained with the anti-fibrin monoclonal antibody (59D8). Scale bar denotes 20 μm. (G) Fibrin in the liver and lungs was detected by immunoblot with the anti-fibrin monoclonal antibody (59D8). (H) Mice were injected intravenously with a lethal dose of Fla (2.5 μg LFn-Fla plus 6 μg PA). Kaplan-Meier survival plots for mice challenged with Fla are shown. n=7–9. ****p<0.0001 versus WT (log rank test [Mantel-Cox]).
-
Figure 1—source data 1
Excel file containing numeric values for panels A-E and H.
- https://cdn.elifesciences.org/articles/91329/elife-91329-fig1-data1-v1.xlsx
-
Figure 1—source data 2
PDF file containing uncropped western blots with labeling for panel G.
- https://cdn.elifesciences.org/articles/91329/elife-91329-fig1-data2-v1.zip
-
Figure 1—source data 3
Original tiff files of western blots for panel G.
- https://cdn.elifesciences.org/articles/91329/elife-91329-fig1-data3-v1.zip
Figure 1—figure supplement 1

NINJ1 protein abundance at baseline in different tissues.
Protein was extracted from fresh frozen tissues and detected by immunoblot. Band intensities are not comparable between different tissues.
-
Figure 1—figure supplement 1—source data 1
PDF file containing uncropped western blots with labeling.
- https://cdn.elifesciences.org/articles/91329/elife-91329-fig1-figsupp1-data1-v1.zip
-
Figure 1—figure supplement 1—source data 2
Original tiff files of western blots.
- https://cdn.elifesciences.org/articles/91329/elife-91329-fig1-figsupp1-data2-v1.zip
Figure 1—figure supplement 2

Flagellin-induced inflammasome activation and pyroptosis.
Bone marrow-derived macrophages (BMDMs) from Ninj1+/+ mice were incubated with LFn-Fla (1 μg/mL) and/or protective agent (PA) (1 μg/mL) for 90 min. (A) Plasma membrane rupture (PMR) was measured by lactate dehydrogenase (LDH) release. (B) Caspase-1, IL-1β, and gasdermin-D (GSDMD) in the cell lysates and culture supernatant was detected by immunoblot. Circles represent individual mice, with bars denoting means. **p<0.01 versus each of the other three groups (Student’s t-test; unpaired).
-
Figure 1—figure supplement 2—source data 1
Excel file containing numeric values for panel A.
- https://cdn.elifesciences.org/articles/91329/elife-91329-fig1-figsupp2-data1-v1.xlsx
-
Figure 1—figure supplement 2—source data 2
PDF file containing uncropped western blots with labeling for panel B.
- https://cdn.elifesciences.org/articles/91329/elife-91329-fig1-figsupp2-data2-v1.zip
-
Figure 1—figure supplement 2—source data 3
Original tiff files of western blots for panel B.
- https://cdn.elifesciences.org/articles/91329/elife-91329-fig1-figsupp2-data3-v1.zip
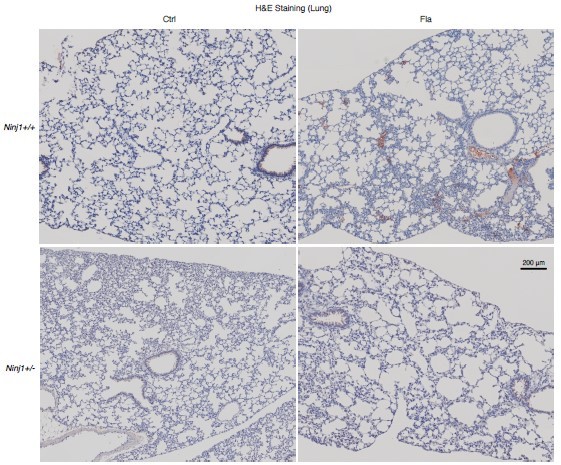
Figure 1—figure supplement 3
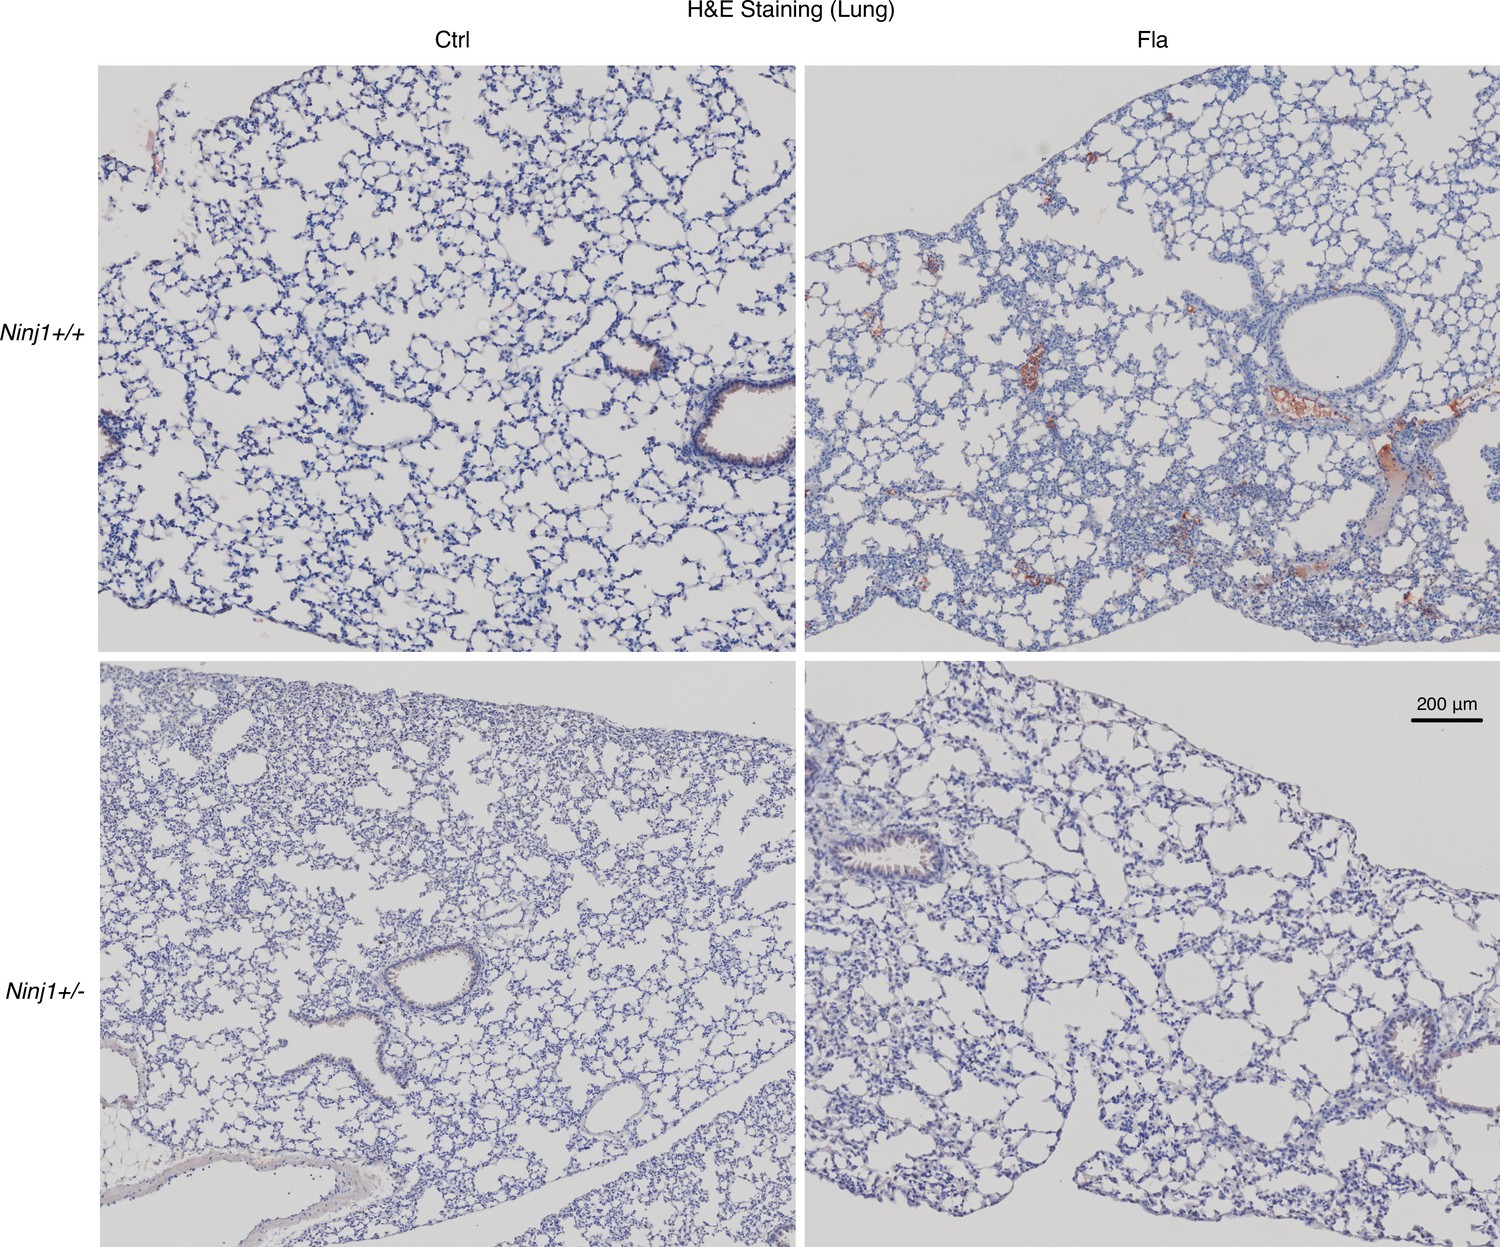
Flagellin-induced tissue fibrin deposition (H&E staining) in Ninj1+/+ and Ninj1+/- mice.
Mice were injected intravenously with Ctrl (PBS) or Fla (500 ng LFn-Fla plus 3μg protective agent [PA]). Tissues was collected 90 min after Ctrl or Fla injection. H&E staining was performed on PBS-perfused and paraffin-embedded lung tissue sections.
Figure 2
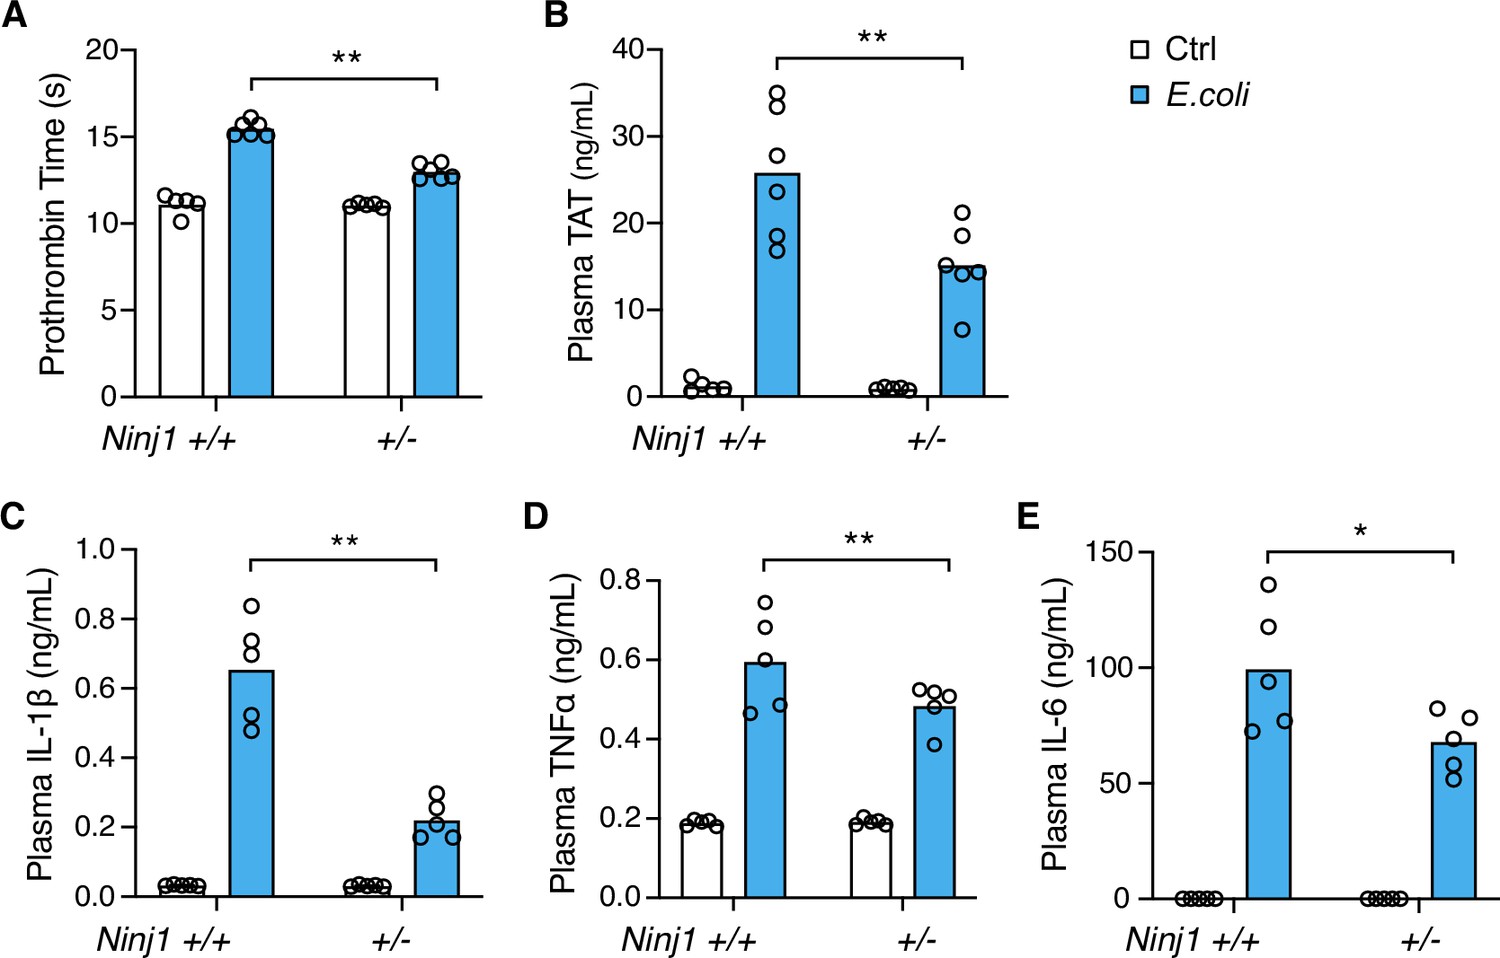
E. coli infection-induced blood coagulation is limited in Ninj1+/- mice.
(A–E) Mice were injected intraperitoneally with Ctrl (saline) or E. coli (2×10⁸ cfu per mouse). Blood was collected 6 hr afterward. Prothrombin time (A), plasma thrombin-antithrombin (TAT) (B), and plasma cytokines (C–E) were measured. Circles represent individual mice, with bars denoting means. *p<0.05, **p<0.01 (two-way ANOVA with Holm-Sidak multiple comparisons).
-
Figure 2—source data 1
Excel file containing numeric values for panel A-E.
- https://cdn.elifesciences.org/articles/91329/elife-91329-fig2-data1-v1.xlsx
Figure 3 with 1 supplement
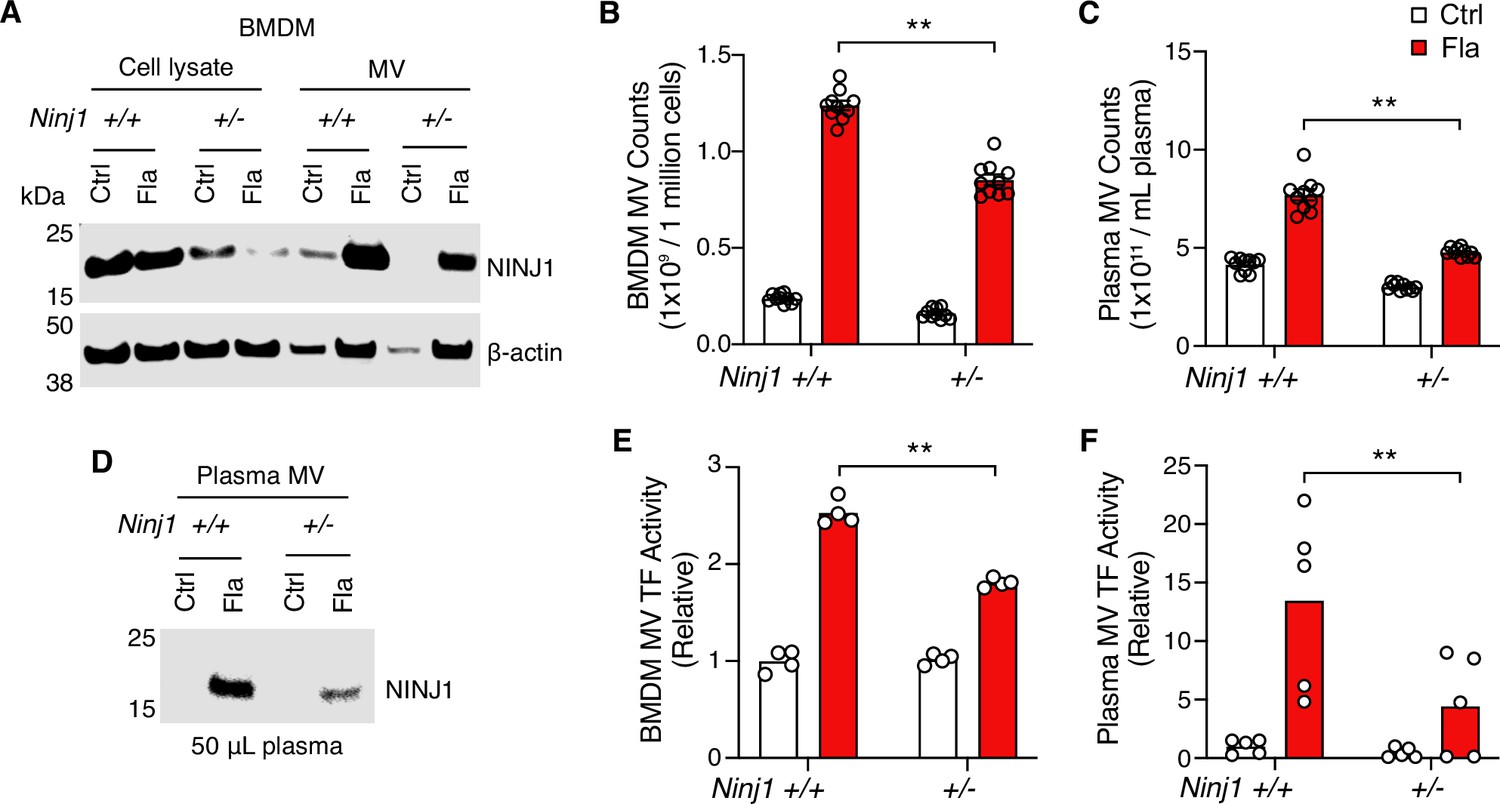
Plasma membrane rupture (PMR) promotes the release of procoagulant microvesicles (MVs).
(A–B, E) Bone marrow-derived macrophages (BMDMs) were incubated with Ctrl (PBS) or Fla (1 μg/mL LFn-Fla plus 1 μg/mL protective agent [PA]). Cell culture supernatant and MVs were collected after 90 min of incubation. (A) NINJ1 in cell lysates and MVs was detected by immunoblot. (B) BMDM MVs were counted with NanoSight. (E) BMDM MV tissue factor (TF) activity. Circles represent individual mouse, with bars denoting means. **p<0.01 (two-way ANOVA with Holm-Sidak multiple comparisons). (C, D, F) Mice were injected intravenously with Ctrl (PBS) or Fla (500 ng LFn-Fla plus 3 μg PA). Blood was collected 90 min after Ctrl or Fla injection. (C) Plasma MVs were counted with NanoSight. (D) NINJ1 in plasma MVs isolated from equal volume of plasma was detected by immunoblot. (F) Plasma MV TF activity. Circles represent individual mice, with bars denoting means. **p<0.01 (two-way ANOVA with Holm-Sidak multiple comparisons).
-
Figure 3—source data 1
PDF file containing uncropped western blots with labeling for panels A and D.
- https://cdn.elifesciences.org/articles/91329/elife-91329-fig3-data1-v1.zip
-
Figure 3—source data 2
Original tiff files of western blots for panels A and D.
- https://cdn.elifesciences.org/articles/91329/elife-91329-fig3-data2-v1.zip
-
Figure 3—source data 3
Excel file containing numeric values for panels B, C, E, and F.
- https://cdn.elifesciences.org/articles/91329/elife-91329-fig3-data3-v1.xlsx
Figure 3—figure supplement 1

Flagellin-induced pyroptosis and microvesicle (MV) release in Ninj1+/+ and Ninj1+/- bone marrow-derived macrophages (BMDMs).
BMDMs from Ninj1+/+ and Ninj1+/- mice were incubated with Ctrl (PBS) or Fla (1 μg/mL LFn-Fla plus 1 μg/mL protective agent [PA]) for 90 min. Lactate dehydrogenase (LDH) release (A) and ATP (B) were measured. Circles represent individual mice, with bars denoting means. **p<0.01, n.s. denotes not significant (two-way ANOVA with Holm-Sidak multiple comparisons). (C) BMDM MV quantity and size were analyzed with NanoSight.
-
Figure 3—figure supplement 1—source data 1
Excel file containing numeric values for panels A-C.
- https://cdn.elifesciences.org/articles/91329/elife-91329-fig3-figsupp1-data1-v1.xlsx
Figure 4 with 1 supplement
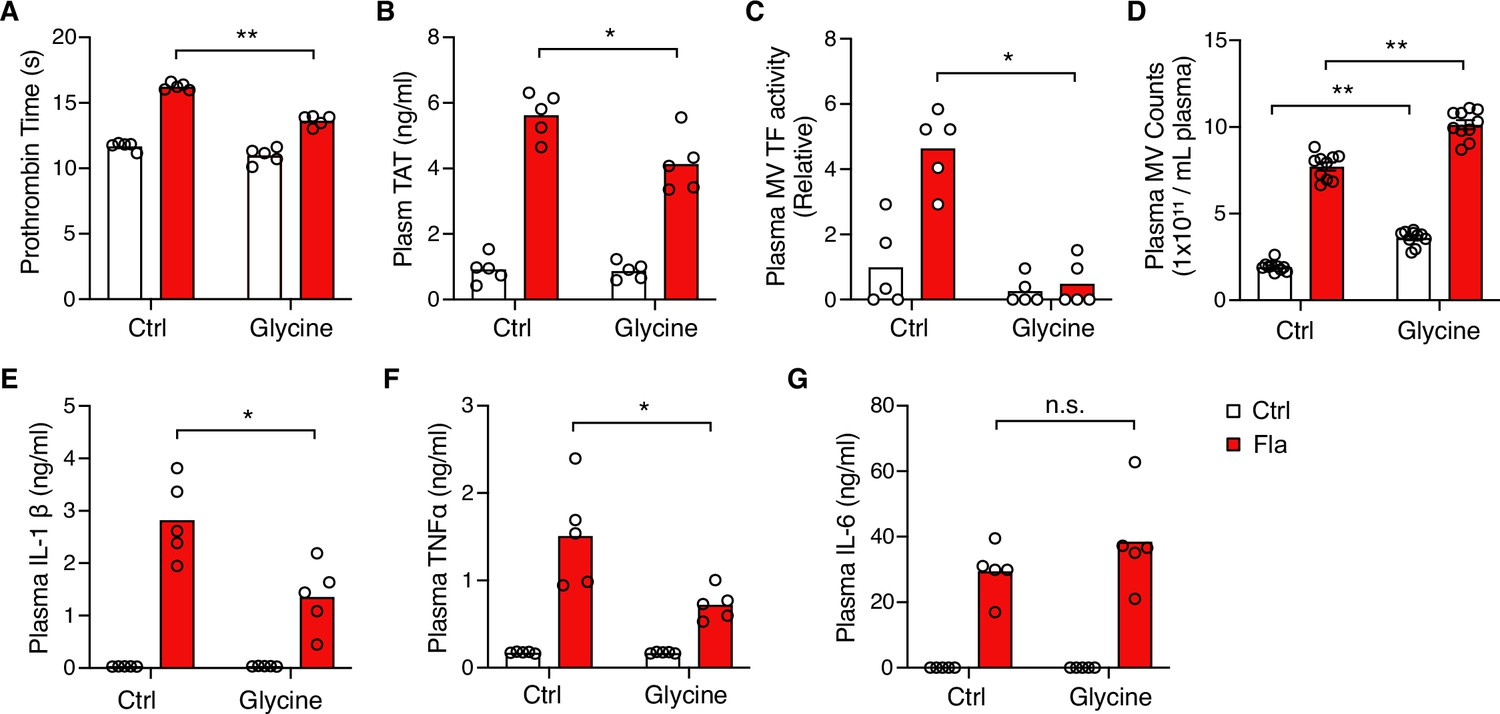
Glycine inhibition of NINJ1 blocks pyroptosis-induced blood coagulation.
Mice were injected intravenously 50 μL of 0.5 M glycine 2 hr before administrating Ctrl (PBS) or Fla (500 ng LFn-Fla plus 3 μg protective agent [PA]). Blood was collected 90 min after Ctrl or Fla injection. Prothrombin time (A), plasma thrombin-antithrombin (TAT) (B), plasma tissue factor (TF) microvesicle (MV) activity (C), plasma MV counts (D), and plasma cytokines (E–G) were measured. Circles represent individual mice, with bars denoting means. *p<0.05, **p<0.01, n.s. denotes not significant (two-way ANOVA with Holm-Sidak multiple comparisons).
-
Figure 4—source data 1
Excel file containing numeric values for panels A-G.
- https://cdn.elifesciences.org/articles/91329/elife-91329-fig4-data1-v1.xlsx
Figure 4—figure supplement 1
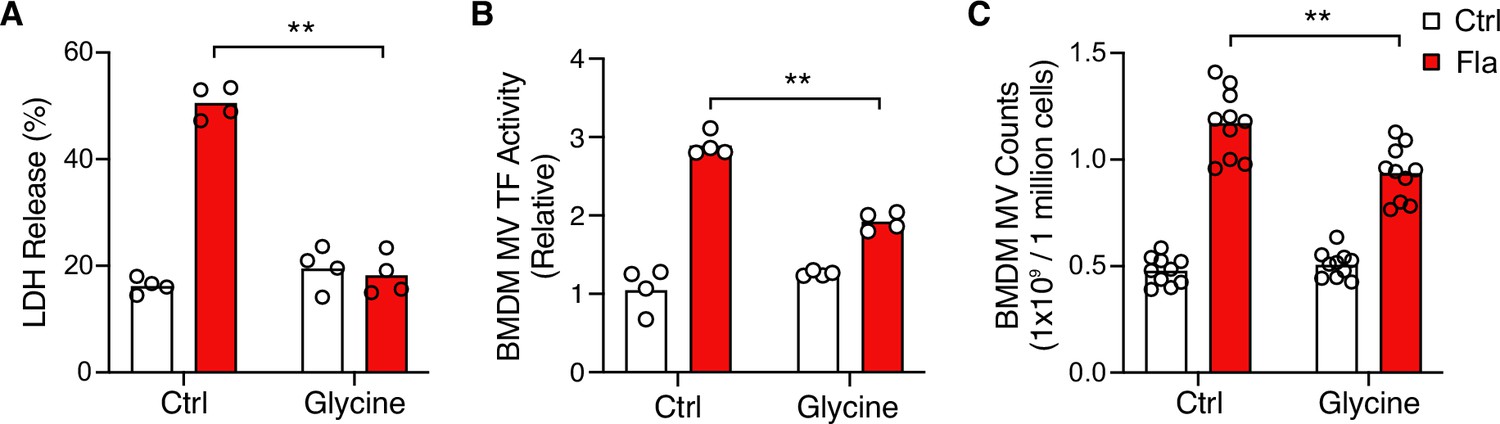
Glycine treatment inhibits bone marrow-derived macrophage (BMDM) microvesicle (MV) release.
(A–C) BMDMs from Ninj1+/+ mice were treated with 5 mM glycine for 30 min before incubation with Ctrl (PBS) or Fla (1 μg/mL LFn-Fla plus 1 μg/mL protective agent [PA]). Cell culture supernatant was collected after 90 min incubation. Lactate dehydrogenase (LDH) release (A), BMDM MV tissue factor (TF) activity (B), and MV counts (C) were measured. Circles represent individual mouse, with bars denoting means. **p<0.01, n.s. denotes not significant (two-way ANOVA with Holm-Sidak multiple comparisons).
-
Figure 4—figure supplement 1—source data 1
Excel file containing numeric values for panels A-G.
- https://cdn.elifesciences.org/articles/91329/elife-91329-fig4-figsupp1-data1-v1.xlsx
Author response image 1

Mice were injected with Fla (500 ng lFn-Fla plug3 ugPA).
Blood was collected 6 hours after Fla injection. Prothrombin time (A), plasma TAT (B), and plasma IL-6 (C) were measured. Mann-Whitney test were performed.
Author response image 2
Tables
Key resources table
| Reagent type (species) or resource | Designation | Source or reference | Identifiers | Additional information |
|---|---|---|---|---|
| Genetic reagent (Mus musculus) | Ninj1 knockout | Genentech, Inc; Kayagaki et al., 2021 | C57Bl/6 strain background | |
| Biological sample (Mus musculus) | Primary bone marrow-derived macrophages (Ninj1+/+ BMDMs) | This paper | Freshly prepared from Ninj1+/+ male mice at 8–12 weeks of age, described in the Materials and methods section | |
| Biological sample (Mus musculus) | Primary bone marrow-derived macrophages (Ninj1+/- BMDMs) | This paper | Freshly prepared from Ninj1+/- male mice at 8–12 weeks of age, described in the Materials and methods section | |
| Strain and strain background (Escherichia coli) | E. coli strain (EC10) | Dr. Kwang Sik Kim Division of Pediatric Infectious Diseases, Department of Pediatrics, Johns Hopkins University School of Medicine | ||
| Strain and strain background (Escherichia coli) | E. coli strain ClearColi BL21(DE3) | Lucigen Corporation (now Bioresearch Technologies) | 60810 | |
| Antibody | Anti-mouse NINJ1 (rabbit monoclonal) | Genentech, Inc; Kayagaki et al., 2021 | Ninj1-rbIgG-25:10363 | Western blot, 1 µg/mL |
| Antibody | Anti-TF antibody (rat monoclonal) | Genentech, Inc | 1H1 | MV TF activity, 100 µg/mL |
| Antibody | Anti-β-Actin (mouse monoclonal) | Bio-Rad | MCA5775 | Western blot, 1:1000 |
| Antibody | Anti-Caspase-1 (mouse monoclonal) | Adipogen | AG-20B-0042-C100 | Western blot, 1:1000 |
| Antibody | Anti-GSDMD (rabbit monoclonal) | Abcam | ab219800 | Western blot, 1:1000 |
| Antibody | Anti-IL-1β (rabbit polyclonal) | GeneTex | GTX74034 | Western blot, 1:1000 |
| Antibody | Anti-fibrin (mouse monoclonal) | Gift from Dr. Hartmut Weiler (Medical College of Wisconsin) and Dr. Rodney M Camire (University of Pennsylvania) | 59D8 | Western blot, 1:2000; Immunohistochemistry, 1:250 |
| Commercial assay or kit | CellTiter-Glo Luminescent Cell Viability Assay | Promega | G7572 | |
| Commercial assay or kit | CytoTox 96 Non-Radioactive Cytotoxicity Assay | Promega | G1780 | |
| Commercial assay or kit | Mouse TAT ELISA kit | Abcam | ab137994 | |
| Commercial assay or kit | Mouse IL-1β ELISA kit | Thermo Fisher Scientific | 88-7013A-88 | |
| Commercial assay or kit | Mouse IL-6 ELISA kit | Thermo Fisher Scientific | 88-7064-22 | |
| Commercial assay or kit | Mouse TNFα ELISA kit | Thermo Fisher Scientific | 88-7324-22 | |
| Peptide, recombinant protein | Protective agent (PA) | Zhenyu Li Laboratory Yinan Wei Laboratory | Described in the Materials and methods section | |
| Peptide, recombinant protein | LFn-flagellin | Zhenyu Li Laboratory Yinan Wei Laboratory | Described in the Materials and methods section | |
| Chemical compound and drug | HisPur Ni-NTA resin | Thermo Fisher Scientific | 88222 | |
| Chemical compound and drug | Thromboplastin-D | Pacific Hemostasis | 100357 | |
| Chemical compound and drug | RGR-XaChrom | Enzyme Research Laboratories | 100-03 | |
| Chemical compound and drug | Glycine | Sigma | G7126 | |
| Chemical compound and drug | LPS (E. coli O111:B4) | Sigma | L4130 | |
| Chemical compound and drug | T-PER tissue protein extraction reagent | Thermo Fisher Scientific | 78510 | |
| Chemical compound and drug | Cocktail inhibitor | Sigma | P8340 | |
| Software and algorithm | ImageStudio 5.0 | Li-COR | Western blot image | |
| Software and algorithm | Prism 9 | GraphPad Software Inc | ||
| Other | M.O.M. (Mouse on Mouse) ImmPRESS HRP (Peroxidase) Polymer Kit | Vector Laboratories | MP-2400 | Immunohistochemistry |
Additional files
Download links
A two-part list of links to download the article, or parts of the article, in various formats.
Downloads (link to download the article as PDF)
Open citations (links to open the citations from this article in various online reference manager services)
Cite this article (links to download the citations from this article in formats compatible with various reference manager tools)
Inhibiting NINJ1-dependent plasma membrane rupture protects against inflammasome-induced blood coagulation and inflammation
eLife 12:RP91329.
https://doi.org/10.7554/eLife.91329.3


