Four individually identified paired dopamine neurons signal taste punishment in larval Drosophila
- Department of Genetics, Leipzig University, Germany
- Department of Biology, University of Konstanz, Germany
- Centre for the Advanced Study of Collective Behaviour, University of Konstanz, Germany
- Center for Brain Science, Harvard University, United Kingdom
- Department of Molecular Brain Physiology and Behavior, LIMES Institute, University of Bonn, Germany
- German Centre for Integrative Biodiversity Research (iDiv) Halle-Jena-Leipzig, Germany
Figures
Figure 1 with 1 supplement
The larval dopaminergic system is subdivided into two functionally distinct clusters.
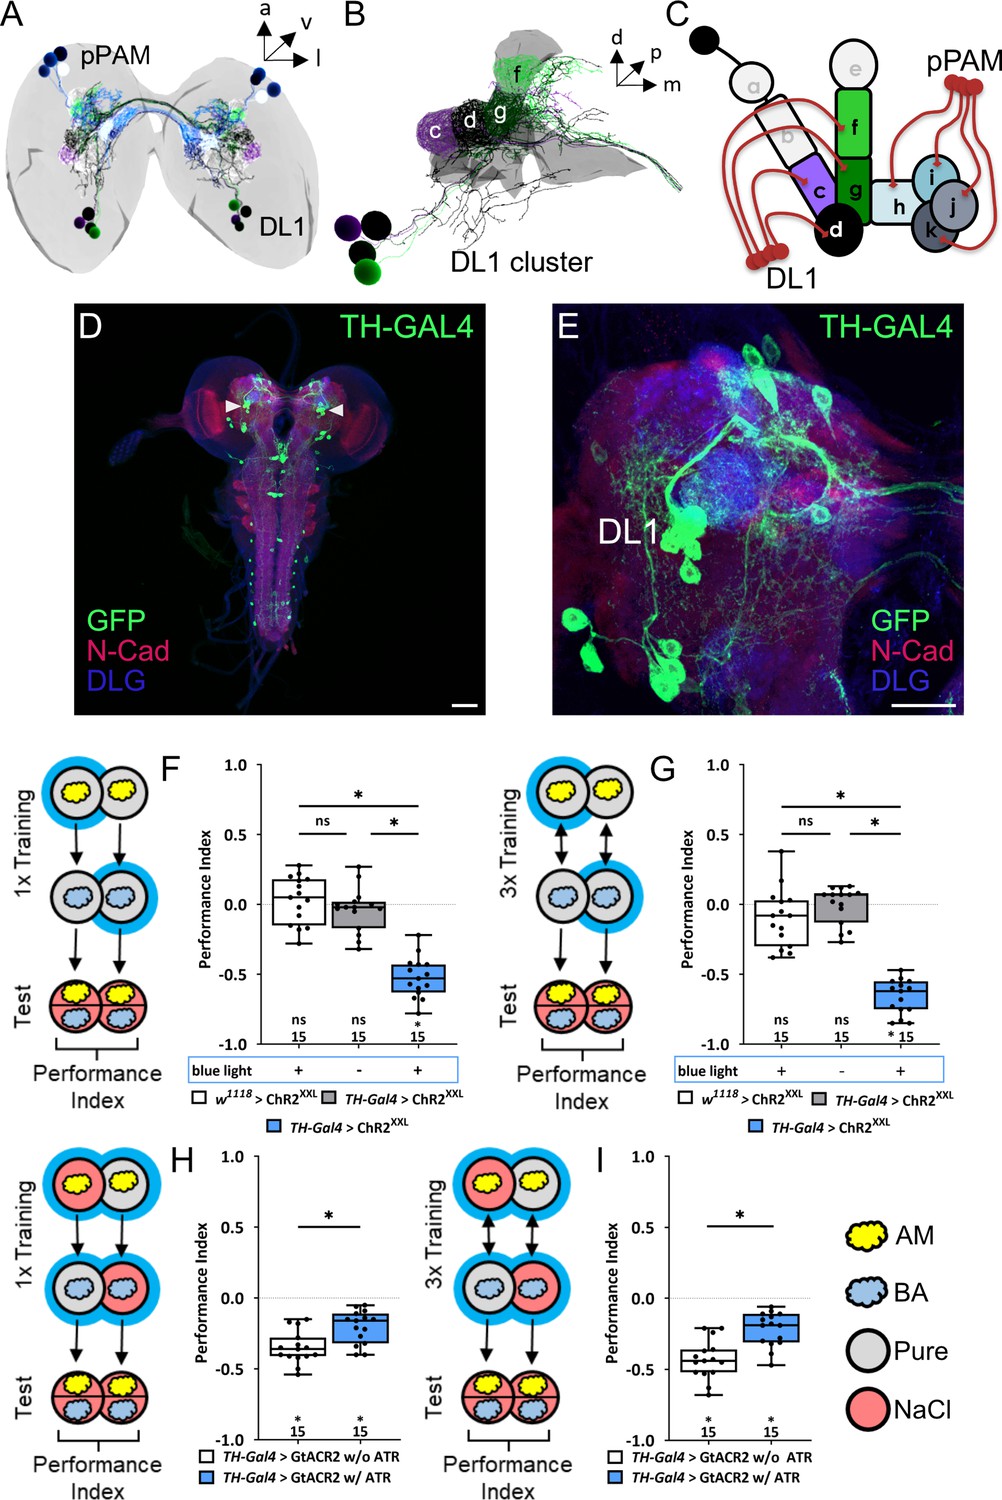
(A) The larval dopaminergic neurons (DANs) can be anatomically subdivided into the primary protocerebral anterior medial (pPAM) and dorsolateral 1 (DL1) cluster based on their cell body position. (B) The DL1 cluster (cell bodies in green and purple) consists of four DANs providing input to the c, d, g, and f compartments of the vertical lobe, peduncle, and lateral appendix of the mushroom body (MB). (in gray). (C) Schematic representation of the larval MB using single letter acronyms based on Saumweber et al., 2018 to indicate compartment innervation by MB input and output neurons. DL1 DANs specifically innervate the compartments c, d, f, and g in the vertical lobe, lateral appendix, and peduncle, whereas pPAM DANs innervate the shaft (h) and medial lobe (l, j, k) of the MB. (D, E) Four DL1 DANs (DAN-c1, DAN-d1, DAN-g1, and DAN-f1) are included in the expression pattern of the TH-Gal4 driver line. However, expression of a UAS-mCD8::GFP reporter via TH-Gal4 labels many more neurons (in green, anti-GFP) throughout the entire CNS (in red and blue, anti-N-cadherin and anti-discs large), in total about 100 neurons. (F) To test whether optogenetic activation of the DL1 DANs is sufficient to substitute for a punishment, we used the TH-Gal4 driver in combination with UAS-ChRXXL. Experimental and control larvae were trained by simultaneously presenting an odor and blue light and thus artificial activation of DL1 DANs, whereas a second odor was presented in darkness. Only larvae of the experimental genotype (p>0.05, N=15), but not of the two genetic controls (both p<0.05, for each group N=15), retrieve an aversive associative olfactory memory. The same result was seen after one or three training trials (F and G, respectively). (H, I) To test for the acute function of the DL1 DANs in aversive associative olfactory memory, we expressed GtACR2 via the TH-Gal4 driver. Acute optogenetic inhibition of synaptic output from DL1 and other DANs reduced odor high salt memory. Experimental larvae raised on supplemented food (0.5 mM all-trans-retinal, ATR) and trained in blue light performed on a lower level than control animals kept on standard food (p<0.05, for each group N=15). A memory impairment was seen after one and three training trials (G) and (H), respectively. All behavioral data is shown as box plots. Differences between groups are highlighted by horizontal lines between them. Performance indices different from random distribution are indicated below each box plot. The precise sample size is given below each box plot. n.s. p>0.05; *p<0.05. Scale bars: in (C) 50 µm and in (D) 25 µm. The source data and results of all statistical tests are documented in Figure 1—source data 1.
-
Figure 1—source data 1
Tables of the raw data with all individual preference indices, the calculated performance indices and the statistical analysis of each experiment.
- https://cdn.elifesciences.org/articles/91387/elife-91387-fig1-data1-v1.xlsx
Figure 1—figure supplement 1
The dopaminergic pPAM cluster encodes for a teaching signal in larvae.
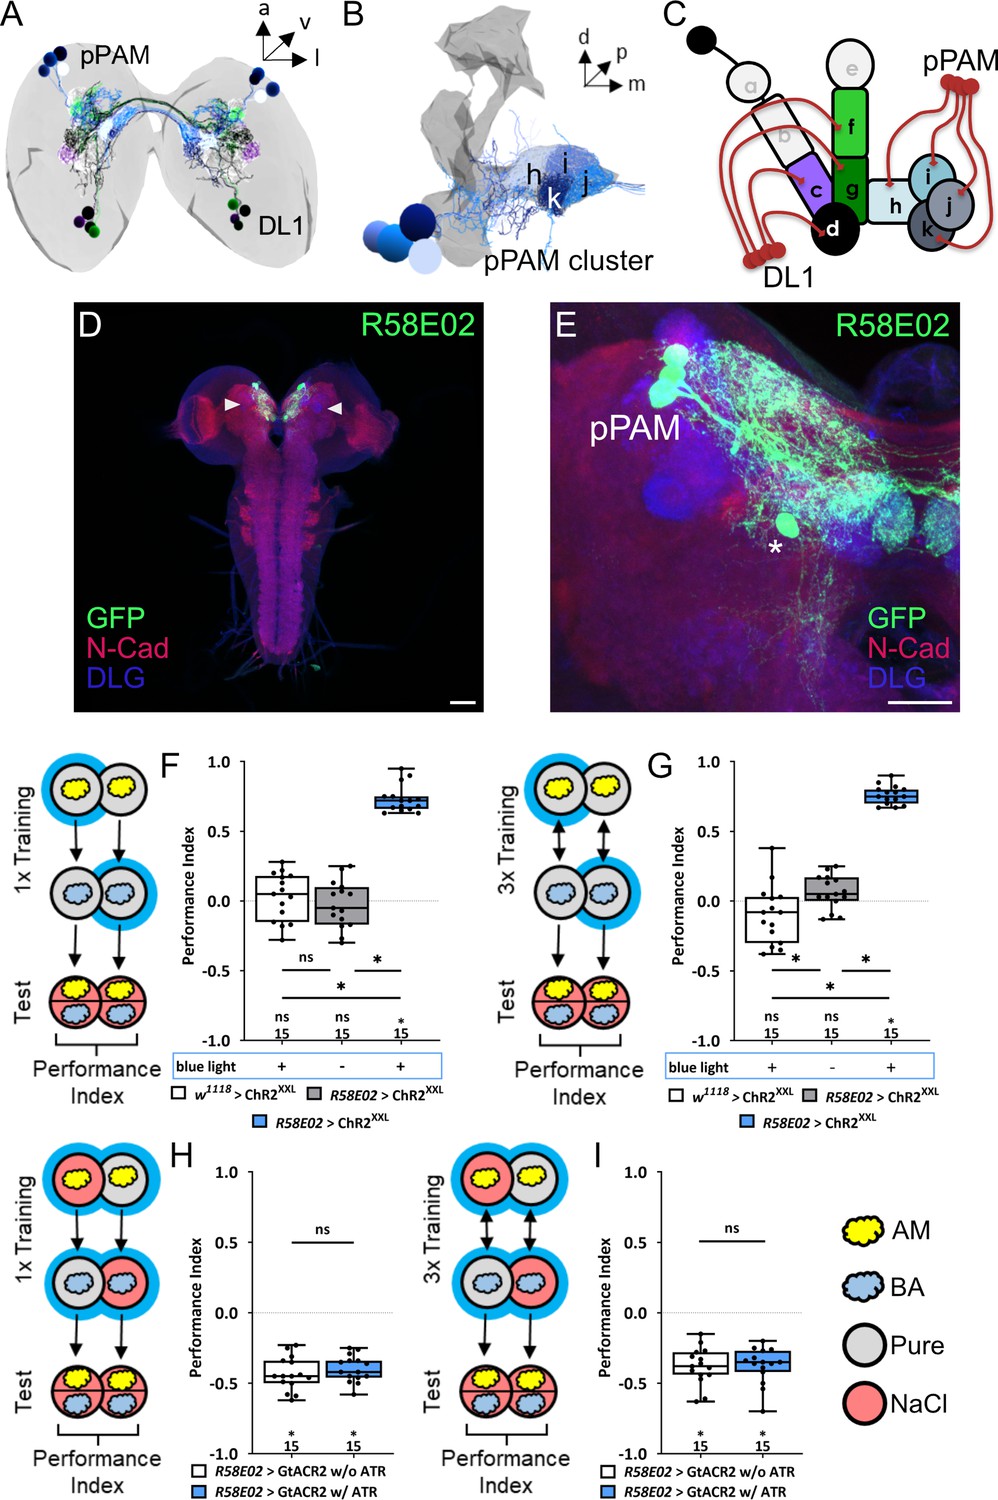
(A, B) The pPAM cluster (cell bodies in blue) consists of four dopaminergic neurons (DANs) providing input to the h, i, j, and k compartments of the medial lobe of the mushroom body (MB; in gray) – the larval memory center. (C) Schematic representation of the larval MB using single letter acronyms based on Saumweber et al., 2018 to indicate compartment innervation by MB input and output neurons. DL1 DANs specifically innervate the compartments c, d, f, and g in the vertical lobe, lateral appendix, and peduncle, whereas pPAM DANs innervate the shaft (h) and medial lobe (I, j, k) of the MB. (D, E) Three pPAM DANs (DAN-h1, DAN-i1, and DAN-j1) are specifically labeled via the R58E02 driver line. Expression of a UAS-GFP reporter via R58E02 labels only these three DANs (in green, anti-GFP) throughout the entire CNS (in red and blue, anti-N-cadherin and anti-discs large) besides one additional cell that does not innervate the MB (asterisk in E). (F) To test whether optogenetic activation of the pPAM DANs is sufficient to substitute for a reward, we used the R58E02 driver in combination with UAS-ChRXXL to express a modified form of Channelrhodopsin2. Experimental and effector control larvae were trained via presenting an odor stimulus together with blue light stimulation and thus artificial activation of pPAM DANs, whereas a second odor was presented in darkness. Furthermore, a genetic control group received the same training protocol without blue light stimulation. Only larvae of the experimental genotype (p>0.05), but not of the two genetic controls (both p<0.05, for each group N=15), retrieve an appetitive associative olfactory memory. This shows that activation of the pPAM DANs is sufficient to mediate a reward teaching signal. The same effect was seen applying one or three training trials (F and G, respectively). (H, I) To test for the acute function of the pPAM DANs in aversive associative olfactory memory, we expressed GtACR2, an anion-conducting, light-gated channel via the R58E02 driver. Acute optogenetic inhibition of synaptic output from pPAM DANs during training did not change odor high-salt memory. Experimental larvae kept on supplemented food with 0.5 mM all-trans-retinal (ATR) or genetic controls, maintained on standard food performed at the same level (p>0.05, for each group N=15). Intact odor high-salt memory was seen after one or three training trials (H and I, respectively). All behavioral data is shown as box plots. Differences between groups are highlighted by horizontal lines between them. Performance indices different from random distribution are indicated below each box plot. The precise sample size of each group is given below each box plot. n.s. p>0.05; *p<0.05. Scale bars: (D) 50 µm, (E) 25 µm. The source data and results of all statistical tests are documented in Figure 1—figure supplement 1—source data 1.
-
Figure 1—figure supplement 1—source data 1
Tables of the raw data with all individual preference indices, the calculated performance indices and the statistical analysis of each experiment.
- https://cdn.elifesciences.org/articles/91387/elife-91387-fig1-figsupp1-data1-v1.xlsx
Figure 2 with 2 supplements
Anatomical single-cell analysis of DL1 dopaminergic neuron (DAN) specific split-Gal4 driver lines.
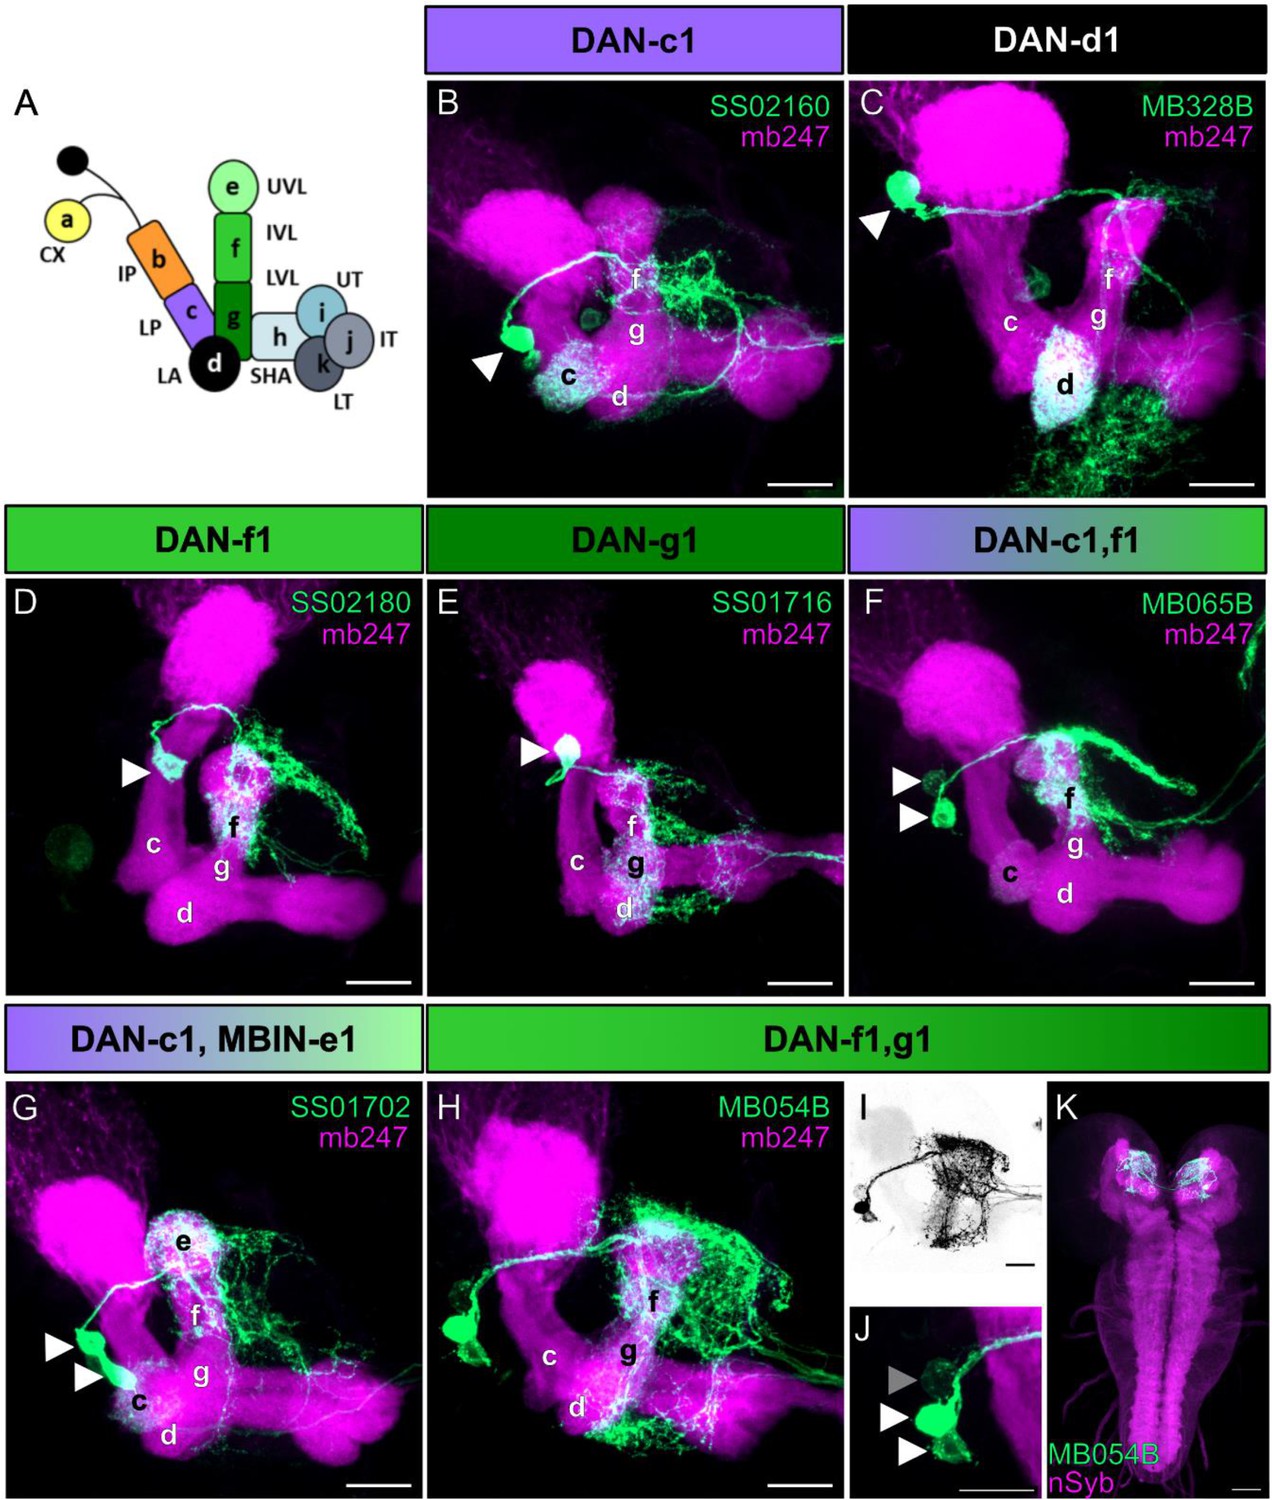
(A) The larval mushroom body (MB) is organized into 11 compartments: CX calyx; IP and LP intermediate and lower peduncle; LA lateral appendix; UVL, IVL, and LVL upper, intermediate, and lower vertical lobe; SHA, UT, IT, LT shaft as well as upper, intermediate, and lower toe of the medial lobe. Single-letter synonyms of compartment names are given as ‘a–k.’ These letters are used to indicate compartment innervation by the MB input and output neurons (Saumweber et al., 2018). DL1 cluster DANs are DAN-c1, DAN-d1, DAN-g1, and DAN-f1 that innervate the respective four different compartments of the MB. (B–J) Individual split-Gal4 driver lines were crossed with the reporter strain UAS-mCD8::GFP;mb247-lexA,lexAop-mRFP. Third instar larval brains were dissected, fixed, and mounted to visualize the fluorescent reporter signal labeling the MB (mb247-lexA, lexAop-mRFP shown in magenta) and the respective DAN pattern (GFP shown in green). (B–E) SS02160 (DAN-c1), MB328B (DAN-d1), SS02180 (DAN-f1), SS01716 (DAN-g1) each specifically label a single DL1 DAN (cell bodies are highlighted by white arrowheads). (F–K) Two neurons can be seen in MB065B, SS01702, and MB054B split-Gal4 that express in DAN-c1/DAN-f1, DAN-c1/MBIN-e1, and DAN-f1/DAN-g1. Please note that MB065B shows strong expression in DAN-f1 but weaker staining in DAN-c1. (H–K) MB054B showed reliable strong expression in DAN-f1 and DAN-g1. In some brains, a third weak cell body was visible right next to the other two DANs (I, J); GFP channel inverted and shown in black; (I; cell body highlighted with gray arrowhead). Due to the low expression level, we were not able to identify this cell given that only the g and f compartments of the MB were innervated (H). (K) Analysis of the entire brain via native fluorescence expression of GFP (green) and n-Syb (magenta) did not reveal additional cells for MB054B split-Gal4. Scale bars: (B–J) 20 µm, (K) 50 µm.
Figure 2—figure supplement 1
Ablation of individual DL dopaminergic neurons (DANs) does not impair aversive olfactory memory reinforced by high salt.
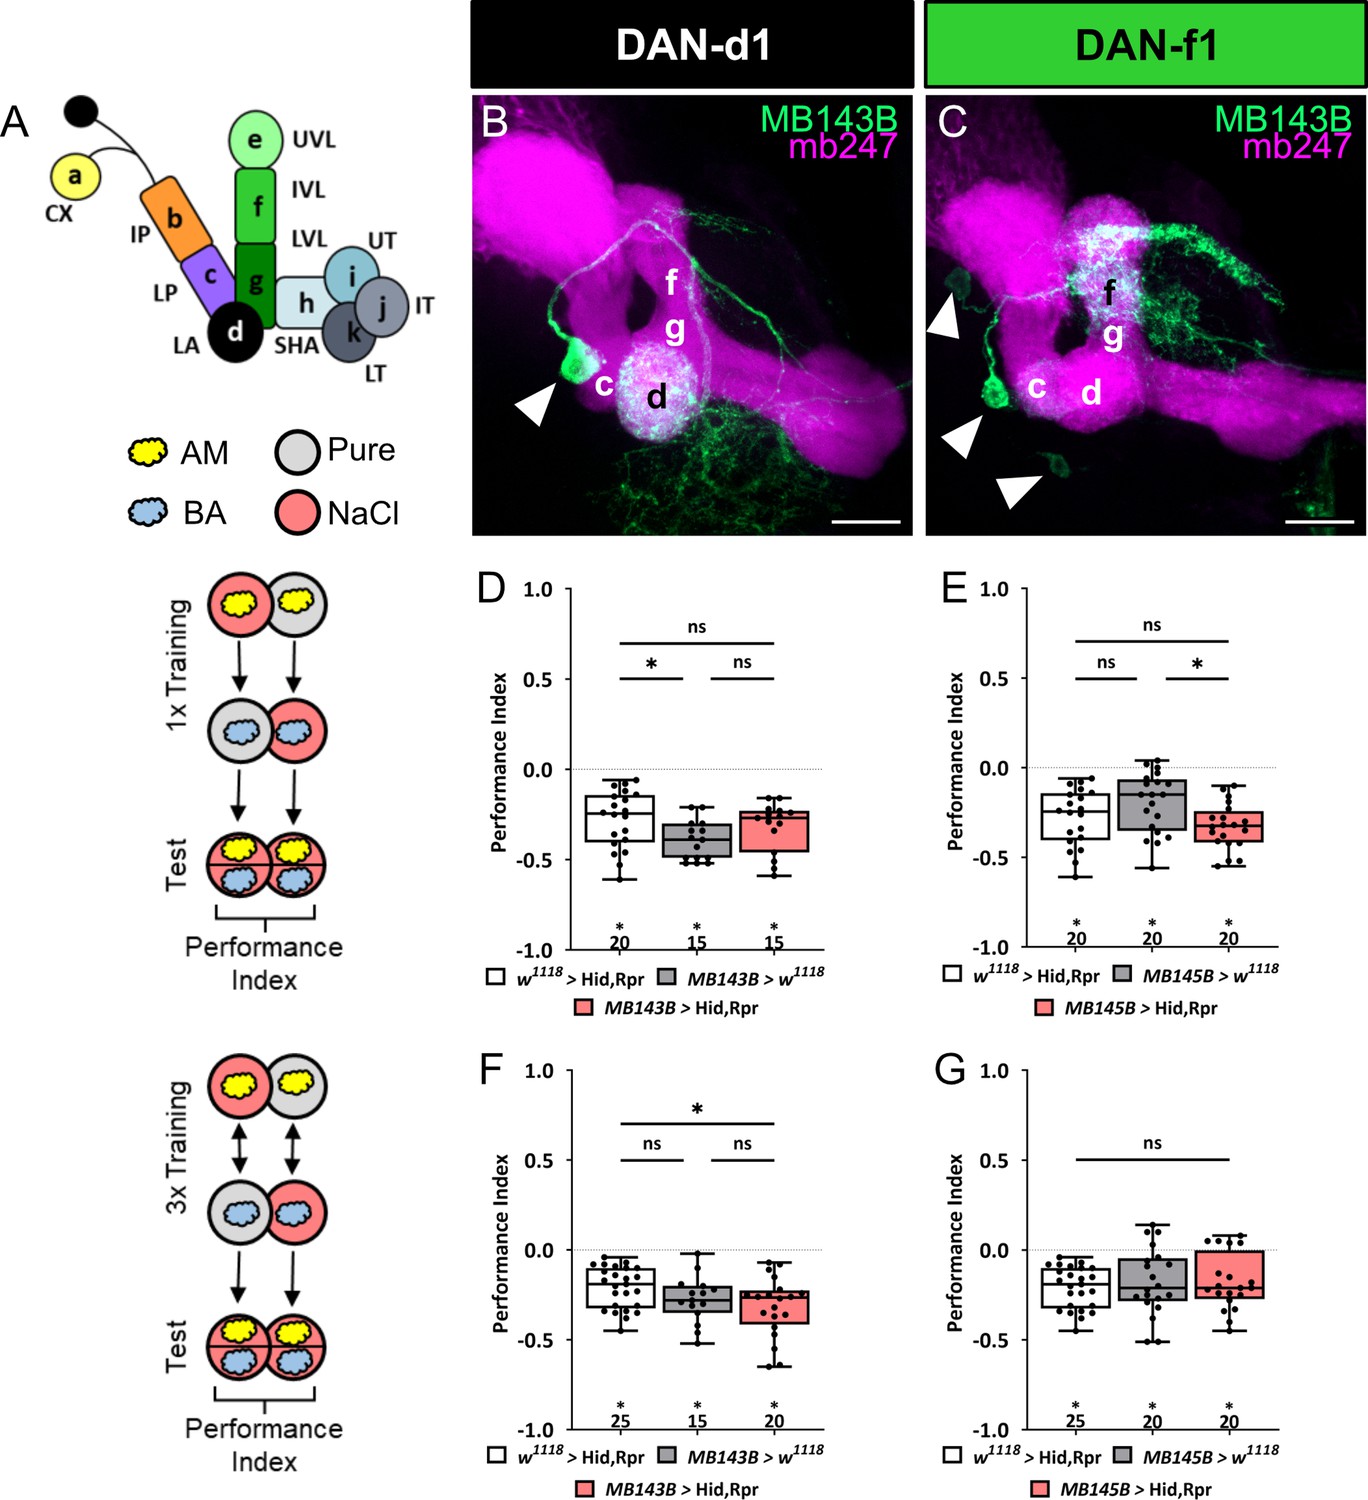
(A) The larval mushroom body (MB) is organized into 11 compartments. Letters from a-k are used to indicate compartment innervation by the MB input and output neurons. (B, C) Individual split-Gal4 driver lines were crossed with the reporter strain UAS-mCD8::GFP;mb247-lexA,lexAop-mRFP. Third instar larval brains were dissected, fixed, and mounted to visualize the fluorescent reporter signal labeling the MB (mb247-lexA, lexAop-mRFP shown in magenta) and the respective DAN pattern (GFP shown in green). (B) MB143B labels specifically DAN-d1. (C) MB145B labels DAN-f1 and very weakly several additional cells. (D, E) Aversive associative performance indices are shown for tests immediately after classical odor-high salt conditioning using one training trial. A schematic overview of the conditioning protocol is shown at the left. Neither DAN-d1 nor DAN-f1 function is required. Even when tested using two alternative split-Gal4 lines MB143B and MB145B. (F–G) The same result can also be seen after three-cycle odor-high salt conditioning. A schematic overview of the conditioning protocol is shown at the left. In summary, in all four behavioral experiments, the aversive associative performance indices of the experimental groups (N=15–20) were not decreased compared to the two (in all cases p>0.05, N=15–25) or at least one genetic control group (in F, p<0.05 comparing UAS control and experimental larvae). All behavioral data is shown as box plots. Please note that the same data sets for the effector control were plotted in subfigures D and E (one cycle) and F and G (three cycles), as respective behavioral experiments have been conducted in parallel. Differences between groups are highlighted by horizontal lines between them. Performance indices different from random distribution are indicated below each box plot. The precise sample size of each group is given below each box plot. n.s. p>0.05; *p<0.05. The source data and results of all statistical tests are documented in Figure 2—figure supplement 1—source data 1.
-
Figure 2—figure supplement 1—source data 1
Tables of the raw data with all individual preference indices, the calculated performance indices and the statistical analysis of each experiment.
- https://cdn.elifesciences.org/articles/91387/elife-91387-fig2-figsupp1-data1-v1.xlsx
Figure 2—figure supplement 2
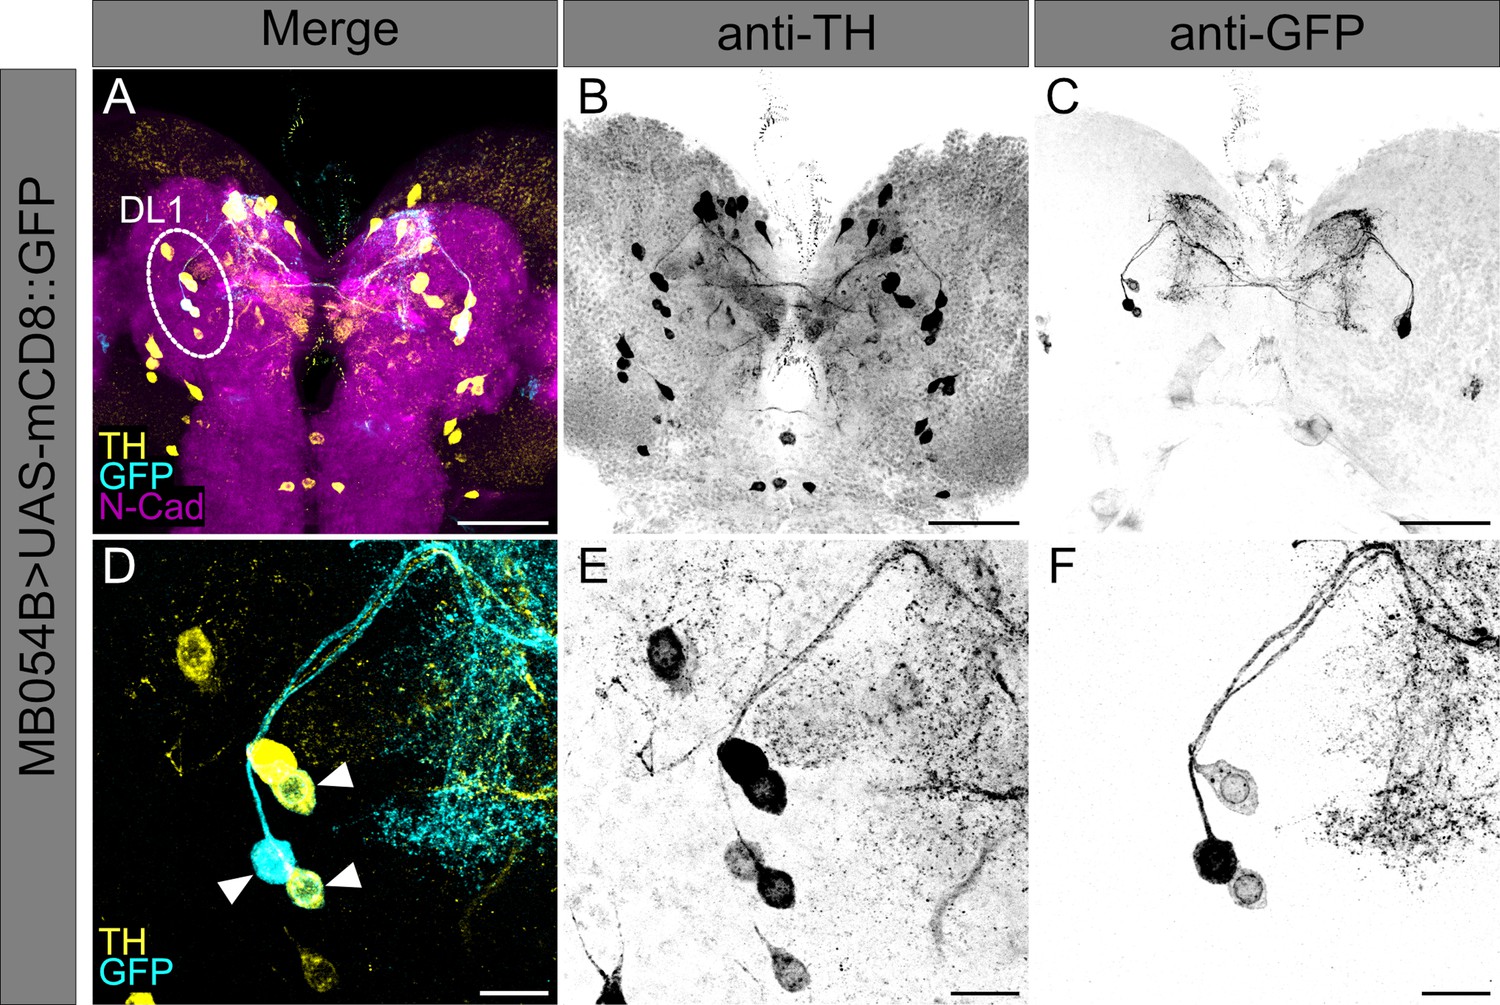
Split-Gal4 MB054B covers three dopaminergic neurons in the DL1 cluster.
(A–F) Split-Gal4 MB054B driver strain was crossed to UAS-mCD8::GFP effector strain. (A) A z projection of a larval central brain is shown using anti-GFP to label expression pattern of Split-Gal4 MB054B (cyan), anti-TH to label TH-positive cells (yellow), and anti-N-cadherin to visualize the neuropil (magenta). The DL1 cluster of the left hemisphere is highlighted. (B, C) Single channel visualization of all TH-positive cells (B) and GFP-expressing cells (C) of the crossed Split-Gal4 MB054B driver line to effector UAS-mCD8::GFP within the larval central brain. (D) A detailed z projection of the DL1 cluster is shown using anti-GFP to label expression pattern of Split-Gal4 MB054B (cyan) and anti-TH to label TH-positive cells (yellow). Co-labeling of anti-TH and anti-GFP is highlighted by arrowheads. (E,F) Single channel visualization of all TH-positive cells (E) and GFP-expressing cells (F) of the Split-Gal4 MB054B driver line crossed to effector UAS-mCD8::GFP within the DL1 cluster. Scale bars: (A–C) 50 µm, (D–F) 10 µm.
Figure 3
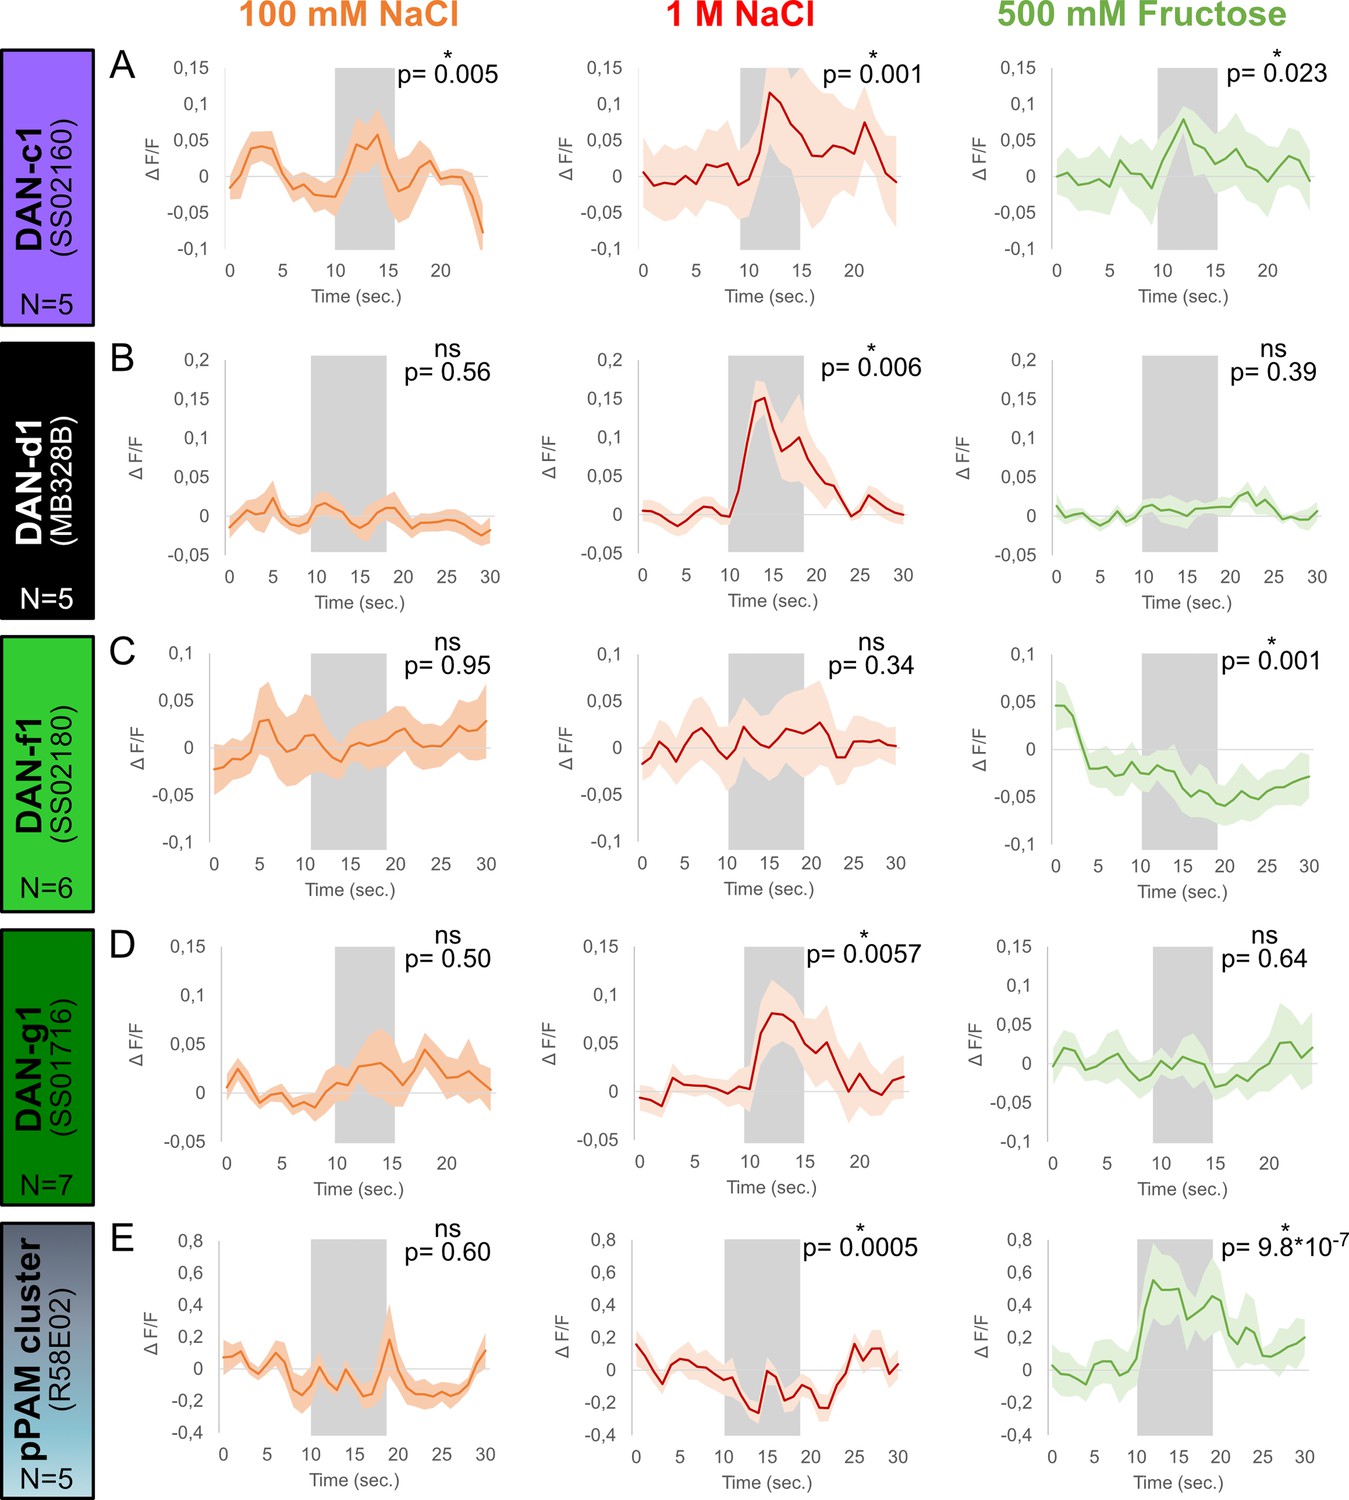
Calcium responses of dopaminergic neurons (DANs) to gustatory stimulation.
Four different split-Gal4 lines and the R58E02 driver line were crossed with UAS-GCaMP6m to express a calcium reporter in DANs. The responses of each DAN towards 100 mM NaCl, 1 M NaCl, and 500 mM fructose was tested in intact larvae using a microfluidic chip-based setup. (A) Calcium responses in DAN-c1 (N=5) were induced by gustatory stimulation with 100 mM NaCl (orange), 1 M NaCl (red), and 500 mM fructose (green, for all p<0.05). (B) DAN-d1 (N=5) calcium responses were only seen after 1 M NaCl stimulation (red, p<0.05), but not after 100 mM NaCl (orange, p>0.05) and 500 mM fructose stimulation (green, p>0.05). (C) Stimulation with 100 mM (orange, p>0.05) and 1 M NaCl (red, p>0.05) did not induce calcium responses in DAN-f1 (N=6). However, stimulation with 500 mM fructose reduced the obtained calcium signal (green, p<0.05). (D) 1 M NaCl (red, p<0.05), but not 100 mM NaCl (orange, p>0.05) and 500 mM fructose (green, p>0.05), induced a calcium response in DAN-g1 (N=7). (E) pPAM DANs calcium responses (N=5) were only seen after 500 mM fructose stimulation (green, p<0.05). Stimulation with low (orange) and high salt concentrations (red) did not increase calcium signals; however, both reduced pPAM activity (p<0.05). Each graph shows the mean calcium signal plotted as the relative response strength ∆F/F and the related standard error of the mean on the y-axis. The time in seconds is given below each graph on the x-axis. The gray box indicates the duration of the stimulus application. The sample size of each group (N=5–7) is given above each row. n.s. p>0.05; *p<0.05. The source data and results of all statistical tests are documented in Figure 3—source data 1.
-
Figure 3—source data 1
Tables of the raw data with all individual preference indices, the calculated performance indices and the statistical analysis of each experiment.
- https://cdn.elifesciences.org/articles/91387/elife-91387-fig3-data1-v1.xlsx
Figure 4 with 6 supplements

Ablation of dopaminergic neuron DAN-f1 and DAN-g1 together impairs aversive olfactory memory.
In all panels, associative performance indices are shown for tests immediately after classical conditioning. In the upper panels (A–C), larvae are trained once by pairing an olfactory stimulus with high salt punishment, whereas in the lower panels (D–F), three training cycles were applied. Schematic overviews for both conditioning protocols are shown on the left. The three different DL1 DAN specific split-Gal4 driver MB054B, MB065B, and SS01702 that each label two neurons were crossed to the effector UAS-hid,rpr to induce apoptosis (A–F). (A) With MB054B used as driver strain to ablate the DL1 DAN combination DAN-f1/DAN-g1, the aversive associative performance index of the experimental group was decreased compared to both controls (p<0.05, N=15 for each group). (B–F) In all other experiments ablation of different DL1 DAN combinations did not reveal a phenotype. (In all experiments, at least one or even both control groups are compared to the experimental group p>0.05, for each group N=15–25). Please note that this also includes MB054B crossed with UAS-hid, rpr tested after three training trials (D). (G) To verify the memory phenotype of MB054B crossed with UAS-hid,rpr tested after one trial conditioning, we repeated the experiment using the odor pair hexyl acetate (HA) and benzaldehyde (BA). Again, experimental larvae tested after one trial learning showed a robust decrease in odor-high salt memory when compared to both genetic control groups (p<0.05, for each group N=15). The memory phenotype was not seen after three training trials (J, p>0.05, for each group N=15). (H, K) With MB054B used as driver strain to ablate the DL1 DAN combination DAN-f1/DAN-g1, aversive odor-quinine memory was not impaired after one or three cycle conditioning (p>0.05 when comparing experimental and control groups, for each group N=15). (I, L) Similarly, appetitive odor-fructose learning after one and three cycle conditioning was not impaired when ablating DAN-f1/DAN-g1 (p>0.05 when comparing experimental and control groups, for each group N=15). All behavioral data is shown as box plots. Please note that the same data set for the effector control was plotted in subfigures E and F as respective behavioral experiments have been conducted in parallel. Differences between groups are highlighted by horizontal lines between them. Performance indices different from random distribution are indicated below each box plot. The precise sample size of each group is given below each box plot. n.s. p>0.05; *p<0.05. The source data and results of all statistical tests are documented in Figure 4—source data 1.
-
Figure 4—source data 1
Tables of the raw data with all individual preference indices, the calculated performance indices and the statistical analysis of each experiment.
- https://cdn.elifesciences.org/articles/91387/elife-91387-fig4-data1-v1.xlsx
Figure 4—figure supplement 1
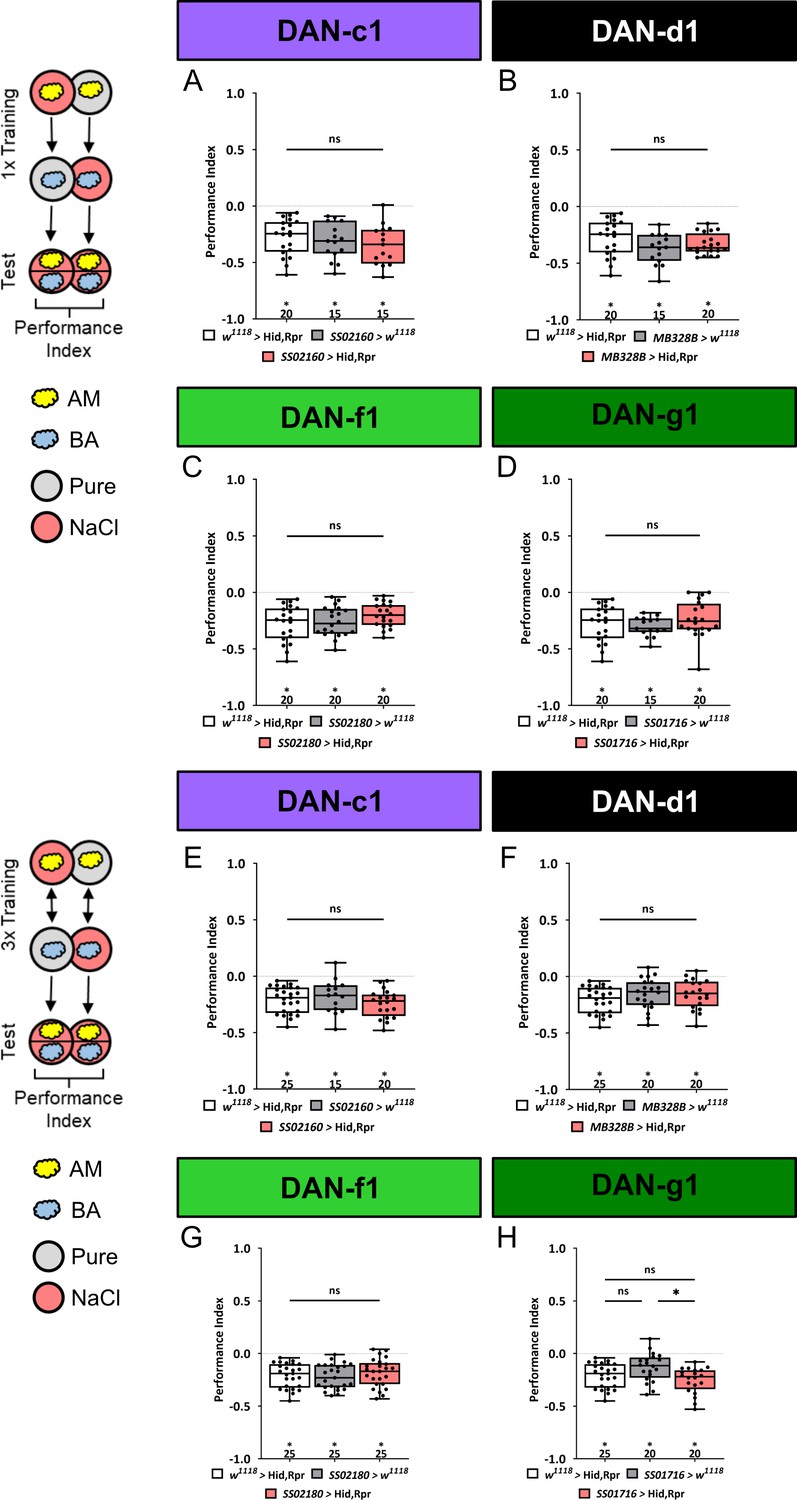
Ablation of individual dopaminergic neurons (DANs) does not impair aversive olfactory memory.
In all panels, aversive associative performance indices are shown for tests immediately after odor-high salt classical conditioning. In the upper panels (A–D) larvae are trained once, whereas in the lower panels (E–H) three training cycles were applied. Schematic overviews for both conditioning protocols are shown on the left. The four different DL1 DAN specific split-Gal4 driver strains SS02160, MB328B, SS02180, and SS01716 were crossed to the effector UAS-hid,rpr to induce apoptosis (A–H). Cell-specific ablation of distinct DL1 DANs did not impair odor-high salt memories after either one or three cycle training. In no case were associative performance indices upon DL1 DAN ablation lower than in both genetic controls (A–H, in all experiments at least one or even both control groups are compared to the experimental group p>0.05, for each group N=15–20 for one cycle training, and N=15–25 for three cycle training). All behavioral data is shown as box plots. As the respective behavioral experiments in subfigures A-D and E-H were conducted in parallel, the same data sets for the corresponding effector control were plotted. Differences between groups are highlighted by horizontal lines between them. Performance indices different from random distribution are indicated below each box plot. The exact sample size of each group is given below each box plot. n.s. p>0.05; *p<0.05. The source data and results of all statistical tests are documented in Figure 4—figure supplement 1—source data 1.
-
Figure 4—figure supplement 1—source data 1
Tables of the raw data with all individual preference indices, the calculated performance indices and the statistical analysis of each experiment.
- https://cdn.elifesciences.org/articles/91387/elife-91387-fig4-figsupp1-data1-v1.xlsx
Figure 4—figure supplement 2
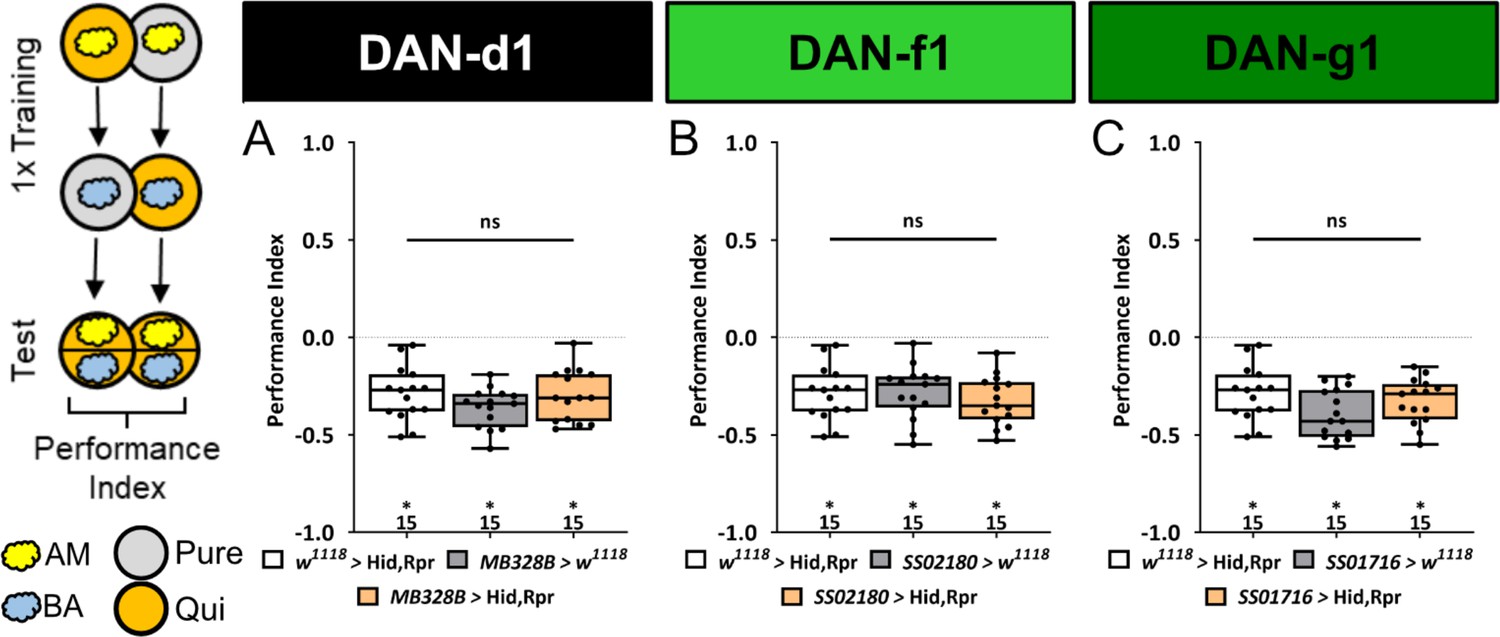
Ablation of individual DL dopaminergic neurons (DANs) does not impair aversive olfactory memory reinforced by bitter quinine.
In all panels, aversive associative performance indices are shown for tests immediately after classical odor-quinine conditioning using one training trial. A schematic overview of the conditioning protocol is shown to the left of (A). (A–C) The three different DL1 DAN split-Gal4 driver MB328B, SS02180, and SS01716 that specifically label DAN-d1, DAN-f1, and DAN-g1, respectively, are crossed with the effector UAS-hid,rpr to induce apoptosis. In all three experiments, the aversive associative performance indices of the experimental groups (N=15) were not decreased compared to the two control groups (in all cases p>0.05, for each group N=15). All behavioral data is shown as box plots. Please note that the same respective data set for the effector control was plotted in all subfigures, as these behavioral experiments were conducted in parallel. Differences between groups are highlighted by horizontal lines between them. Performance indices different from random distribution are indicated below each box plot. The exact sample size of each group is given below each box plot. n.s. p>0.05; *p<0.05. The source data and results of all statistical tests are documented in Figure 4—figure supplement 2—source data 1.
-
Figure 4—figure supplement 2—source data 1
Tables of the raw data with all individual preference indices, the calculated performance indices and the statistical analysis of each experiment.
- https://cdn.elifesciences.org/articles/91387/elife-91387-fig4-figsupp2-data1-v1.xlsx
Figure 4—figure supplement 3
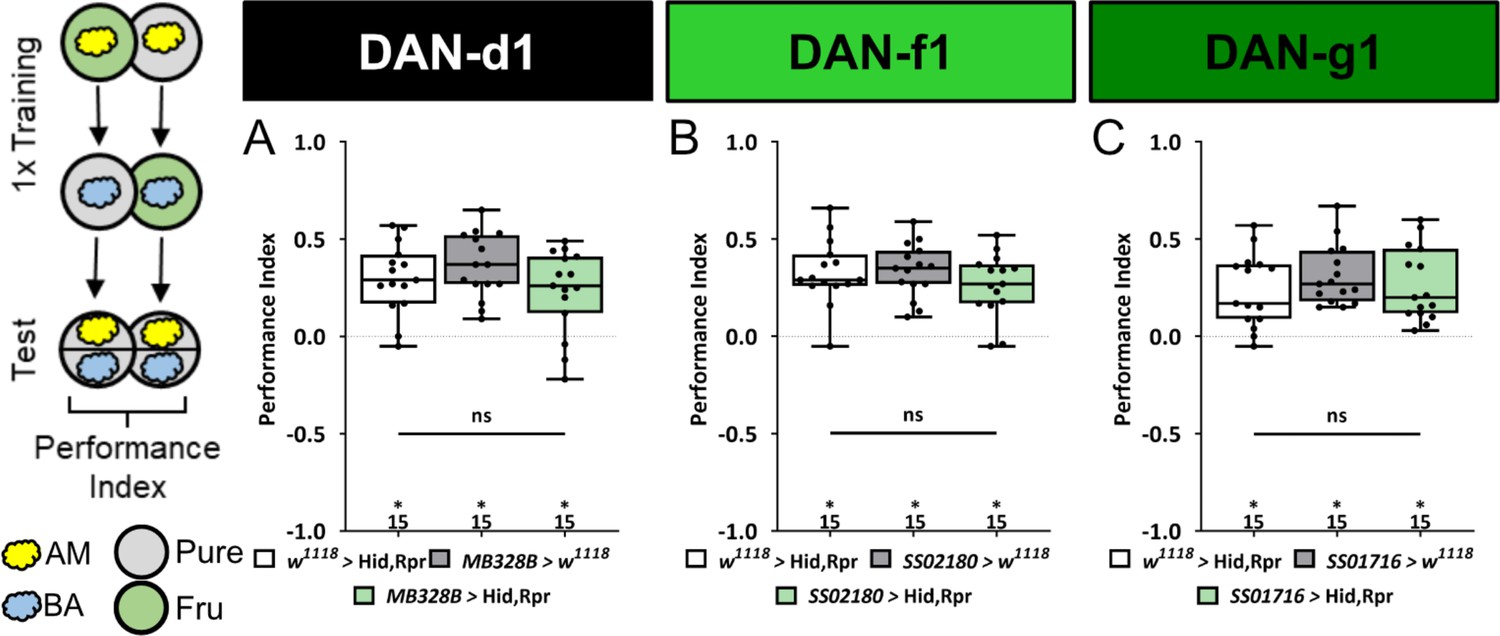
Ablation of individual DL dopaminergic neurons (DANs) does not impair appetitive olfactory memory.
In all panels appetitive associative performance indices are shown for tests immediately after classical odor-fructose conditioning using one training trial. A schematic overview of the conditioning protocol is shown to the left of (A). (A–C) The three different DL1 DAN split-Gal4 driver MB328B, SS02180, and SS01716 that specifically label DAN-d1, DAN-f1, and DAN-g1, respectively, are crossed with the effector UAS-hid,rpr to induce apoptosis. In all three experiments, the appetitive associative performance indices of the experimental groups (N=15) were not decreased compared to the two related control groups (in all cases p>0.05, for each group N=15). All behavioral data is shown as box plots. Differences between groups are highlighted by horizontal lines between them. Performance indices different from random distribution are indicated below each box plot. The precise sample size of each group is given below each box plot. n.s. p>0.05; *p<0.05. The source data and results of all statistical tests are documented in Figure 4—figure supplement 3—source data 1.
-
Figure 4—figure supplement 3—source data 1
Tables of the raw data with all individual preference indices, the calculated performance indices and the statistical analysis of each experiment.
- https://cdn.elifesciences.org/articles/91387/elife-91387-fig4-figsupp3-data1-v1.xlsx
Figure 4—figure supplement 4
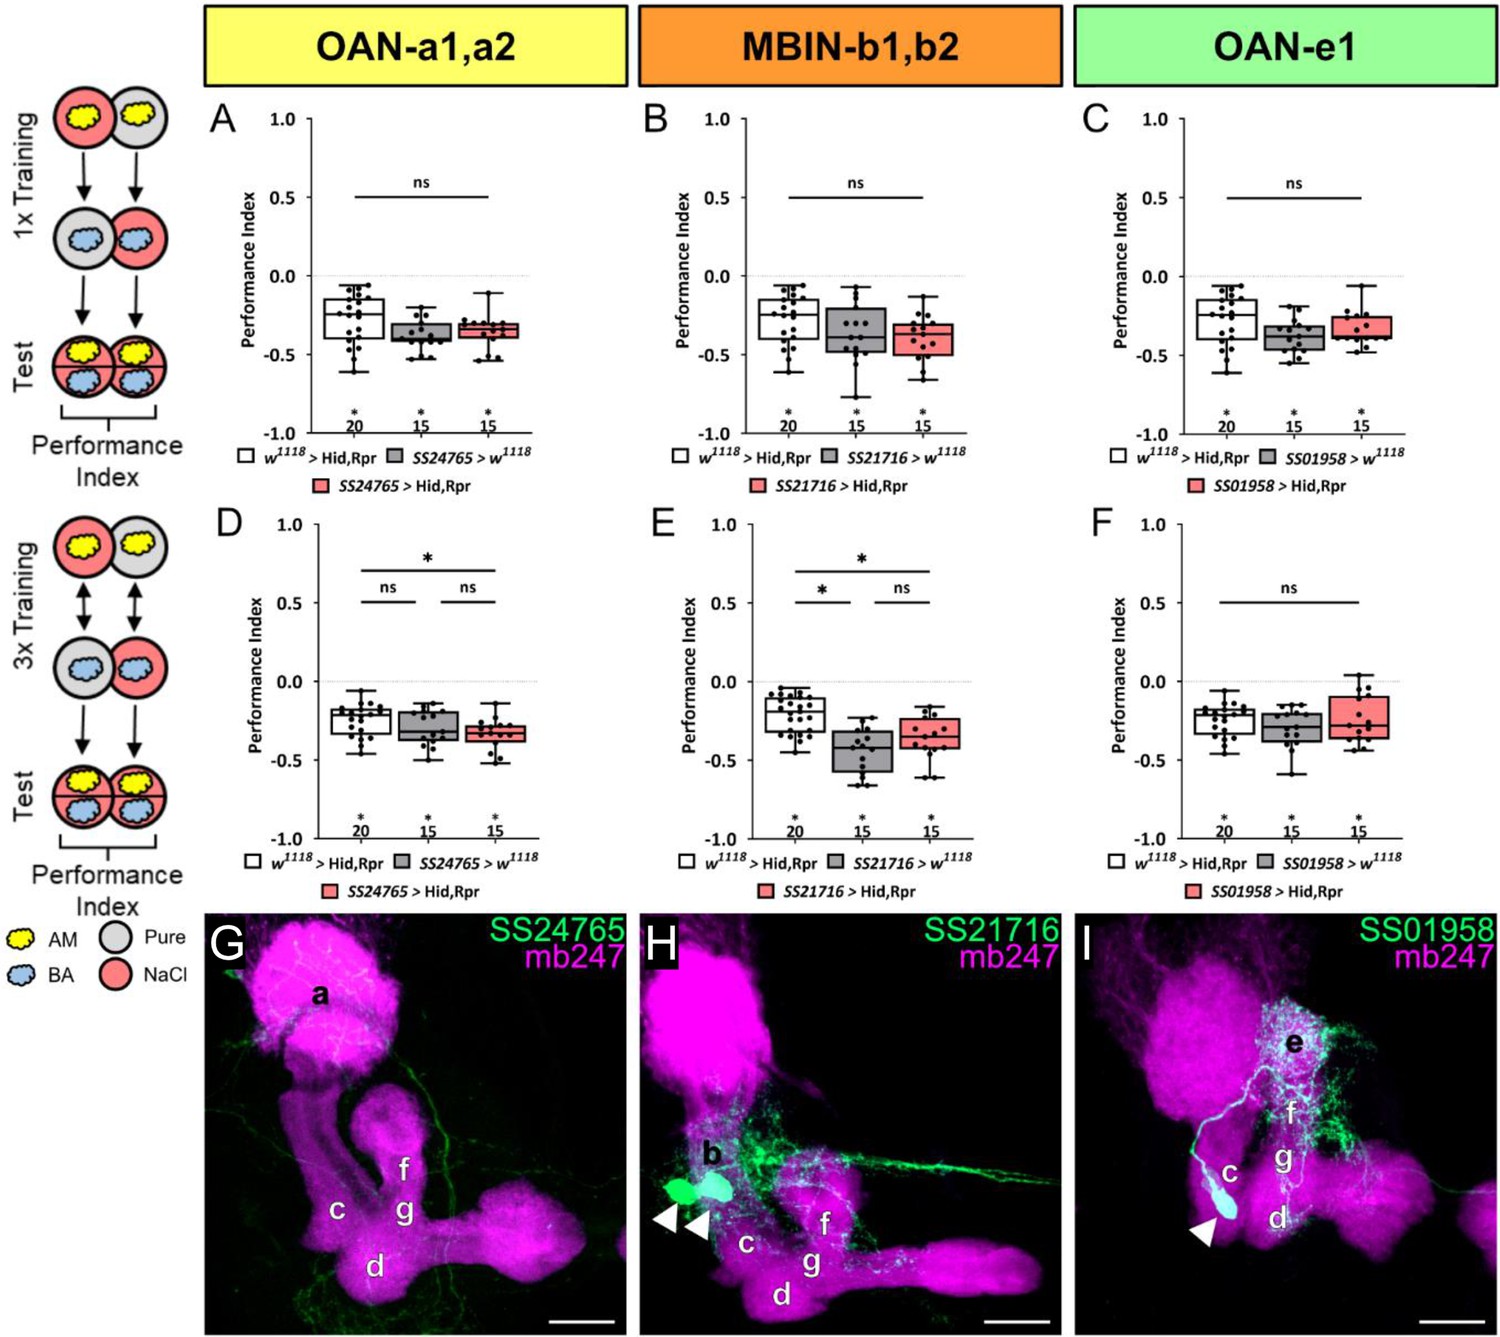
Functional analysis of mushroom body input neurons that are not dopaminergic.
In panels (A–C), larvae are trained once by pairing an olfactory stimulus with high salt punishment, whereas in panel (D–F), three training cycles were applied. Schematic overviews for both conditioning protocols are shown to the left of (A) and (D). The three different mushroom body input split-Gal4 drivers SS24765, SS21716, and SS01958 that specifically label OAN-a1,a2, MBIN-b1,b2, and OAN-e1 are crossed with the effector UAS-hid,rpr to induce apoptosis. Ablation of any of the three types of input neurons did not impair odor-high salt memory regardless of whether larvae were trained once or three times (A–C and D–F). In all cases, the experimental groups (N=15) performed on the same level as both (A–C and F, in all cases p>0.05, N=15–20) or at least one genetic control (D, E, Gal4 control p>0.05 and UAS-hid,rpr control p<0.05, N=15–25). All behavioral data is shown as box plots. As the respective behavioral experiments in subfigures A-C for one cycle and D and F for three cycles were conducted in parallel, the same data sets for the corresponding effector control were plotted. Differences between groups are highlighted by horizontal lines between them. Performance indices different from random distribution are indicated below each box plot. The precise sample size of each group is given below each box plot. n.s. p>0.05; *p<0.05. (G–I) Individual split-Gal4 driver lines were crossed with the reporter strain UAS-mCD8::GFP;mb247-lexA,lexAop-mRFP. Third instar larval brains were dissected, fixed, and mounted to visualize the fluorescent reporter signal labeling the MB (mb247-lexA, lexAop-mRFP shown in magenta) and the respective neuronal pattern (GFP shown in green). SS24765 (OAN-a1,a2), SS21716 (MBIN-b1,b2), and SS01958 (OAN-e1) each specifically label a specific input neuron pair (G, H) or a single input neuron (I). Scale bars: 20 µm. The source data and results of all statistical tests are documented in Figure 4—figure supplement 4—source data 1.
-
Figure 4—figure supplement 4—source data 1
Tables of the raw data with all individual preference indices, the calculated performance indices and the statistical analysis of each experiment.
- https://cdn.elifesciences.org/articles/91387/elife-91387-fig4-figsupp4-data1-v1.xlsx
Figure 4—figure supplement 5
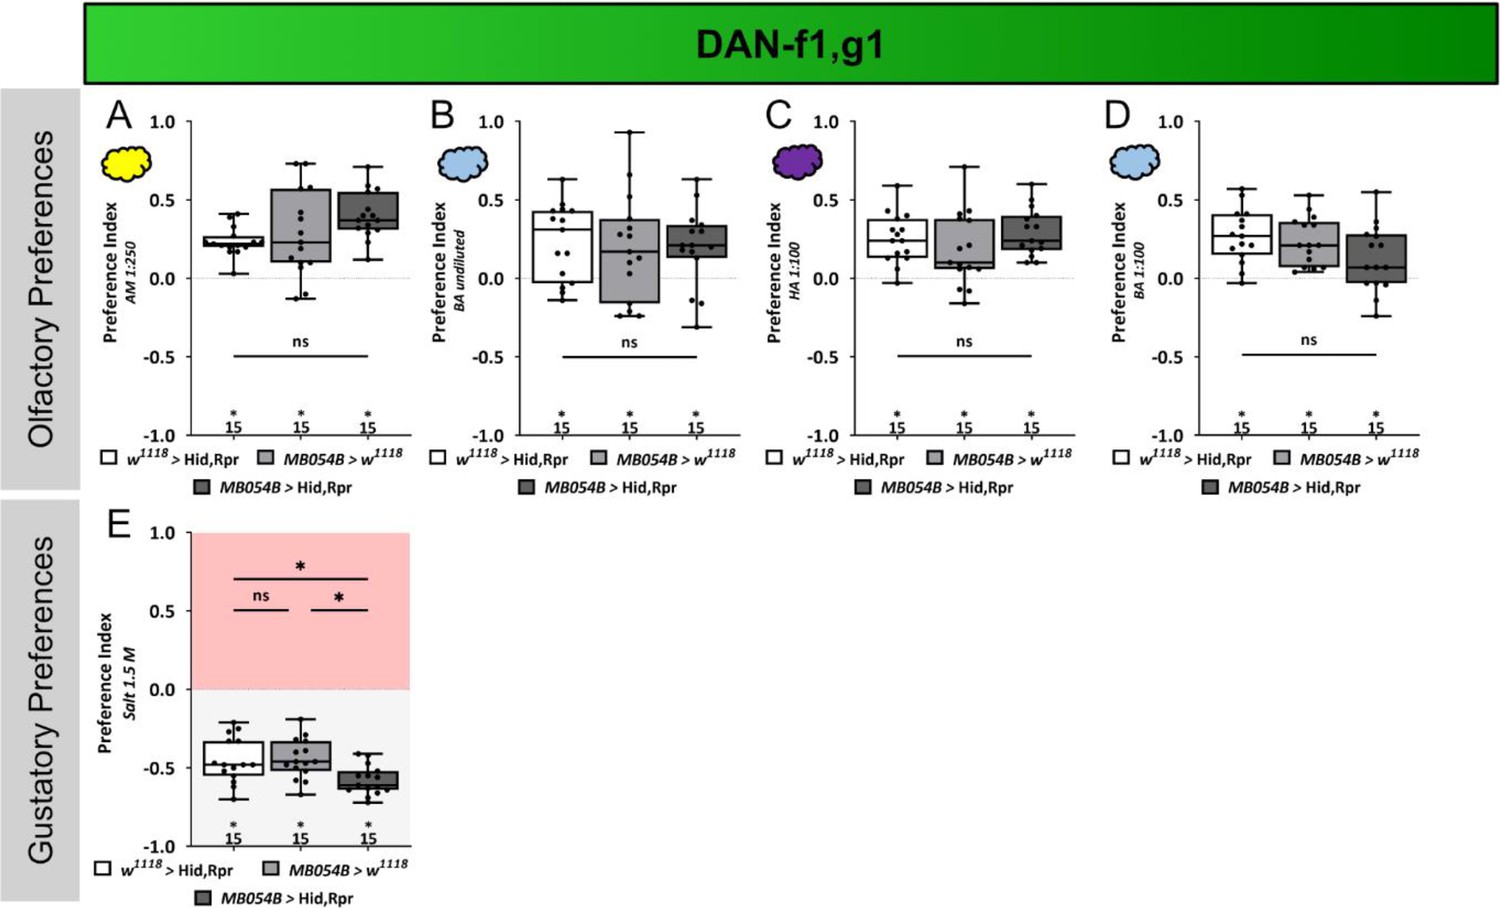
Sensory acuity tests.
In panels (A–E), naïve larval preferences towards different chemosensory stimuli are shown. Olfactory preference of MB054B split Gal4 crossed to UAS-hid,rpr to ablate DAN-f1/DAN-g1 are shown in (A–D). For all the tested odor stimuli, amyl acetate diluted 1:250 in paraffin oil, pure benzaldehyde, hexyl acetate diluted 1:100 in paraffin oil, and benzaldehyde diluted 1:100 in paraffin oil, no difference between the experimental group (N=15) and the two genetic control groups was seen (for all cases p>0.05, for each group N=15). (E) Gustatory high salt preference of MB054B split-Gal4 crossed to UAS-hid,rpr to ablate DAN-f1/DAN-g1 (N=15) was not reduced but rather increased in their avoidance of 1.5 M high salt concentration compared to both genetic controls (both p<0.05, for each group N=15). All behavioral data is shown as box plots. Differences between groups are highlighted by horizontal lines between them. Performance indices different from random distribution are indicated below each box plot. The precise sample size of each group is given below each box plot. n.s. p>0.05; *p<0.05. The source data and results of all statistical tests are documented in Figure 4—figure supplement 5—source data 1.
-
Figure 4—figure supplement 5—source data 1
Tables of the raw data with all individual preference indices, the calculated performance indices and the statistical analysis of each experiment.
- https://cdn.elifesciences.org/articles/91387/elife-91387-fig4-figsupp5-data1-v1.xlsx
Figure 4—figure supplement 6
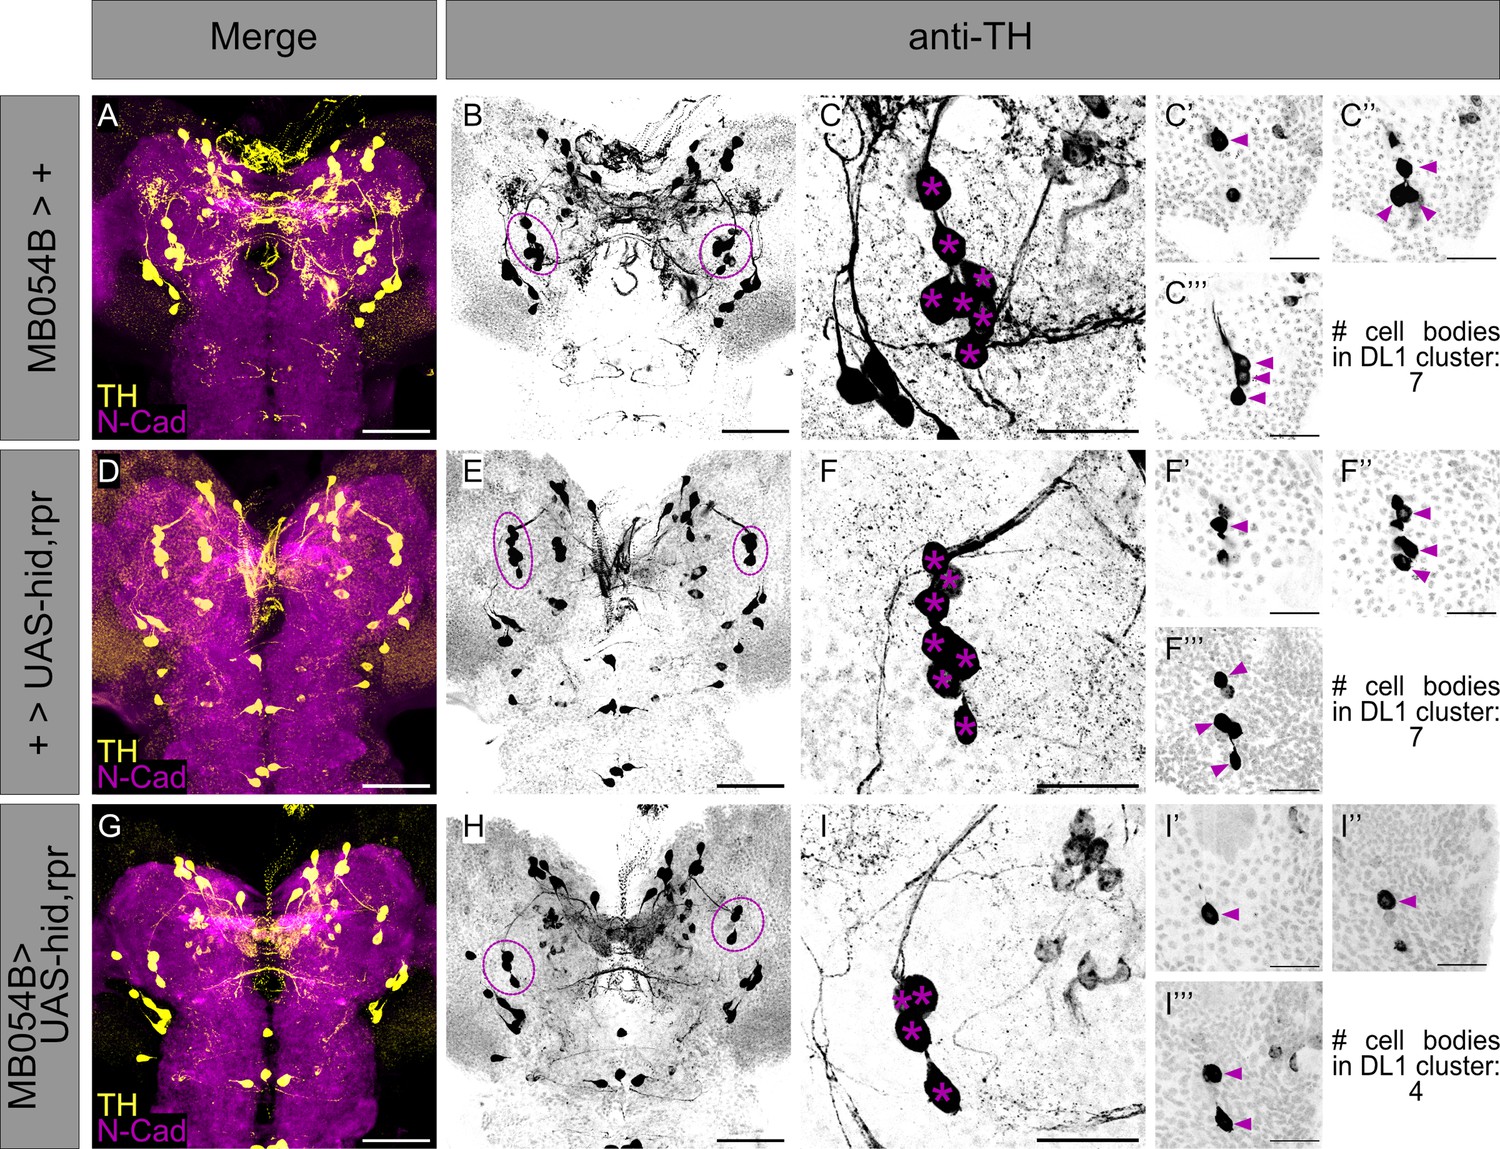
Anatomical validation of effector UAS-hid,rpr functionality to ablate neurons of MB054B Split-Gal4 in the DL1 cluster.
To confirm the functionality of the effector UAS-hid,rpr, anatomical examination of the single effector line UAS-hid,rpr (A-C’’’), the Split-Gal4 driver line MB054B (D-F’’’), as well as the cross of both (G-I’’’) were examined. (A, D, G) A z-projection of a larval central brain of the respective strain or cross is shown using anti-TH to label TH-positive cells (yellow) and anti-N-cadherin to visualize the neuropil (magenta). (B, E, H) Single channel visualization of all TH-positive cells (black) of the respective larval brains shown in (A, D, G). The DL1 cluster is highlighted by violet dashed lines. (C) Detailed z projection of the left hemispheric DL1 cluster of effector line UAS-hid,rpr is shown as single channel (anti-TH, black). Cell bodies of the DL1 cluster neurons are highlighted by violet asterisk. (C’-C’’’) Partial projection of the z-stack shown in (C) to distinguish single cell bodies. Anatomical analysis revealed seven TH-positive cell bodies in the DL1 cluster of UAS-hid,rpr, highlighted by violet arrowheads. (F) Detailed z projection of the left hemispheric DL1 cluster of Split-Gal4 line MB054B is shown as single channel (anti-TH, black). Cell bodies of the DL1 cluster neurons are highlighted by violet asterisk. (F’-F’’’) Partial projection of the z-stack shown in (F) to distinguish single cell bodies. Anatomical analysis revealed seven TH-positive cell bodies in the DL1 cluster of MB054B, highlighted by violet arrowheads. (I) Detailed z-projection of the left hemispheric DL1 cluster of the crossed Split-Gal4 driver strain MB054B to UAS-hid,rpr is shown as single channel (anti-TH, black). Cell bodies of the DL1 cluster neurons are highlighted by violet asterisk. (I’-I’’’) Partial projection of the z-stack shown in (I) to distinguish single cell bodies. Crossing Split-Gal4 MB054B to effector line UAS-hid, rpr led to ablation of the respective MB054B cell bodies (see also Figure 2H–K), leaving only four TH-positive cell bodies (highlighted by violet arrowheads) in the DL1 cluster. Scale bars: 50 µm (A,B, D,E, G,H) and 20 µm (C-C’) (’’, F-F’’’, I-I’’’).
Figure 5
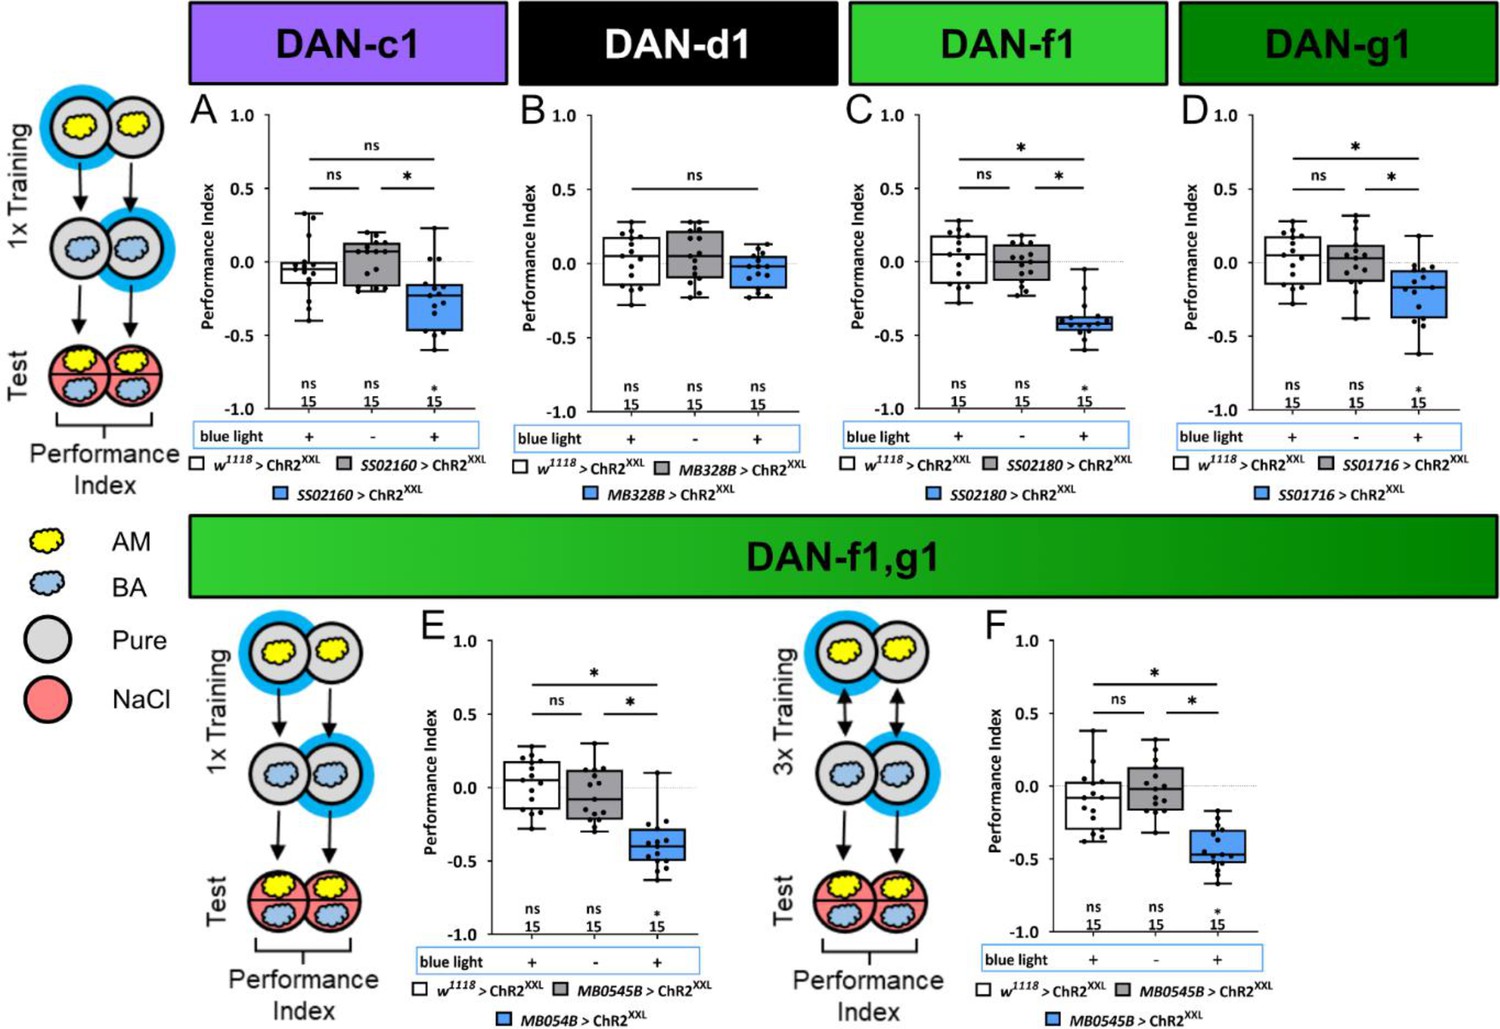
Optogenetic DL1 dopaminergic neuron (DAN) activity can substitute for salt punishment.
In all panels, associative performance indices are shown for tests immediately after classical conditioning. In panels (A–E), larvae are trained once by pairing an olfactory stimulus with artificial blue light activation, whereas in panel (F), three training cycles were applied. Schematic overviews for both conditioning protocols are shown to the left of (A) and (F). (A–D) To test whether optogenetic activation of the individual DL DANs DAN-c1, DAN-d1, DAN-f1, and DAN-g1 is sufficient to substitute for a punishment, we used the split-Gal4 lines SS02160, MB328B, SS02180, and SS01716 in combination with UAS-ChR2XXL. (E, F) For simultaneous optogenetic activation of DAN-f1/DAN-g1, we used MB054B. Larvae of the experimental genotypes for DAN-c1, DAN-f1, DAN-g1, and the DAN-f1/DAN-g1 combination (for all p<0.05, for each group N=15), but not for DAN-d1 (N=15) and all genetic controls (for all p>0.05, for each group N=15), showed an aversive associative memory. The results imply that in the tested conditions, the punishment signal can be mediated by the artificial activation of all individual DL1 DANs, with the exception of DAN-d1. All behavioral data are shown as box plots. Please note that the same data set for the effector control was plotted in subfigures (B-E) as respective behavioral experiments have been conducted in parallel. Differences between groups are highlighted by horizontal lines between them. Performance indices different from random distribution are indicated below each box plot. The sample size of each group (N=15) is given below each box plot. n.s. p>0.05; *p<0.05. The source data and results of all statistical tests are documented in Figure 5—source data 1.
-
Figure 5—source data 1
Tables of the raw data with all individual preference indices, the calculated performance indices and the statistical analysis of each experiment.
- https://cdn.elifesciences.org/articles/91387/elife-91387-fig5-data1-v1.xlsx
Figure 6
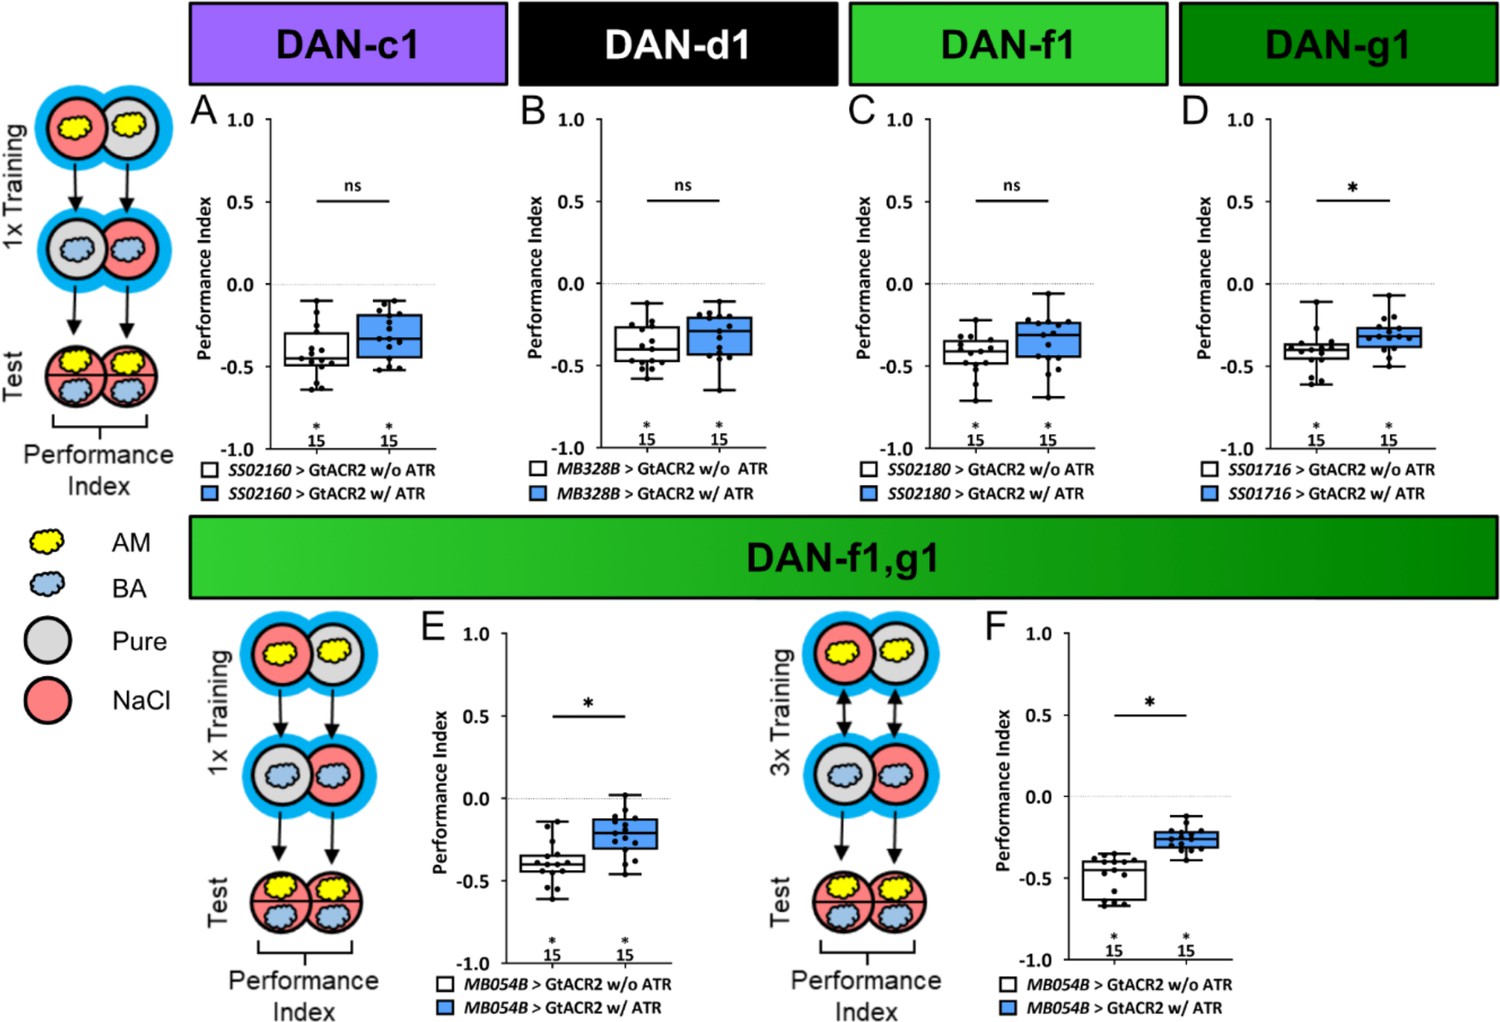
Optogenetic inhibition of DL1 DAN activity impairs aversive olfactory memory.
In all panels, associative performance indices are shown for tests immediately after classical odor high salt conditioning. In panels (A–E) larvae are trained once by pairing an olfactory stimulus with an aversive high salt stimulation, whereas in panel (F) three training cycles were applied. Schematic overviews for both conditioning protocols are shown to the left of (A) and (F). (A–D) To test whether optogenetic inhibition of the individual DL DANs DAN-c1, DAN-d1, DAN-f1, and DAN-g1 during training impairs punishment signaling, we used the split-Gal4 lines SS02160, MB328B, SS02180, and SS01716 in combination with UAS-GtACR2 and blue light stimulation during the entire training phase. (E, F) For simultaneous optogenetic inhibition of DAN-f1/DAN-g1 we used MB054B. (A–C) Larvae with inhibited DAN-c1, DAN-d1, or DAN-f1 function during training showed no impairment of odor-high salt memory comparable to controls that were kept on standard food without supplemented all-trans-retinal (ATR, 0.5 mM) and received the same protocol (for all p>0.05, N=15 for each group). (D–F) In contrast, inhibition of DAN-g1 alone, or the combination of DAN-f1/DAN-g1 after single trial and three trial conditioning impaired odor-high salt memory compared to controls (for all p<0.05, for each group N=15). This shows that DAN-g1 function is of central importance for signaling a salt punishment teaching signal. All behavioral data is shown as box plots. Differences between groups are highlighted by horizontal lines between them. Performance indices different from random distribution are indicated below each box plot. The precise sample size of each group is given below each box plot. n.s. p>0.05; *p<0.05. The source data and results of all statistical tests are documented in Figure 6—source data 1.
-
Figure 6—source data 1
Tables of the raw data with all individual preference indices, the calculated performance indices and the statistical analysis of each experiment.
- https://cdn.elifesciences.org/articles/91387/elife-91387-fig6-data1-v1.xlsx
Figure 7 with 1 supplement
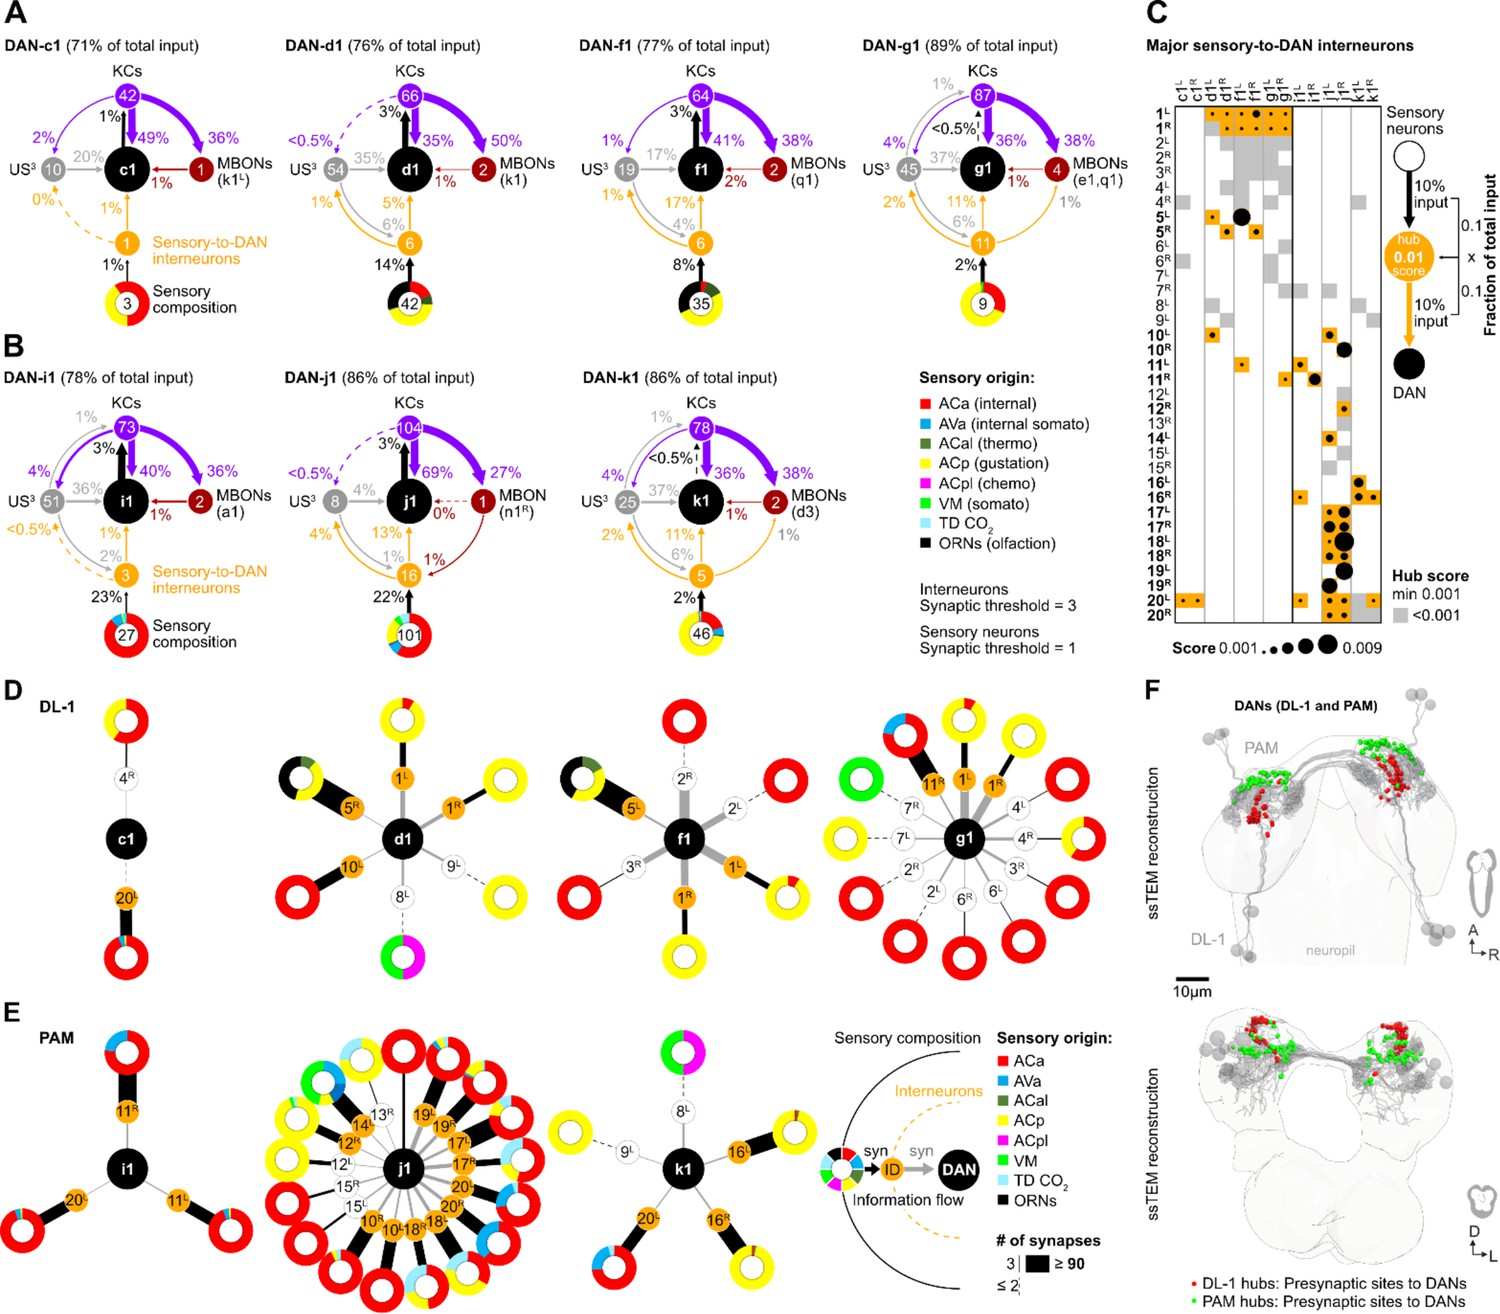
Interneurons and hub analysis of sensory to dopaminergic neuron (DAN) pathways.
(A, B) Schematic graph representation of individual DL1 (A) and pPAM (B) DANs. The outer ring at the bottom of each scheme represents the sensory composition of neurons targeting sensory-to-DANs interneurons (orange circle). The type of sensory information is encoded by the respective color (ACa: anterior central sensory compartment, AVa: ventral anterior sensory compartment, ACal: lateral anterior central sensory compartment, ACp: posterior anterior central sensory compartment, ACpl: posterior-lateral anterior central sensory compartment, VM: ventromedical sensory compartment, TD CO2: tracheal dendritic neurons responding to CO2, ORNs: olfactory receptor neurons). DAN input neurons are shown to get no direct sensory input (gray circles). Individual DANs are shown in the middle of the scheme as black circles. They are connected to mushroom body (MB) KC (purple circles), which in turn connect to mushroom body output neuron (MBONs; dark red circles). Arrows indicate the direction of the synaptic connection and its strength (coded by arrow thickness). Numbers in circles indicate number of neurons. The percentages indicate the proportion relative to the total input that the cell receives from the specific neuronal partners. For example, DAN-f1 receives 17% of its input from six different sensory-to-DAN interneurons (yellow circle), 17% from 19 other, non-sensory interneurons, 41% from 64 MB KCs, and 2% from two MBONs. (C) Dot plot showing the importance of interneurons acting as sensory to DAN hub. Dot size was calculated using the fraction of total input an interneuron receives from sensory neurons multiplied by the fraction of total input this interneuron gives to a DAN. Colored backgrounds of dots are highlighted in orange for the connections with a hub size of 0.001 or above. (D, E) Schematic of graph representation. The outer ring represents the sensory composition of neurons targeting upstream neurons of DANs. The type of sensory information is encoded by the respective color. Synaptic threshold for upstream interneurons of DANs = 3 and of upstream sensory neurons = 1. Line thickness to interneurons and targets represents the percentage of synaptic input. White or orange circles connected to the outer ring represent the interneuron layer. The inner ring represents individual target neurons, DL1 and pPAM DANs. The identity of each DAN and interneuron is given by the label in its related circle. (F) EM reconstruction of DL1, and pPAM DANs (gray) highlighting their presynaptic sites in red (for DL1 DANs) and green (for pPAM DANs). At the top, a horizontal view of the brain is shown. At the bottom, a frontal view of the brain is shown.
Figure 7—figure supplement 1
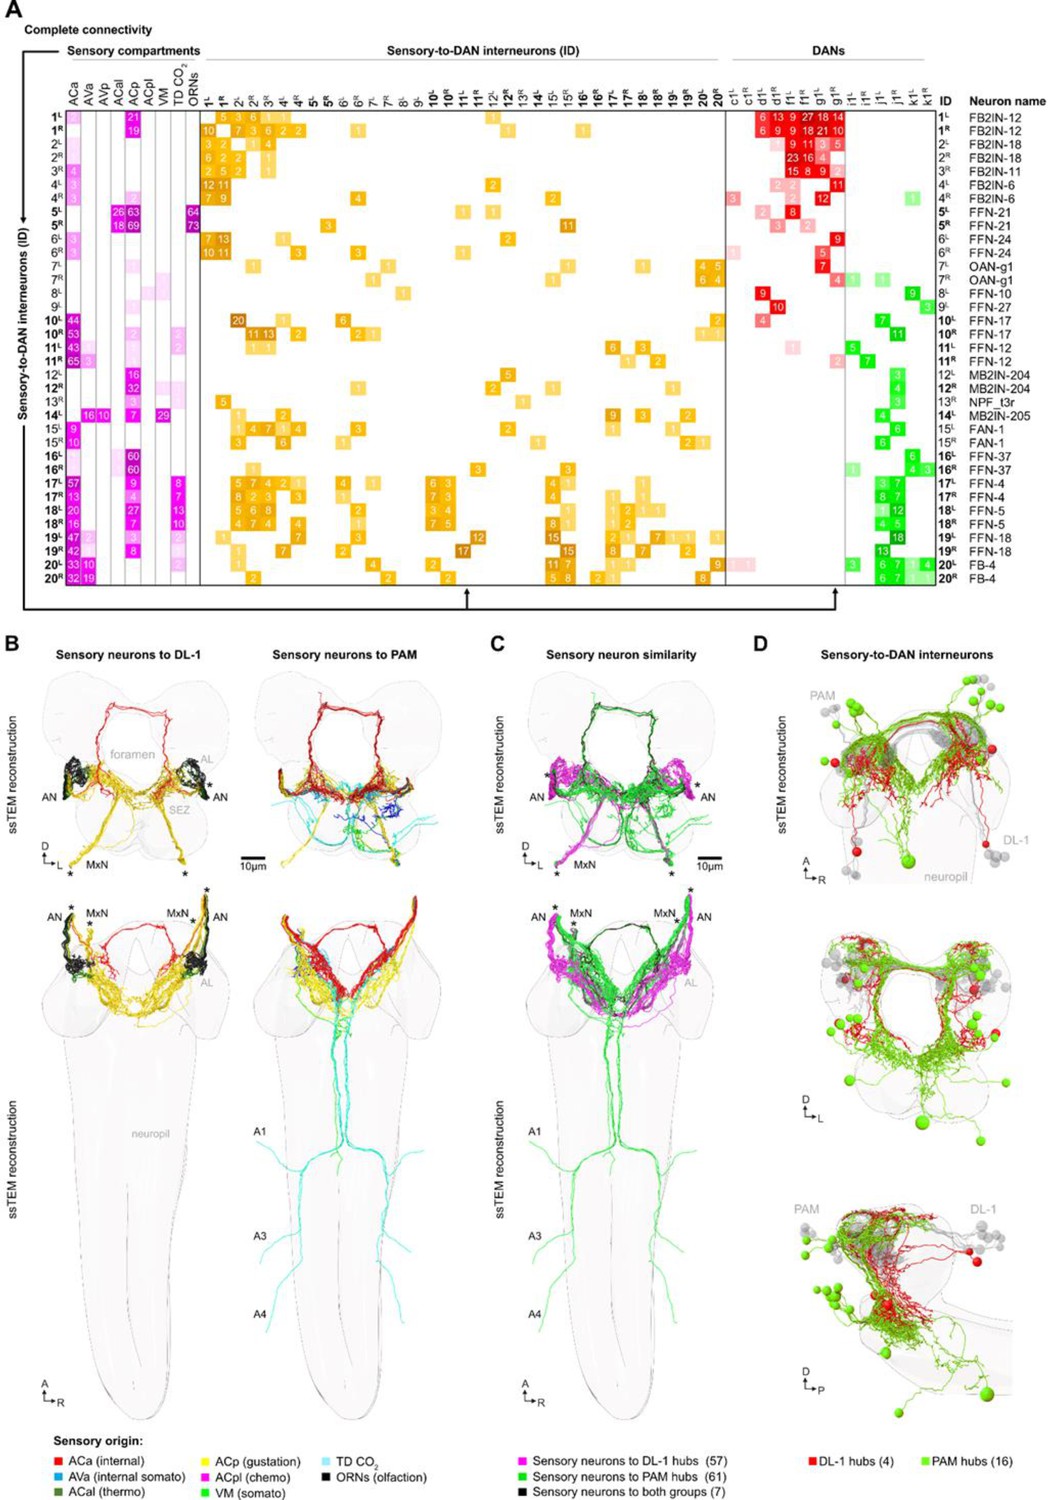
A sensory neuron to DAN map based on EM connectivity.
(A) Adjacency matrix of all neurons used in this study (no synaptic threshold) showing sensory compartments (magenta) to interneuron (yellow) to DL1 (red) and pPAM DANs (green). All synapses between shown neuron types were included. Top: Nine different sensory origins synapse onto upstream neurons (interneurons) of the DANs. Interneuron ID and neuron name is listed on the left and right of the matrix. From top to bottom, the connectivity of 35 interneurons are shown to establish the complete single hop circuit between sensory neurons and DANs. Please note that most of the interneurons form pairs (15 paired and five unpaired interneurons). (B) Schematic of all sensory neurons that innervate the DL1 cluster (left) and the pPAM cluster (right). The top shows a frontal view, at the bottom, a view from above along the longitudinal axis is given. The sensory neurons upstream of DANs are color-coded based on sensory origin, which is explained at the bottom of the figure. (C) Comparison of the similarity of DL1 and pPAM sensory input. Most of the sensory input is either specific for the DL1 cluster (57 neurons, magenta) or the pPAM cluster (61 neurons, green). Only a small number of sensory neurons (7 neurons, black) instructs both clusters. (D) Frontal and sagittal views are shown from top to bottom that highlight the distinct sets of interneurons connecting DL1 DANs (4 neurons, red) or pPAM DANs (16 neurons, green) with the sensory neurons.
Tables
Table 1
A summary of the characteristics of the individual DL1 dopaminergic neurons (DANs).
| DAN-c1 | DAN-d1 | DAN-f1 | DAN-g1 | ||
|---|---|---|---|---|---|
| Behavior | DAN ablation | No | No | No | No |
| DAN substitution | No | No | Yes | Yes | |
| DAN inhibition | No | No | No | Yes | |
| Physiology | NaCl ↑ Fructose ↑ | NaCl ↑ | Fructose ↓ | NaCl ↑ | |
| Connectomics | → Increasing # of sensory-to-DAN interneurons → | ||||
Key resources table
| Reagent type (species) or resource | Designation | Source or reference | Identifiers | Additional information |
|---|---|---|---|---|
| Genetic reagent (D. melanogaster) | w1118 | N/A | RRID:BDSC:3605 | control genotype |
| Genetic reagent (D. melanogaster) | UAS-mCD8::GFP | Pfeiffer et al., 2010 | RRID:BDSC:32194 | effector line |
| Genetic reagent (D. melanogaster) | UAS-mCD8::GFP; nSyb-LexA, IOP-mRFP/TM6B | combined from Burke et al., 2012 and Riabinina et al., 2015 | N/A | effector line |
| Genetic reagent (D. melanogaster) | UAS-mCD8::GFP; mb247-LexA, IOP-mRFP/TM3,Sb | Burke et al., 2012 | N/A | effector line |
| Genetic reagent (D. melanogaster) | UAS-hid,rpr | Abbott and Lengyel, 1991; White et al., 1996 | N/A | effector line |
| Genetic reagent (D. melanogaster) | UAS-GtACR2 | Mohammad et al., 2017 | RRID:BDSC:92984 | effector line |
| Genetic reagent (D. melanogaster) | UAS-ChR2XXL | Dawydow et al., 2014 | RRID:BDSC:58374 | effector line |
| Genetic reagent (D. melanogaster) | UAS-GCaMP6m | Chen et al., 2013 | RRID:BDSC:42748 | effector line |
| Genetic reagent (D. melanogaster) | TH-Gal4 | Friggi-Grelin et al., 2003 | RRID:BDSC:95268 | driver line |
| Genetic reagent (D. melanogaster) | R58E02 | Jenett et al., 2012 | RRID:BDSC:41347 | driver line |
| Genetic reagent (D. melanogaster) | MB054B | Eschbach et al., 2020 | N/A | split-line |
| Genetic reagent (D. melanogaster) | MB065B | Eschbach et al., 2020 | RRID:BDSC:68281 | split-line |
| Genetic reagent (D. melanogaster) | MB143B | Eschbach et al., 2020 | N/A | split-line |
| Genetic reagent (D. melanogaster) | MB145B | Eschbach et al., 2020 | N/A | split-line |
| Genetic reagent (D. melanogaster) | MB328B | Eschbach et al., 2020 | N/A | split-line |
| Genetic reagent (D. melanogaster) | SS01702 | Eschbach et al., 2020 | N/A | split-line |
| Genetic reagent (D. melanogaster) | SS01716 | Eschbach et al., 2020 | N/A | split-line |
| Genetic reagent (D. melanogaster) | SS01958 | Eschbach et al., 2020 | N/A | split-line |
| Genetic reagent (D. melanogaster) | SS02160 | Eschbach et al., 2020 | N/A | split-line |
| Genetic reagent (D. melanogaster) | SS02180 | Eschbach et al., 2020 | N/A | split-line |
| Genetic reagent (D. melanogaster) | SS21716 | Eschbach et al., 2020 | N/A | split-line |
| Genetic reagent (D. melanogaster) | SS24765 | Eschbach et al., 2020 | N/A | split-line |
| Chemical compound, drug | Phosphate Buffered Saline | Sigma-Aldrich | N/A | Cat. no. P4417 |
| Chemical compound, drug | Triton X-100 | Sigma-Aldrich | CAS: 9002-93-1 | Cat. no. X100 |
| Chemical compound, drug | 4% Formaldehyde | Thermo Scientific | CAS: 50-00-0 | Cat. no. 047392.9M |
| Chemical compound, drug | Normal goat serum | Sigma-Aldrich | N/A | Cat. no. G9023 |
| Chemical compound, drug | Xylene | Sigma-Aldrich | CAS:1330-20-7 | Cat. no. 247642 |
| Chemical compound, drug | dibutyl phthalate in xylene | Sigma-Aldrich | CAS: 84-74-2 | Cat. no. 06522 |
| Chemical compound, drug | NaCl | VWR Chemicals | CAS: 7647-14-5 | Cat. no. 27810.364 |
| Chemical compound, drug | D-Fructose | Sigma-Aldrich | CAS: 57-48-7 | Cat. no. 47740 |
| Chemical compound, drug | Agarose | Sigma-Aldrich | CAS: 9012-36-6 | Cat. no. A9539 |
| Chemical compound, drug | Quinine | Sigma-Aldrich | CAS: 207671-44-1 | Cat. no. Q1250 |
| Chemical compound, drug | Amyl acetate | Sigma-Aldrich | CAS: 628-63-7 | Cat. no. 46022 |
| Chemical compound, drug | Paraffin oil | Sigma-Aldrich | CAS: 8012-95-1 | Cat. no. 76235 |
| Chemical compound, drug | Hexyl acetate | Sigma-Aldrich | CAS: 142-92-7 | Cat. no. 108154 |
| Chemical compound, drug | Benzaldehyde | Sigma-Aldrich | CAS: 100-52-7 | Cat. no. 12010 |
| Chemical compound, drug | all-trans-retinal | Sigma-Aldrich | CAS: 116-31-4 | Cat. no. R2500 |
| Antibody | rat anti-N-Cadherin | Hybridoma | RRID:AB_528121 | Cat. no. DN-Ex #8 |
| Antibody | rabbit anti-GFP | Life Technologies | RRID:AB_221570 | Cat. no. A6455 |
| Antibody | mouse 4F3 anti-DLG | Hybridoma | RRID:AB_528203 | Cat. no. 4F3 anti-discs large |
| Antibody | goat anti-rat Alexa Fluor 647 | Life Technologies | RRID:AB_141778 | Cat. no. A21247 |
| Antibody | goat anti-rabbit Alexa Flour 488 | Life Technologies | RRID:AB_143165 | Cat. no. A11008 |
| Antibody | goat anti-mouse Alexa Fluor 568 | Life Technologies | RRID:AB_2535804 | Cat. no. A21235 |
| Antibody | mouse anti-TH | Immunostar | RRID:AB_572268 | Cat. no. 22941 |
| Antibody | goat anti-mouse Cy3 | Life Technologies | RRID:AB_10373848 | Cat. no. A10521 |
| Software, algorithm | Fiji version 1.53 c (64-bit) | NIH | https://fiji.sc/ | |
| Software, algorithm | GraphPad Prism 8.4.3 | GraphPad Software, La Jolla, CA | https://www.graphpad.com/scientific-software/prism/ | |
| Software, algorithm | Adobe Photoshop | Adobe Systems, San Jose, CA | https://www.adobe.com/de/products/photoshop.html | |
| Software, algorithm | Affinity Publisher 2.1.1 | Serif (Europe) Ltd., Nottingham, UK | https://affinity.serif.com/de/publisher/ | |
| Software, algorithm | ZEN 2.3 software | Carl Zeiss Microsocopy Germany GmbH | https://www.zeiss.de/mikroskopie/produkte/mikroskopsoftware/zen-lite/zen-lite-download.html |
Additional files
Download links
A two-part list of links to download the article, or parts of the article, in various formats.
Downloads (link to download the article as PDF)
Open citations (links to open the citations from this article in various online reference manager services)
Cite this article (links to download the citations from this article in formats compatible with various reference manager tools)
Four individually identified paired dopamine neurons signal taste punishment in larval Drosophila
eLife 12:RP91387.
https://doi.org/10.7554/eLife.91387.4


