Omissions of threat trigger subjective relief and prediction error-like signaling in the human reward and salience systems
- Laboratory of Biological Psychology, Department of Brain & Cognition, KU Leuven, Belgium
- Leuven Brain Institute, KU Leuven, Belgium
- Laboratory for Brain-Gut Axis Studies (LaBGAS), Translational Research in GastroIntestinal Disorders (TARGID), Department of chronic diseases and metabolism, KU Leuven, Belgium
Figures
Figure 1
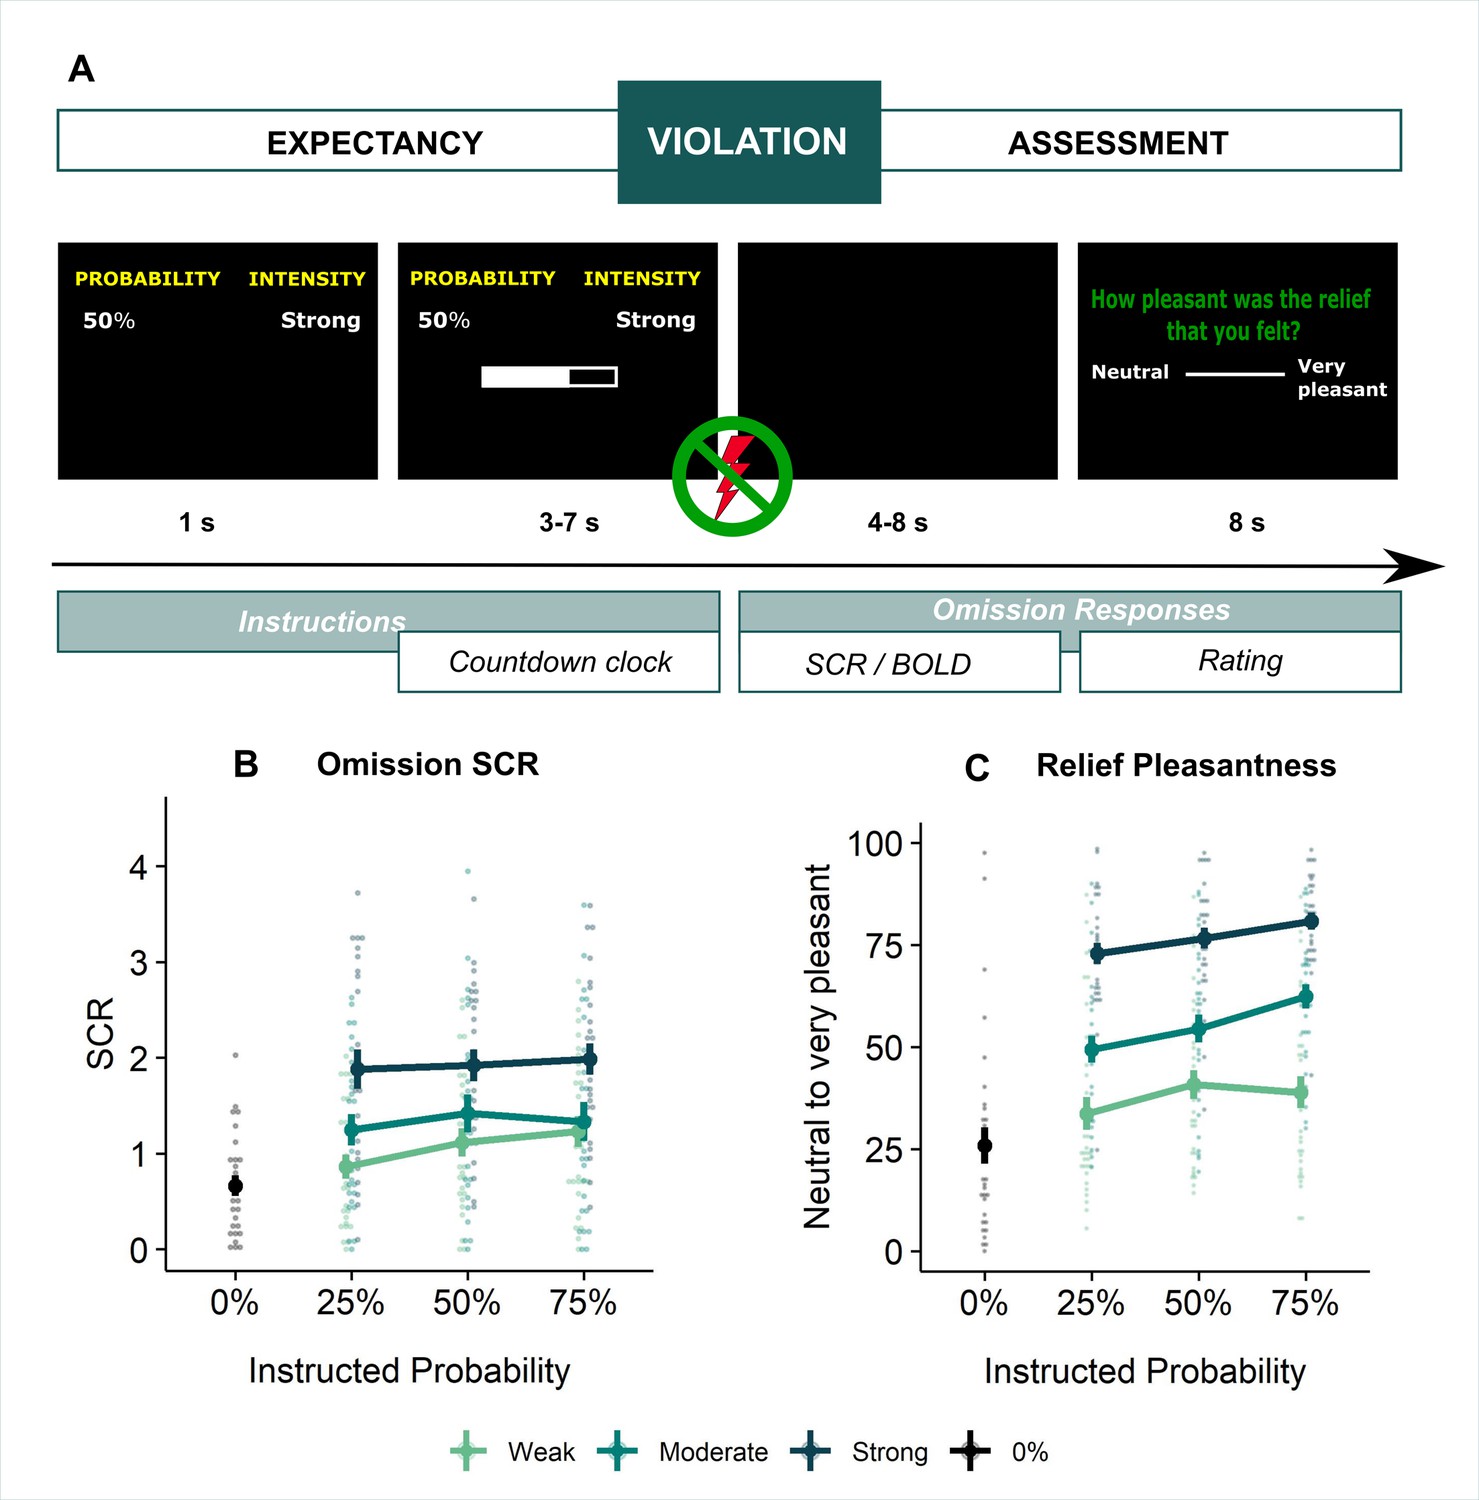
Experimental design and behavioral results.
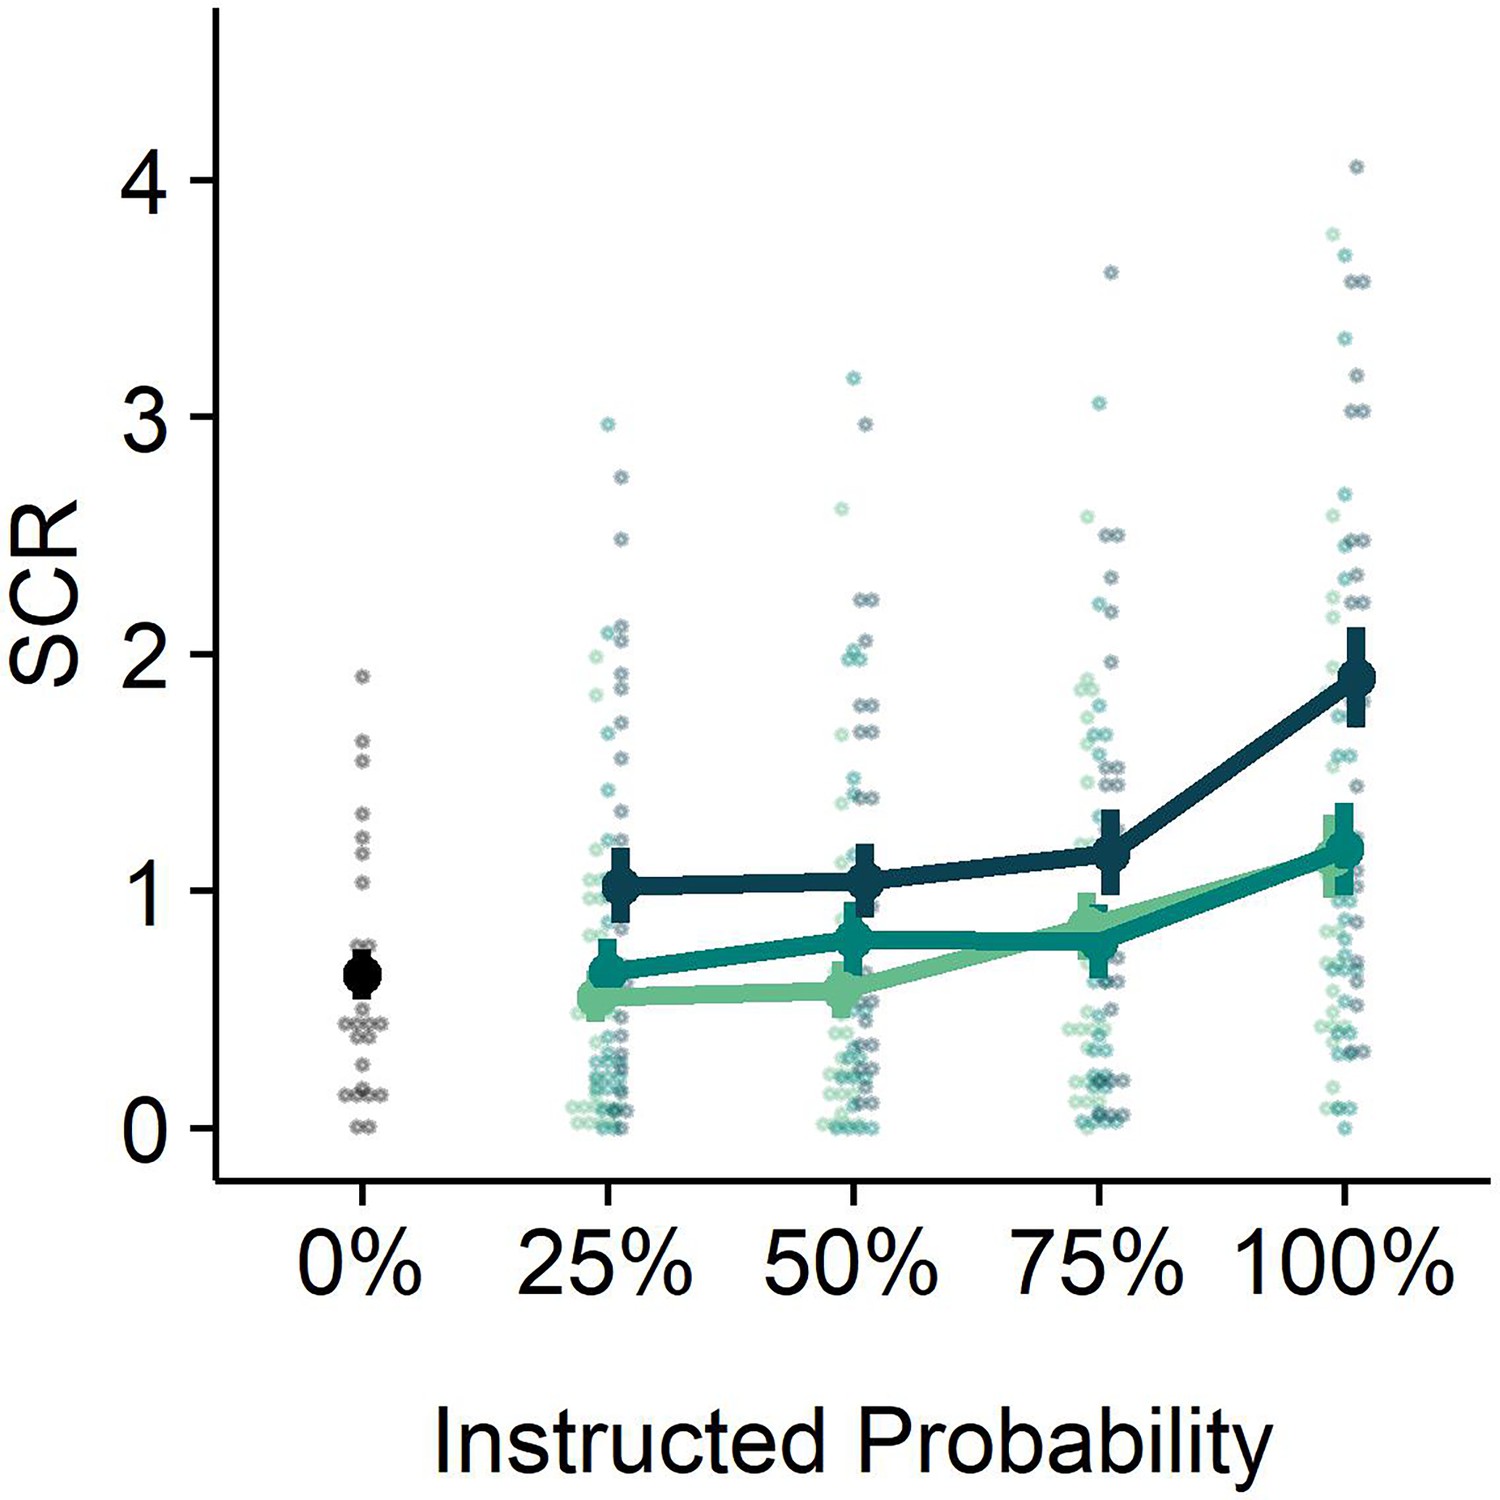
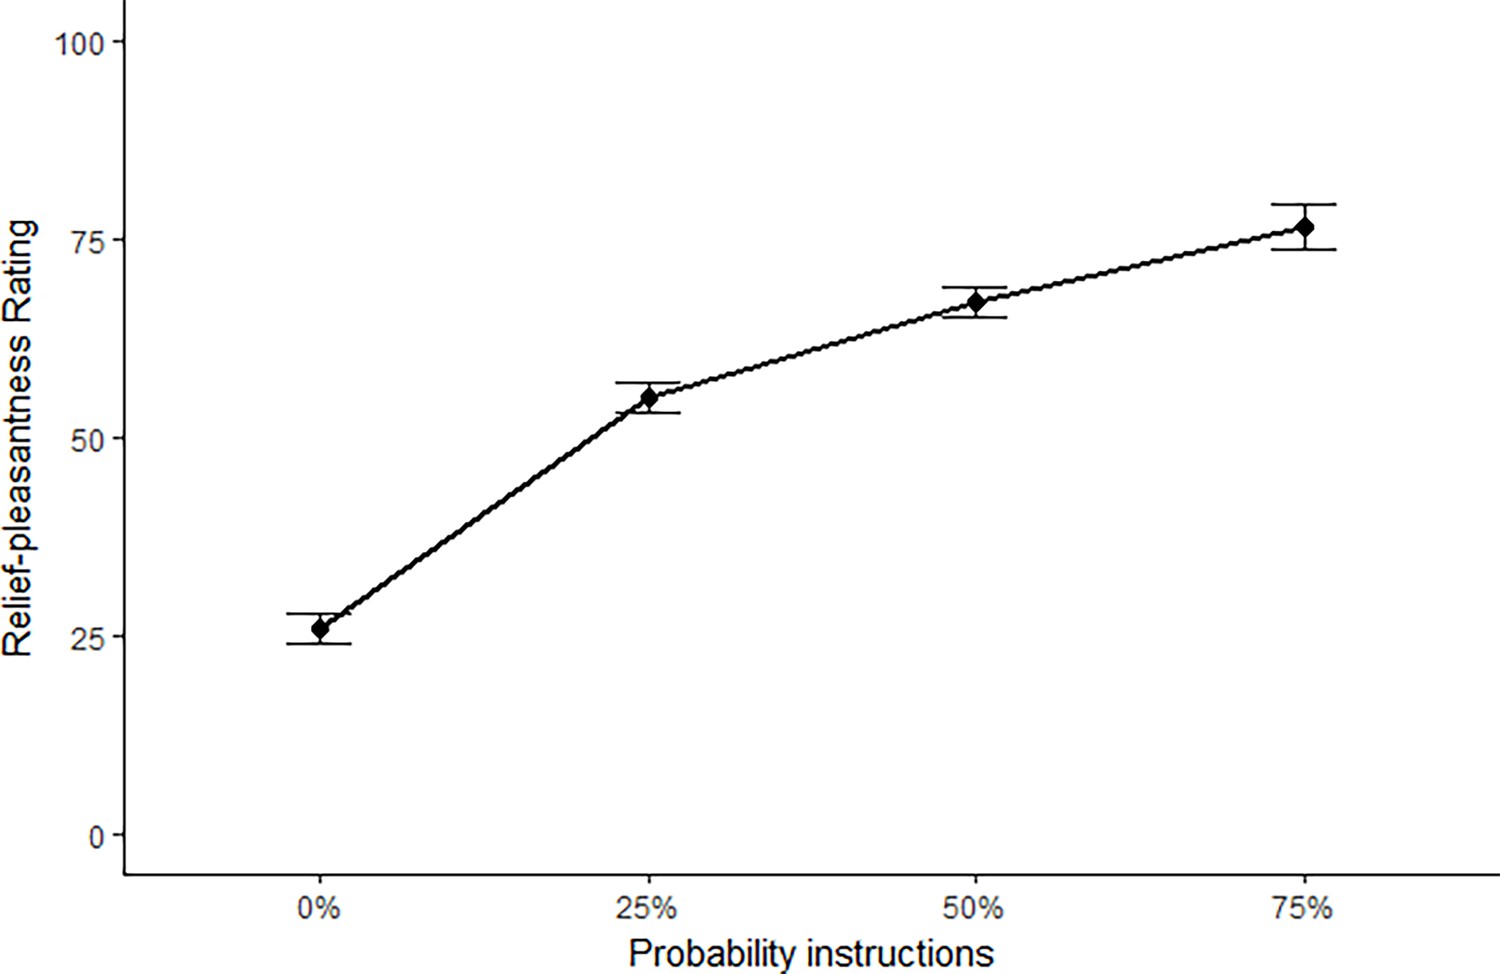
(A) All trials started with instructions on the probability (ranging from 0% to 100%) and intensity (weak, moderate, strong) of a potentially painful electrical stimulation (1 s), followed by the addition of a countdown bar that indicated the exact moment of stimulation or omission. The duration of the countdown clock was jittered between 3 and 7 s. Then, the screen cleared and the electrical stimulation was either delivered or omitted. Most of the trials (48 trials) did not contain the anticipated electrical stimulation (omission trials). Following a delay of 4–8 s, a rating scale appeared, probing stimulation-unpleasantness on stimulation trials, and relief-pleasantness on omission trials. After 8 s, an ITI between 4 and 7 s started, during which a fixation cross was presented on the screen. The task consisted in total of 72 trials, divided equally over 4 runs (18 trials/run). Each run contained all probability (25, 50, 75) x intensity (weak, moderate, strong) combinations exactly once not followed by the stimulation (9 omission trials), three 0%-omission trials (without any intensity information), three 100%-stimulation trials (followed by the stimulation of the given intensity, one per intensity level per run), and three additional trials from the probability (25,50,75) x Intensity (weak, moderate, strong) matrix that were followed by the stimulation (per run each level of intensity and probability was once paired with the stimulation). For a detailed overview of the trials see Supplementary file 3 – Trial types and numbers. (B) SCR were scored as the time integral of the deconvoluted phasic activity (using CDA in Ledalab) within a response window of 1–4 s post omission. Responses were square root transformed. SCR were larger following omissions of more probable and more intense US omissions (N = 26; main effect Probability: F = 5.15, p < .01; main effect Intensity, F = 107.47, p < .001) . (C) The pleasantness of the relief elicited by US omissions was rated on a VAS-scale ranging from 0 (neutral) to 100 (very pleasant). Omission-relief was rated as being more pleasant following omissions of more intense and more probable US (N = 31; main effect Probability: F = 30.64, p < .001; main effect Intensity: F = 623.79, p < .001). In both graphs, individual data points are presented, with the group averages plotted on top. The error bars represent standard error of the mean.
Figure 2
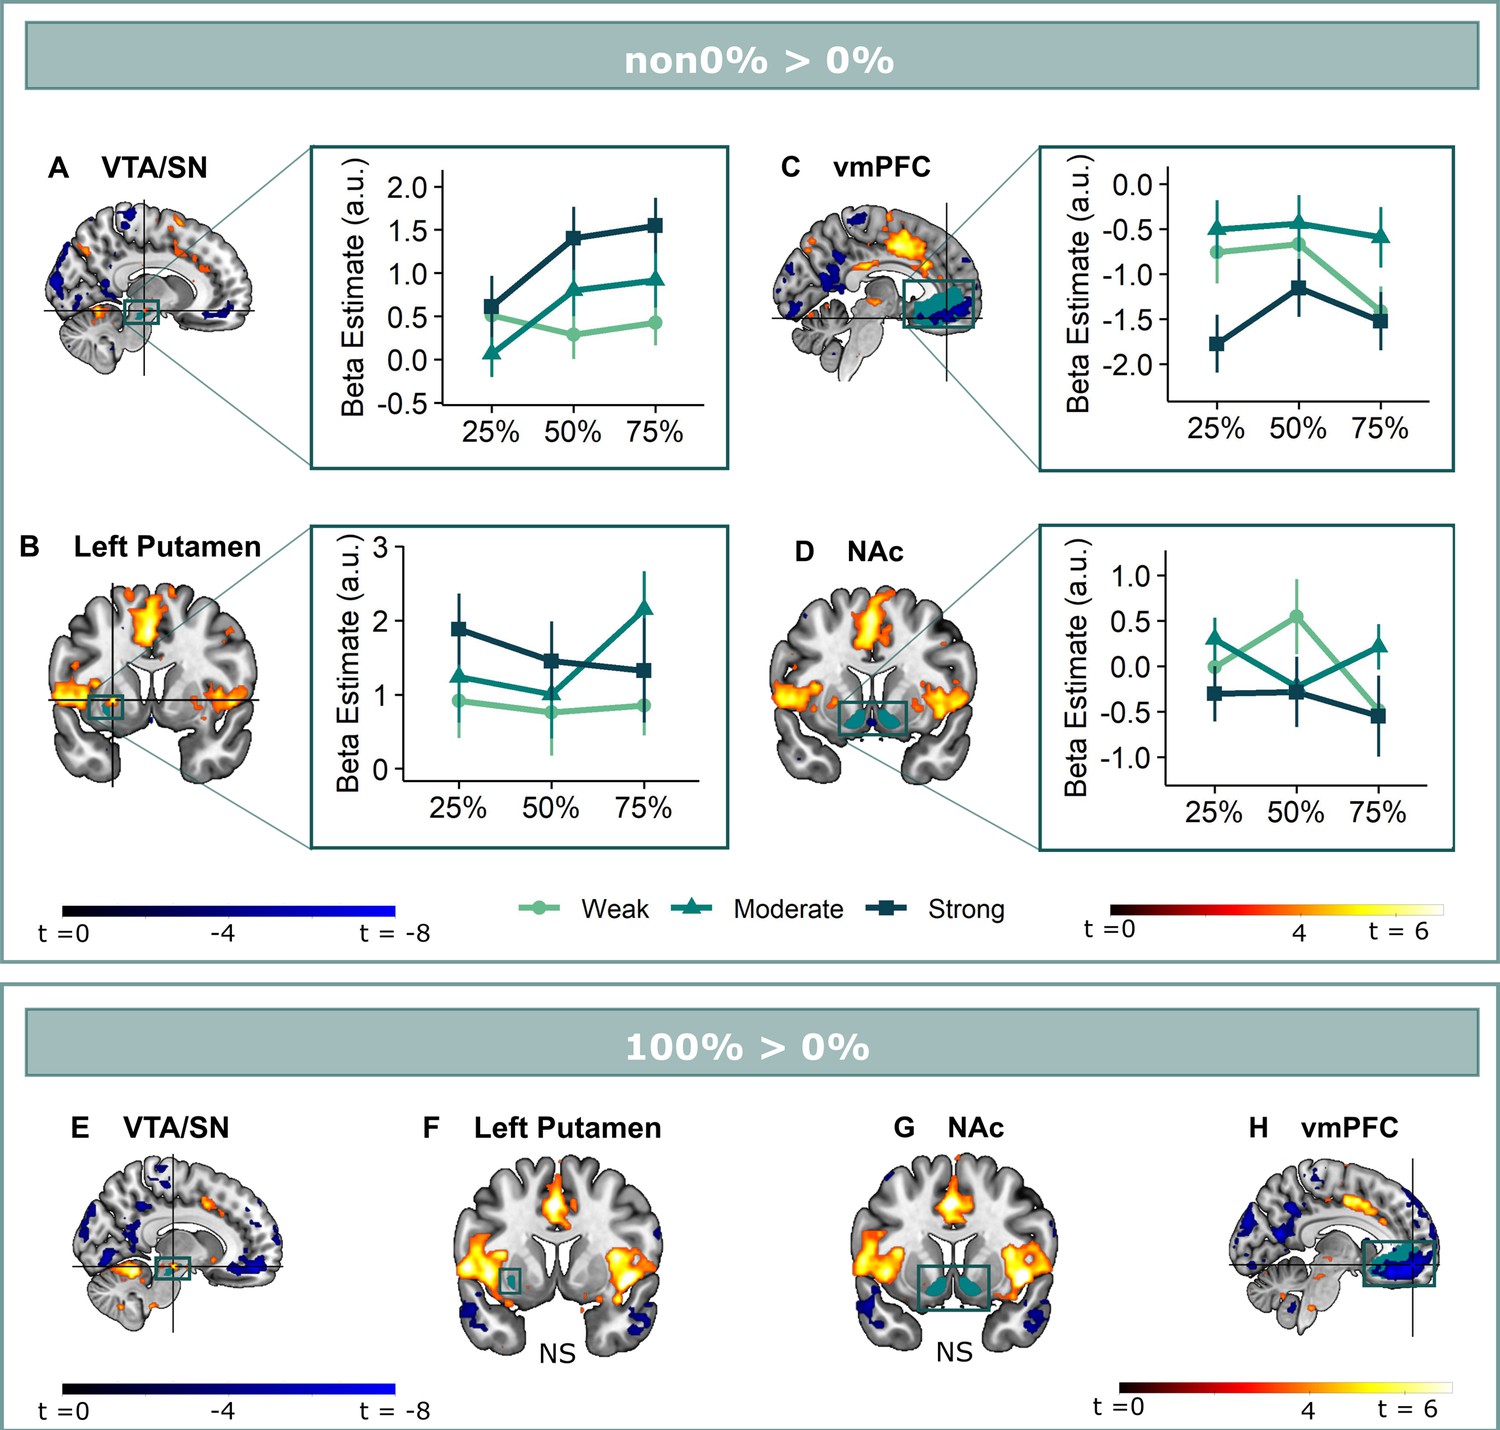
Omission-related activations in the a priori ROIs.
Unexpected omissions of stimulation (non0%>0%) triggered significant fMRI responses in (A) the VTA/SN, and (B) left ventral putamen, but deactivations in (C) the vmPFC and no change in activation in (D) the NAc. Only for the VTA/SN did the activations increase with increasing Probability and Intensity of omitted stimulation (N = 31; Probability: F = 2.94, p = .055; Intensity: F = 6.14, p < .005). vmPFC responses decreased with increasing intensity of the omitted stimulation (N = 31; F = 9.29, p < .001). Fully predicted stimulations (100%) elicited stronger activations than fully predicted omission (0%) in (E) the VTA/SN, no difference in activation for (F) the left Putamen and (G) the NAc, and stronger deactivations for fully predicted stimulation versus omission in (H) the vmPFC. In all figures, the unexpected omission maps were overlayed with the a priori ROI masks (in teal) and were displayed at threshold p<0.001 (unc) for visualization purposes. The crosshairs represent the peak activation within each a priori ROI. The extracted beta-estimates in figures A-D represent the ROI averages from each non-0%>0% contrast (i.e. 25%>0%; 50%>0%; and 75%>0% for the weak, moderate, and strong intensity levels). Any positive beta therefore indicates a stronger activation in the given region compared to a fully predicted omission. Any negative beta indicates a weaker activation. The dots and error bars represent the mean and standard error of the mean.
Figure 3
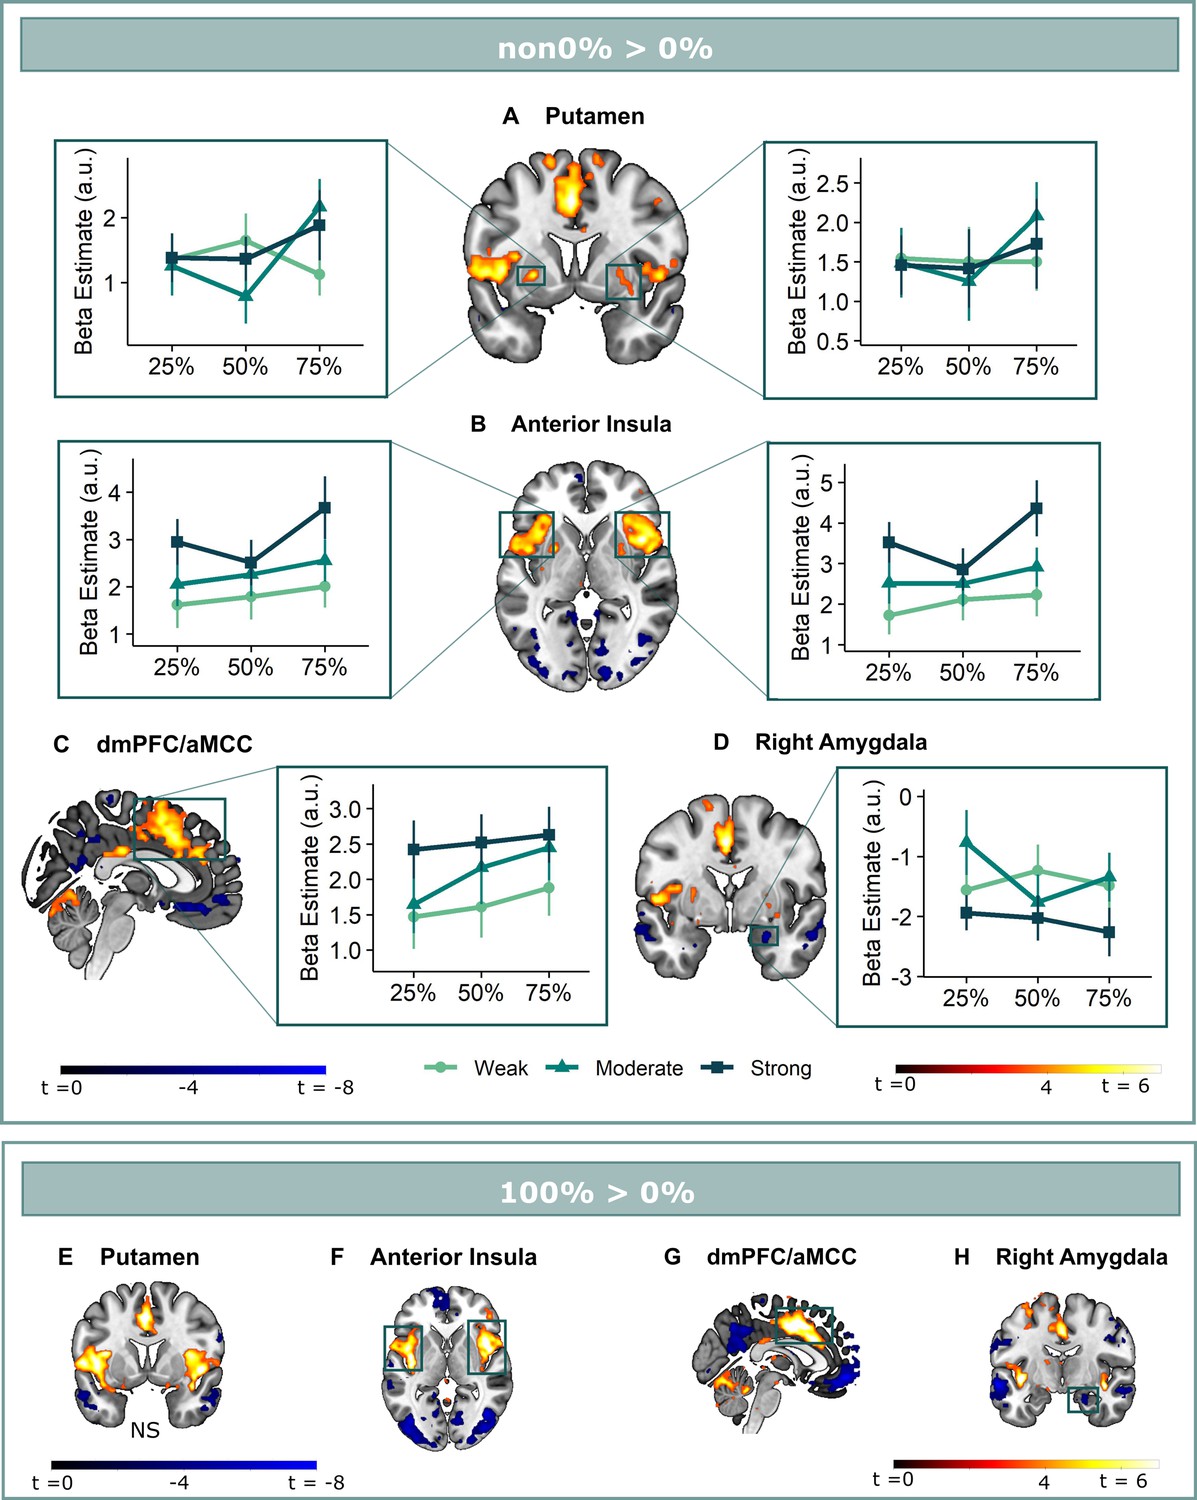
Omission-related activations in the secondary mask.
We extracted unexpected omission (non0%>0%) processing clusters within our secondary mask, using a voxel threshold, p<0.001, followed by a cluster-threshold (FWE-corrected) of p<0.05. We found significant positive omission processing clusters in (A) the bilateral putamen, (B) bilateral aINS, (C) dmPFC/aMCC, and a trend-level negative omission processing cluster in (D) the right amygdala. Omission related activations in the bilateral aINS and dmPFC/aMCC increased with increasing probability (at trend-level) and intensity of omitted threat (N = 31; main effect Intensity: left aINS: F = 8.95, p <0.001; right aINS: F = 13.49, p <0.001; dmPFC/aMCC: F = 6.59, p <0.005; main effect Probability: right aINS: F(2,240) = 2.78, p = 0.06, dmPFC/aMCC: F = 2.48, p = 0.09), whereas amygdala activations decreased with omissions of increasingly intense threat (N = 31, main effect Intensity: F = 3.26, p<0.05). Nevertheless, fully predicted stimulations (100%) elicited stronger activations than fully predicted omission (0%) in (F) the bilateral aIns, and (G) the dmPFC/aMCC, and stronger deactivations in the (H) right amygdala, but no difference in activation in the (E) bilateral putamen. In all figures, the unexpected omission maps are displayed at threshold p<0.001 (unc) for visualization purposes. The extracted beta-estimates in figures A-D represent the ROI averages from each non-0%>0% contrast (i.e. 25%>0%; 50%>0%; and 75%>0% for the weak, moderate, and strong intensity levels). Any positive beta therefore indicates a stronger activation in the given region compared to a fully predicted omission. Any negative beta indicates a weaker activation. The dots and error bars represent the mean and standard error of the mean.
Figure 4
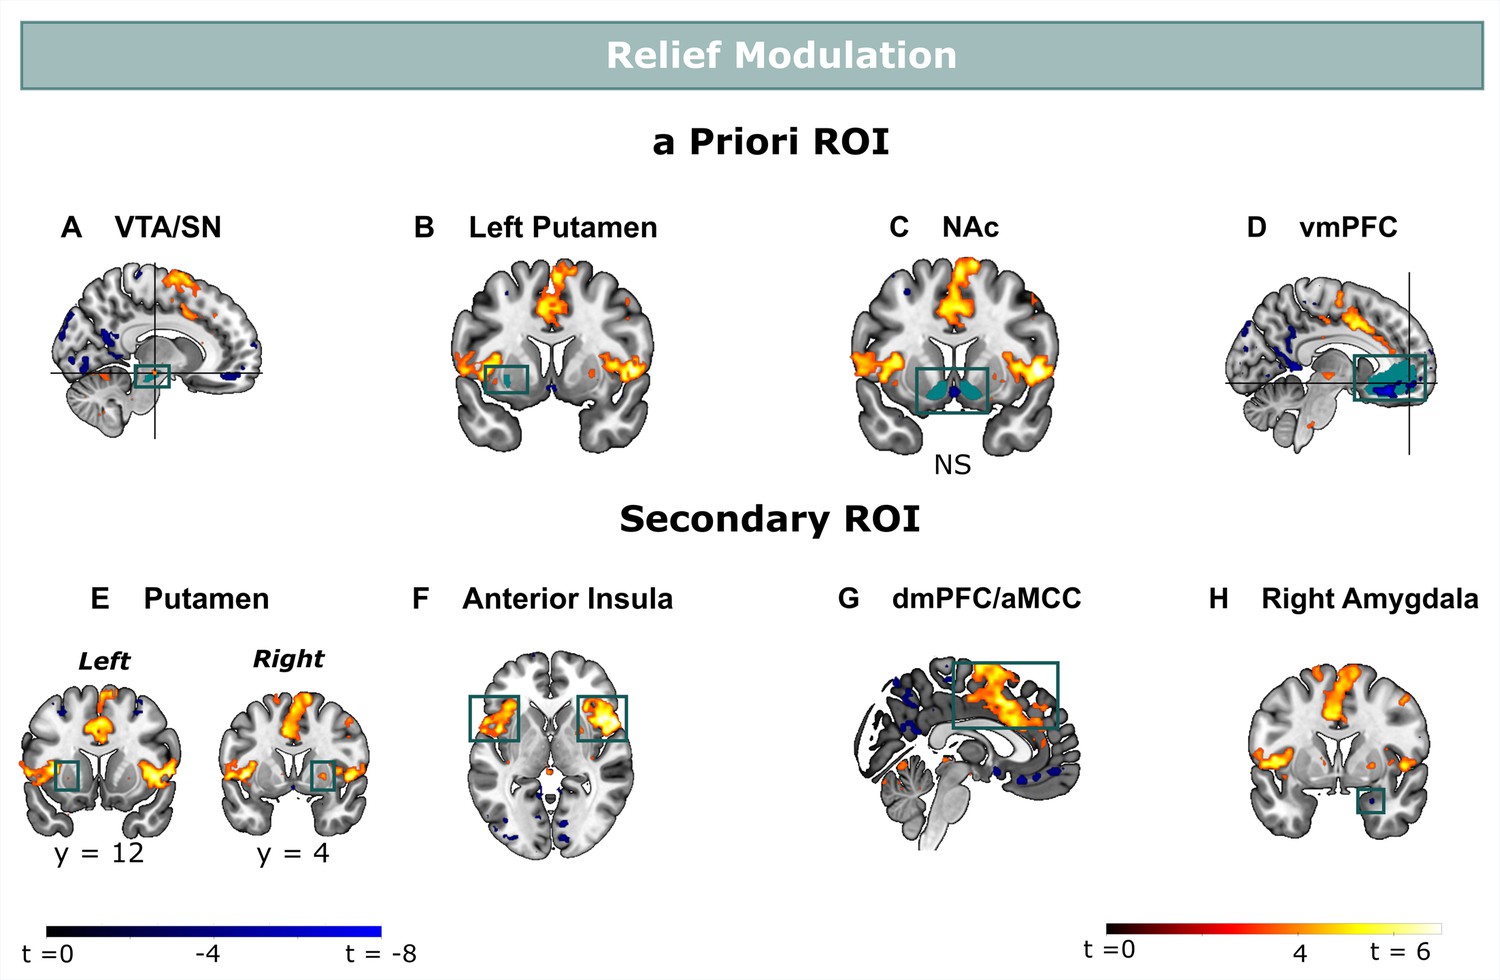
Relief modulation in the a priori and secondary ROIs.
Omission-related activations were modulated by trial-by-trial levels of relief-pleasantness in (A) the VTA/SN, (B) left ventral Putamen, and (D) vmPFC, but not in (C) the NAc. Omission-related activations in the secondary ROIs were modulated by trial-by-trial levels of relief-pleasantness in (A) the right putamen, (B) bilateral aINS, (C) dmPFC/aMCC, and the (D) right amygdala. In all figures, the relief modulation maps are displayed at threshold p<0.001 (unc) for visualization purposes.
Figure 5

LASSO-PCR based neural signature of relief-pleasantness.
(A) Relief predictive signature map consisting of all voxels within a grey matter mask. All weights were used for prediction. (B) Thresholded signature map (p<0.001), consisting of clusters that contribute significantly to the relief prediction (all clusters < 65 voxels). (C) Predicted and reported relief-pleasantness correlated significantly, r=0.28, p<0.001. Each line/color represents data of a single participant (N=31). (D) Correlations between reported and predicted relief in all lesion models (in each model one of the ROIs was removed from the grey matter mask). The stable correlation across models confirmed that none of our ROIs contributed significantly to the relief-predictive signature model.
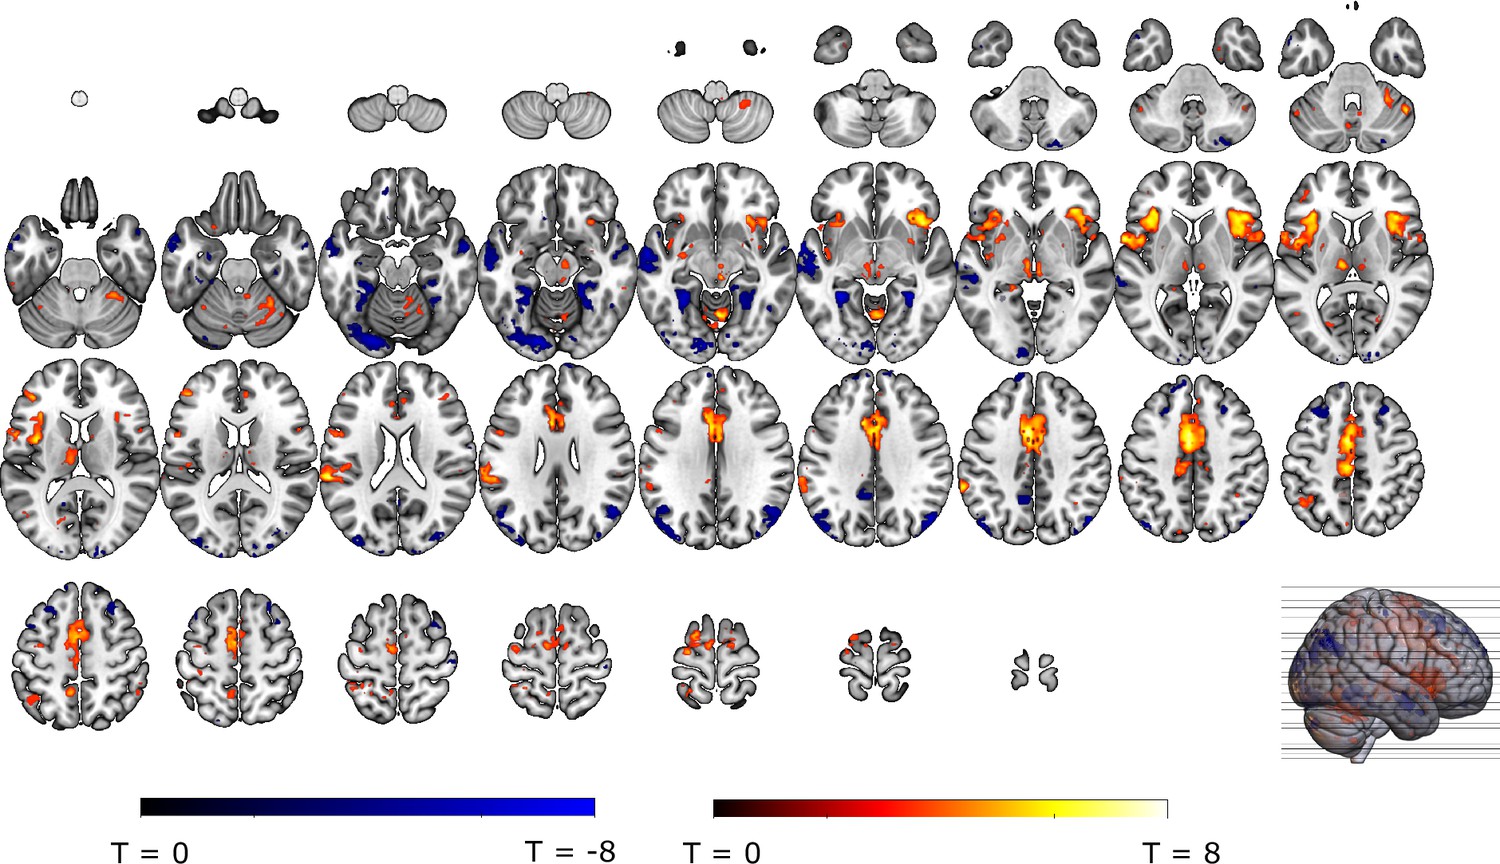
Appendix 3—figure 1
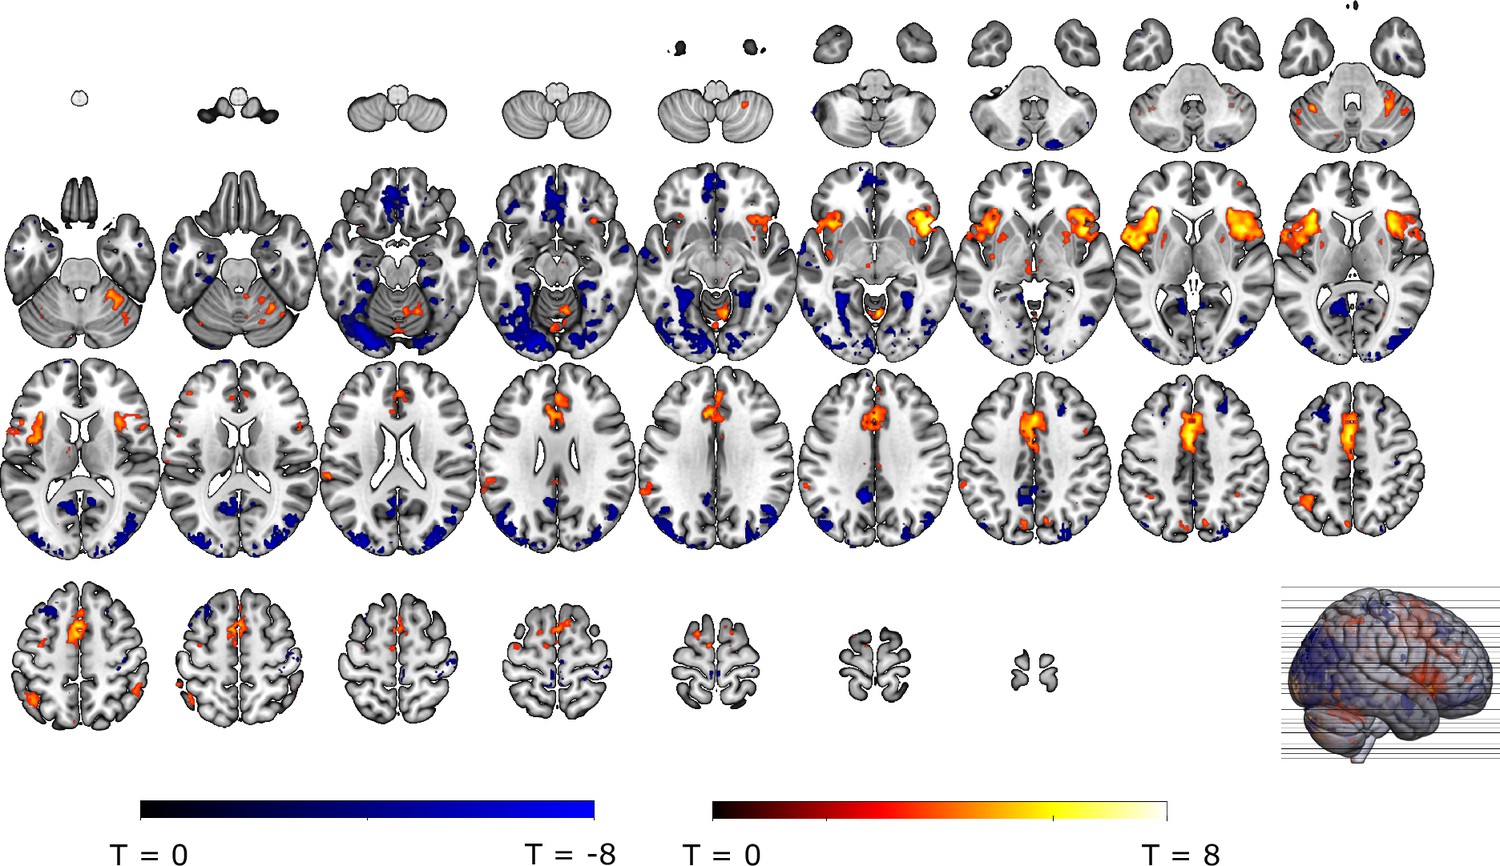
Whole-brain (grey-matter masked) omission responses identified via the non0 % > 0% omission contrast, thresholded at p < 0.001 (uncorrected) for display purposes.
Appendix 3—figure 2
Probability- and intensity-related changes in threat omission-related fMRI responses per exploratory cluster.
Significant effects are indicated by the p-value.
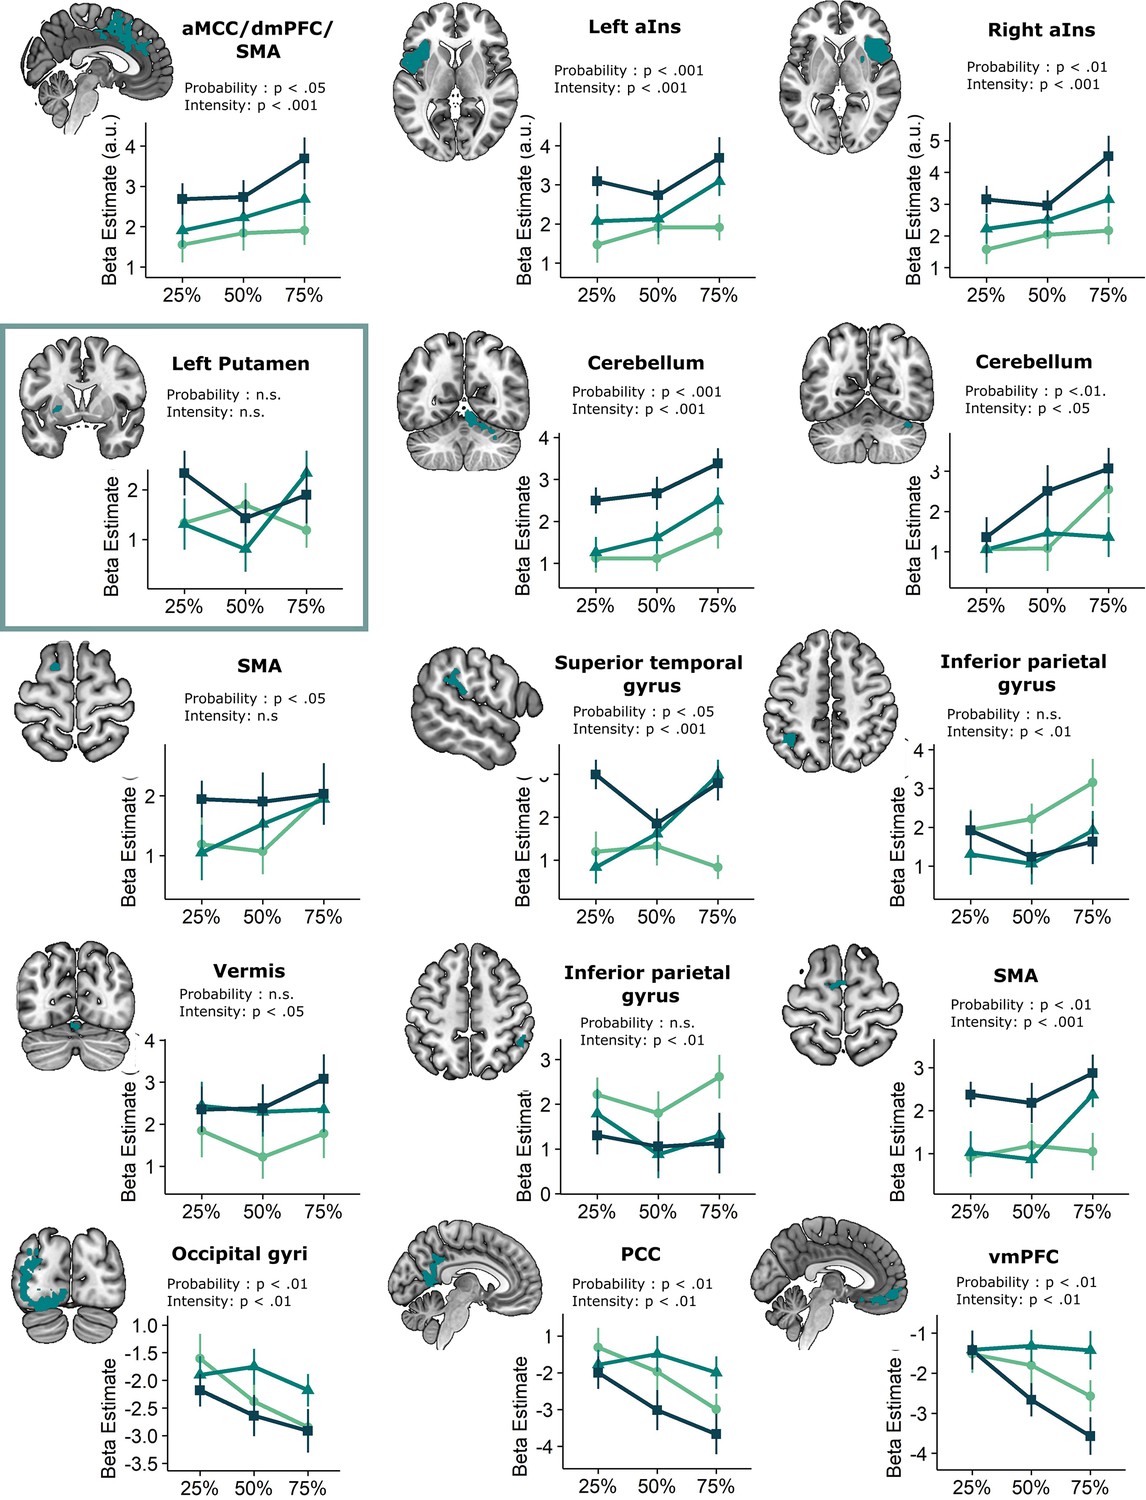
Appendix 3—figure 3
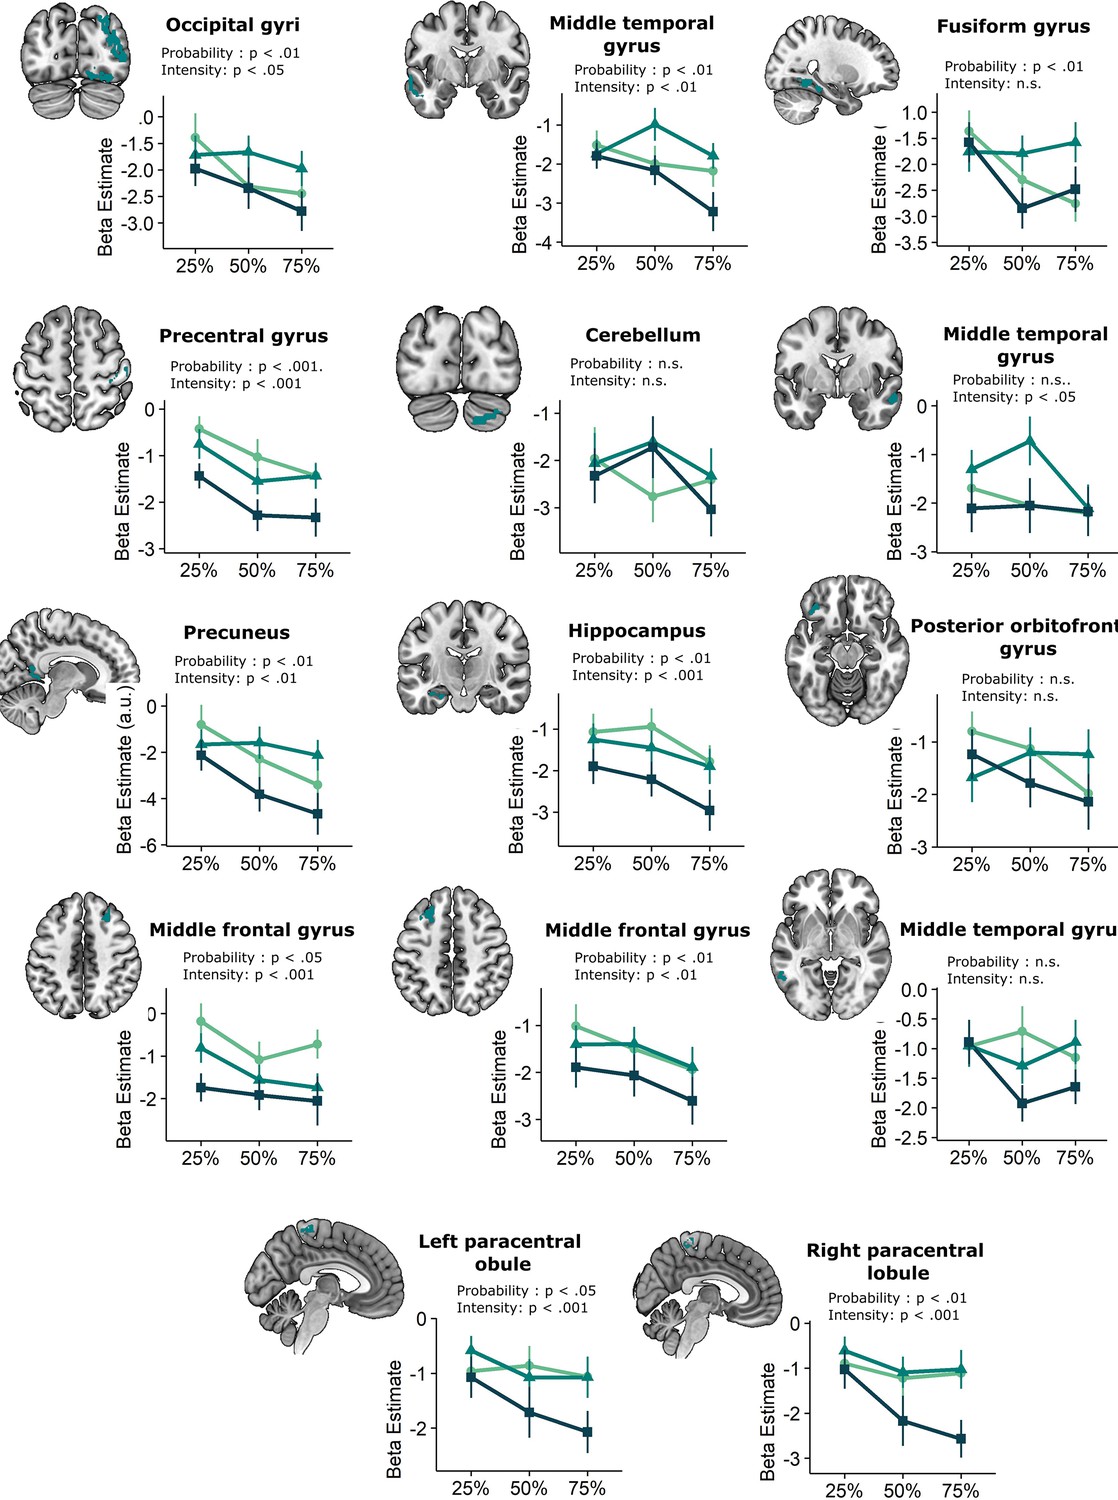
Probability- and intensity-related changes in threat omission-related fMRI responses per exploratory cluster.
Significant effects are indicated by the p-value.
Appendix 3—figure 4
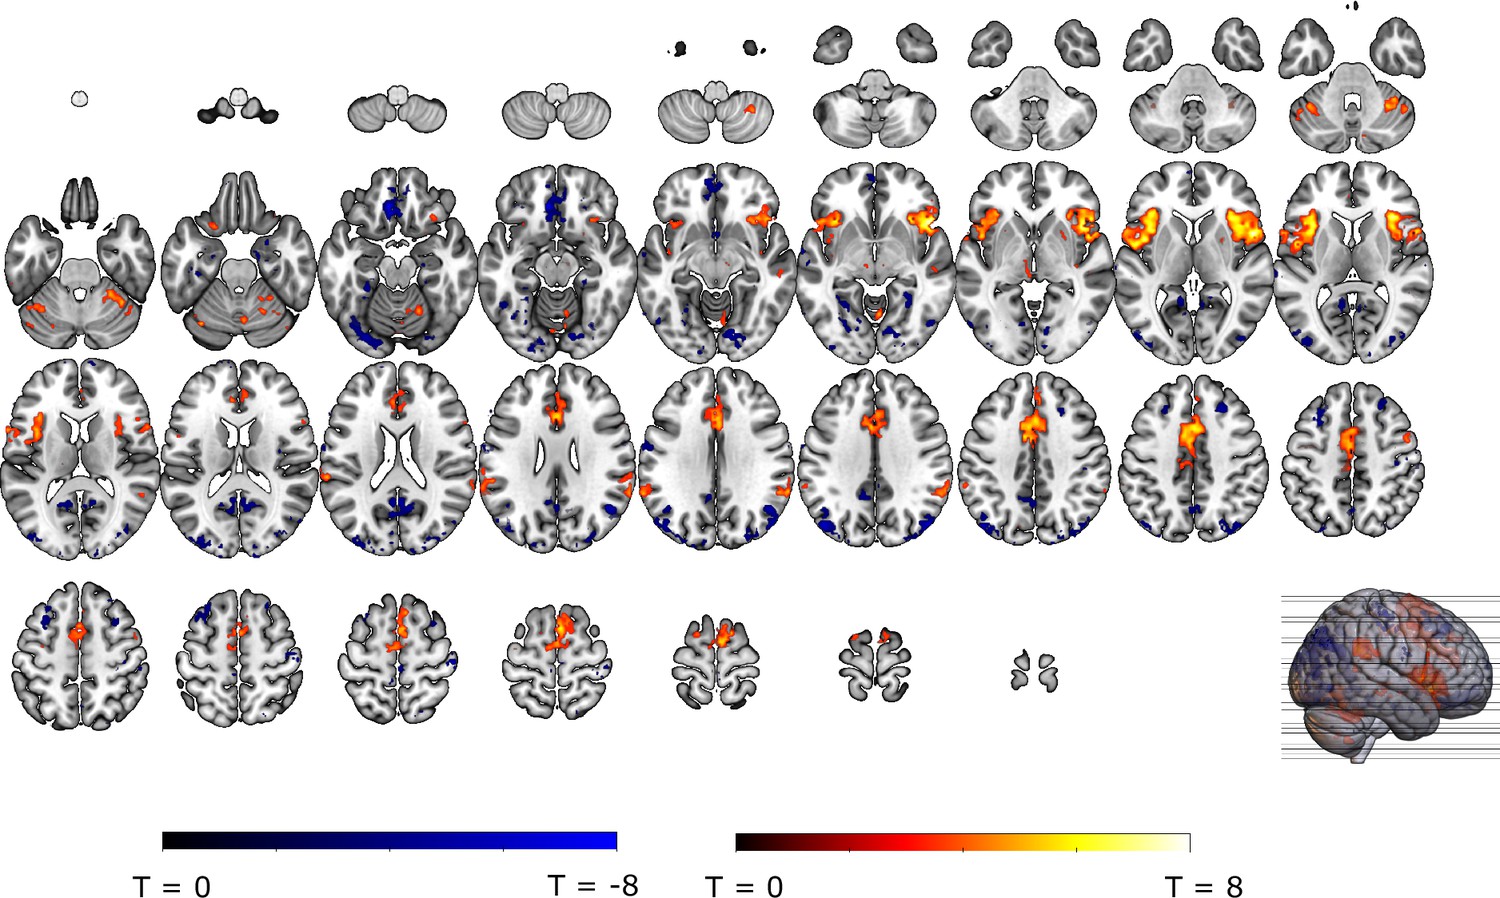
Whole-brain (grey-matter masked) relief modulation of omission-related fMRI responses identified via the relief modulation contrast, thresholded at p < 0.001 (uncorrected) for display purposes.
Appendix 4—figure 1
Anticipatory SCR to the instructions were larger for stimulations of a higher instructed probability and intensity.
Individual data points are presented, with the group averages plotted on top. The error bars represent standard error of the mean.
Appendix 4—figure 2
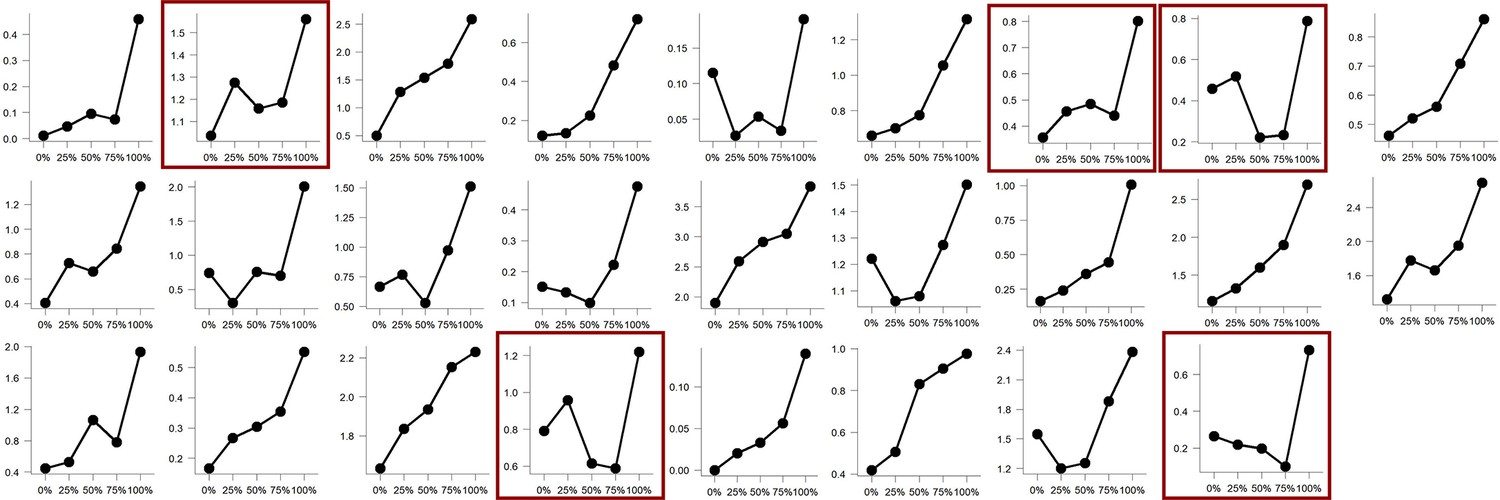
Individual anticipatory SCR followed probability instructions.
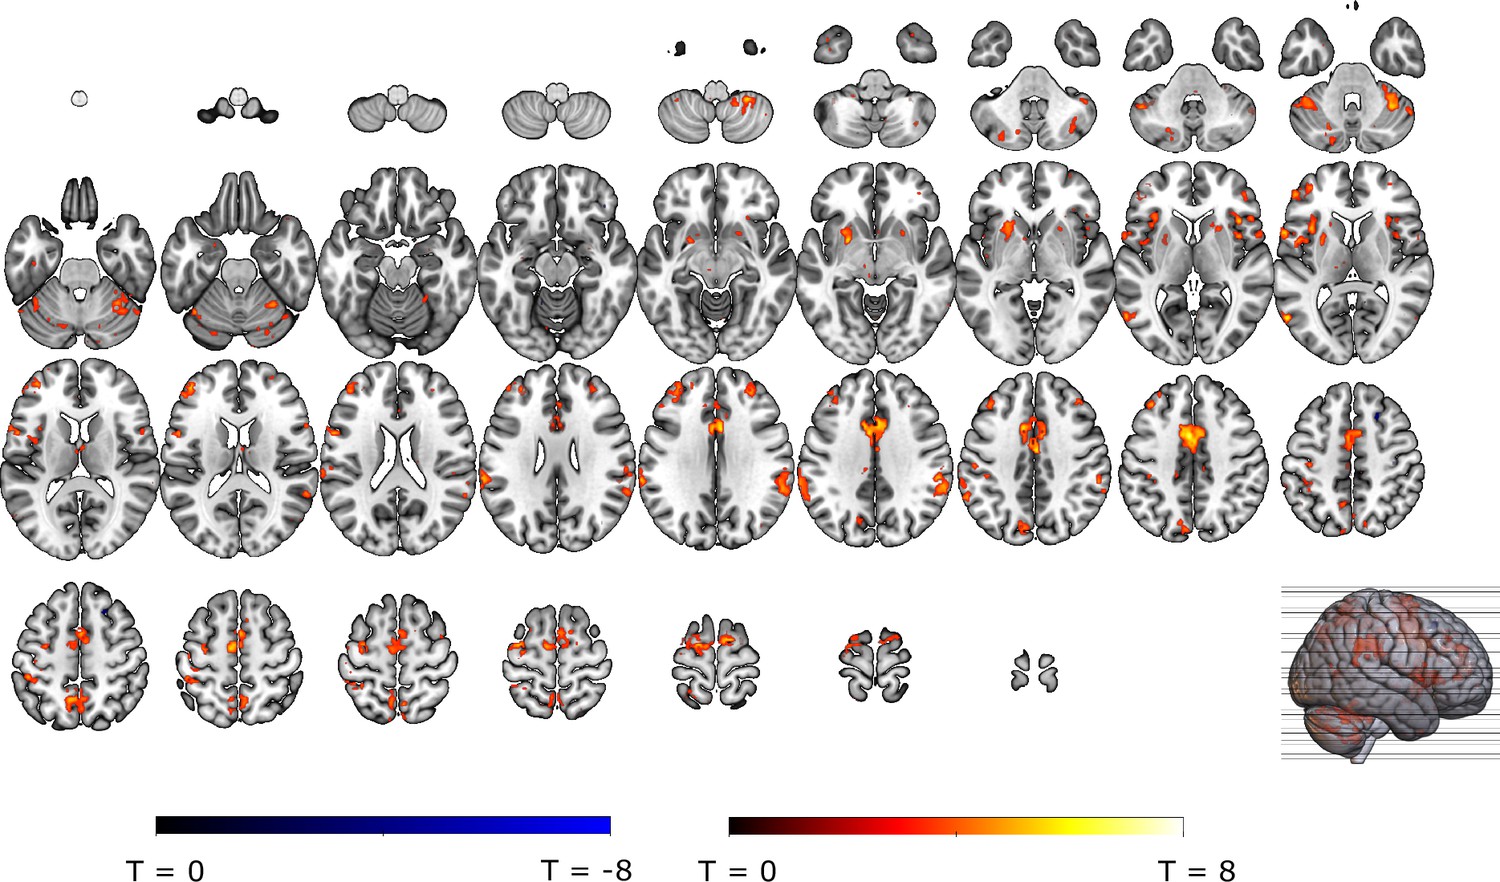
Appendix 4—figure 3
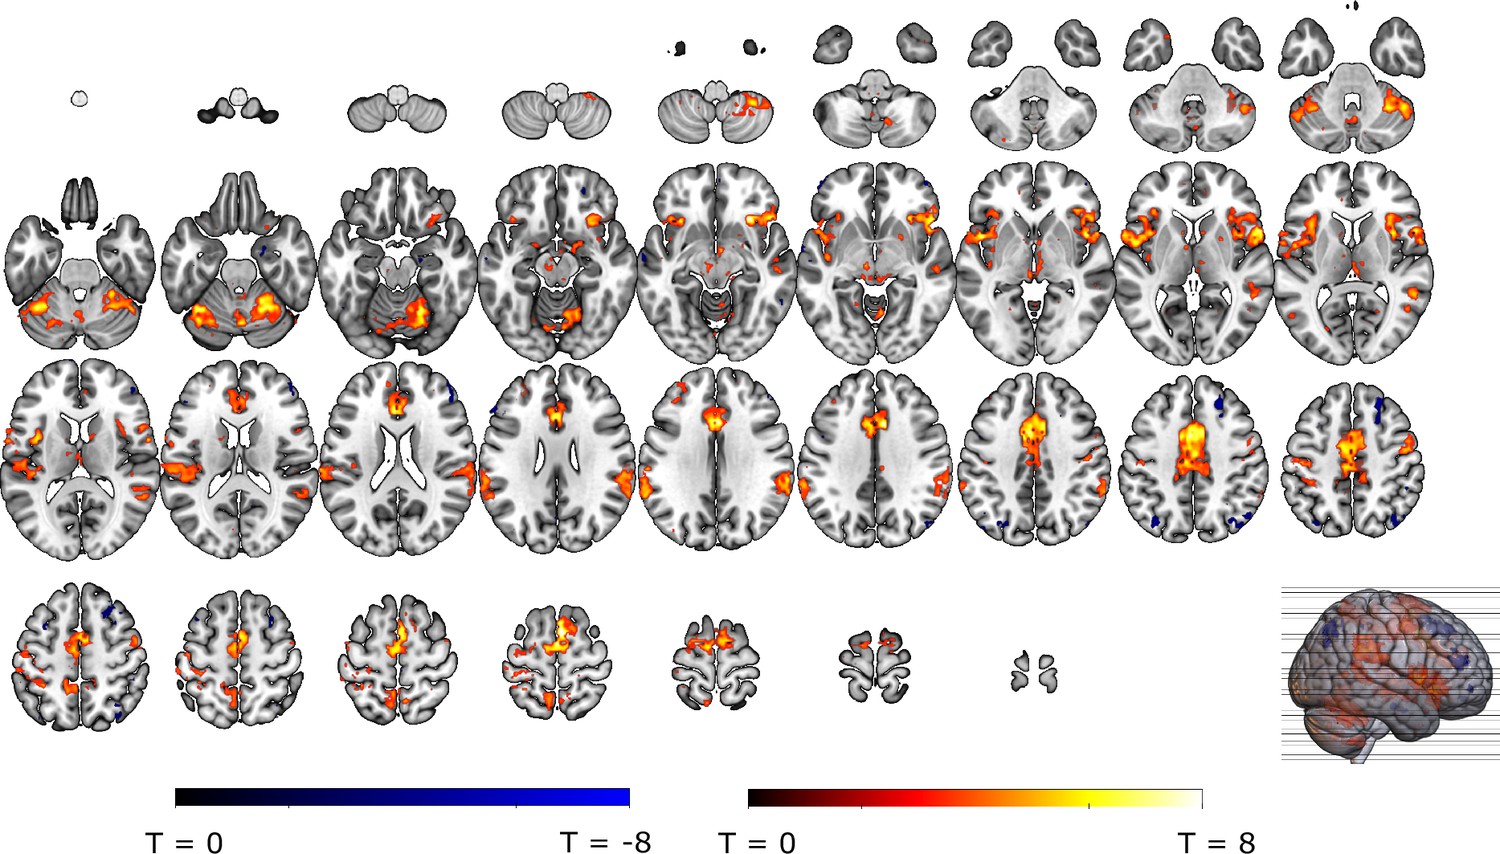
Whole-brain (grey-matter masked) anticipatory fMRI responses to the presentation of the instructions identified via the non0 % > 0% anticipation contrast, thresholded at p < 0.001 (uncorrected) for display purposes.
Appendix 4—figure 4
A linear increase in whole-brain (grey-matter masked) anticipatory fMRI activations for increasing probability instructions, identified via the probability contrast, thresholded at p < 0.001 (uncorrected) for display purposes.
Appendix 4—figure 5
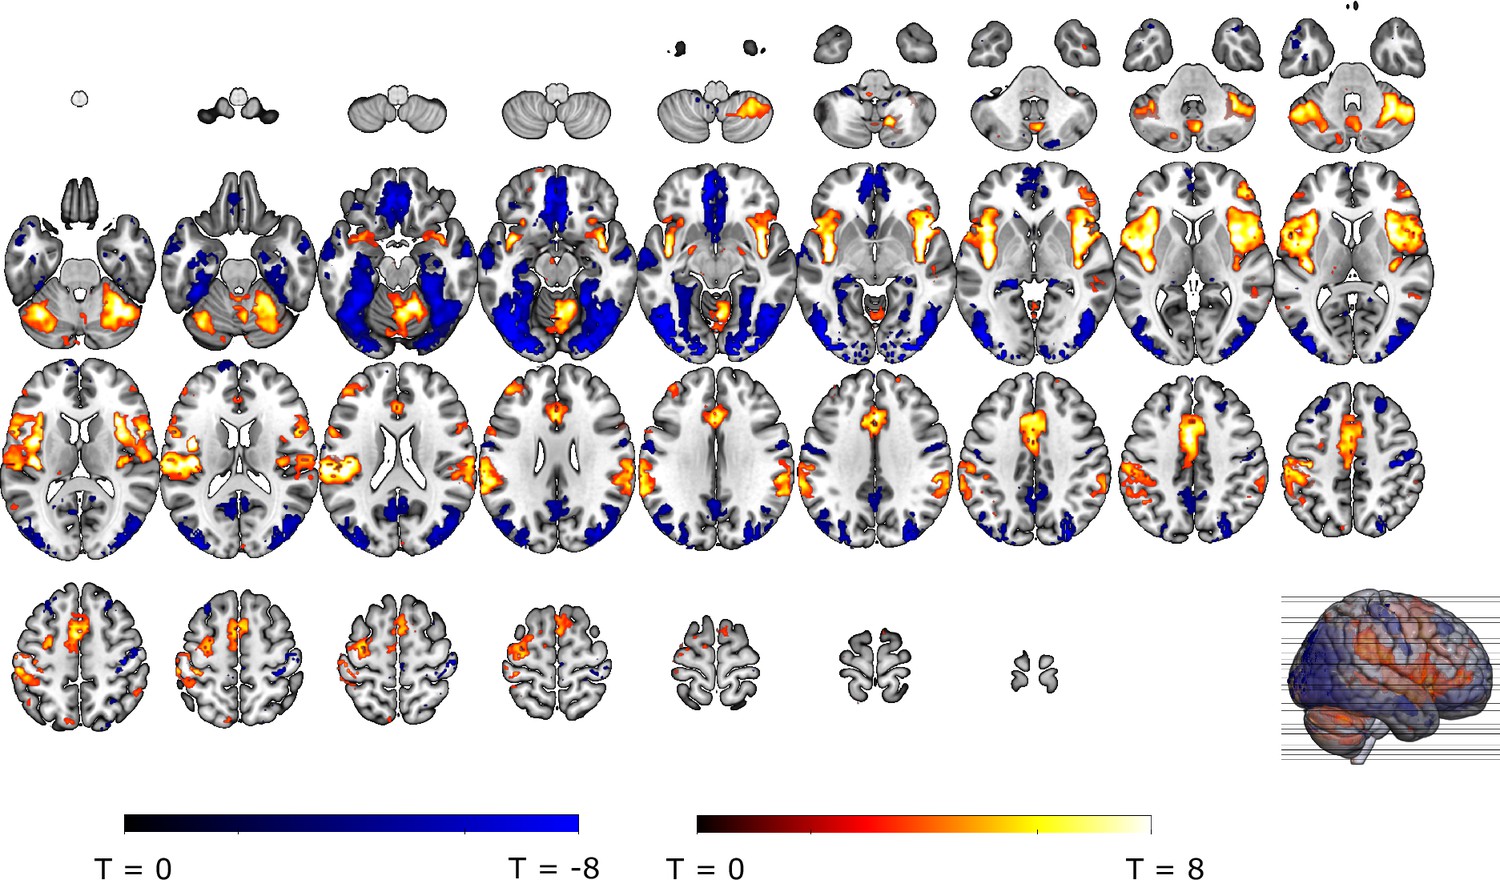
Intensity contrast in whole-brain (grey-matter masked) anticipatory fMRI activations, identified via the Intensity contrast, and thresholded at p < 0.001 (uncorrected) for display purposes.
Appendix 4—figure 6

Probability and intensity effects for self-reported unpleasantness (A) and stimulation SCR (B).
Appendix 4—figure 7
Whole-brain (grey-matter masked) stimulation-related fMRI responses based on the stimulation > baseline contrast, thresholded at p < 0.001 (uncorrected) for display purposes.
Appendix 4—figure 8

Whole-brain (grey-matter masked) unexpected stimulation-related fMRI responses based on the non-100% stimulation > 100% stimulation contrast, and thresholded at p < 0.001 (uncorrected) for display purposes.
Appendix 5—figure 1
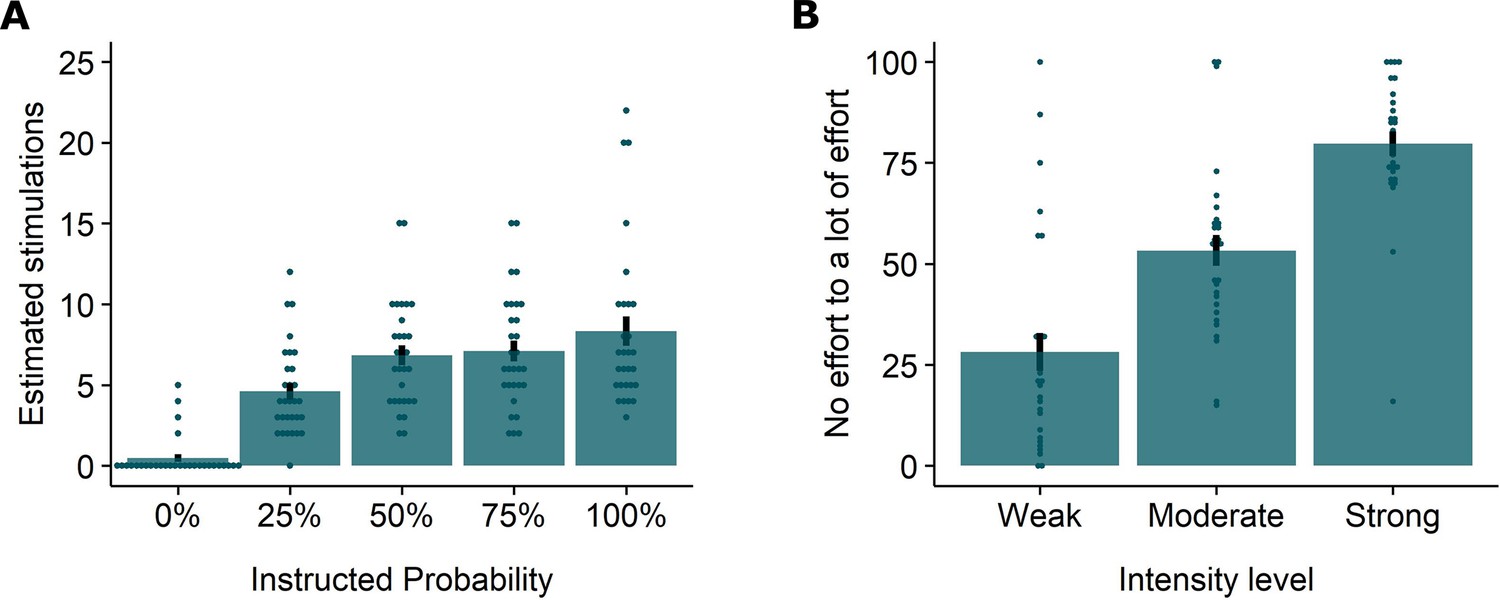
Post experimental recollections of stimulation and effort to avoid future stimulations.
A. Participants recollected having received more stimulations following instructions of a higher probability. B. Participants were willing to exert more effort to prevent stronger stimulations. In both graphs, individual data points are presented, with the group averages plotted on top. The error bars represent standard error of the mean.
Appendix 5—figure 2
Results from an unpublished pilot study where the reinforcement rate matched the instructions.
Main effect of Probability including 0% : F(1.74,31.23) = 53.94, p < 0.001, ηp 2 = 0.75; Main effect of Probability excluding 0%: F(1.50, 28.43) = 21.03, p < 0.001, ηp 2 = 0.53.
Appendix 5—figure 3
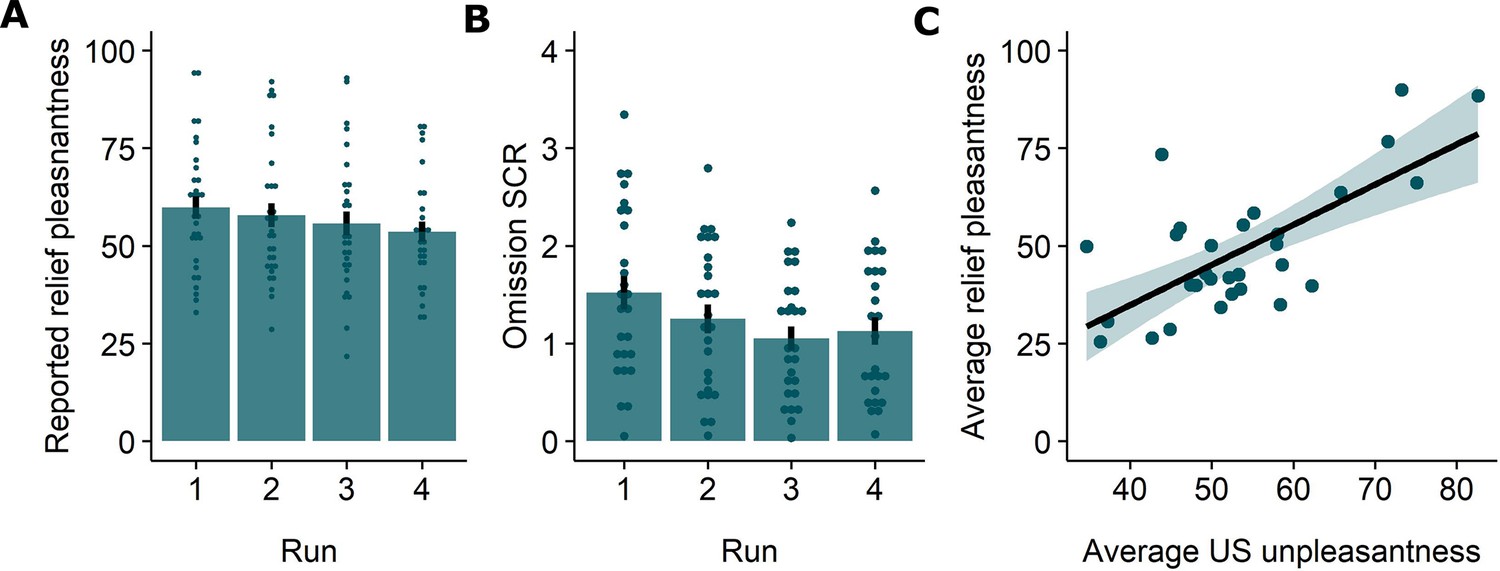
Run and US unpleasantness effects for subjective and physiological omission responses.
Reported relief-pleasantness (A) and omission SCR (B) decreased over runs. C. Participants who perceived the stimulation as more unpleasant (on average) reported higher levels of relief (on average).
Appendix 6—figure 1
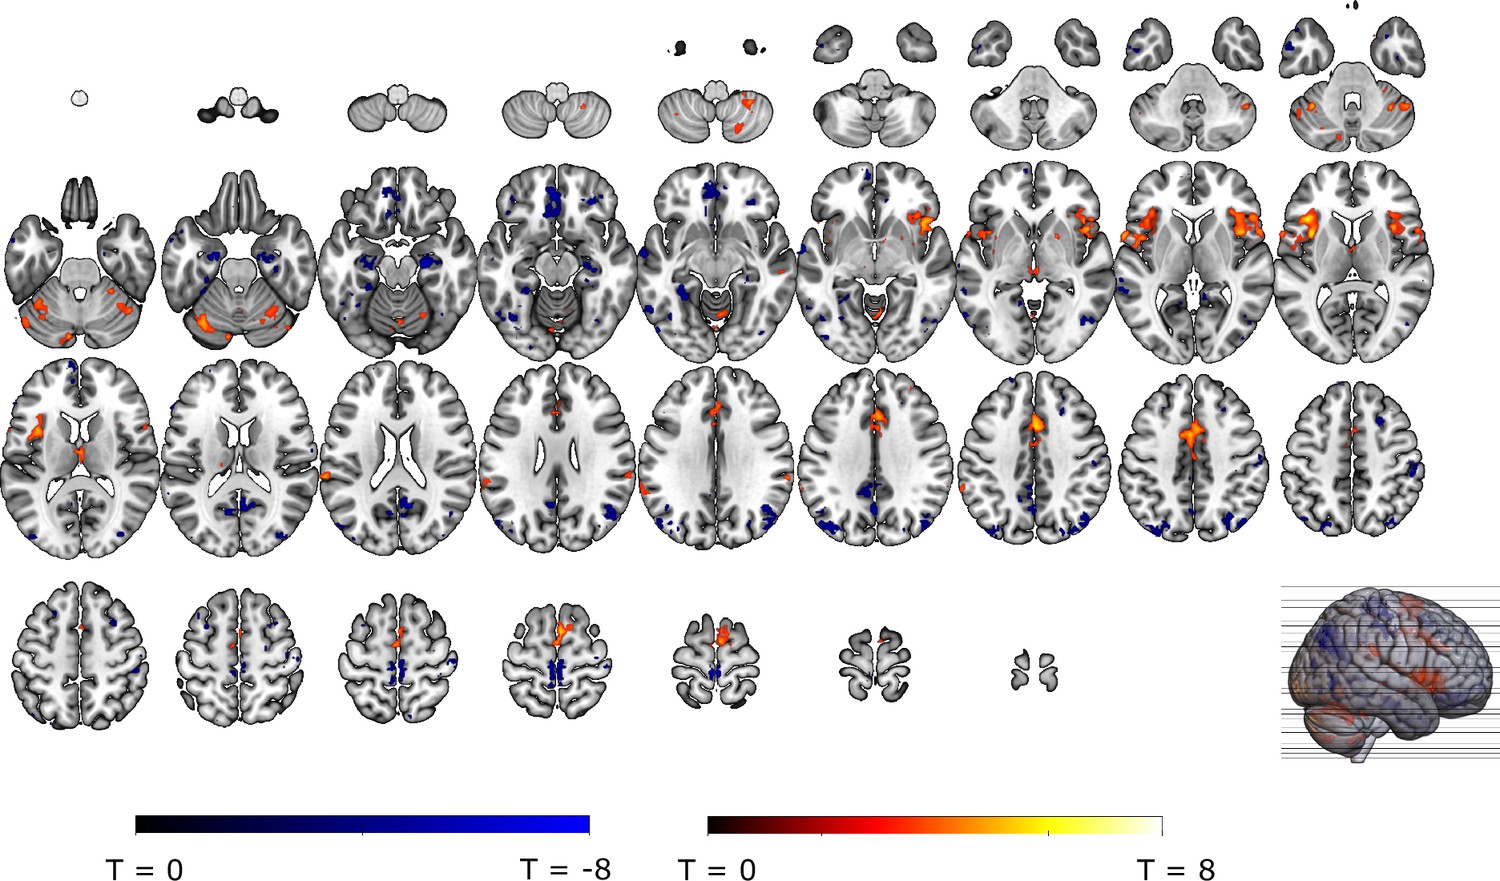
Whole-brain (grey-matter masked) SCR modulation of omission-related fMRI responses identified via the SCR modulation contrast, thresholded at p < 0.001 (uncorrected) for display purposes.
Appendix 6—figure 2
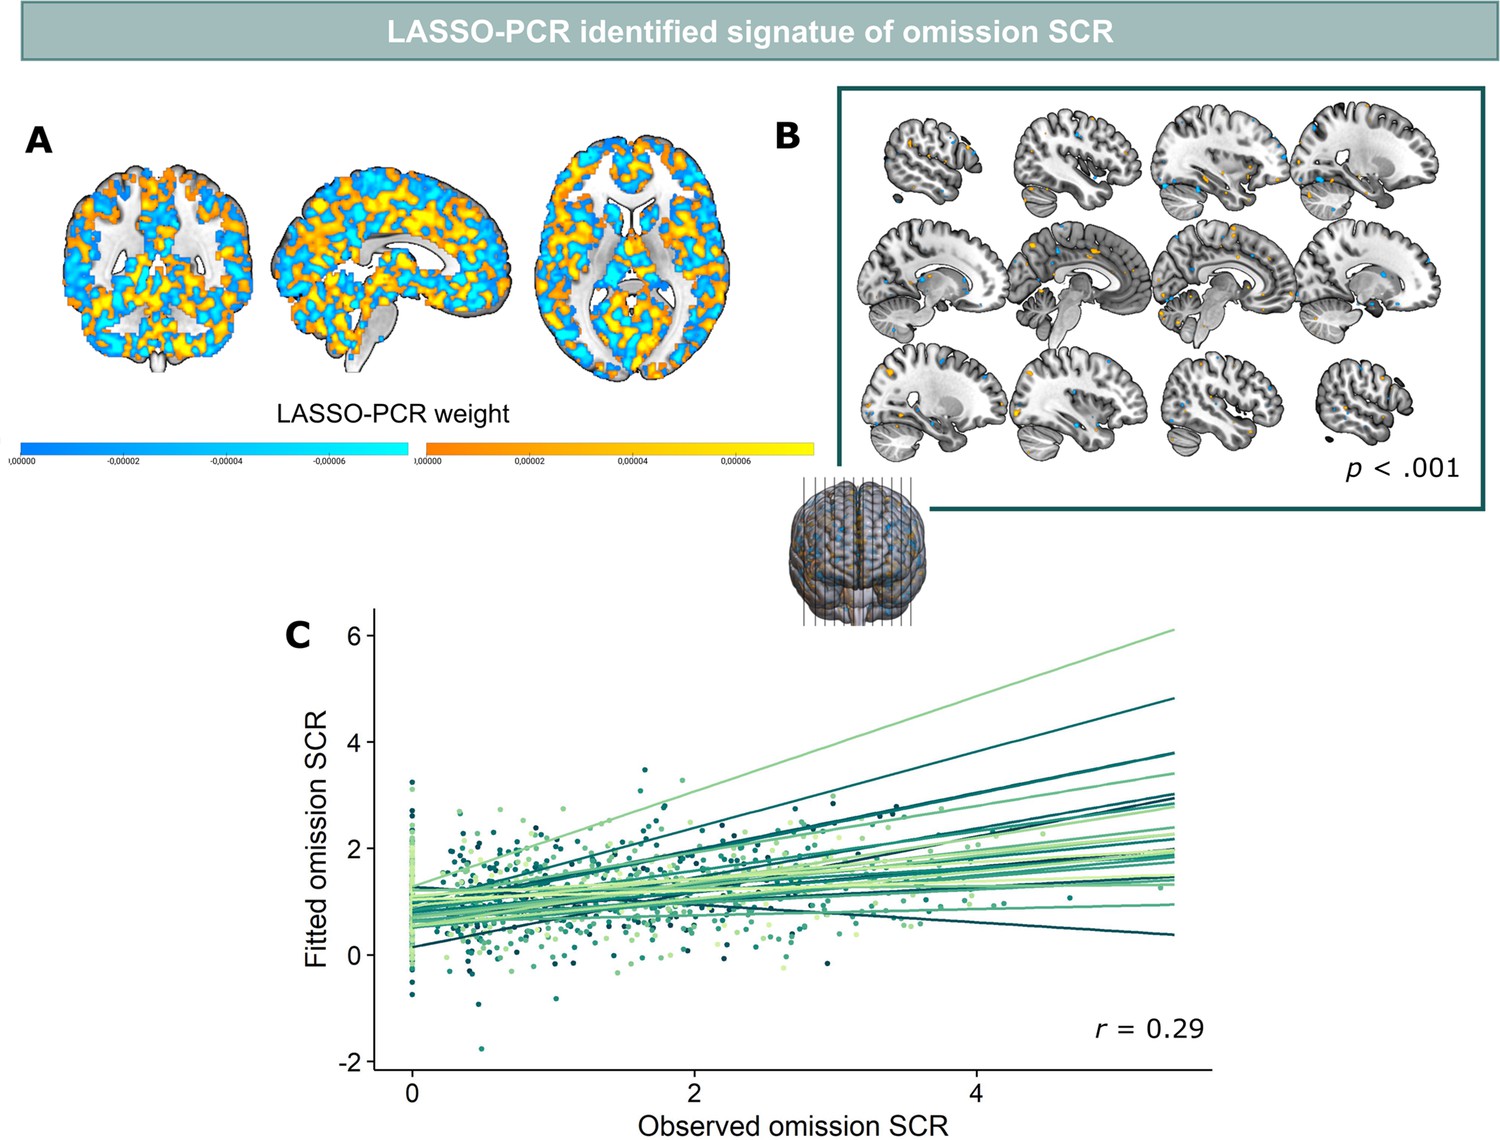
The signature of omission SCR.
A. Signature weights. Positive weights are presented in orange-yellow; negative weights are presented in blue. B. Regions that contributed most to the signature response based on bootstrap tests (5000 samples). Clusters represent voxels with a bootstrapped p-value of <0.001 (uncorrected). C. Model predicted and observed SCR responses correlated significantly (r = 0.29).
Tables
Table 1
Main clusters contributing to the relief signature identified via bootstrapping.
| Positive weight clusters | |||||||
|---|---|---|---|---|---|---|---|
| L/R | Region | K | MNI Coordinates (xyz) | Z (peak) | |||
| R | Cerebellum Crus 2 | 17 | 6 | –85 | –30 | 0.006 | |
| L | Cerebellum Crus 1 | 18 | –41 | –75 | –28 | 0.005 | |
| L | Inferior orbitofrontal gyrus | 10 | –21 | 14 | –23 | 0.005 | |
| R | Inferior temporal gyrus | 10 | 56 | –23 | –15 | 0.006 | |
| L | Middle orbitofrontal gyrus | 15 | –25 | 54 | –15 | 0.007 | |
| R | Middle orbitofrontal gyrus | 13 | 38 | 58 | –10 | 0.007 | |
| R | Caudate gyrus | 12 | 4 | 14 | -1 | 0.007 | |
| L | Superior temporal gyrus | 11 | –55 | 2 | 1 | 0.005 | |
| R | Rolandic operculum | 19 | 58 | 10 | 3 | 0.006 | |
| R | Superior occipital gyrus | 13 | 20 | –103 | 7 | 0.006 | |
| L | Middle occipital gyrus | 14 | –23 | –97 | 7 | 0.006 | |
| R | Calcarine gyrus | 18 | 12 | –79 | 10 | 0.007 | |
| L | Middle occipital gyrus | 12 | –31 | –95 | 14 | 0.005 | |
| R | Middle temporal gyrus | 19 | 54 | –47 | 14 | 0.005 | |
| R | Cuneus | 12 | 4 | –79 | 25 | 0.006 | |
| R | Supramarginal gyrus | 12 | 52 | –37 | 29 | 0.005 | |
| L | Superior occipital gyrus | 17 | –25 | –71 | 38 | 0.004 | |
| R | Precentral gyrus | 15 | 50 | 6 | 43 | 0.005 | |
| L | Superior occipital gyrus | 14 | –13 | –79 | 43 | 0.004 | |
| L | Mid cingulate gyrus | 27 | -9 | –23 | 45 | 0.005 | |
| R | Mid cingulate gyrus | 12 | 2 | –13 | 45 | 0.005 | |
| Negative weight clusters | |||||||
| R | Cerebellum Crus 1 | 12 | 30 | –69 | –28 | –0.005 | |
| L | Cerebellum Crus 1 | 11 | –17 | –89 | –19 | –0.007 | |
| R | Cerebellum Crus 1 | 41 | 30 | –85 | –19 | –0.014 | |
| R | Fusiform gyrus | 10 | 28 | –49 | -8 | –0.006 | |
| R | Superior temporal gyrus | 10 | 52 | -2 | -6 | –0.004 | |
| R | Inferior occipital gyrus | 11 | 28 | –89 | -4 | –0.006 | |
| R | Superior temporal gyrus | 10 | 66 | –17 | -4 | –0.006 | |
| L | Superior temporal gyrus | 16 | –63 | -5 | -1 | –0.005 | |
| L | Caudate | 10 | –17 | 18 | 1 | –0.006 | |
| L | Middle temporal gyrus | 14 | –57 | –65 | -1 | –0.004 | |
| R | Middle occipital gyrus | 12 | 34 | –93 | 5 | –0.005 | |
| L | Middle occipital gyrus | 11 | –39 | –89 | 3 | –0.004 | |
| R | Middle temporal gyrus | 40 | 58 | –57 | 10 | –0.005 | |
| L | Calcarine gyrus | 18 | –11 | –81 | 12 | –0.007 | |
| L | Cuneus | 20 | -3 | –89 | 21 | –0.006 | |
| L | Angular gyrus | 16 | –45 | –59 | 29 | –0.005 | |
| L | Middle frontal gyrus | 12 | –33 | 46 | 34 | –0.005 | |
| R | Postcentral gyrus | 64 | 46 | –31 | 49 | –0.005 | |
| R | Middle frontal gyrus | 19 | 26 | 32 | 45 | –0.004 | |
| L | Postcentral gyrus | 10 | –49 | –17 | 45 | –0.005 | |
| R | Middle frontal gyrus | 12 | 26 | 10 | 47 | –0.004 | |
-
Note. Contributing clusters are defined based on voxels-wise FDR-correction with q<0.05, k>10; L/R indicates if the cluster (or peak of the cluster) is part of the left or right hemisphere; Region name is identified using the AAL atlas; K is the number of voxels in the cluster; coordinates are the MNI coordinates of cluster peak; Z is the weight of the cluster peak.
Appendix 3—table 1
Whole-brain omission fMRI responses.
| Contrast: non0%>0% | |||||||
|---|---|---|---|---|---|---|---|
| L/R | Region | K | p (cluster) | MNI Coordinates (xyz) | T (peak) | ||
| L | Mid cingulate gyrus, extending to supplementary motor area and anterior cingulate gyrus | 1606 | <0.001 | -3 | 4 | 45 | 8.19 |
| R | Insula | 1287 | <0.001 | 44 | 12 | 1 | 8.05 |
| L | Insula | 1117 | <0.001 | –33 | 24 | 10 | 7.45 |
| L | Putamen | 65 | 0.006 | –25 | 6 | 1 | 6.83 |
| R | Cerebellum | 417 | <0.001 | 10 | –61 | –10 | 6.46 |
| R | Cerebellum | 37 | 0.093 | 38 | –63 | –26 | 5.70 |
| L | Supplementary motor area | 40 | 0.068 | –15 | 2 | 67 | 5.26 |
| L | Superior temporal gyrus | 148 | <0.001 | –59 | –33 | 21 | 5.26 |
| L | Inferior parietal gyrus | 170 | <0.001 | –43 | –53 | 54 | 5.03 |
| L | Cerebellum vermis | 55 | 0.016 | -3 | –75 | –15 | 4.84 |
| R | Inferior parietal gyrus | 37 | 0.093 | 50 | –47 | 54 | 4.74 |
| L | Supplementary motor area | 44 | 0.046 | -7 | -9 | 71 | 4.51 |
| Contrast: non0%<0% | |||||||
| L | Fusiform gyrus, extending to lingual gyrus, occipital gyrus and calcarine gyrus | 2408 | <0.001 | –31 | –59 | –15 | 8.86 |
| L | Posterior cingulate gyrus | 638 | <0.001 | -9 | –49 | 34 | 7.34 |
| L | vmPFC | 665 | <0.001 | -5 | 42 | –17 | 6.91 |
| R | Superior occipital gyrus, extending to calcarine gyrus | 1686 | <0.001 | 26 | –93 | 18 | 6.87 |
| L | Middle temporal gyrus | 176 | <0.001 | –63 | -9 | -8 | 6.73 |
| R | Fusiform gyrus | 294 | <0.001 | 32 | –37 | –15 | 6.73 |
| R | Precentral gyrus | 60 | 0.010 | 44 | –23 | 60 | 6.70 |
| R | Cerebellum | 87 | 0.001 | 16 | –87 | –41 | 6.33 |
| R | Middle temporal gyrus | 81 | 0.002 | 62 | -5 | –15 | 5.74 |
| R | Precuneus | 79 | 0.002 | 12 | –53 | 12 | 5.73 |
| L | Hippocampus | 64 | 0.007 | –25 | –11 | –23 | 5.17 |
| L | Posterior orbitofrontal gyrus | 37 | 0.093 | –43 | 28 | –15 | 5.12 |
| R | Middle frontal gyrus | 91 | 0.001 | 28 | 26 | 45 | 4.98 |
| L | Middle frontal gyrus | 230 | <0.001 | –27 | 22 | 54 | 4.93 |
| L | Middle temporal gyrus | 60 | 0.010 | –57 | –57 | -4 | 4.89 |
| L | Paracentral lobule | 46 | 0.037 | -5 | –31 | 67 | 4.68 |
| R | Paracentral lobule | 39 | 0.076 | 6 | –37 | 62 | 4.59 |
-
Note. Regions are identified at voxel-level p<0.001, and with cluster correction p<0.05 (FWE-corrected); L/R indicates if the cluster (or peak of the cluster) is part of the left or right hemisphere; Region name is identified using the AAL atlas; K is the number of voxels in the cluster; Coordinates are the MNI coordinates of cluster peak; T is the value of the T-statistic of the cluster peak.
Appendix 3—table 2
Whole-brain relief modulation.
| Contrast: Positive modulation | |||||||
|---|---|---|---|---|---|---|---|
| L/R | Region | K | p (cluster) | MNI Coordinates (xyz) | T (peak) | ||
| R | Insula | 1212 | <0.001 | 42 | 16 | -4 | 8.91 |
| L | Insula | 1027 | <0.001 | –35 | 12 | 5 | 8.31 |
| R | Mid cingulate gyrus, extending to supplementary motor area and anterior cingulate gyrus | 1739 | <0.001 | 2 | 10 | 43 | 6.80 |
| R | Cerebellum | 191 | <0.001 | 38 | –51 | –30 | 6.74 |
| R | Superior temporal gyrus, extending to supramarginal gyrus | 174 | <0.001 | 66 | –39 | 23 | 6.71 |
| R | Cerebellum | 114 | <0.001 | 8 | –71 | –12 | 6.60 |
| L | Supramarginal gyrus | 155 | <0.001 | –63 | –47 | 29 | 5.84 |
| L | Cerebellum | 99 | <0.001 | –37 | –51 | –32 | 5.22 |
| R | Medial frontal gyrus | 44 | 0.042 | 6 | 34 | 38 | 5.00 |
| Contrast: Negative modulation | |||||||
| L | vmPFC | 381 | <0.001 | -7 | 32 | –17 | 9.12 |
| R | Angular gyrus, extending to occipital gyri | 523 | <0.001 | 48 | –73 | 32 | 7.59 |
| L | Angular gyrus, extending to occipital gyri | 535 | <0.001 | –45 | –73 | 36 | 6.62 |
| L | Fusiform gyrus | 40 | 0.063 | –27 | –39 | –19 | 5.98 |
| R | Middle frontal gyrus | 107 | <0.001 | 26 | 28 | 45 | 5.70 |
| R | Lingual gyrus | 167 | <0.001 | 14 | –79 | –12 | 5.68 |
| R | Superior occipital gyrus | 39 | 0.070 | 16 | –91 | 18 | 5.40 |
| L | Precuneus | 534 | <0.001 | -1 | –63 | 45 | 5.33 |
| L | Lingual gyrus | 191 | <0.001 | –29 | –81 | –17 | 5.22 |
| L | Middle frontal gyrus | 194 | <0.001 | –29 | 20 | 47 | 5.19 |
| L | Postcentral gyrus | 69 | 0.004 | –63 | -5 | 32 | 4.78 |
| L | Lingual gyrus | 48 | 0.028 | –27 | –53 | -6 | 4.46 |
-
Note. Regions are identified at voxel-level p<0.001, and with cluster correction p<0.05 (FWE-corrected); L/R indicates if the cluster (or peak of the cluster) is part of the left or right hemisphere; Region name is identified using the AAL atlas; K is the number of voxels in the cluster; Coordinates are the MNI coordinates of cluster peak; T is the value of the T-statistic of the cluster peak.
Appendix 4—table 1
Whole-brain anticipatory fMRI responses to the presentation of the instructions.
| Contrast: non0%>0% | |||||||
|---|---|---|---|---|---|---|---|
| L/R | Region | K | p (cluster) | MNI Coordinates (xyz) | T (peak) | ||
| R | Cerebellum, vermis | 149 | <0.001 | 4 | –63 | -8 | 8.80 |
| L | Superior temporal gyrus | 362 | <0.001 | –59 | –33 | 21 | 8.13 |
| L | Mid cingulate gyrus | 2058 | <0.001 | -5 | -1 | 45 | 7.95 |
| L | Rolandic operculum | 919 | <0.001 | –59 | 4 | 5 | 7.49 |
| L | Thalamus | 175 | <0.001 | –5 | –21 | 1 | 7.26 |
| R | Insula | 852 | <0.001 | 42 | 18 | -6 | 7.18 |
| L | Inferior frontal gyrus | 76 | 0.003 | –39 | 38 | 12 | 6.08 |
| R | Brain stem | 128 | <0.001 | 6 | –29 | -8 | 6.03 |
| L | Insula | 50 | 0.033 | –41 | –13 | -4 | 5.66 |
| R | Cerebellum | 220 | <0.001 | 30 | –45 | –30 | 5.56 |
| L | Precuneus | 72 | 0.005 | -7 | –49 | 51 | 5.36 |
| R | Supplementary motor area | 54 | 0.023 | 12 | -9 | 67 | 5.26 |
| L | Inferior parietal gyrus | 78 | 0.003 | –45 | –55 | 49 | 4.94 |
| Contrast: non0%<0% | |||||||
| L | Fusiform gyrus | 369 | <0.001 | –31 | –45 | -6 | 8.08 |
| L | Middle temporal gyrus | 678 | <0.001 | –59 | -9 | -8 | 7.80 |
| R | Angular gyrus | 329 | <0.001 | 50 | –71 | 36 | 7.30 |
| R | Fusiform gyrus | 286 | <0.001 | 32 | –45 | -6 | 7.24 |
| L | Fusiform gyrus | 545 | <0.001 | –23 | –85 | –17 | 6.78 |
| R | Middle temporal gyrus | 109 | <0.001 | 58 | -1 | –21 | 6.66 |
| L | Superior frontal gyrus | 43 | 0.063 | -9 | 48 | 45 | 6.14 |
| L | Angular gyrus | 398 | <0.001 | –41 | –75 | 43 | 5.81 |
| R | Middle frontal gyrus | 118 | <0.001 | 28 | 26 | 45 | 5.60 |
| L | Precuneus | 83 | 0.002 | -5 | –49 | 36 | 5.12 |
| L | Middle frontal gyrus | 154 | <0.001 | –23 | 26 | 45 | 5.10 |
| R | Cerebellum | 62 | 0.011 | 16 | –85 | –41 | 4.35 |
-
Note. Regions are identified at voxel-level p<0.001, and with cluster correction p<0.05 (FWE-corrected); L/R indicates if the cluster (or peak of the cluster) is part of the left or right hemisphere; Region name is identified using the AAL atlas; K is the number of voxels in the cluster; Coordinates are the MNI coordinates of cluster peak; T is the value of the T-statistic of the cluster peak.
Appendix 4—table 2
ity contrast in whole-brain anticipatory fWhole-brain anticipatory fMRI responses to increasing probability.
| Contrast: Increase with increasing probability | |||||||
|---|---|---|---|---|---|---|---|
| L/R | Region | K | p (cluster) | MNI Coordinates (xyz) | T (peak) | ||
| L | Mid cingulate gyrus | 1394 | <0.001 | -3 | 4 | 43 | 7.88 |
| L | Middle temporal gyrus | 63 | 0.004 | –57 | –65 | 7 | 6.74 |
| L | Precentral gyrus | 278 | <0.001 | –59 | 10 | 10 | 6.65 |
| L | Putamen | 125 | <0.001 | –23 | 4 | -4 | 6.30 |
| L | Postcentral gyrus | 98 | <0.001 | –33 | –43 | 62 | 6.07 |
| R | Cerebellum | 64 | 0.004 | 28 | –45 | –50 | 6.03 |
| L | Supramarginal gyrus | 201 | <0.001 | –65 | –33 | 27 | 6.02 |
| L | Middle frontal gyrus | 347 | <0.001 | –41 | 46 | 16 | 5.84 |
| R | Cerebellum | 39 | 0.050 | 52 | –55 | –34 | 5.83 |
| R | Insula | 71 | 0.002 | 40 | 20 | 5 | 5.81 |
| L | Precuneus | 266 | <0.001 | -9 | –55 | 54 | 5.77 |
| R | Cerebellum | 216 | <0.001 | 34 | –51 | –32 | 5.72 |
| R | Middle frontal gyrus | 62 | 0.004 | 32 | 42 | 27 | 5.43 |
| R | Supramarginal gyrus | 277 | <0.001 | 58 | –41 | 32 | 5.37 |
| L | Cerebellum | 122 | <0.001 | –45 | –53 | –37 | 5.17 |
| R | Insula | 37 | 0.063 | 40 | 6 | 5 | 5.06 |
| L | Precuneus | 95 | <0.001 | -7 | –77 | 45 | 5.06 |
| L | Cerebellum | 73 | 0.002 | –13 | –75 | –41 | 4.89 |
| L | Putamen | 35 | 0.079 | –25 | 6 | 7 | 4.65 |
| R | Cerebellum | 34 | 0.089 | 36 | –61 | –39 | 4.44 |
| Contrast: Decrease with increasing probability | |||||||
| No significant clusters of activation | |||||||
-
Note. Regions are identified at voxel-level p<0.001, and with cluster correction p<0.05 (FWE-corrected); L/R indicates if the cluster (or peak of the cluster) is part of the left or right hemisphere; Region name is identified using the AAL atlas; K is the number of voxels in the cluster; Coordinates are the MNI coordinates of cluster peak; T is the value of the T-statistic of the cluster peak.
Appendix 4—table 3
Intensity contrast in whole-brain anticipatory fMRI activations.
| Contrast: Strong >Weak | |||||||
|---|---|---|---|---|---|---|---|
| L/R | Region | K | p (cluster) | MNI Coordinates (xyz) | T (peak) | ||
| R | Supplementary motor area | 2942 | <0.001 | 6 | 6 | 67 | 9.92 |
| R | Insula | 1028 | <0.001 | 30 | 22 | -8 | 8.90 |
| R | Cerebellum | 1194 | <0.001 | 22 | –57 | –21 | 8.37 |
| L | Cerebellum | 478 | <0.001 | –35 | –57 | –26 | 7.71 |
| L | Superior temporal gyrus | 814 | <0.001 | –51 | 2 | 1 | 7.66 |
| R | Supramarginal gyrus | 674 | <0.001 | 64 | –45 | 32 | 6.91 |
| L | Cerebellum | 147 | <0.001 | 36 | –51 | –52 | 6.90 |
| L | Thalamus | 184 | <0.001 | 6 | –17 | 1 | 6.78 |
| L | Supramarginal gyrus | 568 | <0.001 | –59 | –25 | 29 | 6.48 |
| L | Postcentral gyrus | 111 | <0.001 | –35 | –19 | 45 | 6.47 |
| L | Postcentral gyrus | 100 | <0.001 | –31 | –43 | 62 | 6.21 |
| R | Precentral gyrus | 166 | <0.001 | 52 | -7 | 47 | 6.19 |
| L | Postcentral gyrus | 75 | 0.002 | –31 | –31 | 54 | 5.47 |
| R | Cerebellum | 40 | 0.064 | 16 | –67 | –48 | 5.45 |
| L | Insula | 47 | 0.031 | –35 | -9 | 1 | 5.05 |
| R | Amygdala | 63 | 0.007 | 22 | -1 | –12 | 5.04 |
| Contrast: Strong <Weak | |||||||
| R | Superior frontal gyrus | 170 | <0.001 | 24 | 36 | 47 | 6.09 |
| R | Angular gyrus | 115 | <0.001 | 40 | –73 | 45 | 5.24 |
| L | Inferior parietal gyrus | 72 | 0.003 | –33 | –71 | 43 | 4.80 |
| R | Middle frontal gyrus | 63 | 0.007 | 48 | 42 | 14 | 4.71 |
-
Note. Regions are identified at voxel-level p<0.001, and with cluster correction p<0.05 (FWE-corrected); L/R indicates if the cluster (or peak of the cluster) is part of the left or right hemisphere; Region name is identified using the AAL atlas; K is the number of voxels in the cluster; Coordinates are the MNI coordinates of cluster peak; T is the value of the T-statistic of the cluster peak.
Appendix 4—table 4
Whole-brain stimulation-induced activations.
| Contrast: Stimulation >baseline | |||||||
|---|---|---|---|---|---|---|---|
| L/R | Region | K | p (cluster) | MNI Coordinates (xyz) | T (peak) | ||
| L | Insula | 5078 | <0.001 | –39 | -1 | 16 | 15.62 |
| R | Insula | 3774 | <0.001 | 44 | 10 | -4 | 11.71 |
| R | Cerebellum | 2577 | <0.001 | 14 | –55 | –17 | 11.32 |
| L | Cerebellum | 684 | <0.001 | –35 | –63 | –26 | 9.92 |
| L | Mid cingulate gyrus | 2048 | <0.001 | -3 | 8 | 43 | 9.44 |
| L | Middle frontal gyrus | 271 | <0.001 | –41 | 42 | 23 | 7.12 |
| R | Middle temporal gyrus | 119 | <0.001 | 54 | –31 | 1 | 5.11 |
| L | Cerebellum | 78 | 0.007 | –17 | –77 | –37 | 4.85 |
| Contrast: Stimulation <baseline | |||||||
| R | Occipital gyri, extending to fusiform, lingual gyri | 4348 | <0.001 | 32 | –91 | –10 | 14.53 |
| L | Occipital gyri, extending to fusiform, lingual gyri | 4411 | <0.001 | –35 | –91 | –15 | 13.70 |
| L | vmPFC | 1883 | <0.001 | -5 | 42 | –15 | 11.66 |
| R | Precentral gyrus | 271 | <0.001 | 40 | –21 | 51 | 10.21 |
| R | Postcentral gyrus | 85 | 0.004 | 36 | –31 | 56 | 8.25 |
| R | Middle temporal gyrus | 188 | <0.001 | 60 | -3 | –19 | 7.95 |
| L | Middle temporal gyrus | 582 | <0.001 | –61 | –13 | –15 | 6.69 |
| R | Superior frontal gyrus | 136 | <0.001 | 26 | 32 | 49 | 6.22 |
| L | Precentral gyrus | 143 | <0.001 | –57 | -3 | 29 | 6.20 |
| L | Posterior cingulate gyrus | 887 | <0.001 | -3 | –55 | 29 | 6.11 |
| L | Superior frontal gyrus | 136 | <0.001 | –27 | 26 | 56 | 5.94 |
| R | Cerebellum | 46 | 0.083 | 20 | –83 | –41 | 5.31 |
-
Note. Regions are identified at voxel-level p<0.001, and with cluster correction p<0.05 (FWE-corrected); L/R indicates if the cluster (or peak of the cluster) is part of the left or right hemisphere; Region name is identified using the AAL atlas; K is the number of voxels in the cluster; Coordinates are the MNI coordinates of cluster peak; T is the value of the T-statistic of the cluster peak.
Appendix 4—table 5
Whole-brain unexpected stimulation-induced activations.
| Contrast: non100%>100% stimulations | |||||||
|---|---|---|---|---|---|---|---|
| L/R | Region | K | p (cluster) | MNI Coordinates (xyz) | T (peak) | ||
| R | Middle temporal gyrus | 121 | <0.001 | 54 | –21 | -6 | 6.52 |
| R | Rolandic operculum | 50 | 0.014 | 42 | –11 | 18 | 5.57 |
| R | Frontal superior gyrus | 44 | 0.027 | 24 | 20 | 47 | 5.17 |
| L | Middle temporal gyrus | 42 | 0.034 | –59 | –25 | -4 | 5.10 |
| L | Precentral gyrus | 72 | 0.002 | –57 | -7 | 32 | 4.75 |
| R | Middle temporal gyrus | 36 | 0.067 | 50 | –55 | 21 | 4.67 |
| R | Medial superior frontal gyrus | 34 | 0.085 | 8 | 54 | 23 | 4.49 |
| R | Mid cingulate gyrus | 34 | 0.085 | 4 | –47 | 34 | 4.32 |
| L | Middle temporal gyrus | 33 | 0.096 | –53 | –55 | 23 | 4.32 |
| Contrast: non100%<100% stimulations | |||||||
| No significant clusters of activation | |||||||
-
Note. Regions are identified at voxel-level p<0.001, and with cluster correction p<0.05 (FWE-corrected); L/R indicates if the cluster (or peak of the cluster) is part of the left or right hemisphere; Region name is identified using the AAL atlas; K is the number of voxels in the cluster; Coordinates are the MNI coordinates of cluster peak; T is the value of the T-statistic of the cluster peak.
Appendix 5—table 1
F-statistics and corresponding p-values from the overall lag model.
| Relief | SCR | VTA/SN (*) | Left vPut | NAC | vmPFC | |||||||
|---|---|---|---|---|---|---|---|---|---|---|---|---|
| Regressor | F | P | F | P | F | P | F | P | F | P | F | P |
| Probability | 30.04 | <0.001 | 4.90 | <0.01 | 3.59 | <0.05 | 0.18 | n.s. | 0.88 | n.s. | 1.73 | n.s. |
| Intensity | 620.62 | <0.001 | 106.65 | <0.001 | 7.81 | <0.001 | 3.88 | <0.05 | 0.70 | n.s. | 4.90 | <0.01 |
| Run | 9.71 | <0.001 | 15.56 | <0.001 | 1.13 | n.s. | 0.76 | n.s. | 0.62 | n.s. | 0.44 | n.s. |
| Probability x Intensity | 3.69 | <0.01 | 1.54 | n.s. | 1.15 | n.s. | 1.39 | n.s. | 1.76 | n.s. | 0.70 | n.s. |
| Probability x Run | 1.13 | n.s. | 1.24 | n.s. | 1.02 | n.s. | 1.22 | n.s. | 1.74 | n.s. | 1.26 | n.s. |
| Intensity x Run | 1.94 | 0.07 | 1.30 | n.s. | 1.94 | 0.07 | 1.59 | n.s. | 1.01 | n.s. | 2.41 | <0.05 |
| Probability x Intensity x Run | 0.56 | n.s. | 0.87 | n.s. | 0.76 | n.s. | 0.71 | n.s. | 0.76 | n.s. | 0.83 | n.s. |
| Overall-lag | 2.56 | n.s. | 4.68 | <0.05 | 11.30 | <0.001 | <0.01 | n.s. | 0.16 | n.s. | <0.01 | n.s. |
| US-unpleasantness | 29.60 | <0.001 | 3.00 | 0.096 | 1.84 | n.s. | 0.06 | n.s. | 3.44 | 0.07 | 0.26 | n.s. |
-
*
(*) F-test and p-values were based on the model where outliers were rescored to 2SD from the mean. Note that when retaining the influential outliers for this model, the p-value of the probability effect was p=0.06. For all other outcome variables, rescoring the outliers did not change the results. Significant effects are indicated in bold.
Appendix 5—table 2
F-statistics and corresponding p-values from the lag per probability level model.
| Relief | SCR | VTA/SN (*) | Left vPut | NAC | vmPFC | |||||||
|---|---|---|---|---|---|---|---|---|---|---|---|---|
| Regressor | F | P | F | P | F | P | F | P | F | P | F | P |
| Probability | 23.07 | <0.001 | 4.44 | <0.05 | 3.28 | <0.05 | 0.22 | n.s. | 0.18 | n.s. | 0.31 | n.s. |
| Intensity | 625.52 | <0.001 | 107.49 | <0.001 | 7.33 | <0.001 | 3.88 | <0.05 | 0.66 | n.s. | 4.85 | <0.01 |
| Run | 8.63 | <0.001 | 13.91 | <0.001 | 1.09 | n.s. | 0.72 | n.s. | 0.60 | n.s. | 1.09 | n.s. |
| Probability x Intensity | 3.87 | <0.01 | 1.33 | n.s. | 1.01 | n.s. | 1.40 | n.s. | 1.81 | n.s. | 0.63 | n.s. |
| Probability x Run | 1.63 | n.s. | 1.10 | n.s. | 1.25 | n.s. | 1.16 | n.s. | 1.60 | n.s. | 1.17 | n.s. |
| Intensity x Run | 2.08 | 0.053 | 1.25 | n.s. | 1.84 | 0.09 | 1.61 | n.s. | 1.02 | n.s. | 2.55 | <0.05 |
| Probability x Intensity x Run | 0.55 | n.s. | 0.90 | n.s. | 0.72 | n.s. | 0.71 | n.s. | 0.73 | n.s. | 0.84 | n.s. |
| Lag per probability: Probability | 1.51 | n.s. | 1.32 | n.s. | 1.12 | n.s. | 0.10 | n.s. | 0.96 | n.s. | 4.14 | <0.01 |
| US-unpleasantness | 29.69 | <0.001 | 2.99 | 0.097 | 1.63 | n.s. | 0.06 | n.s. | 3.34 | 0.08 | 0.27 | n.s. |
-
*
(*) F-test and p-values were based on the model where outliers were rescored to 2SD from the mean. Note that when retaining the influential outliers for this model, the p-value of the Intensity x Run interaction was p=0.05. For all other outcome variables, rescoring the outliers did not change the results. Significant effects are indicated in bold.
Appendix 6—table 1
Whole-brain SCR modulation.
| Contrast: Positive modulation | ||||||||
|---|---|---|---|---|---|---|---|---|
| L/R | Region | K | p (cluster) | MNI Coordinates (xyz) | T (peak) | |||
| L | Insula | 426 | <0.001 | –35 | 8 | 10 | 6.86 | |
| R | Mid cingulate gyrus | 410 | <0.001 | 2 | 12 | 38 | 6.03 | |
| L | Superior temporal gyrus | 87 | 0.001 | –63 | –33 | 21 | 6.03 | |
| R | Supplementary motor gyrus | 235 | <0.001 | 4 | 4 | 65 | 6.01 | |
| R | Insula | 554 | <0.001 | 46 | 20 | -4 | 5.91 | |
| L | Cerebellum | 163 | <0.001 | –35 | –53 | –30 | 5.76 | |
| L | Thalamus | 45 | 0.029 | -1 | –11 | 12 | 5.70 | |
| R | Cerebellum | 50 | 0.017 | 30 | –49 | –50 | 5.59 | |
| R | Cerebellum | 156 | <0.001 | 24 | –63 | –19 | 5.56 | |
| R | Cerebellum, vermis | 45 | 0.029 | 6 | –61 | -6 | 5.16 | |
| R | Supramarginal gyrus | 35 | 0.087 | 64 | –33 | 29 | 5.07 | |
| L | Cerebellum | 42 | 0.040 | -9 | –81 | –26 | 5.01 | |
| L | Cerebellum | 47 | 0.023 | –45 | –71 | –26 | 4.90 | |
| Contrast: Negative modulation | ||||||||
| L | Hippocampus | 110 | <0.001 | –23 | –11 | –23 | 7.02 | |
| R | Hippocampus | 153 | <0.001 | 26 | –17 | –19 | 7.00 | |
| L | Paracentral lobule | 123 | <0.001 | -3 | –31 | 69 | 6.65 | |
| R | Paracentral lobule | 128 | <0.001 | 4 | –31 | 67 | 6.49 | |
| L | vmPFC | 317 | <0.001 | -3 | 42 | –15 | 6.38 | |
| R | Angular gyrus | 332 | <0.001 | 44 | –59 | 29 | 6.31 | |
| L | Precuneus | 64 | 0.004 | -1 | –61 | 36 | 5.96 | |
| L | Precuneus | 37 | 0.070 | -9 | –63 | 16 | 5.74 | |
| R | Middle frontal gyrus | 50 | 0.017 | 30 | 36 | –12 | 5.67 | |
| R | Posterior cingulate gyrus | 102 | <0.001 | 10 | –57 | 21 | 5.61 | |
| L | Fusiform gyrus | 146 | <0.001 | –29 | –41 | –21 | 5.56 | |
| R | Precentral gyrus | 109 | <0.001 | 46 | –21 | 60 | 5.54 | |
| L | Middle occipital gyrus | 274 | <0.001 | –37 | –75 | 34 | 5.36 | |
| R | Inferior temporal gyrus | 71 | 0.002 | 42 | –67 | -4 | 5.17 | |
| L | Superior temporal gyrus | 52 | 0.014 | –63 | -5 | -6 | 5.11 | |
| L | Middle temporal gyrus | 40 | 0.050 | –59 | –63 | -1 | 5.02 | |
| L | Middle temporal gyrus | 39 | 0.056 | –61 | –41 | 3 | 4.91 | |
| L | Middle cingulate gyrus | 89 | <0.001 | -5 | –41 | 36 | 4.88 | |
| R | Middle frontal gyrus | 58 | 0.008 | 26 | 18 | 47 | 4.79 | |
| L | Inferior temporal gyrus | 56 | 0.009 | –47 | 2 | –41 | 4.54 | |
-
Note. Regions are identified at voxel-level p<0.001, and with cluster correction p<.05 (FWE-corrected); L/R indicates if the cluster (or peak of the cluster) is part of the left or right hemisphere; Region name is identified using the AAL atlas; K is the number of voxels in the cluster; Coordinates are the MNI coordinates of cluster peak; T is the value of the T-statistic of the cluster peak.
Appendix 6—table 2
Main omission SCR signature clusters identified via bootstrapping.
| Positive weight clusters | |||||||
|---|---|---|---|---|---|---|---|
| L/R | Region | K | MNI Coordinates (xyz) | Z (peak) | |||
| R | Cerebellum Crus 2 | 11 | 8 | –87 | –30 | 0.00019 | |
| L | Cerebellum Crus 2 | 12 | –19 | –87 | –28 | 0.00016 | |
| L | Cerebellum Crus 1 | 16 | –41 | –71 | –26 | 0.00015 | |
| R | Calcarine gyrus | 12 | 2 | –91 | –12 | 0.00023 | |
| R | Fusiform gyrus | 10 | 30 | –57 | -8 | 0.00020 | |
| R | Inferior occipital gyrus | 15 | 36 | –89 | -6 | 0.00023 | |
| L | Anterior cingulate cortex | 12 | -1 | 26 | 18 | 0.00026 | |
| L | Supramarginal gyrus | 21 | –55 | –45 | 27 | 0.00020 | |
| L | Cuneus | 12 | -9 | –81 | 29 | 0.00018 | |
| R | Superior occipital gyrus | 70 | 30 | –71 | 43 | 0.00018 | |
| L | Postcentral gyrus | 12 | –61 | –19 | 36 | 0.00013 | |
| L | Precuneus | 21 | -3 | –71 | 51 | 0.00023 | |
| Negative weight clusters | |||||||
| L | Cerebellum | 18 | –33 | –45 | –26 | –0.00025 | |
| L | Cerebellum Crus 1 | 11 | –35 | –83 | –21 | –0.00031 | |
| R | Lingual gyrus | 12 | 30 | –85 | –17 | –0.00026 | |
| L | Fusiform gyrus | 33 | –23 | –69 | –15 | –0.00025 | |
| R | Superior frontal gyrus | 16 | 40 | 42 | –15 | –0.00020 | |
| L | Lingual gyrus | 15 | –39 | –85 | –12 | –0.00014 | |
| R | Inferior occipital gyrus | 29 | 42 | –79 | –12 | –0.00014 | |
| R | Inferior temporal gyrus | 10 | 60 | –41 | –12 | –0.00015 | |
| R | Inferior occipital gyrus | 13 | 30 | –89 | -6 | –0.00015 | |
| R | Middle temporal gyrus | 11 | 52 | –55 | 1 | –0.00017 | |
| L | Middle occipital gyrus | 24 | –39 | –87 | 5 | –0.00016 | |
| R | Middle occipital gyrus | 17 | 40 | –85 | 5 | –0.00019 | |
| R | Middle frontal gyrus | 17 | 42 | 42 | 7 | –0.00014 | |
| L | Middle occipital gyrus | 17 | –51 | –73 | 7 | –0.00020 | |
| L | Caudate | 11 | –17 | 20 | 7 | –0.00019 | |
| L | Thalamus | 16 | –13 | –31 | 10 | –0.00026 | |
| R | Calcarine gyrus | 10 | 4 | –75 | 12 | –0.00019 | |
| R | Caudate | 14 | 14 | 6 | 16 | –0.00016 | |
| R | Postcentral gyrus | 10 | 62 | -3 | 21 | –0.00017 | |
| R | Frontal middle gyrus | 17 | 44 | 40 | 23 | –0.00015 | |
| R | Superior frontal gyrus | 11 | 20 | 62 | 23 | –0.00015 | |
| L | Precentral gyrus | 11 | –55 | 6 | 29 | –0.00013 | |
| R | Precuneus | 10 | 2 | –77 | 45 | –0.00019 | |
| L | Postcentral gyrus | 11 | –51 | –15 | 54 | –0.00016 | |
| R | Precuneus | 11 | 10 | –69 | 60 | –0.00021 | |
| R | Supplementary motor area | 15 | 4 | –25 | 60 | –0.00015 | |
-
Note. Clusters (FDR-corrected, k>10, following bootstrapping). L/R indicates if the cluster (or peak of the cluster) is part of the left or right hemisphere; Region name is identified using the AAL atlas. K is the number of voxels in the cluster; coordinates are the MNI coordinates of cluster peak, Z is the signature weight of the cluster peak.
Author response table 1
| Omission responses | ||||||||||||
|---|---|---|---|---|---|---|---|---|---|---|---|---|
| Regressor | Relief | SCR | VTA/SN (*) | Left vPut | NAC | vmPFC | ||||||
| F | P | P | F | P | ||||||||
| Probability | 30.04 | <.001 | 4.9 | <.01 | 3.59 | <.05 | 0.18 | n.s. | 0.88 | n.s. | 1.73 | n.s. |
| Intensity | 620.62 | <.001 | 106.65 | <.001 | 7.81 | <.001 | 3.88 | <.05 | 0.7 | n.s. | 4.9 | <.01 |
| Run | 9.71 | <.001 | 15.56 | <.001 | 1.13 | n.s. | 0.76 | n.s. | 0.62 | n.s. | 0.44 | n.s. |
| Probability x Intensity | 3.69 | <.01 | 1.54 | n.s. | 1.15 | n.s. | 1.39 | n.s. | 1.76 | n.s. | 0.7 | n.s. |
| Probability x Run | 1.13 | n.s. | 1.24 | n.s. | 1.02 | n.s. | 1.22 | n.s. | 1.74 | n.s. | 1.26 | n.s. |
| Intensity x Run | 1.94 | 0.07 | 1.3 | n.s. | 1.94 | 0.07 | 1.59 | n.s. | 1.01 | n.s. | 2.41 | <.05 |
| Probability x Intensity x Run | 0.56 | n.s. | 0.87 | n.s. | 0.76 | n.s. | 0.71 | n.s. | 0.76 | n.s. | 0.83 | n.s. |
| Overall-lag | 2.56 | n.s. | 4.68 | <.05 | 11.3 | <.001 | <0.01 | n.s. | 0.16 | n.s. | <0.01 | n.s. |
| US-unpleasantness | 29.6 | <.001 | 3 | 0.096 | 1.84 | n.s. | 0.06 | n.s. | 3.44 | 0.07 | 0.26 | n.s. |
Author response table 2
| Omission responses | ||||||||||||
|---|---|---|---|---|---|---|---|---|---|---|---|---|
| Regressor | Relief | SCR | VTA/SN (*) | Left vPut | NAC | vmPFC | ||||||
| FF | P | F | P | F | P | F | P | F | P | F | P | |
| Probability | 23.07 | <.001 | 4.44 | <.05 | 3.28 | <.05 | 0.22 | n.s. | 0.18 | n.s. | 0.31 | n.s. |
| Intensity | 625.52 | <.001 | 107.49 | <0.01 | 7.33 | <0.01 | 3.88 | <.05 | 0.66 | n.s. | 4.85 | <.01 |
| Run | 8.63 | <.001 | 13.91 | <0.01 | 1.09 | n.s. | 0.72 | n.s. | 0.60 | n.s. | 1.09 | n.s. |
| Probability x Intensity | 3.87 | <.01 | 1.33 | n.s. | 1.01 | n.s. | 1.40 | n.s. | 1.81 | n.s. | 0.63 | n.s. |
| Probability x Run | 1.63 | n.s. | 1.10 | n.s. | 1.25 | n.s. | 1.16 | n.s. | 1.60 | n.s. | 1.17 | n.s. |
| Intensity x Run | 2.08 | .053 | 1.25 | n.s. | 1.84 | .09 | 1.61 | n.s. | 1.02 | n.s. | 2.55 | <.05 |
| Probability x Intensity x Run | 0.55 | n.s. | 0.90 | n.s. | 0.72 | n.s. | 0.71 | n.s. | 0.73 | n.s. | 0.84 | n.s. |
| Lag per probability: Probability | 1.51 | n.s. | 1.32 | n.s. | 1.12 | n.s. | 0.10 | n.s. | 0.96 | n.s. | 4.14 | <.01 |
| US- unpleasantness | 26.69 | <.001 | 2.99 | .097 | 1.63 | n.s. | 0.06 | n.s. | 3.34 | .08 | 0.27 | n.s. |
Additional files
-
MDAR checklist
- https://cdn.elifesciences.org/articles/91400/elife-91400-mdarchecklist1-v1.docx
-
Supplementary file 1
Demographics of included participants.
- https://cdn.elifesciences.org/articles/91400/elife-91400-supp1-v1.docx
-
Supplementary file 2
Descriptives of questionnaire scores.
- https://cdn.elifesciences.org/articles/91400/elife-91400-supp2-v1.docx
-
Supplementary file 3
Trial types and numbers.
- https://cdn.elifesciences.org/articles/91400/elife-91400-supp3-v1.docx
Download links
A two-part list of links to download the article, or parts of the article, in various formats.
Downloads (link to download the article as PDF)
Open citations (links to open the citations from this article in various online reference manager services)
Cite this article (links to download the citations from this article in formats compatible with various reference manager tools)
Omissions of threat trigger subjective relief and prediction error-like signaling in the human reward and salience systems
eLife 12:RP91400.
https://doi.org/10.7554/eLife.91400.4


