Noncanonical usage of stop codons in ciliates expands proteins with structurally flexible Q-rich motifs
- Institute of Molecular Biology, Academia Sinica, Taiwan
- Department of Biochemical Science and Technology, National Chiayi University, Taiwan
Figures
Figure 1
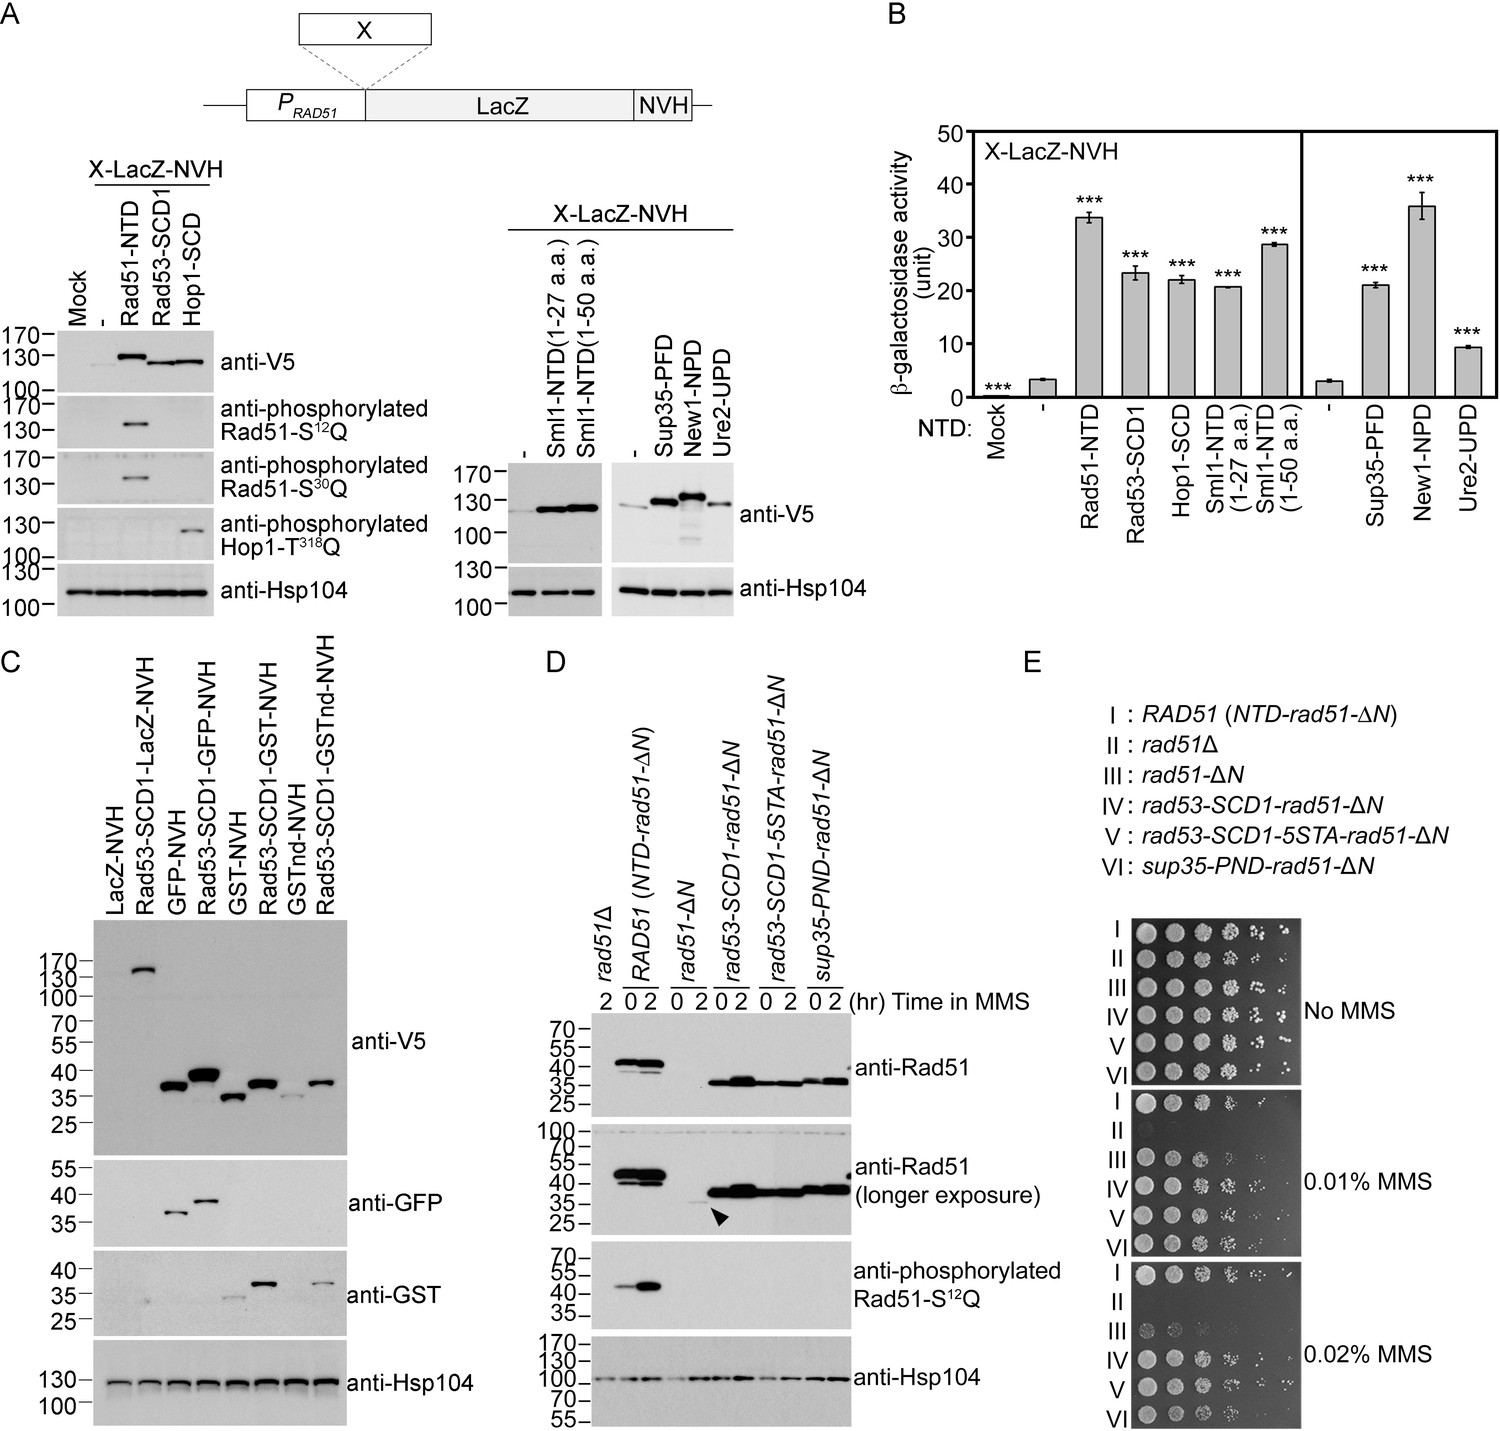
The Q-rich domains of seven different yeast proteins possess autonomous expression-enhancing (PEE) activities.
(A–B) N-terminal fusion of Rad51-NTD/SCD, Rad53-SCD1, Hop1-SCD, Sml1-NTD, Sup35-PND, Ure2-UPD and New1-NPD promotes high-level expression of LacZ-NVH, respectively. The NVH tag contains an SV40 nuclear localization signal (NLS) peptide preceding a V5 epitope tag and a hexahistidine (His6) affinity tag (Woo et al., 2020). Western blots for visualization of LacZ-NVH fusion proteins (A) and quantitative β-galactosidase assays (B) were carried out as described previously (Woo et al., 2020). Error bars indicate standard deviation between experiments (n≥3). Asterisks indicate significant differences relative to wild type (WT) in A or lacking an NTD in B, with p values calculated using a two-tailed t-test (***, p-value <0.001; **, p-value <0.01). (C–D) The PEE activities of S/T/Q/N-rich domains are independent of the quaternary structures of target proteins. (C) Rad53-SCD1 can be used as an N-terminal fusion tag to enhance production of four different target proteins: LacZ-NVH, GST-NVH, GSTnd-NVH, and GFP-NVH. (D) Visualization of native Rad51 (NTD-Rad51-ΔN), Rad51-ΔN, and the Rad51-ΔN fusion proteins by immunoblotting. Hsp104 was used as a loading control. Size in kilodaltons of standard protein markers is labeled to the left of the blots. The black arrowhead indicates the protein band of Rad51-ΔN. (E) MMS sensitivity. Spot assay showing fivefold serial dilutions of indicated strains grown on YPD plates with or without MMS at the indicated concentrations (w/v).
-
Figure 1—source data 1
Raw and labelled images for blots shown in Figure 1.
- https://cdn.elifesciences.org/articles/91405/elife-91405-fig1-data1-v1.zip
Figure 2
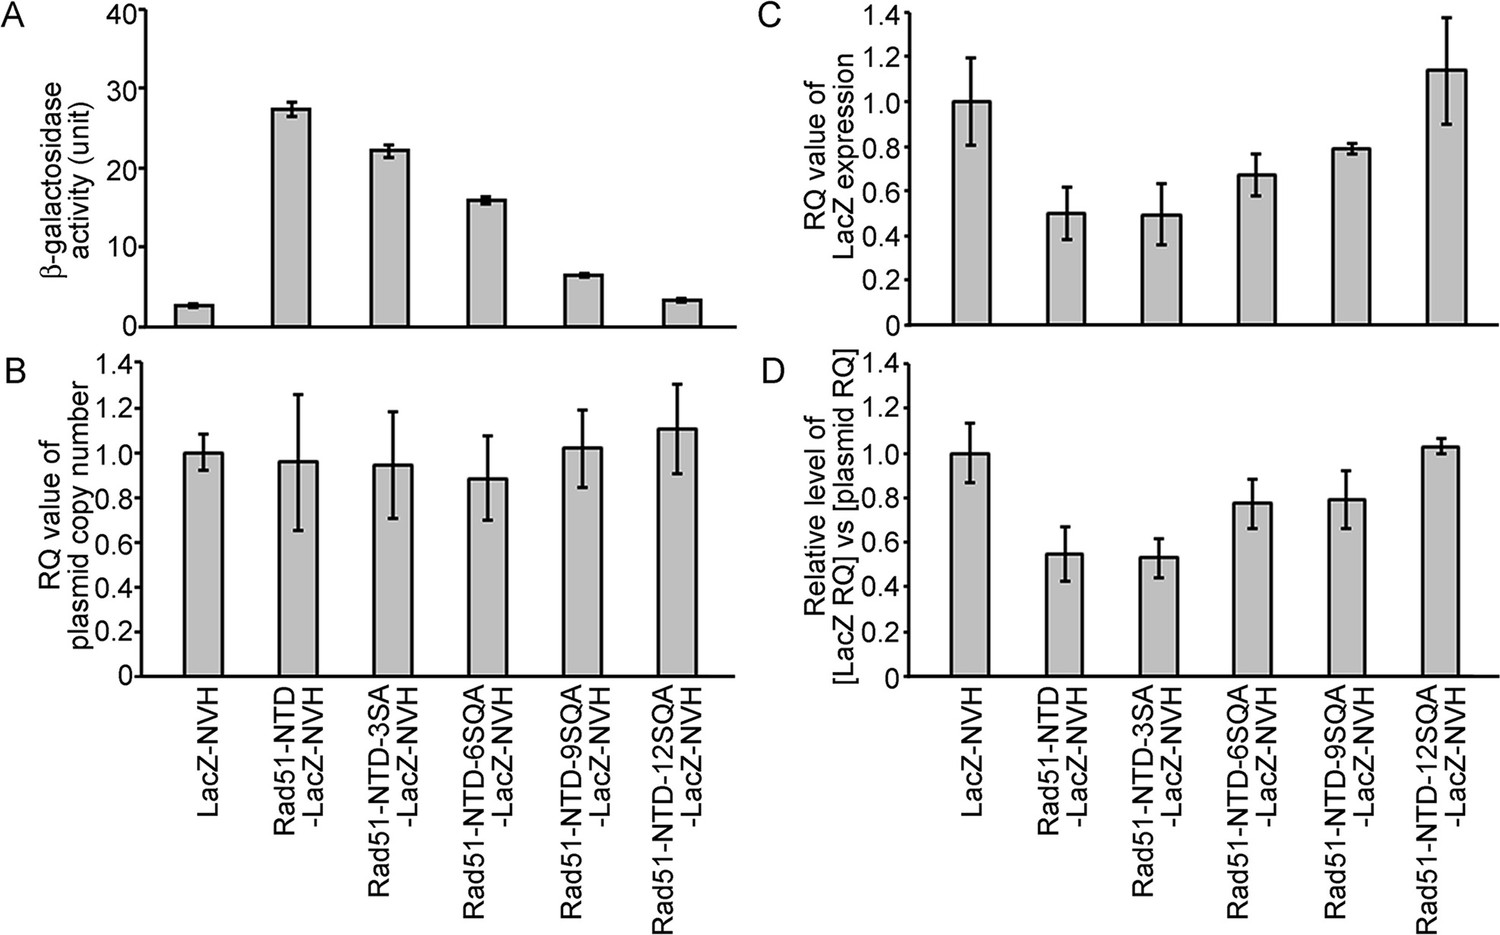
The autonomous protein-expression-enhancing function of Rad51-NTD is unlikely to be controlled during transcription or simply arise from plasmid copy number differences.
The effects of WT and mutant Rad51-NTD on β-galactosidase activities (A), plasmid DNA copy numbers (B), relative steady-state levels of LacZ-NVH mRNA normalized to ACT1 (actin) mRNA (C), and relative ratios of LacZ-NVH mRNA versus plasmid DNA copy number (D). The wild-type yeast cells were transformed with indicated CEN-ARS plasmids, respectively, to express WT and mutant Rad51-NTD-LacZ-NVH fusion proteins or LacZ-NVH alone under the control of the native RAD51 gene promoter (PRAD51). The relative quantification (RQ = 2-ΔΔϹT) values were determined to reveal the plasmid DNA copy number and steady-state levels of LacZ-NVH mRNA by g-qPCR and RT-qPCR, respectively. LacZ and ACT1 were selected as target and reference protein-encoding genes, respectively, in both g-qPCR and RT-qPCR. The data shown represent mean ± SD from three independent biological data-points.
-
Figure 2—source data 1
The raw qPCR data of cDNA and gDNA in Figure 2.
- https://cdn.elifesciences.org/articles/91405/elife-91405-fig2-data1-v1.xlsx
Figure 3
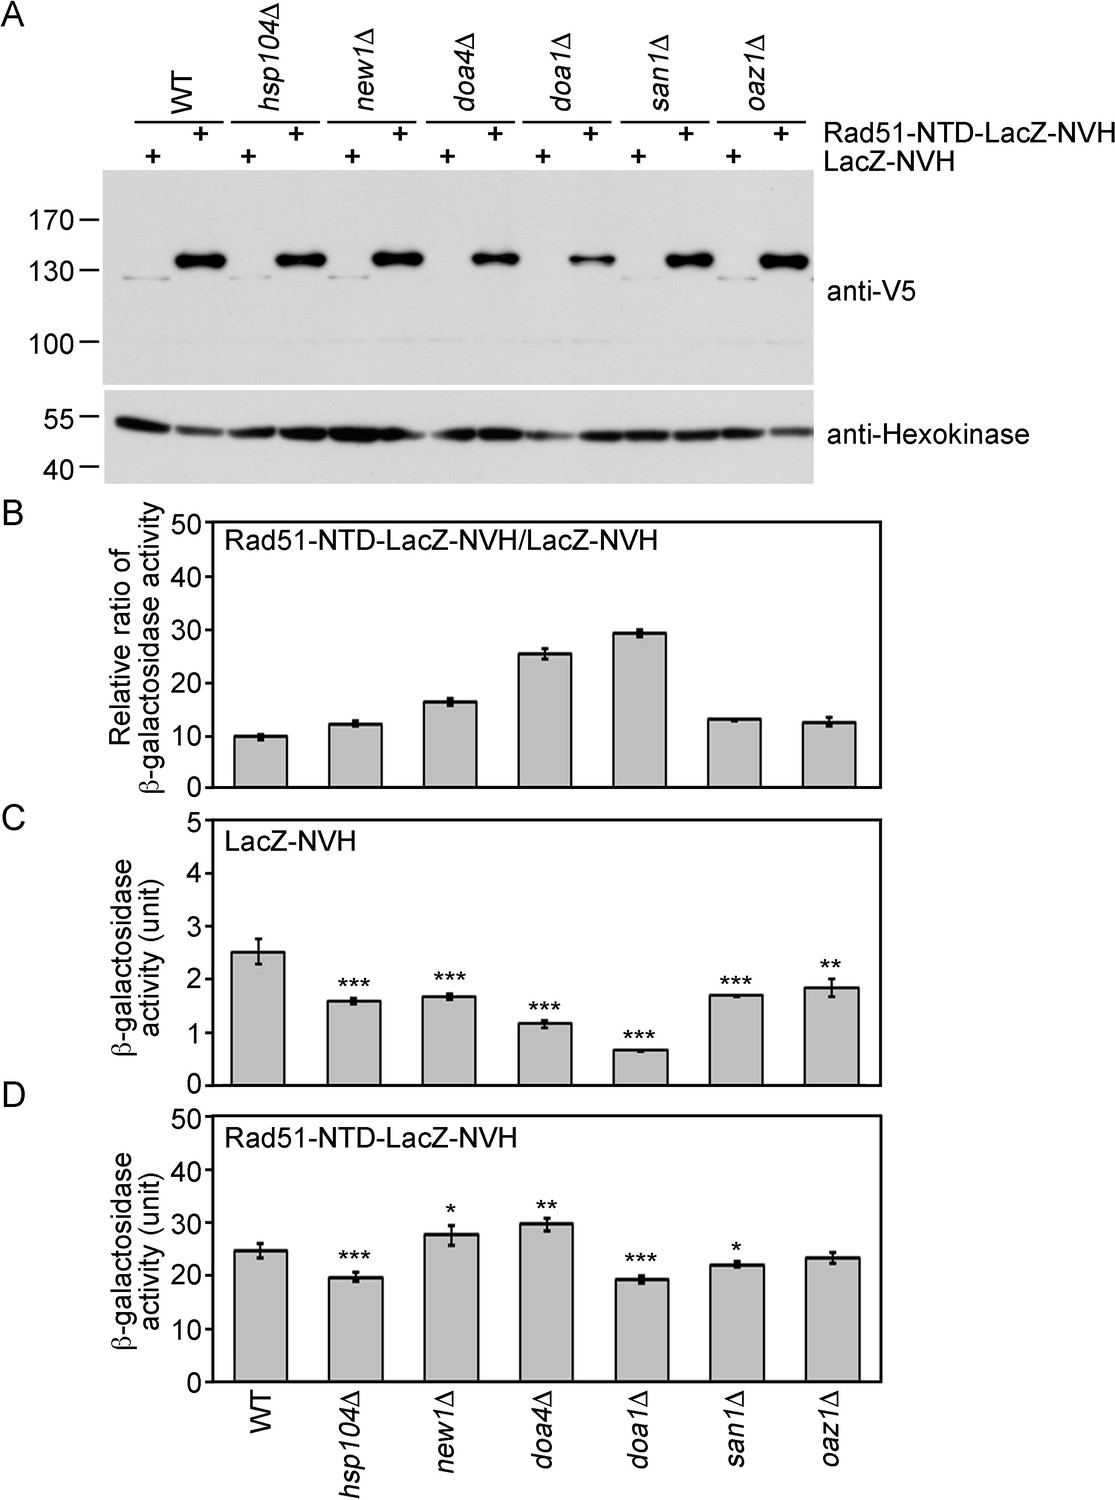
The expression-promoting function of Rad51-NTD is controlled during protein translation and does not affect ubiquitin-mediated protein degradation.
(A) The steady-state protein levels of Rad51-NTD-LacZ-NVH and LacZ-NVH in WT and six protein homeostasis gene knockout mutants. (B–D) The impact of six protein homeostasis genes on the β-galactosidase activity ratios of Rad51-NTD-LacZ-NVH to LacZ-NVH in WT and the six gene knockout mutants (B). The β-galactosidase activities of LacZ-NVH (C) and Rad51-NTD-LacZ-NVH (D) in WT and the six gene knockout mutants are shown. Asterisks indicate significant differences, with values calculated using a two-tailed t-test (***, p-value <0.001; **, p-value <0.01; *, p-value <0.05).
-
Figure 3—source data 1
Raw and labelled images for blots shown in Figure 3.
- https://cdn.elifesciences.org/articles/91405/elife-91405-fig3-data1-v1.zip
Figure 4
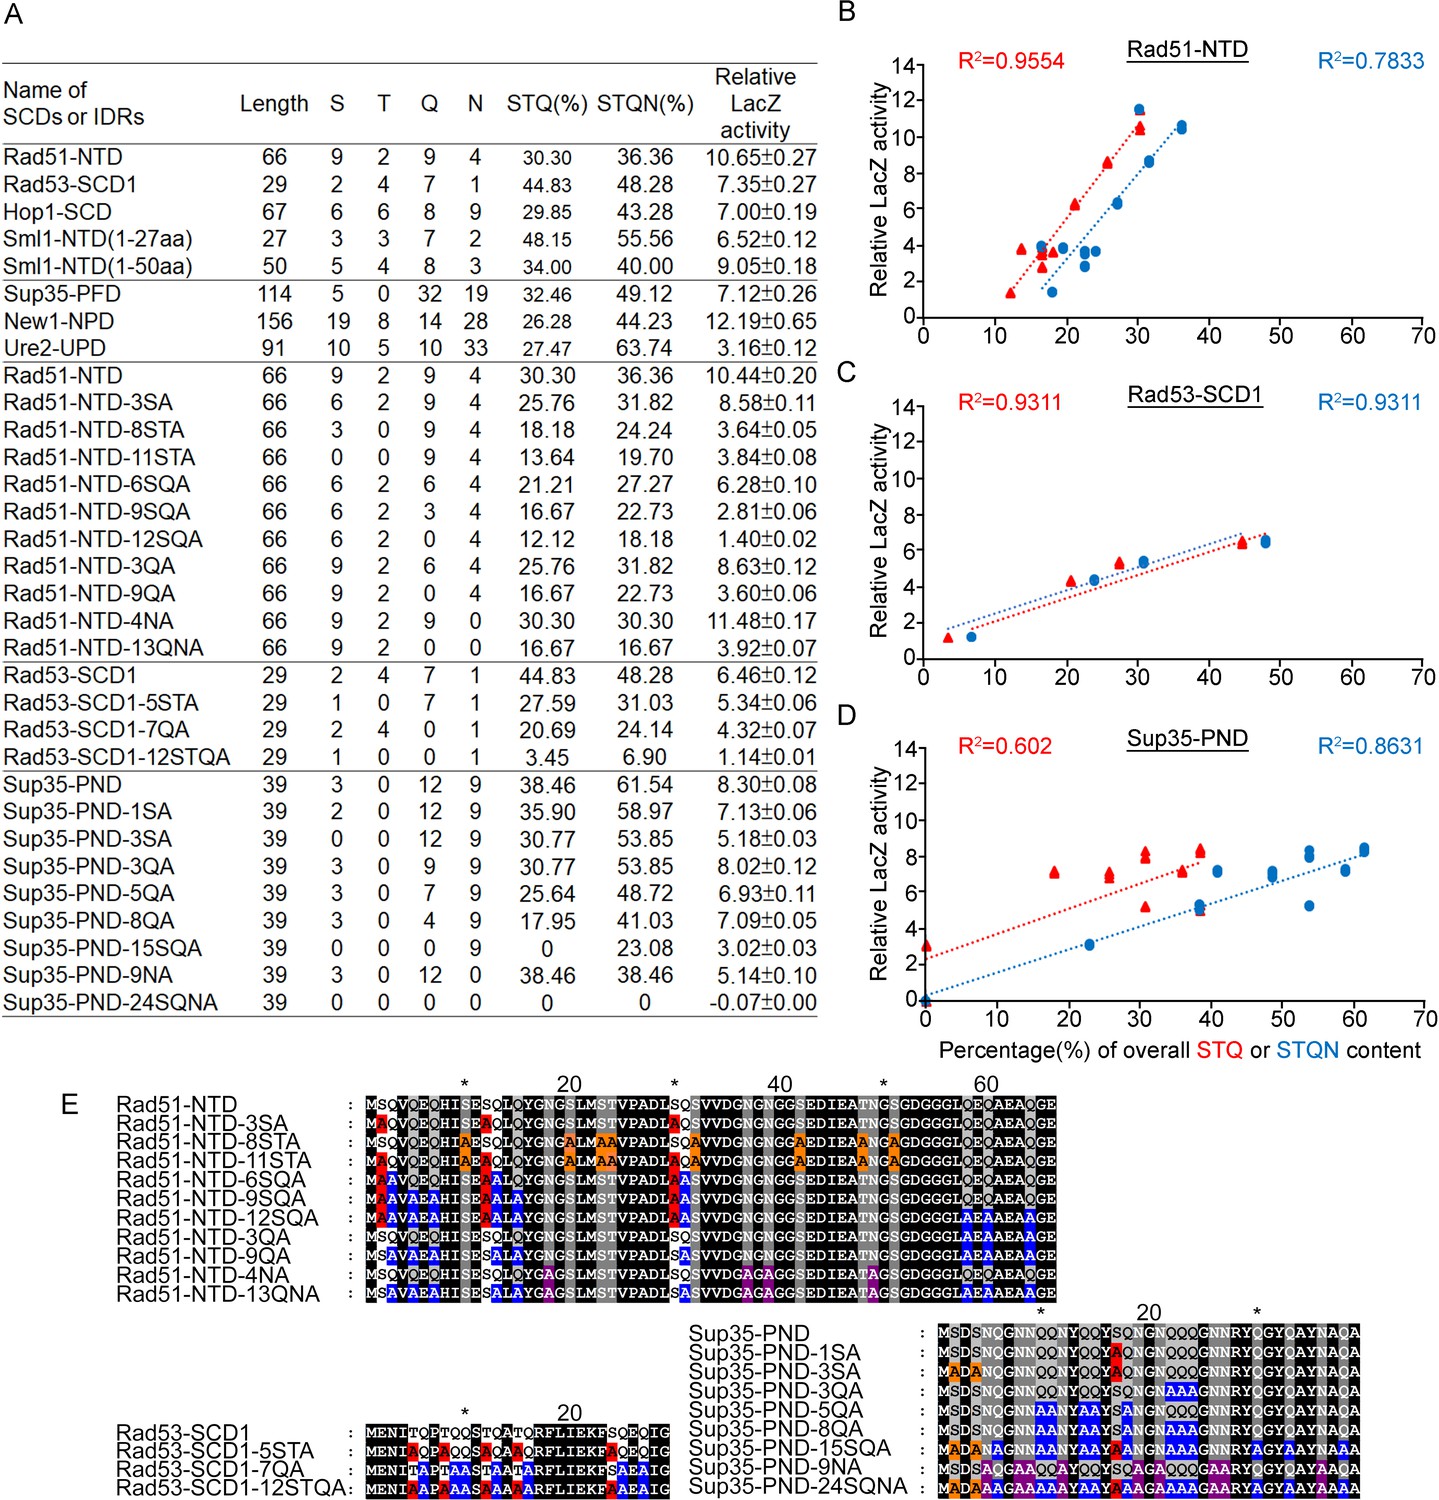
Relative β-galactosidase (LacZ) activities are correlated with the percentage STQ or STQN amino acid content of three Q-rich motifs.
(A) List of N-terminal tags with their respective length, numbers of S/T/Q/N amino acids, overall STQ or STQN percentages, and relative β-galactosidase activities. (B–D) Linear regressions between relative β-galactosidase activities and overall STQ or STQN percentages for Rad51-NTD (B), Rad53-SCD1 (C) and Sup35-PND (D). The coefficients of determination (R2) are indicated for each simple linear regression. (E) The amino acid sequences of wild-type and mutant Rad51-NTD, Rad51-SCD1 and Sup35-PND, respectively. Error bars are too small to be included.
Figure 5
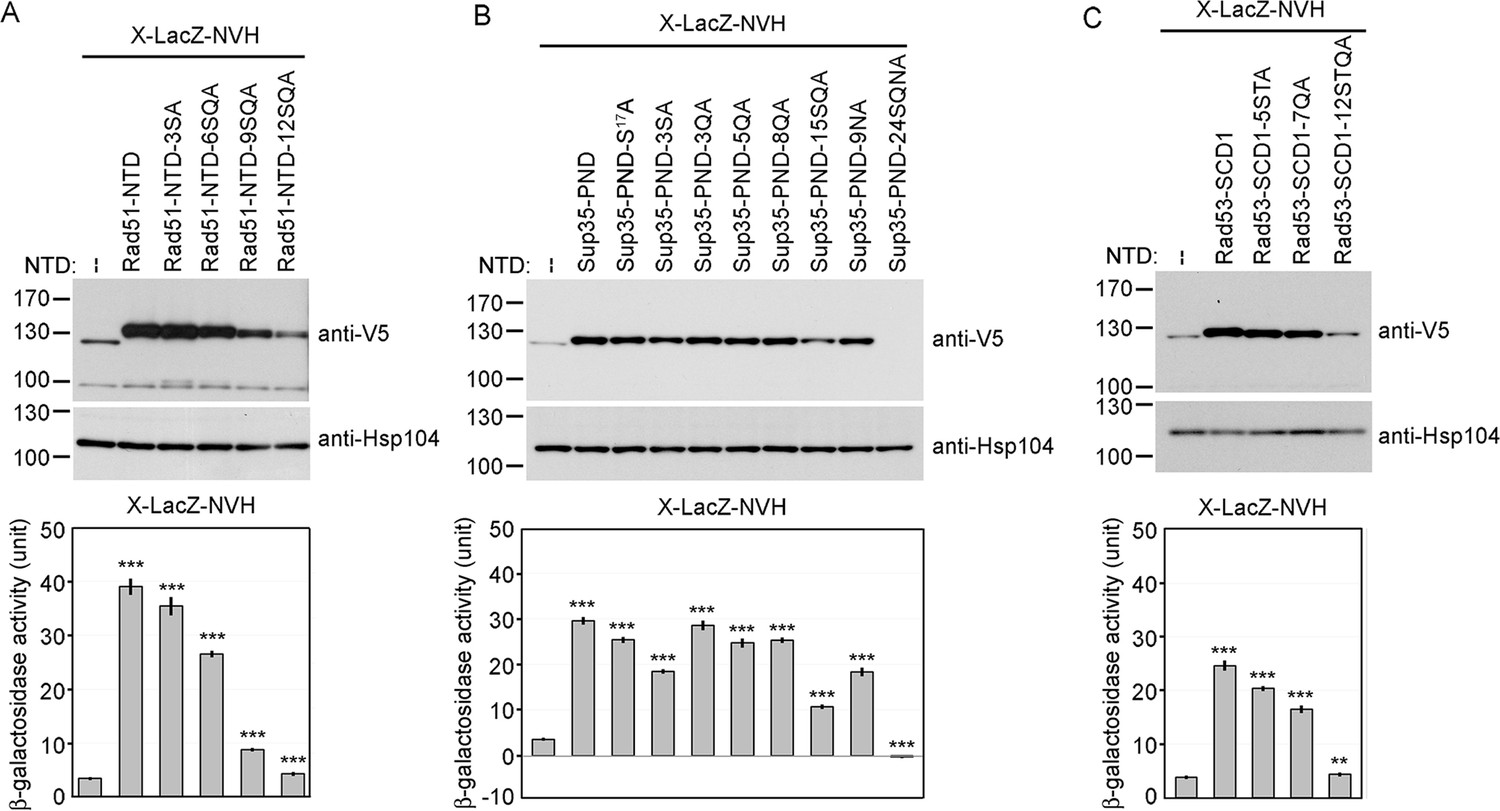
Alanine scanning mutagenesis of intrinsically disordered regions (IDRs).
The amino acid sequences of WT and mutant IDRs are listed in Supplementary file 1e. Total protein lysates prepared from yeast cells expressing Rad51-NTD-LacZ-NVH (A), Sup35-PND-LacZ-NVH (B) or Rad53-SCD1-LacZ-NVH (C) were visualized by immunoblotting with anti-V5 antisera. Hsp104 was used as a loading control. Quantitative yeast β-galactosidase (LacZ) assays were carried out as described in Figure 1. Error bars indicate standard deviation between experiments (n=3). Asterisks indicate significant differences when compared to LacZ-NVH, with p values calculated using a two-tailed t-test (**, p-value <0.01 and ***, p-value <0.001).
-
Figure 5—source data 1
Raw and labelled images for blots shown in Figure 5.
- https://cdn.elifesciences.org/articles/91405/elife-91405-fig5-data1-v1.zip
Figure 6 with 3 supplements
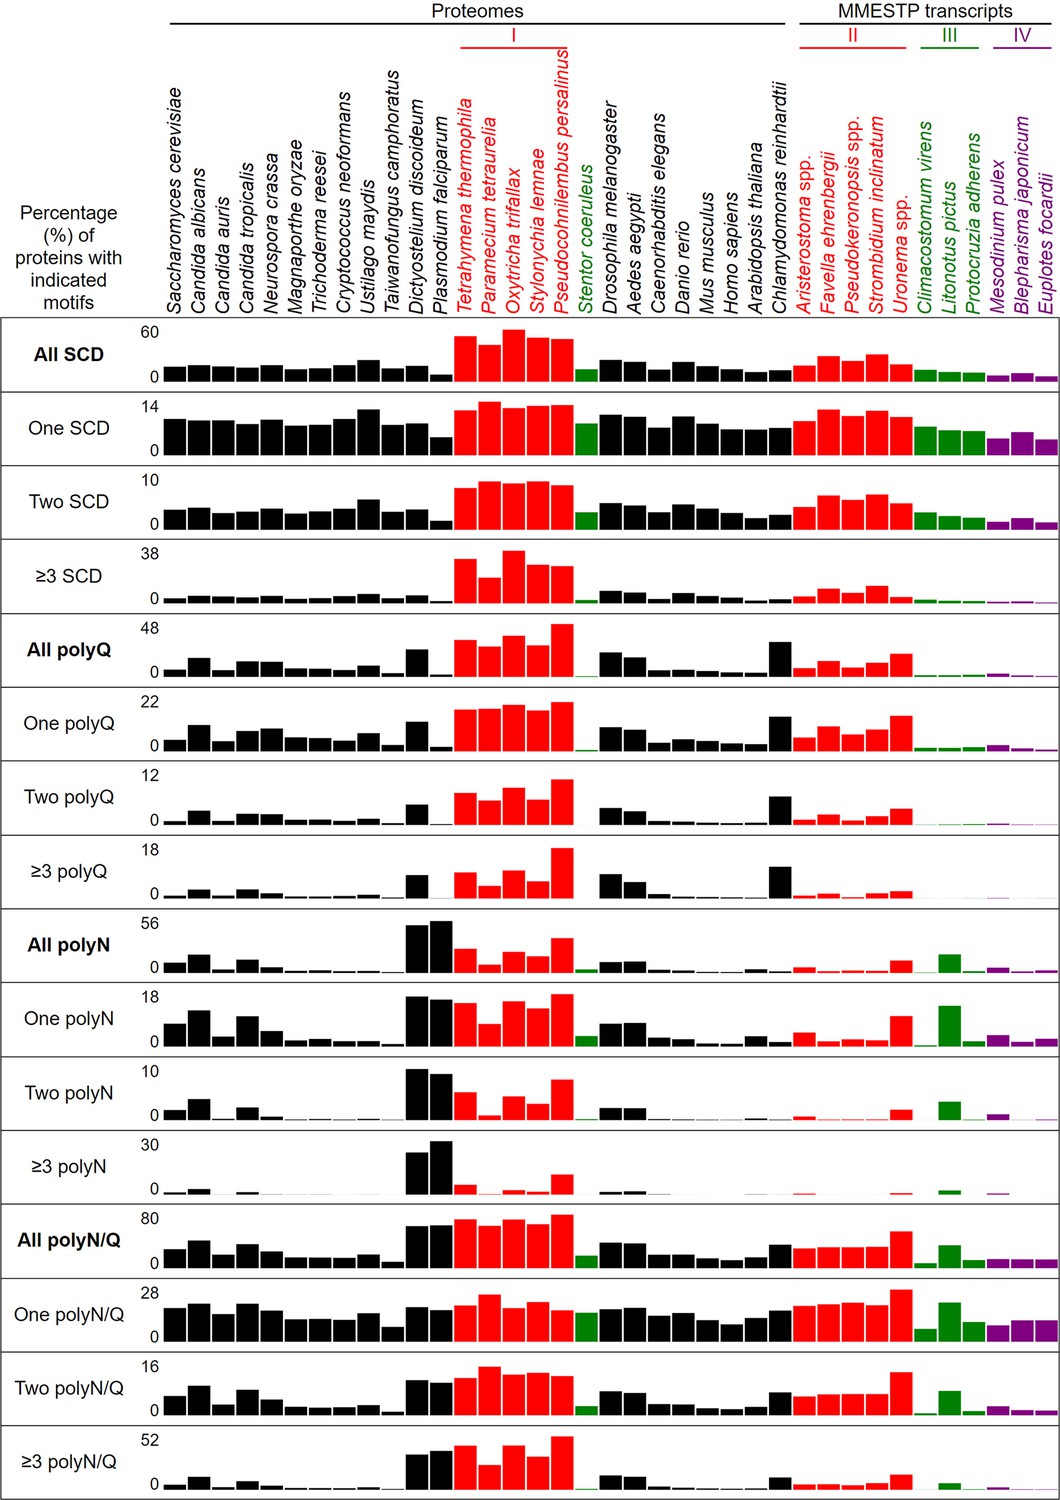
Percentages of proteins with different numbers of SCDs, and polyQ, polyQ/N or polyN tracts in 37 different eukaryotes.
-
Figure 6—source data 1
The average usages of 20 different amino acids in 17 ciliate and 20 non-ciliate species.
- https://cdn.elifesciences.org/articles/91405/elife-91405-fig6-data1-v1.xlsx
-
Figure 6—source data 2
The number of proteins containing different types of polyQ, polyQ/N and polyN tracts in 17 ciliate and 20 non-ciliate species.
- https://cdn.elifesciences.org/articles/91405/elife-91405-fig6-data2-v1.xlsx
-
Figure 6—source data 3
The numbers and percentages of SCD and polyX proteins in 17 ciliate and 20 non-ciliate species.
- https://cdn.elifesciences.org/articles/91405/elife-91405-fig6-data3-v1.xlsx
-
Figure 6—source data 4
The ratios of the overall number of X residues for each of the seven polyX motifs relative to those in the entire proteome of each species, respectively.
- https://cdn.elifesciences.org/articles/91405/elife-91405-fig6-data4-v1.xlsx
-
Figure 6—source data 5
The codon usage frequency in 26 near-complete proteomes and 11 ciliate proteomes encoded by the transcripts generated as part of the Marine Microbial Eukaryote Transcriptome Sequencing Project (MMETSP).
- https://cdn.elifesciences.org/articles/91405/elife-91405-fig6-data5-v1.xlsx
-
Figure 6—source data 6
GO enrichment analyses revealing the SCD and polyX proteins involved in different biological processes in 6 ciliate and 20 non-ciliate species.
The percentages and numbers of SCD and polyX proteins in our search that belong to each indicated Gene Ontology (GO) group are shown. GOfuncR (Huttenhower et al., 2009) was applied for GO enrichment and statistical analysis. The p values adjusted according to the Family-wise error rate (FWER) are shown. The overrepresented GO groups (adjusted p-values ≤0.001) are highlighted in red font.
- https://cdn.elifesciences.org/articles/91405/elife-91405-fig6-data6-v1.xlsx
-
Figure 6—source data 7
GO enrichment analyses revealing the SCD and polyX proteins involved in different biological processes in 6 ciliate and 20 non-ciliate species.
The percentages and numbers of SCD and polyX proteins in our search that belong to each indicated Gene Ontology (GO) group are shown. GOfuncR (Huttenhower et al., 2009) was applied for GO enrichment and statistical analysis. The p values adjusted according to the Family-wise error rate (FWER) are shown. The overrepresented GO groups (adjusted p-values ≤0.001) are highlighted in red font.
- https://cdn.elifesciences.org/articles/91405/elife-91405-fig6-data7-v1.xlsx
-
Figure 6—source data 8
GO enrichment analyses revealing the SCD and polyX proteins involved in different biological processes in 6 ciliate and 20 non-ciliate species.
The percentages and numbers of SCD and polyX proteins in our search that belong to each indicated Gene Ontology (GO) group are shown. GOfuncR (Huttenhower et al., 2009) was applied for GO enrichment and statistical analysis. The p values adjusted according to the Family-wise error rate (FWER) are shown. The overrepresented GO groups (adjusted p-values ≤0.001) are highlighted in red font.
- https://cdn.elifesciences.org/articles/91405/elife-91405-fig6-data8-v1.xlsx
-
Figure 6—source data 9
GO enrichment analyses revealing the SCD and polyX proteins involved in different biological processes in 6 ciliate and 20 non-ciliate species.
The percentages and numbers of SCD and polyX proteins in our search that belong to each indicated Gene Ontology (GO) group are shown. GOfuncR (Huttenhower et al., 2009) was applied for GO enrichment and statistical analysis. The p values adjusted according to the Family-wise error rate (FWER) are shown. The overrepresented GO groups (adjusted p-values ≤0.001) are highlighted in red font.
- https://cdn.elifesciences.org/articles/91405/elife-91405-fig6-data9-v1.xlsx
-
Figure 6—source data 10
GO enrichment analyses revealing the SCD and polyX proteins involved in different biological processes in 6 ciliate and 20 non-ciliate species.
The percentages and numbers of SCD and polyX proteins in our search that belong to each indicated Gene Ontology (GO) group are shown. GOfuncR (Huttenhower et al., 2009) was applied for GO enrichment and statistical analysis. The p values adjusted according to the Family-wise error rate (FWER) are shown. The overrepresented GO groups (adjusted p-values ≤0.001) are highlighted in red font.
- https://cdn.elifesciences.org/articles/91405/elife-91405-fig6-data10-v1.xlsx
-
Figure 6—source data 11
GO enrichment analyses revealing the SCD and polyX proteins involved in different biological processes in 6 ciliate and 20 non-ciliate species.
The percentages and numbers of SCD and polyX proteins in our search that belong to each indicated Gene Ontology (GO) group are shown. GOfuncR (Huttenhower et al., 2009) was applied for GO enrichment and statistical analysis. The p values adjusted according to the Family-wise error rate (FWER) are shown. The overrepresented GO groups (adjusted p-values ≤0.001) are highlighted in red font.
- https://cdn.elifesciences.org/articles/91405/elife-91405-fig6-data11-v1.xlsx
-
Figure 6—source data 12
GO enrichment analyses revealing the SCD and polyX proteins involved in different biological processes in 6 ciliate and 20 non-ciliate species.
The percentages and numbers of SCD and polyX proteins in our search that belong to each indicated Gene Ontology (GO) group are shown. GOfuncR (Huttenhower et al., 2009) was applied for GO enrichment and statistical analysis. The p values adjusted according to the Family-wise error rate (FWER) are shown. The overrepresented GO groups (adjusted p-values ≤0.001) are highlighted in red font.
- https://cdn.elifesciences.org/articles/91405/elife-91405-fig6-data12-v1.xlsx
-
Figure 6—source data 13
GO enrichment analyses revealing the SCD and polyX proteins involved in different biological processes in 6 ciliate and 20 non-ciliate species.
The percentages and numbers of SCD and polyX proteins in our search that belong to each indicated Gene Ontology (GO) group are shown. GOfuncR (Huttenhower et al., 2009) was applied for GO enrichment and statistical analysis. The p values adjusted according to the Family-wise error rate (FWER) are shown. The overrepresented GO groups (adjusted p-values ≤0.001) are highlighted in red font.
- https://cdn.elifesciences.org/articles/91405/elife-91405-fig6-data13-v1.xlsx
-
Figure 6—source data 14
GO enrichment analyses revealing the SCD and polyX proteins involved in different biological processes in 6 ciliate and 20 non-ciliate species.
The percentages and numbers of SCD and polyX proteins in our search that belong to each indicated Gene Ontology (GO) group are shown. GOfuncR (Huttenhower et al., 2009) was applied for GO enrichment and statistical analysis. The p values adjusted according to the Family-wise error rate (FWER) are shown. The overrepresented GO groups (adjusted p-values ≤0.001) are highlighted in red font.
- https://cdn.elifesciences.org/articles/91405/elife-91405-fig6-data14-v1.xlsx
-
Figure 6—source data 15
GO enrichment analyses revealing the SCD and polyX proteins involved in different biological processes in 6 ciliate and 20 non-ciliate species.
The percentages and numbers of SCD and polyX proteins in our search that belong to each indicated Gene Ontology (GO) group are shown. GOfuncR (Huttenhower et al., 2009) was applied for GO enrichment and statistical analysis. The p values adjusted according to the Family-wise error rate (FWER) are shown. The overrepresented GO groups (adjusted p-values ≤0.001) are highlighted in red font.
- https://cdn.elifesciences.org/articles/91405/elife-91405-fig6-data15-v1.xlsx
-
Figure 6—source data 16
GO enrichment analyses revealing the SCD and polyX proteins involved in different biological processes in 6 ciliate and 20 non-ciliate species.
The percentages and numbers of SCD and polyX proteins in our search that belong to each indicated Gene Ontology (GO) group are shown. GOfuncR (Huttenhower et al., 2009) was applied for GO enrichment and statistical analysis. The p values adjusted according to the Family-wise error rate (FWER) are shown. The overrepresented GO groups (adjusted p-values ≤0.001) are highlighted in red font.
- https://cdn.elifesciences.org/articles/91405/elife-91405-fig6-data16-v1.xlsx
-
Figure 6—source data 17
GO enrichment analyses revealing the SCD and polyX proteins involved in different biological processes in 6 ciliate and 20 non-ciliate species.
The percentages and numbers of SCD and polyX proteins in our search that belong to each indicated Gene Ontology (GO) group are shown. GOfuncR (Huttenhower et al., 2009) was applied for GO enrichment and statistical analysis. The p values adjusted according to the Family-wise error rate (FWER) are shown. The overrepresented GO groups (adjusted p-values ≤0.001) are highlighted in red font.
- https://cdn.elifesciences.org/articles/91405/elife-91405-fig6-data17-v1.xlsx
-
Figure 6—source data 18
GO enrichment analyses revealing the SCD and polyX proteins involved in different biological processes in 6 ciliate and 20 non-ciliate species.
The percentages and numbers of SCD and polyX proteins in our search that belong to each indicated Gene Ontology (GO) group are shown. GOfuncR (Huttenhower et al., 2009) was applied for GO enrichment and statistical analysis. The p values adjusted according to the Family-wise error rate (FWER) are shown. The overrepresented GO groups (adjusted p-values ≤0.001) are highlighted in red font.
- https://cdn.elifesciences.org/articles/91405/elife-91405-fig6-data18-v1.xlsx
-
Figure 6—source data 19
GO enrichment analyses revealing the SCD and polyX proteins involved in different biological processes in 6 ciliate and 20 non-ciliate species.
The percentages and numbers of SCD and polyX proteins in our search that belong to each indicated Gene Ontology (GO) group are shown. GOfuncR (Huttenhower et al., 2009) was applied for GO enrichment and statistical analysis. The p values adjusted according to the Family-wise error rate (FWER) are shown. The overrepresented GO groups (adjusted p-values ≤0.001) are highlighted in red font.
- https://cdn.elifesciences.org/articles/91405/elife-91405-fig6-data19-v1.xlsx
-
Figure 6—source data 20
GO enrichment analyses revealing the SCD and polyX proteins involved in different biological processes in 6 ciliate and 20 non-ciliate species.
The percentages and numbers of SCD and polyX proteins in our search that belong to each indicated Gene Ontology (GO) group are shown. GOfuncR (Huttenhower et al., 2009) was applied for GO enrichment and statistical analysis. The p values adjusted according to the Family-wise error rate (FWER) are shown. The overrepresented GO groups (adjusted p-values ≤0.001) are highlighted in red font.
- https://cdn.elifesciences.org/articles/91405/elife-91405-fig6-data20-v1.xlsx
-
Figure 6—source data 21
GO enrichment analyses revealing the SCD and polyX proteins involved in different biological processes in 6 ciliate and 20 non-ciliate species.
The percentages and numbers of SCD and polyX proteins in our search that belong to each indicated Gene Ontology (GO) group are shown. GOfuncR (Huttenhower et al., 2009) was applied for GO enrichment and statistical analysis. The p values adjusted according to the Family-wise error rate (FWER) are shown. The overrepresented GO groups (adjusted p-values ≤0.001) are highlighted in red font.
- https://cdn.elifesciences.org/articles/91405/elife-91405-fig6-data21-v1.xlsx
-
Figure 6—source data 22
GO enrichment analyses revealing the SCD and polyX proteins involved in different biological processes in 6 ciliate and 20 non-ciliate species.
The percentages and numbers of SCD and polyX proteins in our search that belong to each indicated Gene Ontology (GO) group are shown. GOfuncR (Huttenhower et al., 2009) was applied for GO enrichment and statistical analysis. The p values adjusted according to the Family-wise error rate (FWER) are shown. The overrepresented GO groups (adjusted p-values ≤0.001) are highlighted in red font.
- https://cdn.elifesciences.org/articles/91405/elife-91405-fig6-data22-v1.xlsx
-
Figure 6—source data 23
GO enrichment analyses revealing the SCD and polyX proteins involved in different biological processes in 6 ciliate and 20 non-ciliate species.
The percentages and numbers of SCD and polyX proteins in our search that belong to each indicated Gene Ontology (GO) group are shown. GOfuncR (Huttenhower et al., 2009) was applied for GO enrichment and statistical analysis. The p values adjusted according to the Family-wise error rate (FWER) are shown. The overrepresented GO groups (adjusted p-values ≤0.001) are highlighted in red font.
- https://cdn.elifesciences.org/articles/91405/elife-91405-fig6-data23-v1.xlsx
-
Figure 6—source data 24
GO enrichment analyses revealing the SCD and polyX proteins involved in different biological processes in 6 ciliate and 20 non-ciliate species.
The percentages and numbers of SCD and polyX proteins in our search that belong to each indicated Gene Ontology (GO) group are shown. GOfuncR (Huttenhower et al., 2009) was applied for GO enrichment and statistical analysis. The p values adjusted according to the Family-wise error rate (FWER) are shown. The overrepresented GO groups (adjusted p-values ≤0.001) are highlighted in red font.
- https://cdn.elifesciences.org/articles/91405/elife-91405-fig6-data24-v1.xlsx
-
Figure 6—source data 25
GO enrichment analyses revealing the SCD and polyX proteins involved in different biological processes in 6 ciliate and 20 non-ciliate species.
The percentages and numbers of SCD and polyX proteins in our search that belong to each indicated Gene Ontology (GO) group are shown. GOfuncR (Huttenhower et al., 2009) was applied for GO enrichment and statistical analysis. The p values adjusted according to the Family-wise error rate (FWER) are shown. The overrepresented GO groups (adjusted p-values ≤0.001) are highlighted in red font.
- https://cdn.elifesciences.org/articles/91405/elife-91405-fig6-data25-v1.xlsx
-
Figure 6—source data 26
GO enrichment analyses revealing the SCD and polyX proteins involved in different biological processes in 6 ciliate and 20 non-ciliate species.
The percentages and numbers of SCD and polyX proteins in our search that belong to each indicated Gene Ontology (GO) group are shown. GOfuncR (Huttenhower et al., 2009) was applied for GO enrichment and statistical analysis. The p values adjusted according to the Family-wise error rate (FWER) are shown. The overrepresented GO groups (adjusted p-values ≤0.001) are highlighted in red font.
- https://cdn.elifesciences.org/articles/91405/elife-91405-fig6-data26-v1.xlsx
-
Figure 6—source data 27
GO enrichment analyses revealing the SCD and polyX proteins involved in different biological processes in 6 ciliate and 20 non-ciliate species.
The percentages and numbers of SCD and polyX proteins in our search that belong to each indicated Gene Ontology (GO) group are shown. GOfuncR (Huttenhower et al., 2009) was applied for GO enrichment and statistical analysis. The p values adjusted according to the Family-wise error rate (FWER) are shown. The overrepresented GO groups (adjusted p-values ≤0.001) are highlighted in red font.
- https://cdn.elifesciences.org/articles/91405/elife-91405-fig6-data27-v1.xlsx
-
Figure 6—source data 28
GO enrichment analyses revealing the SCD and polyX proteins involved in different biological processes in 6 ciliate and 20 non-ciliate species.
The percentages and numbers of SCD and polyX proteins in our search that belong to each indicated Gene Ontology (GO) group are shown. GOfuncR (Huttenhower et al., 2009) was applied for GO enrichment and statistical analysis. The p values adjusted according to the Family-wise error rate (FWER) are shown. The overrepresented GO groups (adjusted p-values ≤0.001) are highlighted in red font.
- https://cdn.elifesciences.org/articles/91405/elife-91405-fig6-data28-v1.xlsx
-
Figure 6—source data 29
GO enrichment analyses revealing the SCD and polyX proteins involved in different biological processes in 6 ciliate and 20 non-ciliate species.
The percentages and numbers of SCD and polyX proteins in our search that belong to each indicated Gene Ontology (GO) group are shown. GOfuncR (Huttenhower et al., 2009) was applied for GO enrichment and statistical analysis. The p values adjusted according to the Family-wise error rate (FWER) are shown. The overrepresented GO groups (adjusted p-values ≤0.001) are highlighted in red font.
- https://cdn.elifesciences.org/articles/91405/elife-91405-fig6-data29-v1.xlsx
-
Figure 6—source data 30
GO enrichment analyses revealing the SCD and polyX proteins involved in different biological processes in 6 ciliate and 20 non-ciliate species.
The percentages and numbers of SCD and polyX proteins in our search that belong to each indicated Gene Ontology (GO) group are shown. GOfuncR (Huttenhower et al., 2009) was applied for GO enrichment and statistical analysis. The p values adjusted according to the Family-wise error rate (FWER) are shown. The overrepresented GO groups (adjusted p-values ≤0.001) are highlighted in red font.
- https://cdn.elifesciences.org/articles/91405/elife-91405-fig6-data30-v1.xlsx
-
Figure 6—source data 31
GO enrichment analyses revealing the SCD and polyX proteins involved in different biological processes in 6 ciliate and 20 non-ciliate species.
The percentages and numbers of SCD and polyX proteins in our search that belong to each indicated Gene Ontology (GO) group are shown. GOfuncR (Huttenhower et al., 2009) was applied for GO enrichment and statistical analysis. The p values adjusted according to the Family-wise error rate (FWER) are shown. The overrepresented GO groups (adjusted p-values ≤0.001) are highlighted in red font.
- https://cdn.elifesciences.org/articles/91405/elife-91405-fig6-data31-v1.xlsx
-
Figure 6—source data 32
The results of BLASTP searches using the 58 Tetrahymena thermophila proteins involved in xylan catabolysis.
- https://cdn.elifesciences.org/articles/91405/elife-91405-fig6-data32-v1.xlsx
-
Figure 6—source data 33
The list of 124 Tetrahymena thermophila proteins involved in meiosis (kindly provided by Josef Loidl).
The numbers of SCD and polyX tracts in each protein are indicated.
- https://cdn.elifesciences.org/articles/91405/elife-91405-fig6-data33-v1.xlsx
Figure 6—figure supplement 1
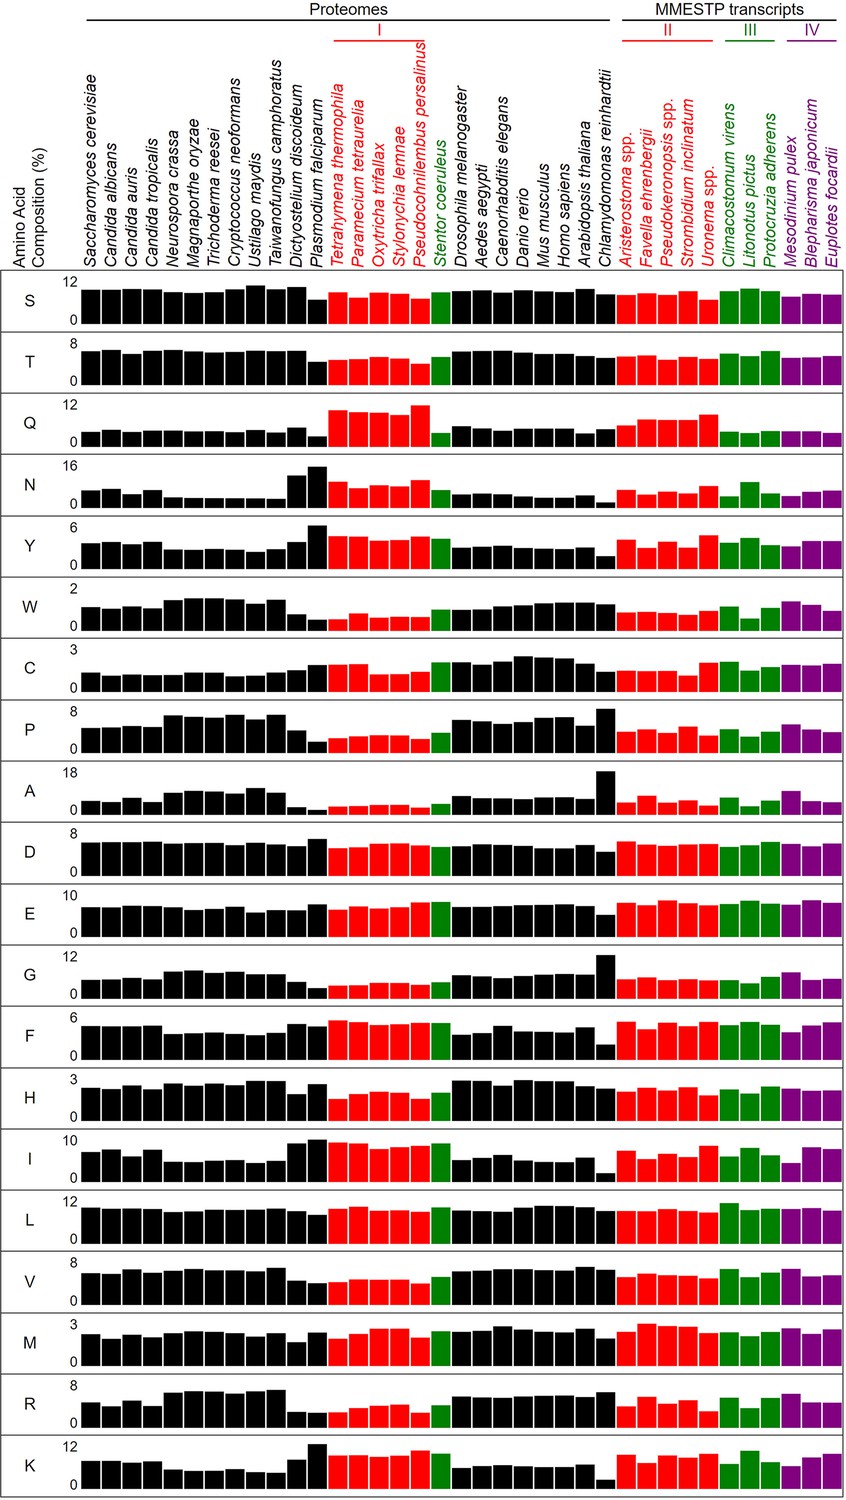
Proteome-wide contents of 20 different amino acids in 37 different eukaryotes.
Figure 6—figure supplement 2

Percentages of proteins with indicated polyQ and polyQ/N tracts in 37 different eukaryotes.
Figure 6—figure supplement 3

Percentages of proteins with indicated polyX motifs in 37 different eukaryotes.
Figure 7

Q contents in 7 different types of polyQ motifs in 26 near-complete proteomes.
The five ciliates with reassigned stops codon (TAAQ and TAGQ) are indicated in red. Stentor coeruleus, a ciliate with standard stop codons, is indicated in green.
Figure 8
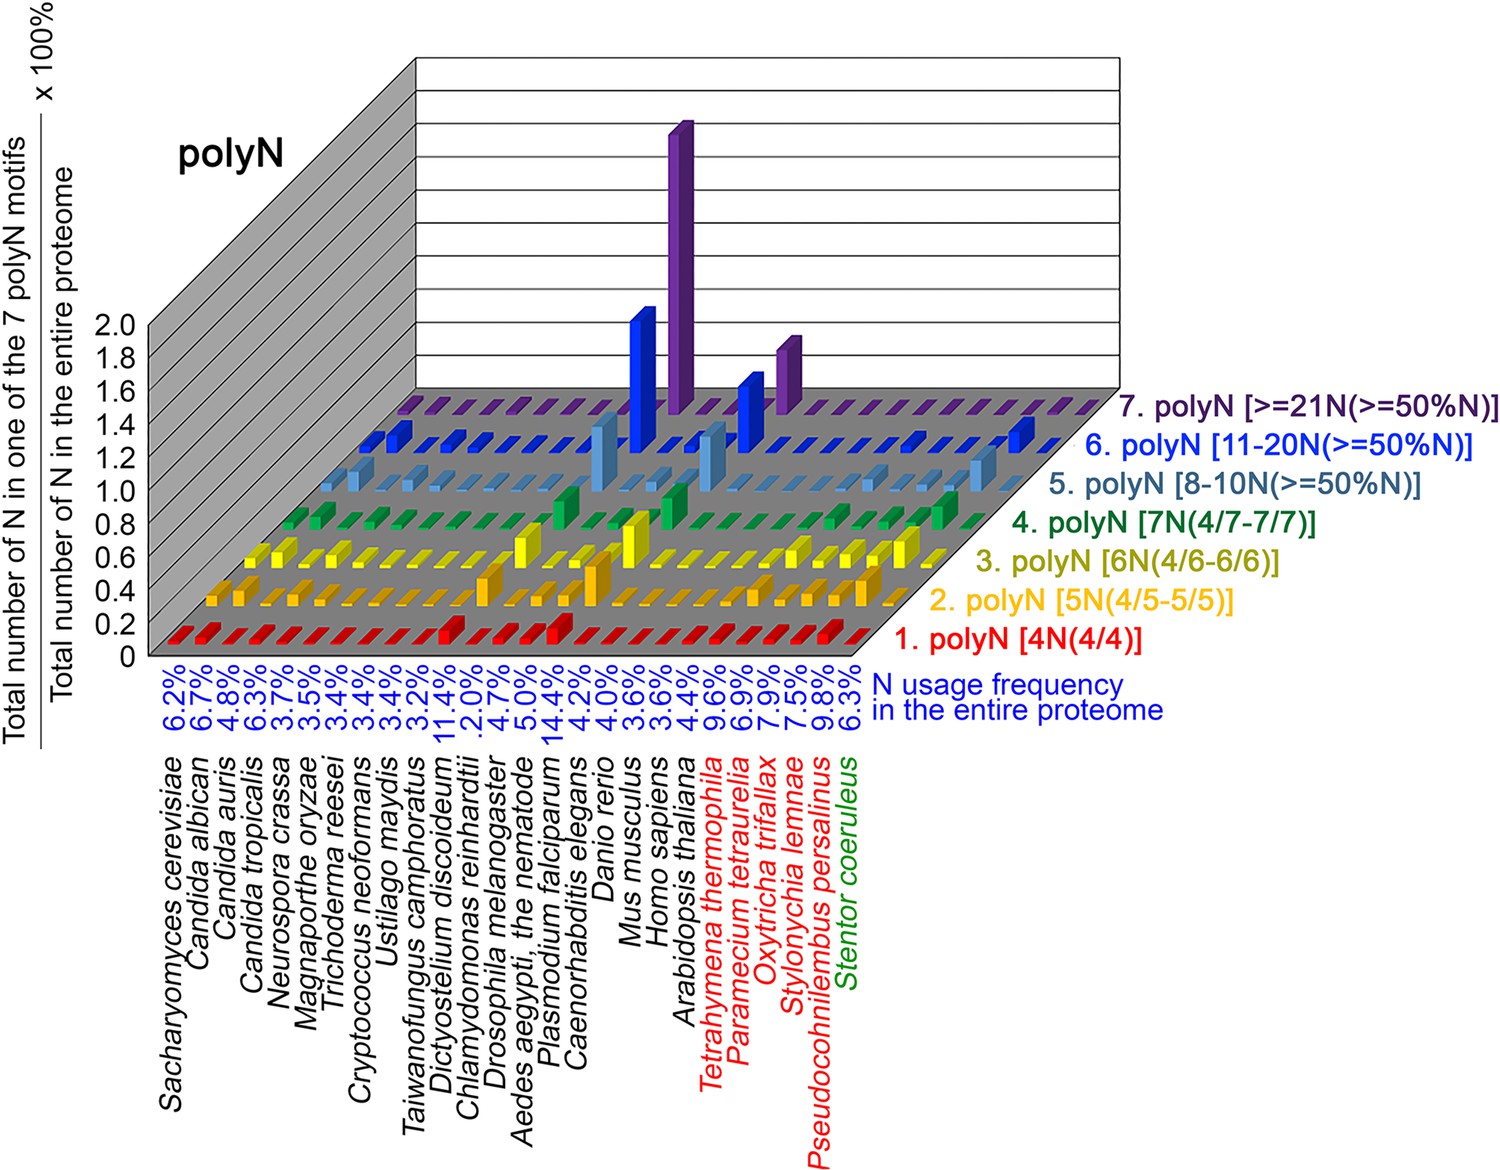
N contents in 7 different types of polyN motifs in 26 near-complete proteomes.
The five ciliates with reassigned stops codon (TAAQ and TAGQ) are indicated in red. Stentor coeruleus, a ciliate with standard stop codons, is indicated in green.
Figure 9
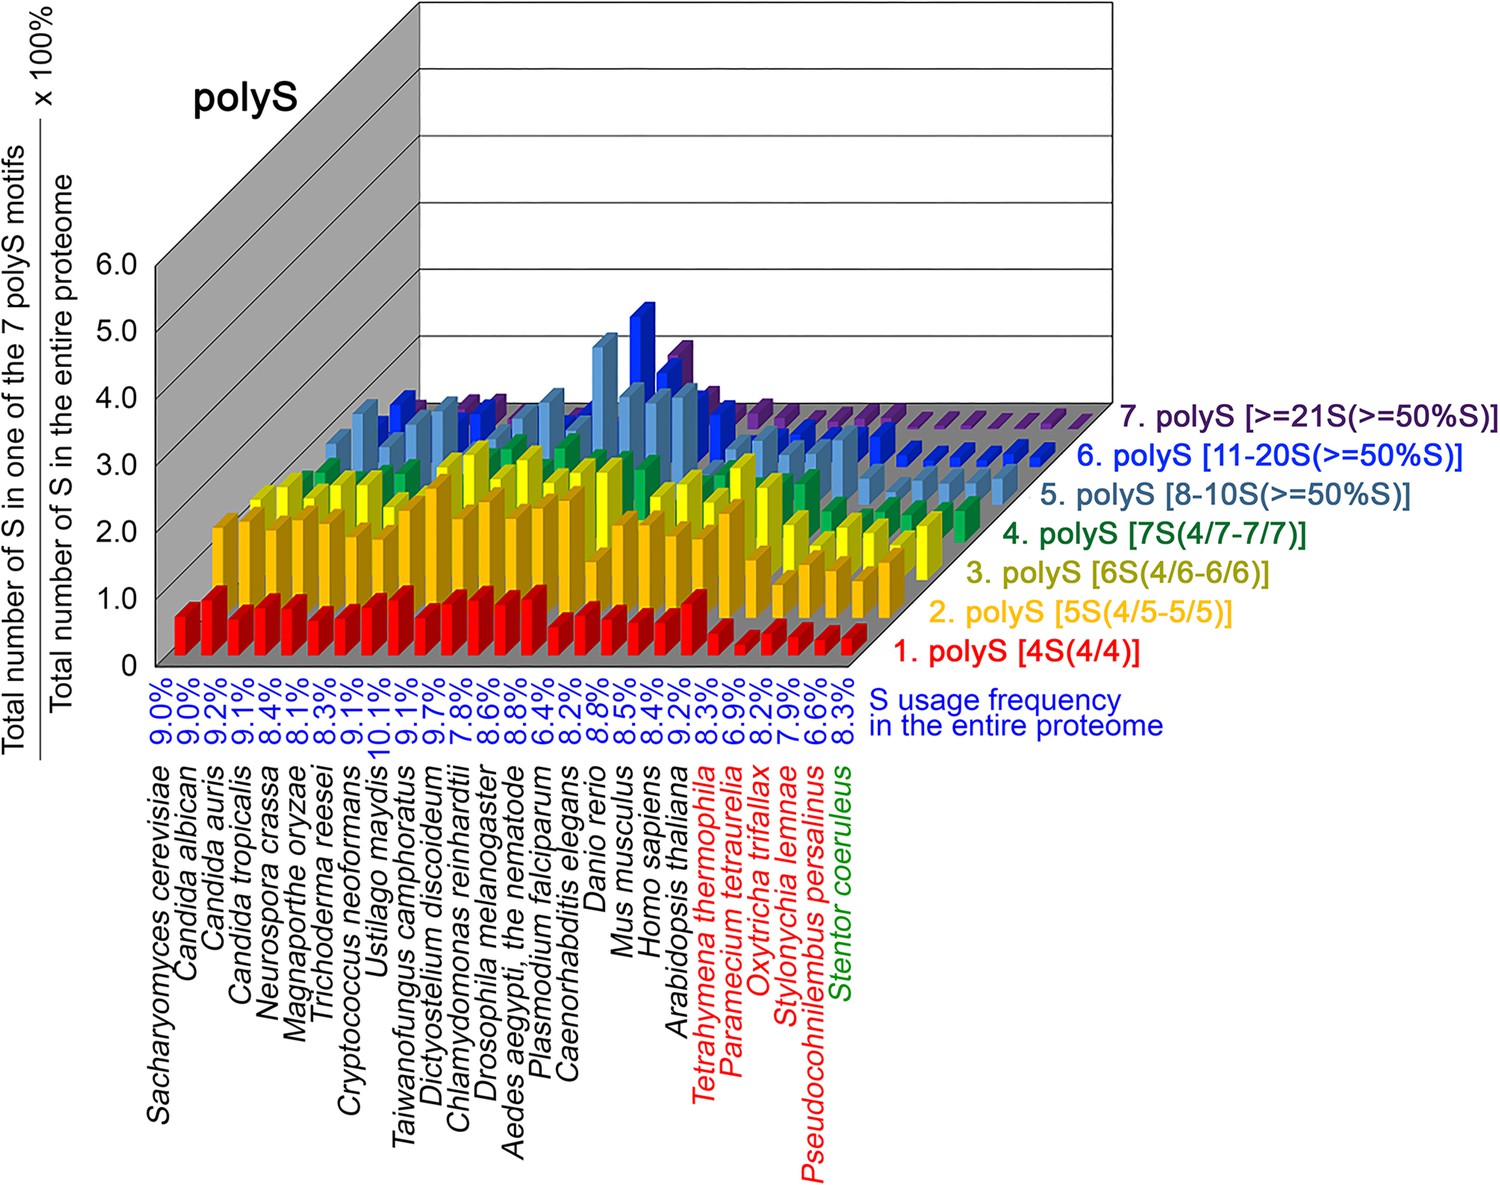
contents in 7 different types of polyS motifs in 26 near-complete proteomes.
The five ciliates with reassigned stops codon (TAAQ and TAGQ) are indicated in red. Stentor coeruleus, a ciliate with standard stop codons, is indicated in green.
Figure 10
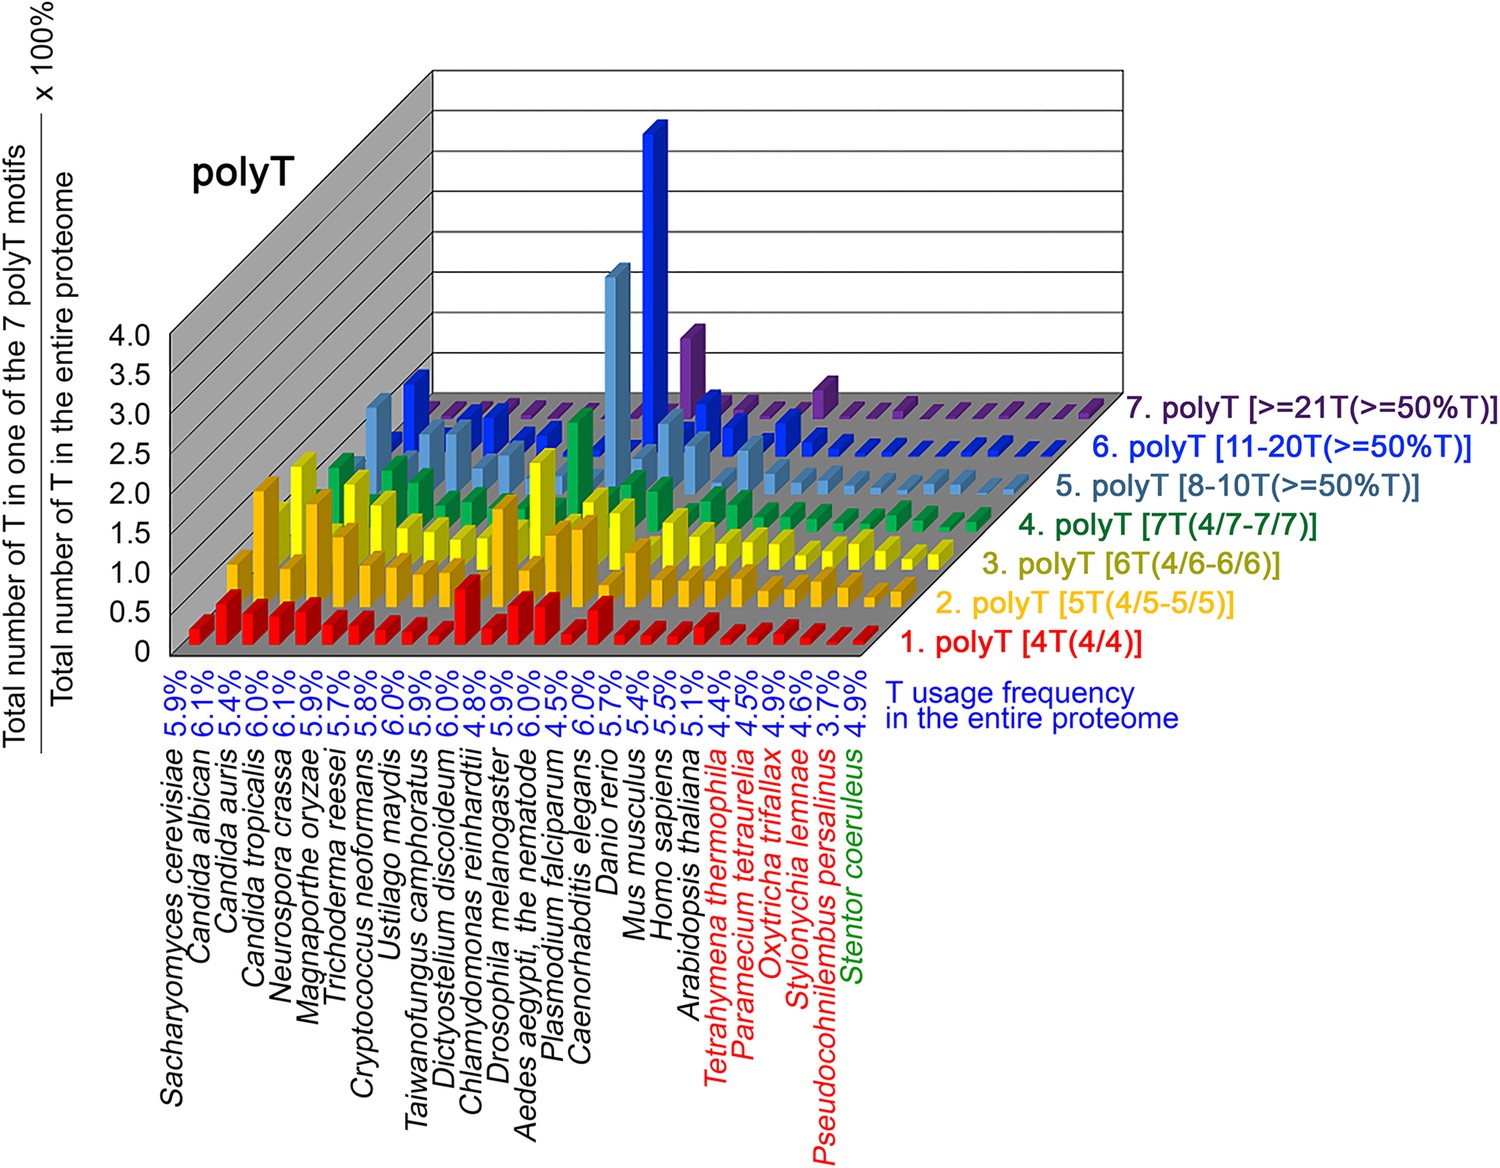
T contents in 7 different types of polyT motifs in 26 near-complete proteomes.
The five ciliates with reassigned stops codon (TAAQ and TAGQ) are indicated in red. Stentor coeruleus, a ciliate with standard stop codons, is indicated in green.
Figure 11
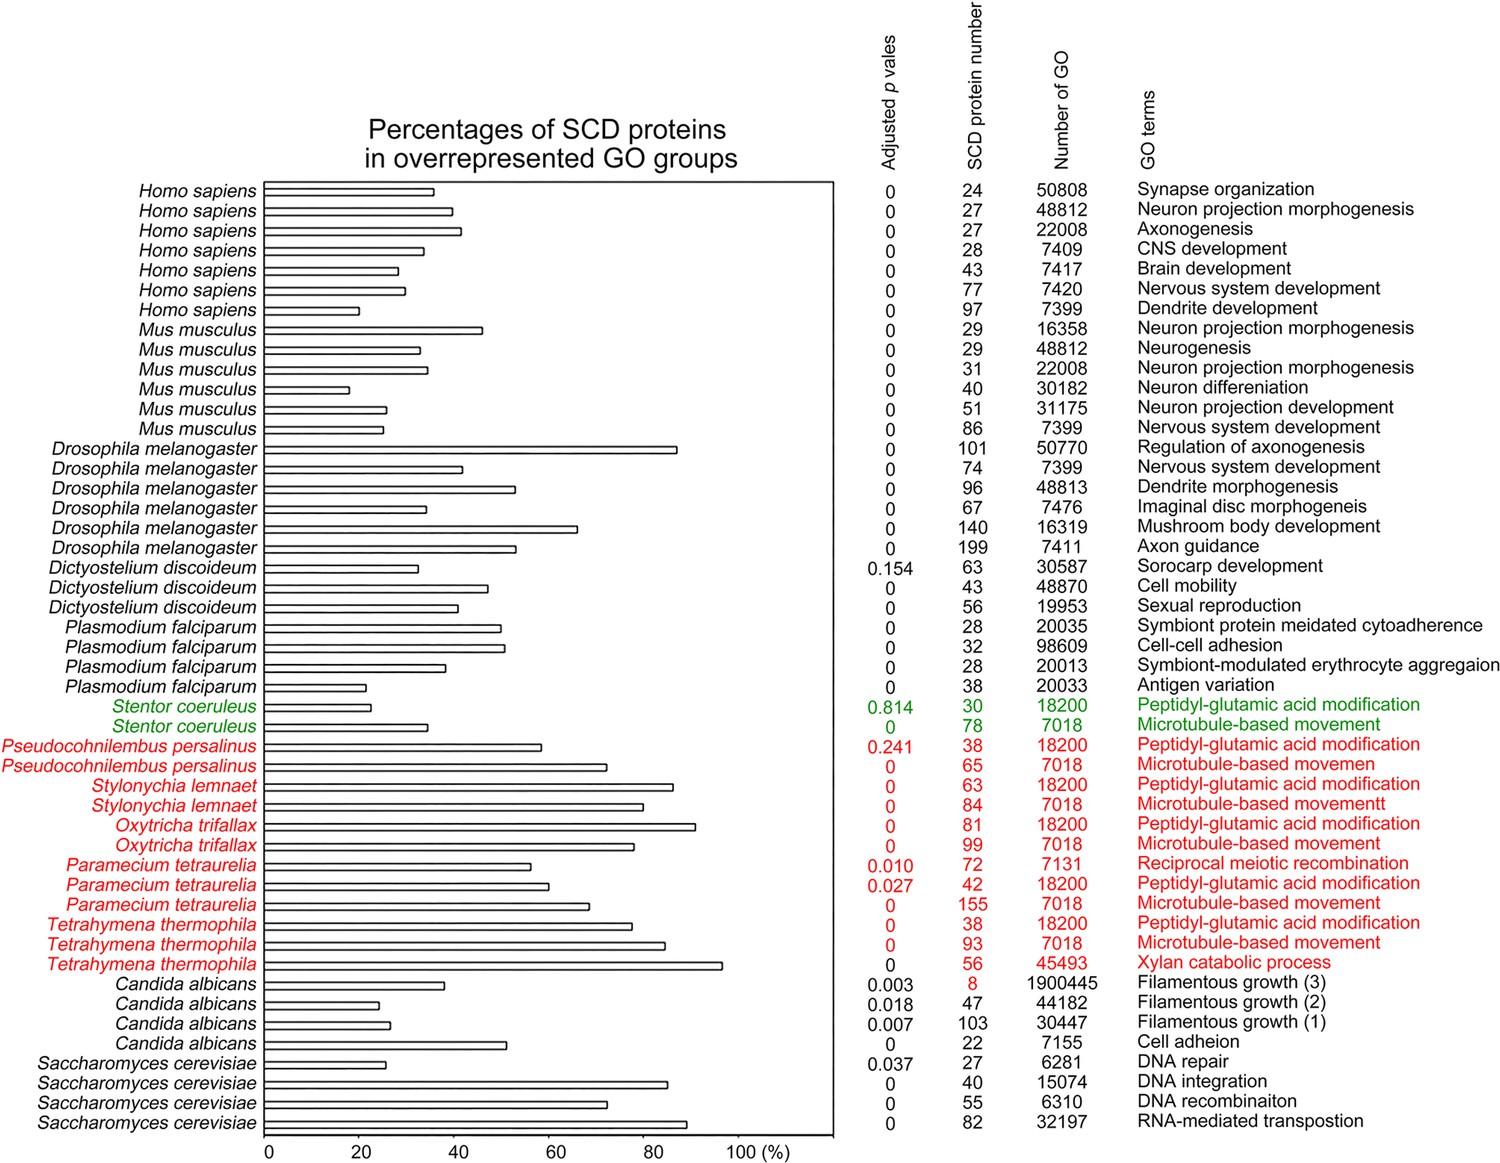
Selection of biological processes with overrepresented SCD-containing proteins in different eukaryotes.
The percentages and number of SCD-containing proteins in our search that belong to each indicated Gene Ontology (GO) group are shown. GOfuncR (Huttenhower et al., 2009) was applied for GO enrichment and statistical analysis. The p values adjusted according to the Family-wise error rate (FWER) are shown.
Figure 12
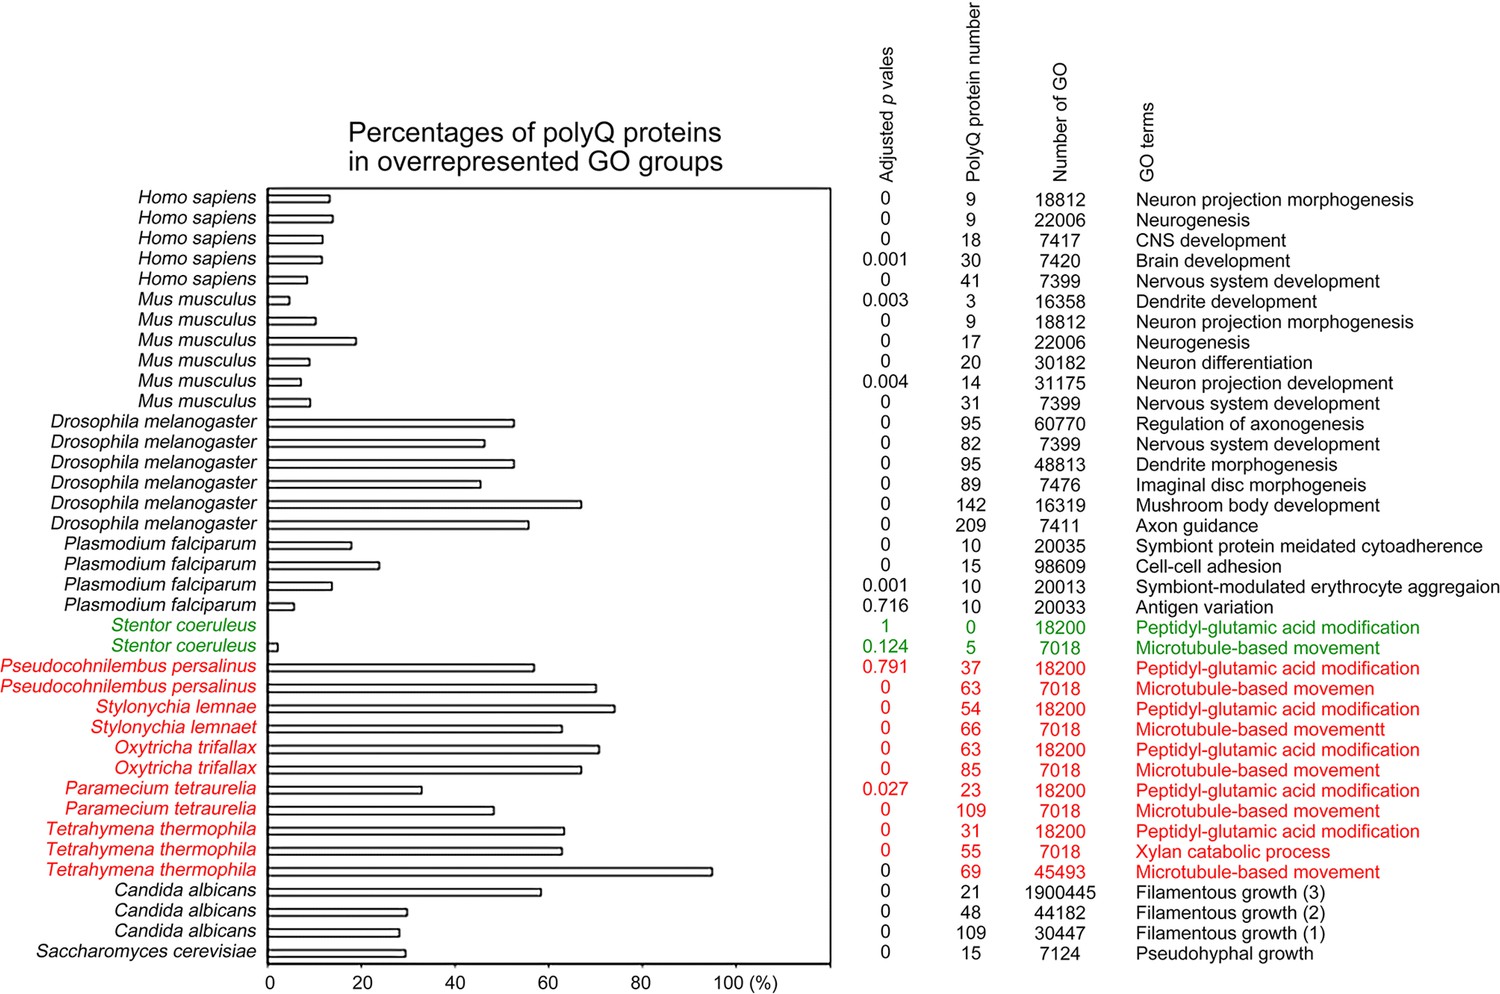
Selection of biological processes with overrepresented polyQ-containing proteins in different eukaryotes.
The percentages and numbers of polyQ-containing proteins in our search that belong to each indicated Gene Ontology (GO) group are shown. GOfuncR (Huttenhower et al., 2009) was applied for GO enrichment and statistical analysis. The p values adjusted according to the Family-wise error rate (FWER) are shown. The five ciliates with reassigned stops codons (TAAQ and TAGQ) are indicated in red. Stentor coeruleus, a ciliate with standard stop codons, is indicated in green.
Tables
Table 1
Usage frequency (%) of standard codons [stop codon (*), Q, C, Y and W] and reassigned stop codons (→ Q, → C or → W) in 37 different eukaryotes.
| Species | Source | ID | BUSCOProtein (%) | Protein# | TAA | TAG | TGA | CAA | CAG | TGC | TGT | TAC | TAT | TGG |
|---|---|---|---|---|---|---|---|---|---|---|---|---|---|---|
| NCBI genetic code: 1 | Non-ciliate eukaryotes | * | * | * | Q | Q | C | C | Y | Y | W | |||
| Saccharomyces cerevisiae | UniProt | UP000002311 | 99.6 | 6062 | 0.16 | 0.08 | 0.01 | 2.77 | 0.89 | 0.63 | 1.03 | 0.86 | 3.10 | 0.93 |
| Candida albicans | UniProt | UP000000559 | 98.8 | 6035 | 0.10 | 0.05 | 0.03 | 3.57 | 0.65 | 0.18 | 0.94 | 1.04 | 2.54 | 1.09 |
| Candida auris | UniProt | UP000230249 | 97.4 | 5409 | 0.08 | 0.06 | 0.06 | 1.81 | 2.12 | 0.55 | 0.59 | 2.09 | 1.16 | 1.07 |
| Candida tropicalis | UniProt | UP000002037 | 94.6 | 6226 | 0.10 | 0.07 | 0.03 | 3.61 | 0.66 | 0.14 | 0.96 | 0.95 | 2.62 | 0.98 |
| Neurospora crassa | UniProt | UP000001805 | 99.2 | 10257 | 0.06 | 0.05 | 0.08 | 1.70 | 2.60 | 0.77 | 0.34 | 1.75 | 0.85 | 1.31 |
| Magnaporthe oryzae | UniProt | UP000009058 | 98.6 | 12794 | 0.06 | 0.07 | 0.10 | 1.37 | 2.69 | 0.92 | 0.35 | 1.80 | 0.71 | 1.42 |
| Trichoderma reesei | PMID: 34908505 | PRJNA382020 | 99.2 | 13735 | 0.06 | 0.06 | 0.11 | 1.17 | 2.95 | 0.95 | 0.32 | 1.80 | 0.83 | 1.42 |
| Cryptococcus neoformans | UniProt | UP000002149 | 99.5 | 6743 | 0.07 | 0.06 | 0.05 | 2.06 | 1.79 | 0.48 | 0.55 | 1.39 | 1.14 | 1.37 |
| Ustilago maydis | UniProt | UP000000561 | 99.4 | 6806 | 0.04 | 0.05 | 0.07 | 1.82 | 2.61 | 0.72 | 0.35 | 1.59 | 0.65 | 1.18 |
| Taiwanofungus camphoratus | PMID: 35196809 | PRJNA615295 | 94.6 | 14019 | 0.05 | 0.06 | 0.11 | 1.57 | 2.19 | 0.70 | 0.57 | 1.38 | 1.22 | 1.36 |
| Dictyostelium discoideum | UniProt | UP000002195 | 93.7 | 12734 | 0.16 | 0.01 | 0.01 | 4.86 | 0.19 | 0.15 | 1.27 | 0.52 | 3.02 | 0.73 |
| Plasmodium falciparum | UniProt | UP000001450 | 99.1 | 5376 | 0.09 | 0.01 | 0.03 | 2.42 | 0.37 | 0.23 | 1.52 | 0.61 | 5.05 | 0.49 |
| Drosophila melanogaster | UniProt | UP000000803 | 100 | 22088 | 0.08 | 0.07 | 0.05 | 1.56 | 3.61 | 1.32 | 0.54 | 1.84 | 1.08 | 0.99 |
| Aedes aegypti | UniProt | UP000008820 | 99.4 | 18998 | 0.11 | 0.07 | 0.08 | 1.76 | 2.58 | 1.11 | 0.79 | 2.16 | 1.14 | 1.06 |
| Caenorhabditis elegans | UniProt | UP000001940 | 100 | 26548 | 0.16 | 0.06 | 0.14 | 2.74 | 1.44 | 0.91 | 1.12 | 1.37 | 1.75 | 1.11 |
| Danio rerio | UniProt | UP000000437 | 95.5 | 46844 | 0.11 | 0.06 | 0.14 | 1.18 | 3.35 | 1.12 | 1.13 | 1.70 | 1.26 | 1.16 |
| Mus musculus | UniProt | UP000000589 | 99.7 | 55341 | 0.10 | 0.08 | 0.16 | 1.20 | 3.41 | 1.23 | 1.14 | 1.61 | 1.22 | 1.25 |
| Homo sapiens | UniProt | UP000005640 | 99.5 | 79038 | 0.10 | 0.08 | 0.16 | 1.23 | 3.42 | 1.26 | 1.06 | 1.53 | 1.22 | 1.32 |
| Arabidopsis thaliana | UniProt | UP000006548 | 100 | 39334 | 0.09 | 0.05 | 0.12 | 1.94 | 1.52 | 0.72 | 1.05 | 1.37 | 1.46 | 1.25 |
| Chlamydomonas reinhardtii | UniProt | UP000006906 | 98.9 | 18829 | 0.03 | 0.04 | 0.06 | 0.59 | 4.05 | 1.1 | 0.22 | 1.45 | 0.24 | 1.16 |
| NCBI genetic code: 6 | group I ciliates | → Q | → Q | * | Q | Q | C | C | Y | Y | W | |||
| Tetrahymena thermophila | UniProt | UP000009168 | 98.9 | 26972 | 5.46 | 1.63 | 0.16 | 2.04 | 0.48 | 0.79 | 0.99 | 1.22 | 3.09 | 0.51 |
| Paramecium tetraurelia | UniProt | UP000000600 | 98.8 | 39461 | 4.53 | 1.48 | 0.22 | 2.54 | 0.57 | 0.61 | 1.21 | 1.12 | 3.14 | 0.76 |
| Oxytricha trifallax | UniProt | UP000006077 | 97.1 | 23559 | 3.63 | 1.57 | 0.15 | 2.68 | 1.07 | 0.59 | 0.56 | 1.44 | 2.27 | 0.58 |
| Stylonychia lemnae | UniProt | UP000039865 | 97.1 | 20720 | 3.22 | 1.81 | 0.17 | 2.26 | 1.05 | 0.62 | 0.55 | 1.31 | 2.49 | 0.62 |
| Pseudocohnilembus persalinus | UniProt | UP000054937 | 92.4 | 13175 | 7.36 | 1.39 | 0.18 | 1.76 | 0.37 | 0.32 | 1.00 | 1.00 | 3.26 | 0.61 |
| NCBI genetic code: 6 | group II ciliates | → Q | → Q | * | Q | Q | C | C | Y | Y | W | |||
| Aristerostoma | MMETSP | MMETSP0125 | 62.5 | 27868 | 0.96 | 1.04 | 0.15 | 2.65 | 0.97 | 0.71 | 0.68 | 1.35 | 2.49 | 0.8 |
| Favella ehrenbergii | MMETSP | MMETSP0123 | 85.4 | 26477 | 0.72 | 1.51 | 0.16 | 1.88 | 3.06 | 1.11 | 0.25 | 2.06 | 0.71 | 0.83 |
| Pseudokeronopsis | MMETSP | MMETSP0211 MMETSP1396 | 87.2 | 62574 | 1.04 | 1.37 | 0.16 | 2.05 | 2.58 | 0.94 | 0.44 | 2.18 | 1.40 | 0.78 |
| Strombidium inclinatum | MMETSP | MMETSP0208 | 83.6 | 32210 | 0.64 | 1.28 | 0.11 | 1.63 | 3.50 | 0.83 | 0.24 | 2.12 | 0.69 | 0.7 |
| Uronema spp. | MMETSP | MMETSP0018 | 52.6 | 13887 | 6.90 | 0.66 | 0.17 | 0.80 | 0.08 | 0.28 | 1.63 | 0.80 | 3.62 | 0.87 |
| NCBI genetic code: 1 | group III ciliates | * | * | * | Q | Q | C | C | Y | Y | W | |||
| Stentor coeruleus | UniProt | UP000187209 | 92.4 | 30969 | 0.16 | 0.08 | 0.01 | 2.77 | 0.89 | 0.63 | 1.03 | 0.86 | 3.1 | 0.93 |
| Climacostomum virens | MMETSP | MMETSP1397 | 94.7 | 33899 | 0.11 | 0.09 | 0.04 | 1.79 | 2.20 | 1.38 | 0.60 | 2.60 | 0.85 | 1.06 |
| Litonotus pictus | MMETSP | MMETSP0209 | 65.5 | 30222 | 0.08 | 0.03 | 0.01 | 2.12 | 1.52 | 0.63 | 0.77 | 1.83 | 2.25 | 0.54 |
| Protocruzia adherens | MMETSP | MMETSP0216 | 74.9 | 40577 | 0.07 | 0.04 | 0.04 | 2.91 | 1.24 | 0.69 | 0.94 | 1.30 | 1.83 | 1.00 |
| NCBI genetic code: 10 | group IV ciliate | * | * | → C | Q | Q | C | C | Y | Y | W | |||
| Euplotes focardii | MMETSP | MMETSP0205 MMETSP0206 | 60.8 | 36659 | 0.23 | 0.06 | 0.51 | 2.43 | 1.23 | 0.49 | 0.84 | 1.28 | 2.38 | 0.87 |
| NCBI genetic code: 4 | group IV ciliate | * | * | → W | Q | Q | C | C | Y | Y | W | |||
| Blepharisma japonicum | MMETSP | MMETSP1395 | 81.9 | 22714 | 0.13 | 0.03 | 0.30 | 2.85 | 1.24 | 0.94 | 0.80 | 0.94 | 2.72 | 0.84 |
| NCBI genetic code: 29 | group IV ciliate | → Y | → Y | * | Q | Q | C | C | Y | Y | W | |||
| Mesodinium pulex | MMETSP | MMETSP0467 | 88.9 | 61058 | 0.29 | 0.56 | 0.13 | 0.77 | 3.33 | 1.53 | 0.25 | 1.78 | 0.34 | 1.29 |
Table 2
Usage frequencies of TAA*, TAG*, TAAQ, TAGQ, CAAQ, and CAGQ codons in the entire proteomes of 26 different organisms.
| Species | CAA | CAG | TAA | TAG |
|---|---|---|---|---|
| Saccharomyces cerevisiae S288c | 2.73 (62.6%Q) | 1.21 (37.4%Q) | 0.11 | 0.05 |
| Candida albicans | 3.57 (84.6%Q) | 0.65 (15.4%Q) | 0.1 | 0.05 |
| Candida auris | 1.81 (46.1%Q) | 2.12 (53.9%Q) | 0.08 | 0.06 |
| Candida tropicalis | 3.61 (84.5%Q) | 0.66 (15.5%Q) | 0.1 | 0.07 |
| Neurospora crassa | 1.70 (39.5%Q) | 2.60 (60.5%Q) | 0.06 | 0.05 |
| Magnaporthe oryzae | 1.37 (33.7%Q) | 2.69 (66.3%Q) | 0.06 | 0.07 |
| Trichoderma reesei | 1.17 (28.4%Q) | 2.95 (71.6%Q) | 0.06 | 0.06 |
| Cryptococcus neoformans | 2.06 (53.5%Q) | 1.79 (46.5%Q) | 0.07 | 0.06 |
| Ustilago maydis | 1.82 (41.3%Q) | 2.61 (58.7%Q) | 0.04 | 0.05 |
| Taiwanofungus camphoratus | 1.57 (41.8%Q) | 2.19 (58.2%Q) | 0.05 | 0.06 |
| Dictyostelium discoideum | 4.86 (96.2%Q) | 0.19 (3.8%Q) | 0.16 | 0.01 |
| Plasmodium falciparum | 2.42 (86.7%Q) | 0.37 (13.3%Q) | 0.09 | 0.01 |
| Drosophila melanogaster | 1.56 (13.4%Q) | 3.61 (86.6%Q) | 0.08 | 0.07 |
| Aedes aegypti | 1.76 (40.6%Q) | 2.58 (59.4%Q) | 0.11 | 0.07 |
| Caenorhabditis elegans | 2.74 (65.6%Q) | 1.44 (34.4%Q) | 0.16 | 0.06 |
| Danio rerio | 1.18 (26.0%Q) | 3.35 (74.0%Q) | 0.11 | 0.06 |
| Mus musculus | 1.20 (26.0%Q) | 3.41 (74.0%Q) | 0.1 | 0.08 |
| Homo sapiens | 1.23 (26.5%Q) | 3.42 (73.5%Q) | 0.1 | 0.08 |
| Arabidopsis thaliana | 1.94 (56.1%Q) | 1.52 (43.9%Q) | 0.09 | 0.05 |
| Chlamydomonas reinhardtii | 0.59 (12.7%Q) | 4.05 (87.3%Q) | 0.03 | 0.04 |
| Tetrahymena thermophila | 2.04 (21.2%Q) | 0.48 (5.0%Q) | 5.46 (56.8%Q) | 1.63 (17.0%Q) |
| Paramecium tetraurelia | 2.54 (27.9%Q) | 0.57 (6.3%Q) | 4.53 (46.7%Q) | 1.48 (16.2%Q) |
| Oxytricha trifallax | 2.68 (29.9%Q) | 1.07 (12.0%Q) | 3.63 (40.6%Q) | 1.57 (17.5%Q) |
| Stylonychia lemnae | 2.26 (21.1%Q) | 1.05 (12.6%Q) | 3.22 (38.6%Q) | 1.81 (21.7%Q) |
| Pseudocohnilembus persalinus | 1.76 (18.0%Q) | 0.37 (3.8%Q) | 7.36 (76.0%Q) | 1.39 (14.4%Q) |
| Stentor coeruleus | 2.77 (75.7%Q) | 0.89 (24.3%Q) | 0.16 | 0.08 |
Author response table 1
Usage frequencies of TAA, TAG, TAAQ, TAGQ, CAAQ and CAGQ codonsin the entire proteomes of 20 different organisms.
| Species_name | CAA | CAG | TAA | TAG |
|---|---|---|---|---|
| Saccharomyces cerevisiae S288c | 2.73(62.6%Q) | 1.21(37.4%Q) | 0.11 | 0.05 |
| Candida albicans | 3.57(84.6%Q) | 0.65(15.4%Q) | 0.1 | 0.05 |
| Candida auris | 1.81(46.1%Q) | 2.12(53.9%Q) | 0.08 | 0.06 |
| Candida tropicalis | 3.61(84.5%Q) | 0.66(15.5%Q) | 0.1 | 0.07 |
| Neurospora crassa | 1.70(39.5%Q) | 2.60(60.5%Q) | 0.06 | 0.05 |
| Magnaporthe oryzae | 1.37(33.7%Q) | 2.69(66.3%Q) | 0.06 | 0.07 |
| Trichoderma reesei | 1.17(28.4%Q) | 2.95(71.6%Q) | 0.06 | 0.06 |
| Cryptococcus neoformans | 2.06(53.5%Q) | 1.79(46.5%Q) | 0.07 | 0.06 |
| Ustilago maydis | 1.82(41.3%Q) | 2.61(58.7%Q) | 0.04 | 0.05 |
| Taiwanofungus camphoratus | 1.57(41.8%Q) | 2.19(58.2%Q) | 0.05 | 0.06 |
| Dictyostelium discoideum | 4.86(96.2%Q) | 0.19(3.8%Q) | 0.16 | 0.01 |
| Plasmodium falciparum | 2.42(86.7%Q) | 0.37(13.3%Q) | 0.09 | 0.01 |
| Drosophila melanogaster | 1.56(13.4%Q) | 3.61(86.6%Q) | 0.08 | 0.07 |
| Aedes aegypti | 1.76(40.6%Q) | 2.58(59.4%Q) | 0.11 | 0.07 |
| Caenorhabditis elegans | 2.74(65.6%Q) | 1.44(34.4%Q) | 0.16 | 0.06 |
| Danio rerio | 1.18(26.0%Q) | 3.35(74.0%Q) | 0.11 | 0.06 |
| Mus musculus | 1.20(26.0%Q) | 3.41(74.0%Q) | 0.1 | 0.08 |
| Homo sapiens | 1.23(26.5%Q) | 3.42(73.5%Q) | 0.1 | 0.08 |
| Arabidopsis thaliana | 1.94(56.1%Q) | 1.52(43.9%Q) | 0.09 | 0.05 |
| Chlamydomonas reinhardtii | 0.59(12.7%Q) | 4.05(87.3%Q) | 0.03 | 0.04 |
| Tetrahymena thermophila | 2.04(21.2%Q) | 0.48(5.0%Q) | 5.46(56.8%Q) | 1.63(17.0%Q) |
| Paramecium tetraurelia | 2.54(27.9%Q) | 0.57(6.3%Q) | 4.53(46.7%Q) | 1.48(16.2%Q) |
| Oxytricha trifallax | 2.68(29.9%Q) | 1.07(12.0%Q) | 3.63(40.6%Q) | 1.57(17.5%Q) |
| Stylonychia lemnae | 2.26(21.1%Q) | 1.05(12.6%Q) | 3.22(38.6%Q) | 1.81(21.7%Q) |
| Pseudocohnilembus persalinus | 1.76(18.0%Q) | 0.37(3.8%Q) | 7.36(76.0%Q) | 1.39(14.4%Q) |
| Stentor coeruleus | 2.77(75.7%Q) | 0.89(24.3%Q) | 0.16 | 0.08 |
Author response table 2
S. cerevisiae strains used in this study.
| Name | Genotype |
|---|---|
| WHY13008 | MATa, ho, leu2, ura3, his 4-X::LEU2-(NgoMIV;+ ori)-URA3, ERGI(SpeI), RAD51::hphMX4 |
| WHY13283 | MATa, ho, leu2, ura3, his 4-X::LEU2-(NgoMIV;+ ori)-URA3, ERGI(SpeI), rad51A::hphMX4 |
| WHY13416 | MATa, ho, leu2, ura3, his4-X::LEU2-(NgoMIV;+ori)-URA3, ERGI(SpeI), rad51 /_\N::hphMX4 |
| WHY13744 | |
| WHY13743 | |
| WHY13741 | MATa, ho::LYS2, leu2, ura3, lys2, HIS4::LEU2-(BamHI;+ori), ERGI(SalI), SUP35 ^(PND ")-rad51AN::hphMX4" |
| WHY10271 | MATa, ho::hisG, lys2, leu2::hisG, arg4-nsp, ura3 |
| WHY13970 | MATa his 3Delta1, leu 2Delta0, met15 Delta0, ura3 Delta0 |
| WHY13785 | MATa his 3Delta1, leu 2Delta0, met 15 Delta0, ura 3Delta0, hsp104::kanMX4 |
| WHY14126 | MATa his 3Delta1, leu 2Delta0, met 15 Delta0, ura 3Delta0, new 1::kan MX4 |
| WHY14129 | MATa his 3Delta1, leu 2Delta0, met 15 Delta0, ura 3Delta0, doa 4::kan MX4 |
| WHY14227 | |
| WHY13989 | MATa his 3Delta1, leu 2Delta0, met 15 Delta0, ura 3Delta0,san 1:'kan MX4 |
| WHY14132 | MATa his 3Delta1, leu 2Delta0, met 15 Delta0, ura 3Delta0, oaz 1:'kan MX4 |
Additional files
-
MDAR checklist
- https://cdn.elifesciences.org/articles/91405/elife-91405-mdarchecklist1-v1.pdf
-
Supplementary file 1
Plasids, yeast strains, PCR primers, and home-made software tools.
- https://cdn.elifesciences.org/articles/91405/elife-91405-supp1-v1.docx
-
Source data 1
- https://cdn.elifesciences.org/articles/91405/elife-91405-data1-v1.xlsx
Download links
A two-part list of links to download the article, or parts of the article, in various formats.
Downloads (link to download the article as PDF)
Open citations (links to open the citations from this article in various online reference manager services)
Cite this article (links to download the citations from this article in formats compatible with various reference manager tools)
Noncanonical usage of stop codons in ciliates expands proteins with structurally flexible Q-rich motifs
eLife 12:RP91405.
https://doi.org/10.7554/eLife.91405.3


