Revealing a hidden conducting state by manipulating the intracellular domains in KV10.1 exposes the coupling between two gating mechanisms
- Oncophysiology Group. Max Planck Institute for Multidisciplinary Sciences, City Campus, Germany
- Neurophysics Laboratory, Göttingen Campus Institute for Dynamics of Biological Networks, Germany
Figures
Figure 1 with 1 supplement
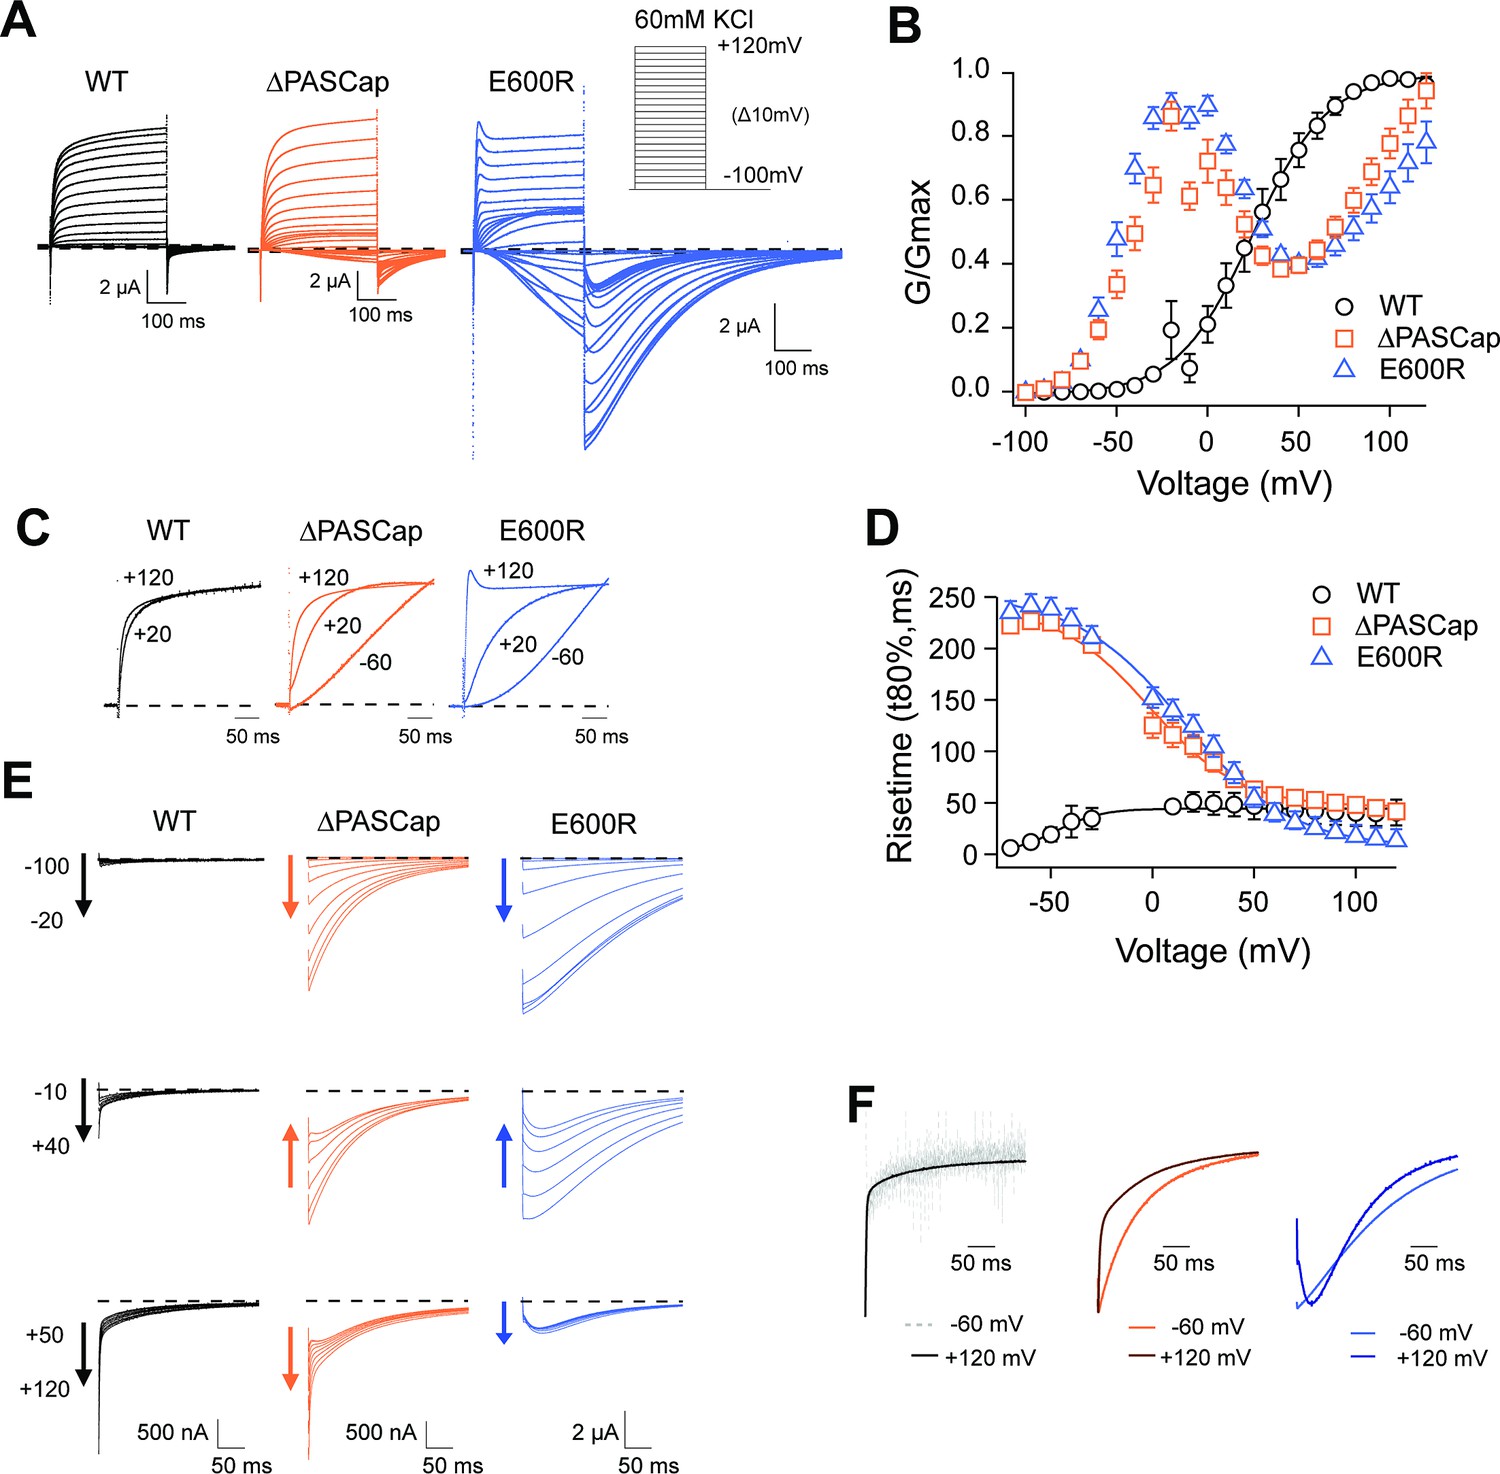
Characterization of ΔPASCap and E600R mutants.
(A) Raw current traces resulting from depolarizations between –100 and +120 mV in WT (black), ΔPASCap (orange), and E600R (blue). The dashed lines indicate zero current. The stimulus protocol is schematically depicted in the inset. The extracellular solution contained 60 mM KCl, 57.5 mM NaCl, 10 mM HEPES, 1.8 mM CaCl2, pH = 7.4 (B) GV plots corresponding to the three channel variants (colors as in A). (N: WT = 6, ∆PASCap = 7, E600R=11; mean ± SEM) (C). Normalized traces to the indicated voltages to reveal the acceleration of activation with depolarization in the mutants. WT does not give rise to significant outward current at –60 mV. (D) Rise time of ΔPASCap and E600R as a function of voltage (colors as in A). The activation is much slower than in WT up to +50 mV but reaches the speed of WT with stronger stimuli. (E) Tail currents at –100 mV after depolarizations to potentials in the weak, medium, or strong range (up to down, see text for details). The arrows indicate the direction of the change in tail peak amplitude with increasing voltage. (F) Normalized tail currents at –100 mV after depolarizations to the indicated voltages.
-
Figure 1—source data 1
Stimulus voltage and individual current amplitudes related to Figure 1B.
- https://cdn.elifesciences.org/articles/91420/elife-91420-fig1-data1-v1.xlsx
-
Figure 1—source data 2
Stimulus voltage and individual rising times related to Figure 1D.
- https://cdn.elifesciences.org/articles/91420/elife-91420-fig1-data2-v1.xlsx
Figure 1—figure supplement 1
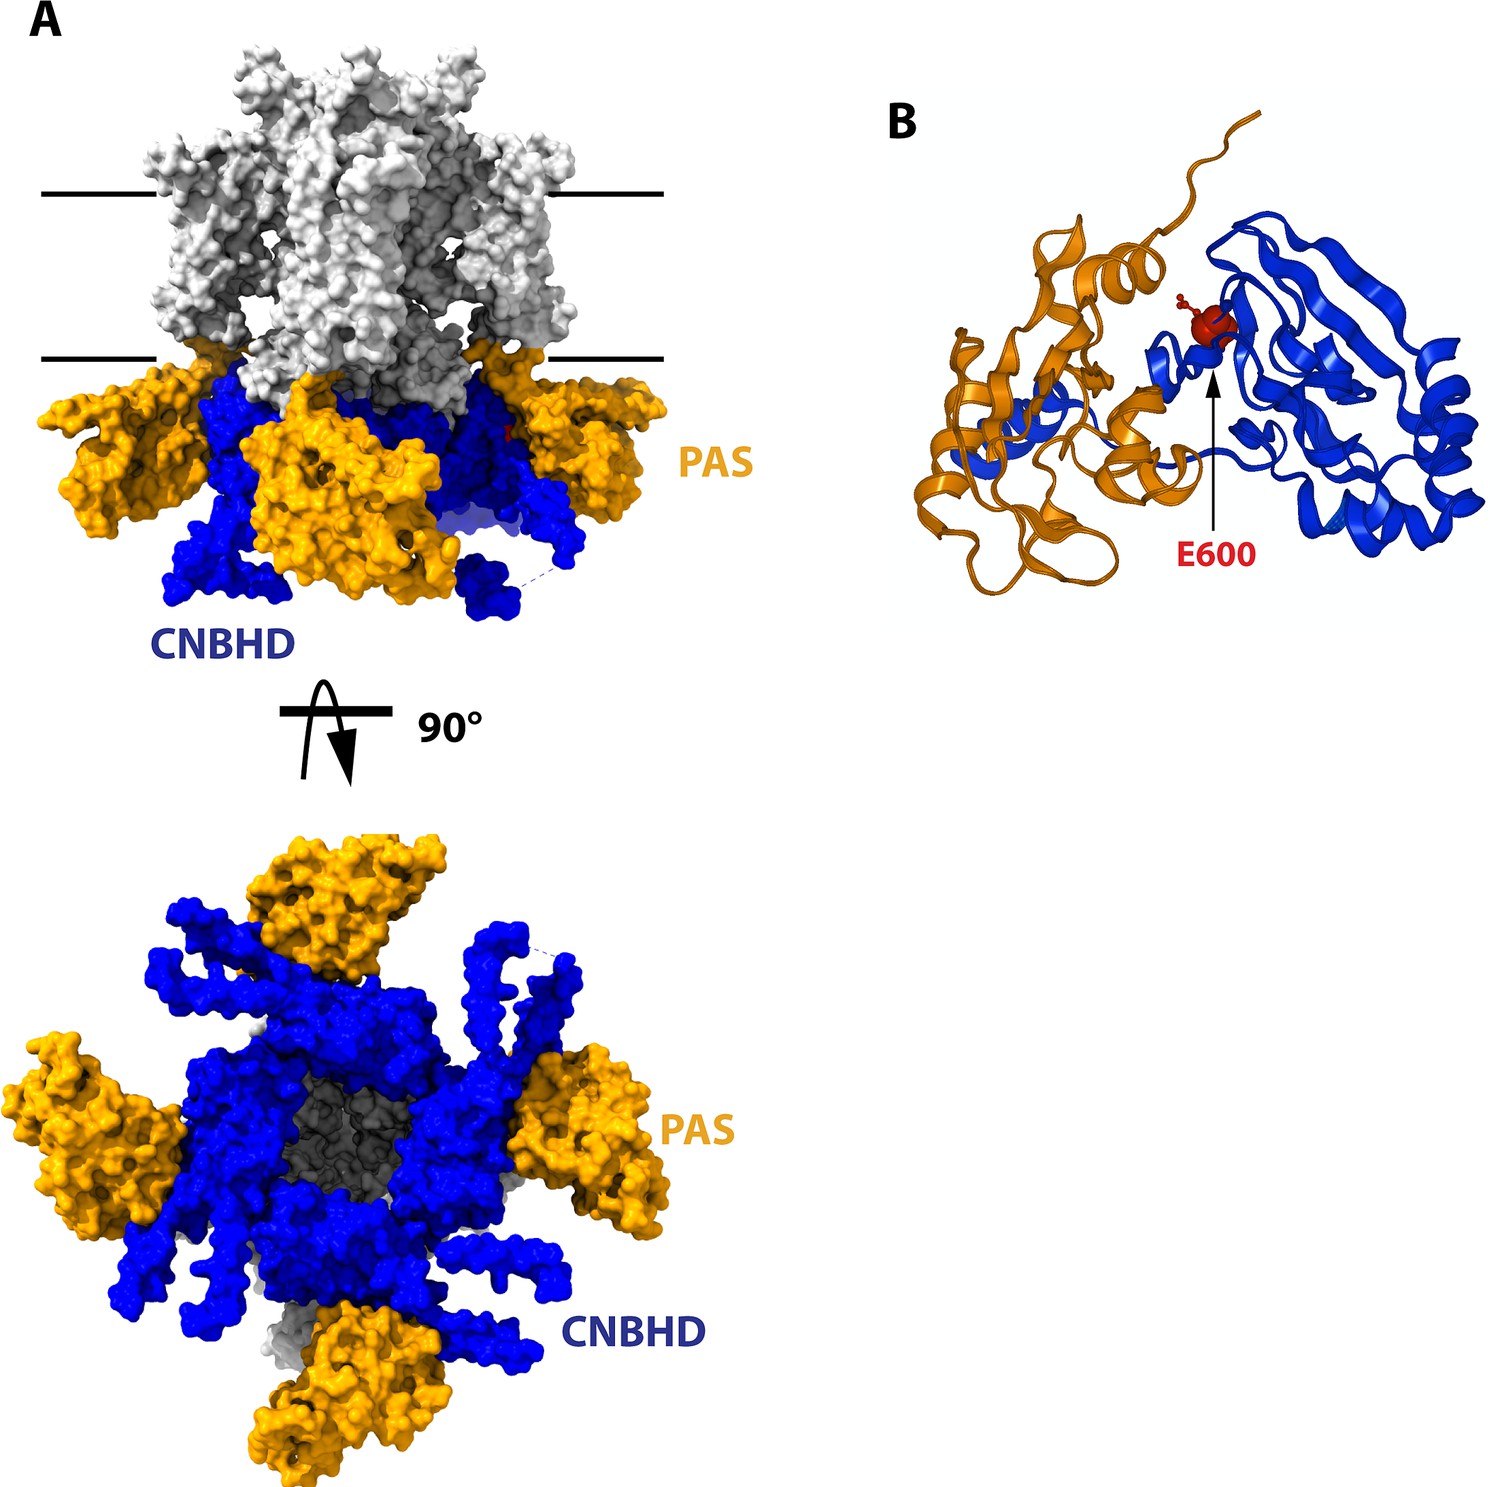
Structure of the cytoplasmatic ring of Kv10.1.
(A) Space-filling model from the side and from the cytoplasmatic side (bottom). The PAS domains are represented in orange, and the CNBHD is colored in blue. The rest of the protein is drawn in white. Black lines indicate the thickness of the membrane. (B) Schematic representation of the PAS domain on one subunit and its interaction with the CNBHD of another subunit. The position of E600, used in this work, is indicated in red. The structures are based on 8EOW (Mandala and MacKinnon, 2022), with the voltage sensor in the uppermost configuration.
Figure 2
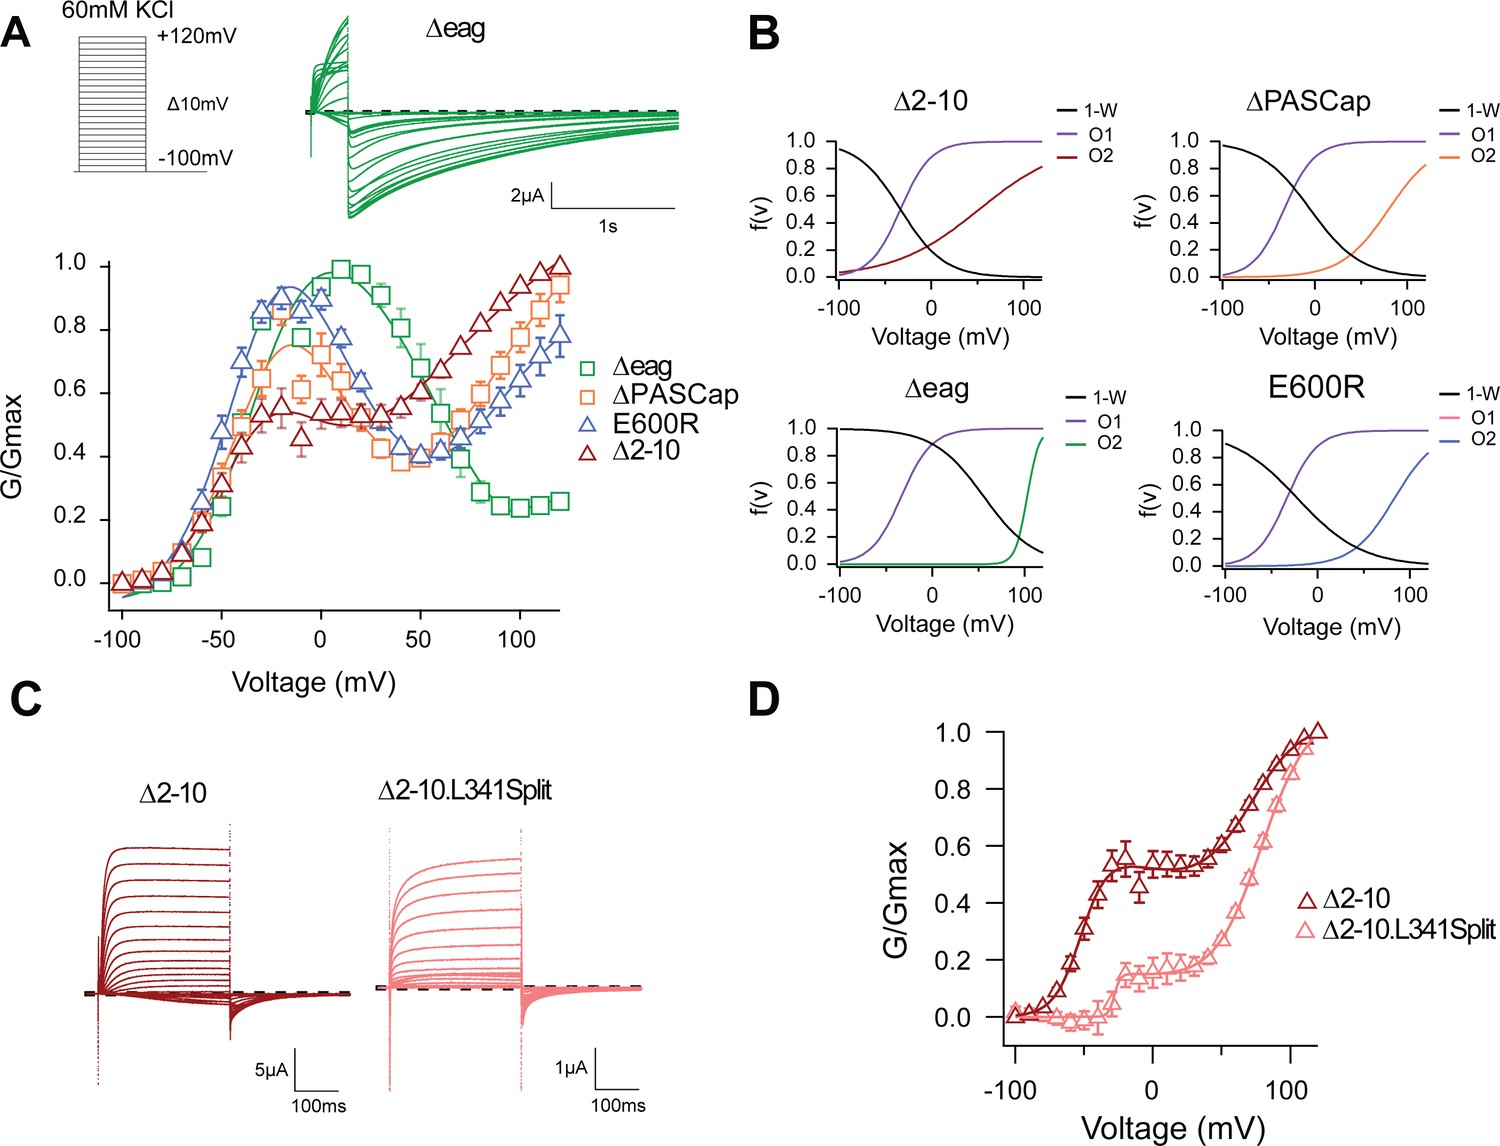
The biphasic GV corresponds to two sequential events.
(A) The GV of all tested mutants show biphasic behavior. (N: ∆2–10=6, ∆PASCap = 7, ∆eag = 7, E600R=11; mean ± SEM). All are well described by Equation 3b in a global fit with fixed parameters for the first component. (B) Distribution of the three components used for the fits as a function of voltage. (C). A discontinuous form of ∆2–10 shows attenuated biphasic behavior. (D) GV plots of ∆2–10 and ∆2–10.L341Split (N: ∆2–10=6, ∆2–10.L341Split = 5; ± SEM). Split fitted using Equation 3b. The dashed lines in A and C indicate zero current. The stimulus protocol is schematically depicted in the inset in A. The extracellular solution contained 60 mM KCl.
-
Figure 2—source data 1
Stimulus voltage and individual current amplitudes related to Figure 2A.
- https://cdn.elifesciences.org/articles/91420/elife-91420-fig2-data1-v1.xlsx
-
Figure 2—source data 2
Stimulus voltage and individual current amplitudes related to Figure 2D.
- https://cdn.elifesciences.org/articles/91420/elife-91420-fig2-data2-v1.xlsx
Figure 3
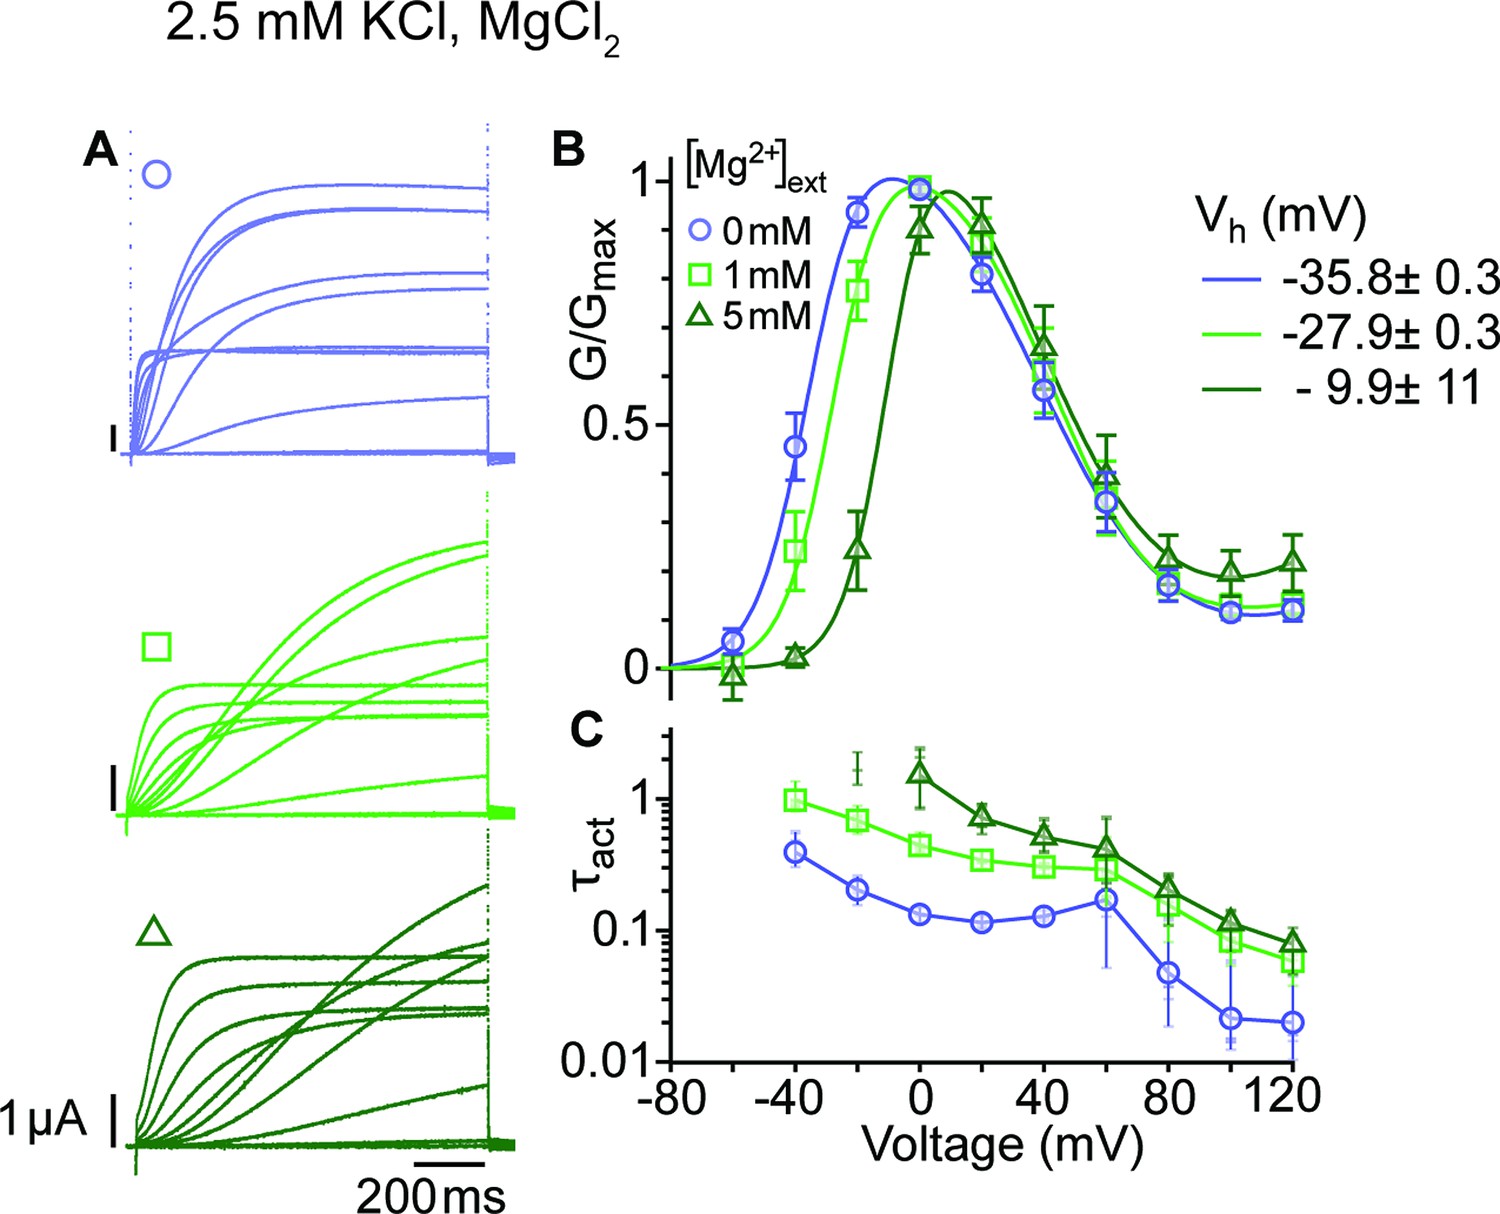
Mg2+ induces a shift of the first component in the depolarizing direction.
(A) Raw current traces from oocytes expressing ∆eag channels in response to depolarizations from a holding potential of –100 mV to voltages between –100 and +120 mV in the presence of 0, 1 or 5 mM MgCl2 in the external solution (legend in B). Scale bars are 1μA and 200ms. (B) Average GV plots (with SEM) obtained under the same conditions from n=6, 6, and 5 recordings (0, 1, and 5 mM MgCl2). The Vhalf of the first component shifts from –35.8 mV in the absence of extracellular Mg2+ to –27.9 and –9.9 mV in 1 mM and 5 mM MgCl2. (C). Time constants of the early activation show the decelerating effect of Mg2+. Symbols depict averages, vertical lines the range and horizontal lines individual experiments. For voltages where conductances or time constants could not be reasonably estimated no data are displayed. The recordings were performed in an external solution containing 115 mM NaCl, 1.8 mM CaCl2, 2.5 mM KCl, 10 mM Hepes pH 7.2, and the indicated concentrations of MgCl2.
-
Figure 3—source data 1
Stimulus voltage and individual current amplitudes related to Figure 3A.
- https://cdn.elifesciences.org/articles/91420/elife-91420-fig3-data1-v1.xlsx
-
Figure 3—source data 2
Stimulus potential and individual values of activation time constant related to Figure 3B.
- https://cdn.elifesciences.org/articles/91420/elife-91420-fig3-data2-v1.xlsx
Figure 4
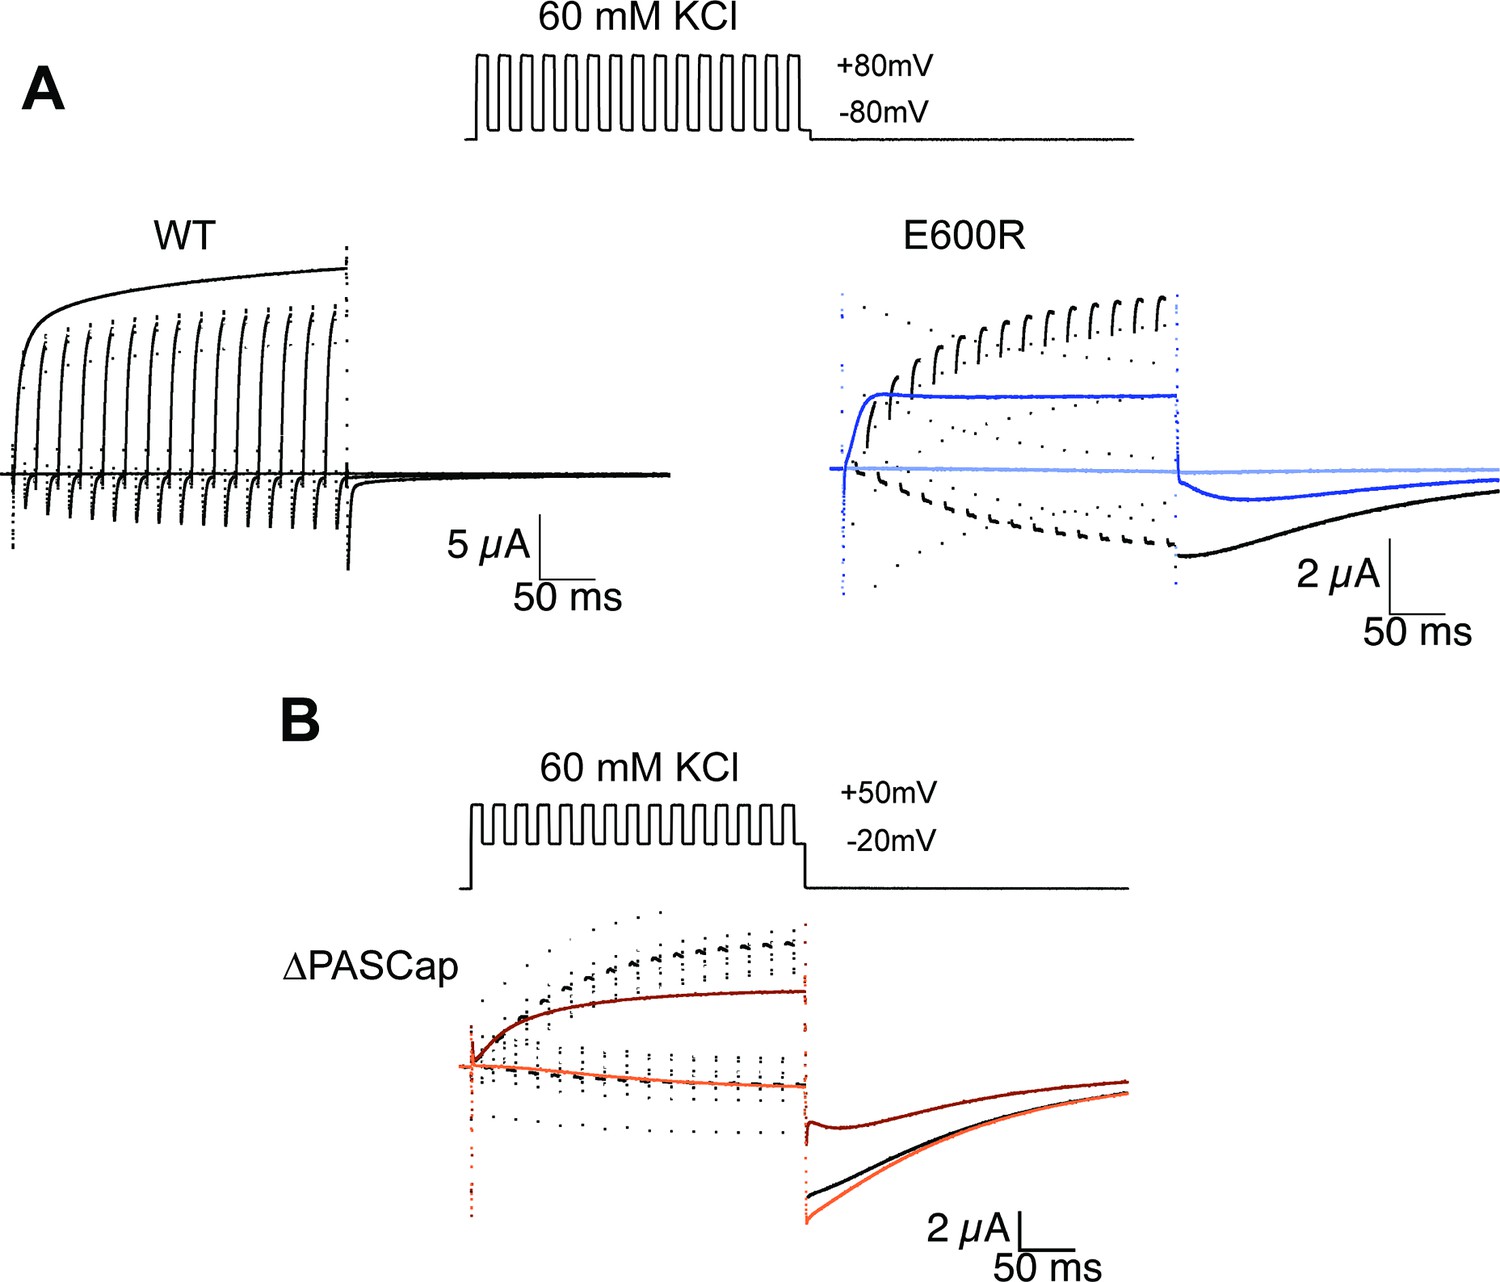
Alternating stimuli reveal larger macroscopic conductance for O1.
(A) Alternating potential between –80 and +80 mV in the WT results in current amplitudes that are smaller than those during a sustained stimulus (Upper left traces). In contrast, E600R gave rise to larger currents when the stimulus was intermittent and too short to allow occupancy of O2 (upper right). Current traces in response to a sustained stimulus are shown in blue (dark trace +80 mV; light trace is –80 mV) (B) The effect was qualitatively similar for ΔPASCap, which consistently gave rise to larger current upon oscillating stimuli between –20 and +50 mV than during a constant pulse to +50 mV. Current traces in response to a sustained stimulus are shown in orange (dark trace +50 mV; light trace is –20 mV). The stimulus protocol for A and B is schematically depicted in the inset. The extracellular solution contained 60 mM KCl.
Figure 5 with 1 supplement
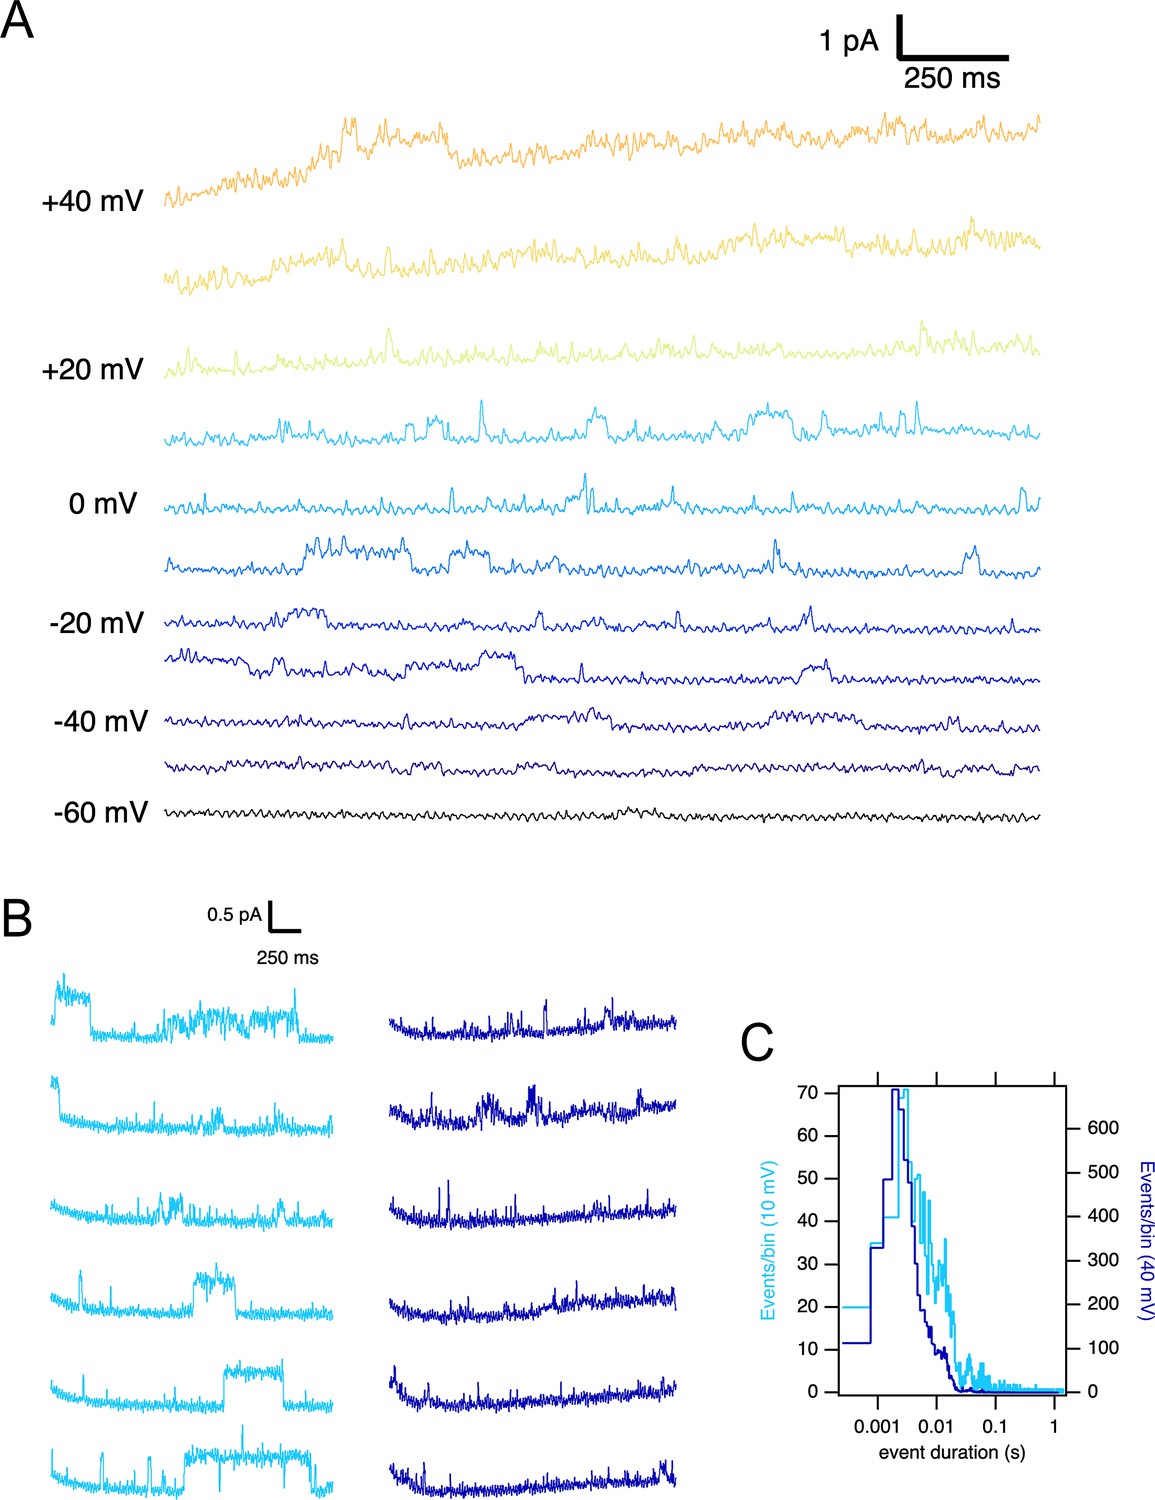
Single ∆PASCap channels reveal longer open times at moderate depolarizations.
(A) Representative current traces at the indicated voltages obtained from a holding potential of –100 mV. (B) Comparison between traces obtained at +10 mV (light blue) and +40 mV (dark blue). The time spent in the open state is much longer at +10 mV. (C). Open time distribution for events shorter than 50ms obtained from currents in an experiment like the one depicted in B (100 stimuli at each potential).
Figure 5—figure supplement 1
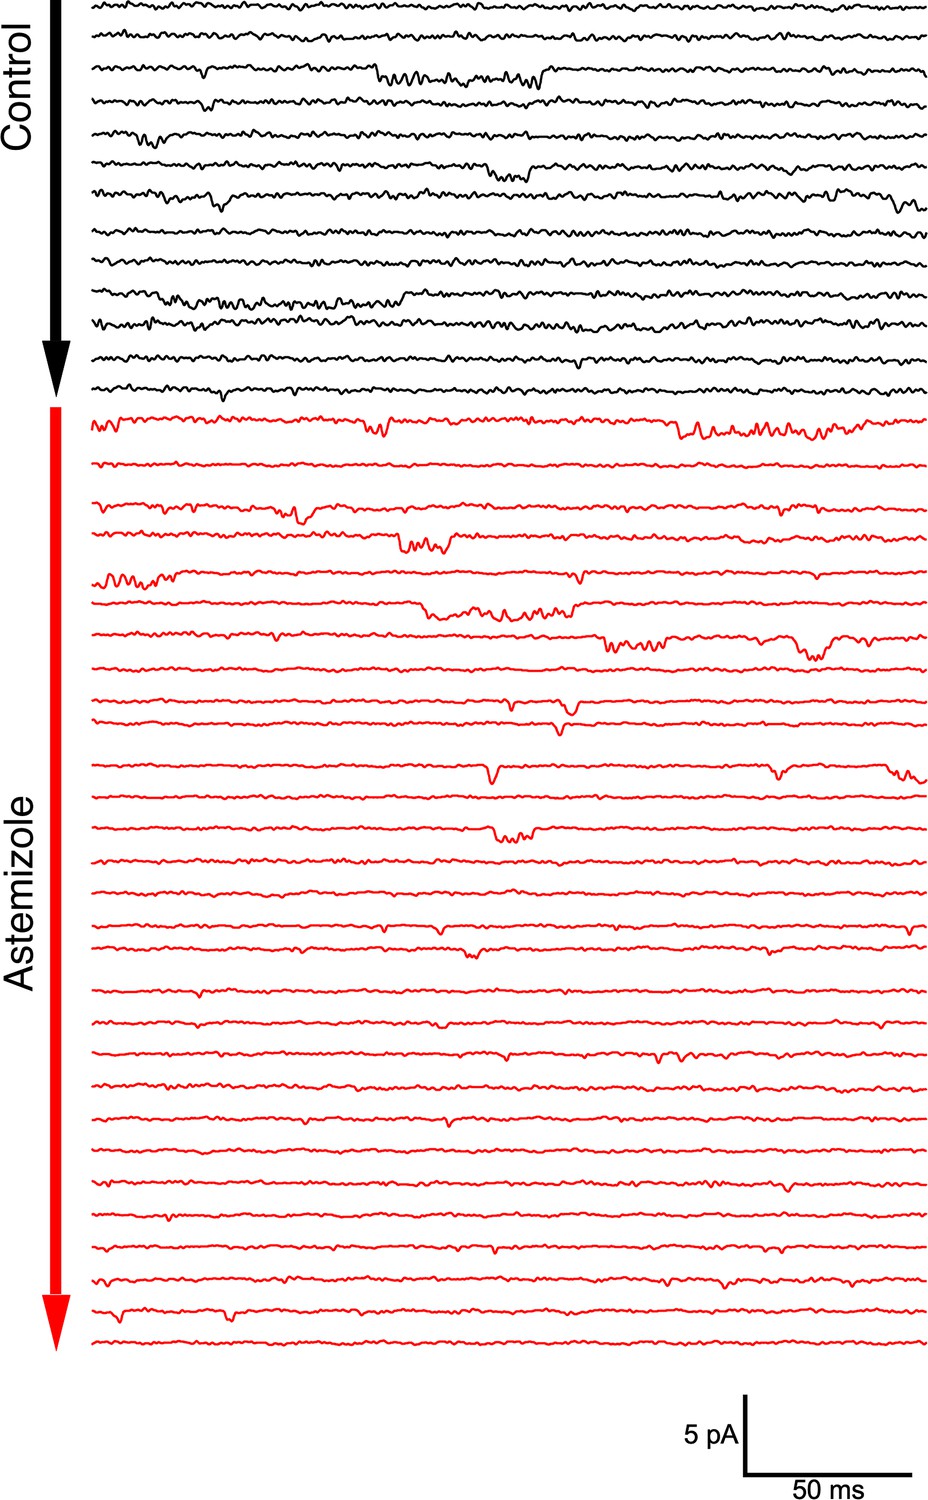
Single channel activity in an outside-out patch from an oocyte expressing ΔPasCap.
Traces were obtained by depolarizing from –100 mV to –60 mV in 10 s intervals. After 30 pulses in the control solution (60 mM extracellular KCl, black traces), the patch was exposed to 100 µM Astemizole (red traces). The delay in the onset of the block can be attributed to the time required to reach the internal side of the patch and the slow effect of Astemizole reported in macroscopic currents.
Figure 6
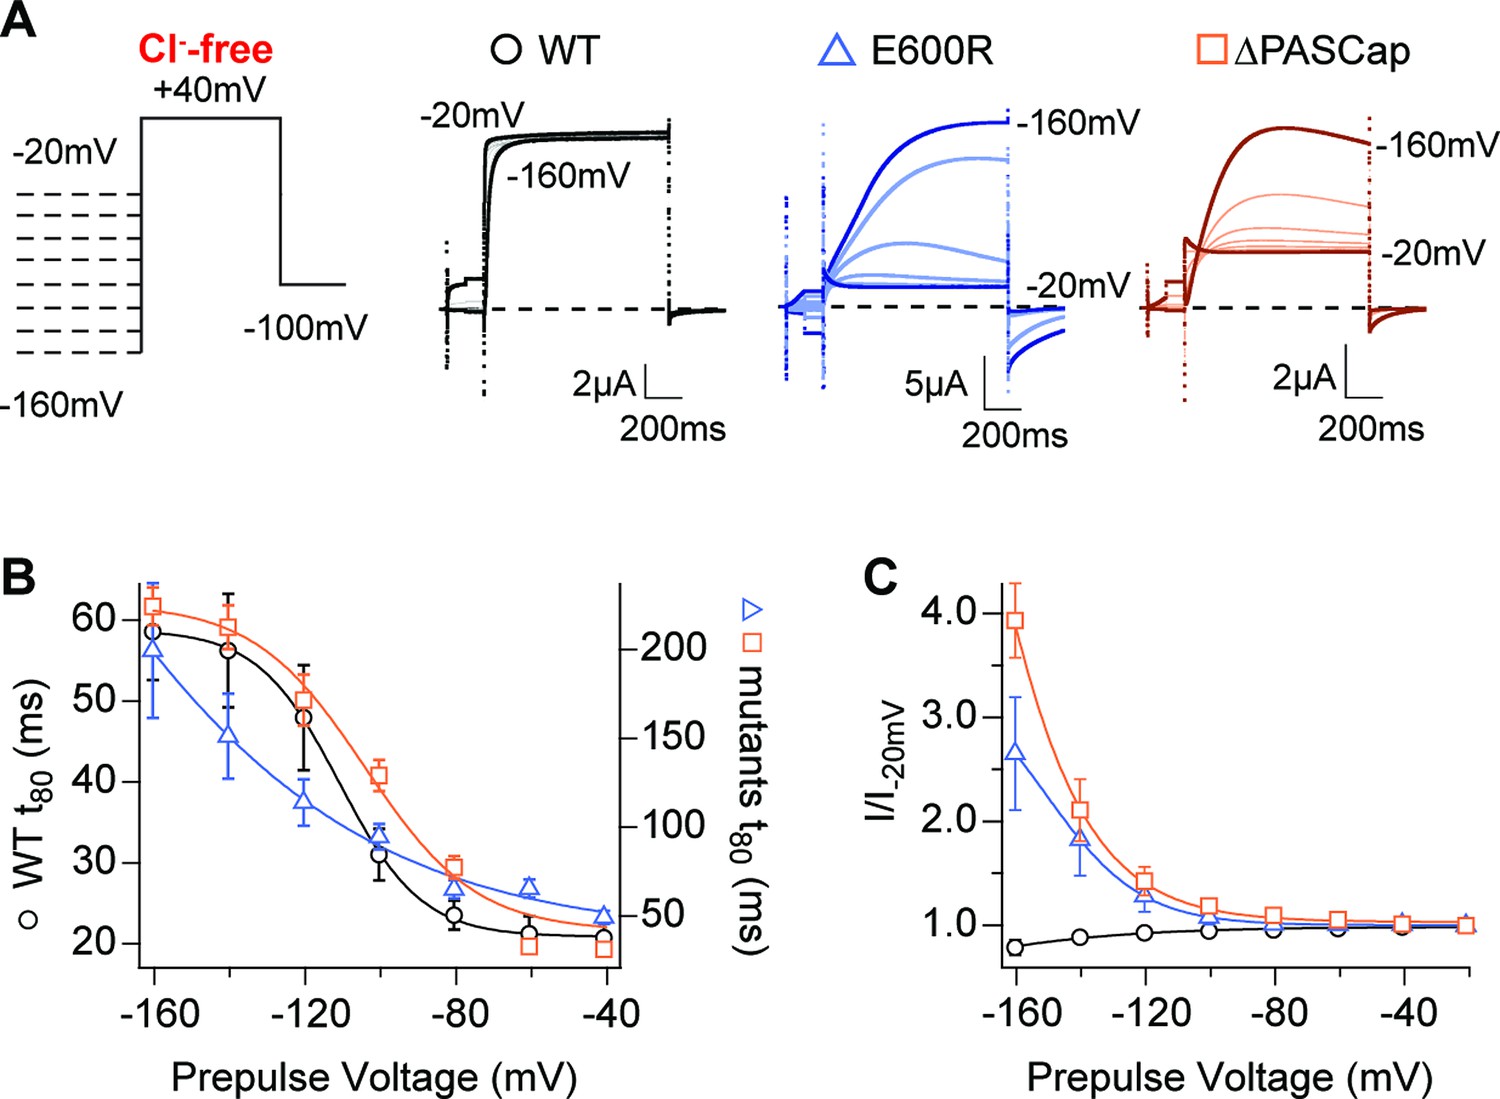
Hyperpolarization promotes access to a large conductance, slowly activating open state.
(A) Raw current traces in response to the stimuli depicted in the scheme. (B) The rise time to 80% of the maximal current during the depolarizing stimulus is plotted vs. prepulse voltage (N: WT = 7, ∆PASCap = 9, E600R=8; mean ± SEM). Although the activation is much slower for both mutants (note the different y axis for the mutants), they retain a strong dependence on the prepulse potential. (C) Normalized end-pulse current (I/I-20) is plotted vs. prepulse voltage (N: WT = 10, ∆PASCap = 8, E600R=8; mean ± SEM). The amplitude of the current at +40 mV increased markedly when the holding potential was below –100 mV in the mutants, while the amplitude in WT changed only marginally. The dashed lines indicate zero current. The stimulus protocol is schematically depicted in the inset. A 5 s pre-pulse was applied, of which only the initial and last 100ms were recorded. The chloride-free extracellular solution contained 115 mM Na-methanesulfonate, 2.5 mM KOH, 10 mM Hepes, 1.8 mM Ca(OH)2, pH = 7.2.
-
Figure 6—source data 1
Conditioning potential and individual rise times related to Figure 6B.
- https://cdn.elifesciences.org/articles/91420/elife-91420-fig6-data1-v1.xlsx
-
Figure 6—source data 2
Prepulse potential and amplitudes normalized to the –20 mV condition related to Figure 6C.
- https://cdn.elifesciences.org/articles/91420/elife-91420-fig6-data2-v1.xlsx
Figure 7
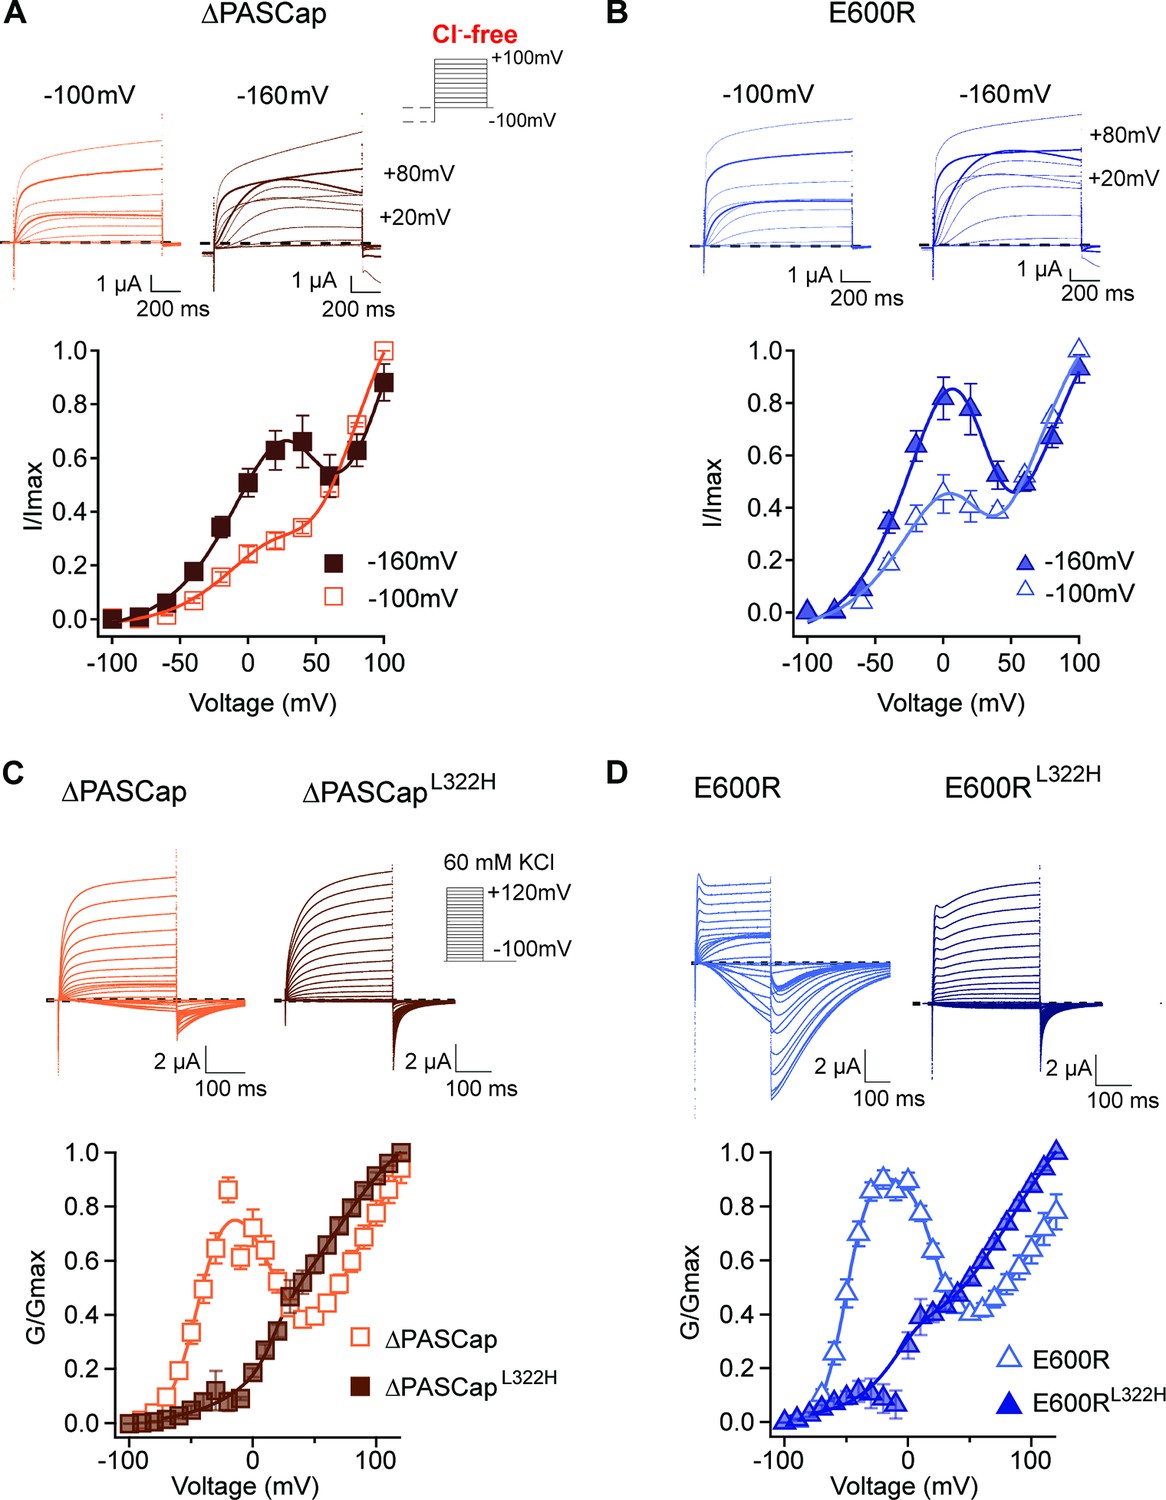
Deep closed states facilitate access to O1.
(A, B) Conditioning pulses to –160 mV potentiated the first component and hence the biphasic behavior of the I/V relationships for ∆PASCap (A) and E600R (B). (N: ∆PASCap = 7, E600R=6; mean ± SEM) The stimulus protocol is schematically depicted in the inset. A 5 s prepulse to –160 or –100 mV was applied, which is not shown in stimulus cartoons or current traces. The extracellular solution did not contain chloride. (C, D) A mutation known to impair access to deep closed states (L322H) largely removes the initial phase of the GV curves for ∆PASCap (C) and E600R (D). (N: ∆PASCap = 7, ∆PASCapL322H = 6, E600R=11, E600RL322H=7; mean ± SEM). Recordings were performed in a solution containing 60 mM KCl. The stimulus protocols are depicted schematically in the insets. The dashed lines indicate zero current.
-
Figure 7—source data 1
Stimulus potential and individual normalized amplitudes in ∆PASCap after prepulse voltages of –100 and –160 mV.
Related to Figure 7A.
- https://cdn.elifesciences.org/articles/91420/elife-91420-fig7-data1-v1.xlsx
-
Figure 7—source data 2
Stimulus potential and individual normalized amplitudes in E600R after prepulse voltages of –100 and –160 mV.
Related to Figure 7B.
- https://cdn.elifesciences.org/articles/91420/elife-91420-fig7-data2-v1.xlsx
-
Figure 7—source data 3
Stimulus potential and individual normalized amplitudes in ∆PASCap and ∆PASCapL322H.
Related to Figure 7C.
- https://cdn.elifesciences.org/articles/91420/elife-91420-fig7-data3-v1.xlsx
-
Figure 7—source data 4
Stimulus potential and individual normalized amplitudes in E600R and E600R L322H.
Related to Figure 7D.
- https://cdn.elifesciences.org/articles/91420/elife-91420-fig7-data4-v1.xlsx
Figure 8 with 4 supplements
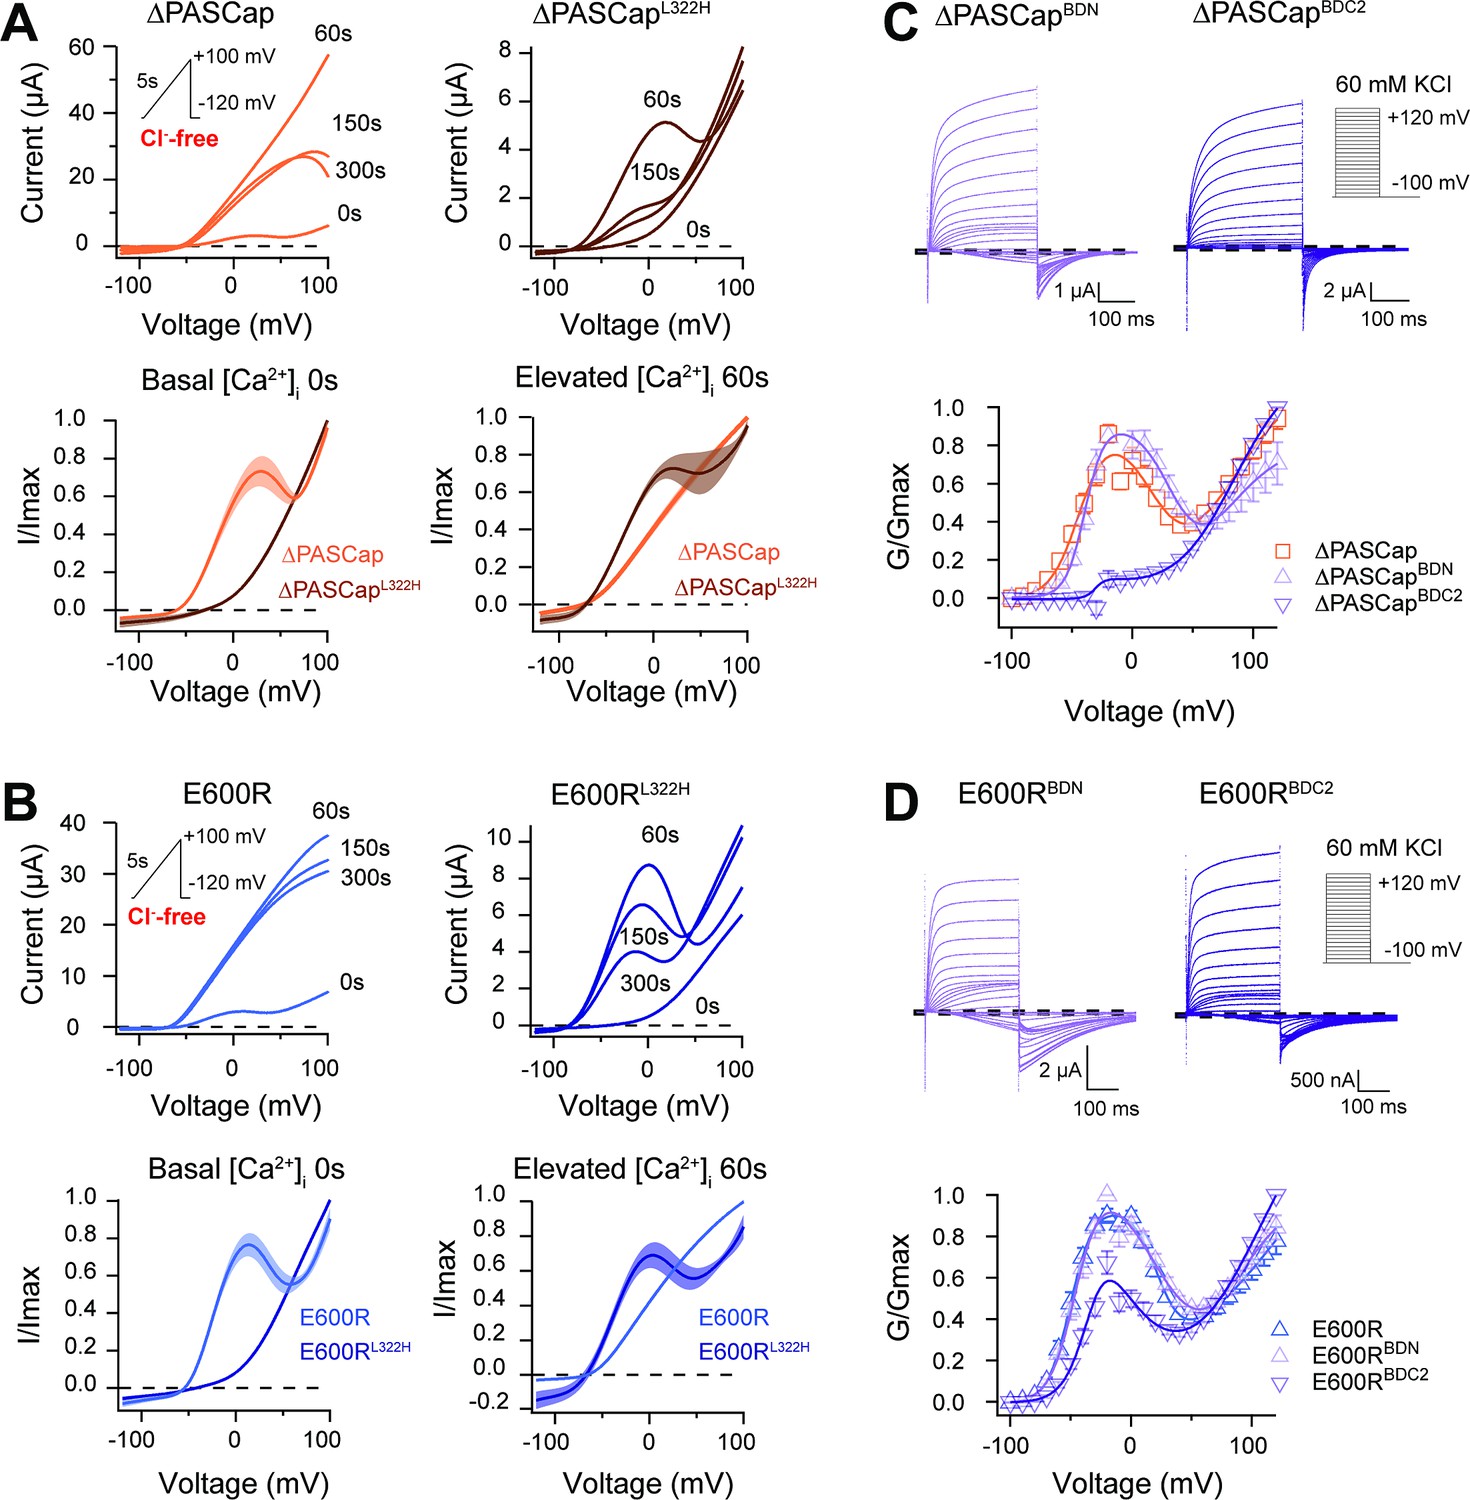
CaM stabilizes O1.
(A) A transient rise in intracellular Ca2+ using 5 µM ionomycin and thapsigargin increases ∆PASCap current amplitude (in the absence of external chloride) and the IV relationship becomes linear (upper left traces). The same treatment in a channel carrying a mutation (L322H), reducing access to deep closed states, results in the appearance of a biphasic IV upon Ca2+ rise (upper right traces). The lower traces represent the average normalized response comparing 0 and 60 s. (∆PASCap, light trace, N=8, ∆PASCapL322H, dark trace, N=5; the shadowed area indicates SEM). (B) E600R behavior is comparable to ∆PASCap. Average normalized traces (E600R, light trace, N=10; E600RL322H, dark trace, N=11; the shadowed area indicates SEM) are represented in the lower panel. The ramp protocol for A and B is schematically represented in the inset. The extracellular solution contained 2.5 mM K+ and no chloride. The dashed lines indicate zero current level. (C) Mutation of the C-terminal CaM binding domain (BDC2) in ∆PASCap strongly reduces the first component of the biphasic GV, while deletion of the N-terminal binding site (BDN) did not have any effect (N: ∆PASCap = 7, ∆PASCapBDN = 7, ∆PASCapBDC2=7; mean ± SEM). (D) The reduction of the first component in E600R when the C-terminal CaM binding site is mutated is also present but less intense. (N: E600R=11, E600RBDN = 9, E600RBDC2=11; mean ± SEM). The experimental protocols for C and D are represented in the insets. Currents were recorded in the presence of 60 mM KCl. The dashed lines indicate zero current level.
-
Figure 8—source data 1
Stimulus potential and individual normalized amplitudes in ∆PASCap, ∆PASCapBDN ∆PASCapBDC2.
Related to Figure 8C.
- https://cdn.elifesciences.org/articles/91420/elife-91420-fig8-data1-v1.xlsx
-
Figure 8—source data 2
Stimulus potential and individual normalized amplitudes in E600R, E600RBDN, and E600RBDC2.
Related to Figure 8D.
- https://cdn.elifesciences.org/articles/91420/elife-91420-fig8-data2-v1.xlsx
Figure 8—figure supplement 1
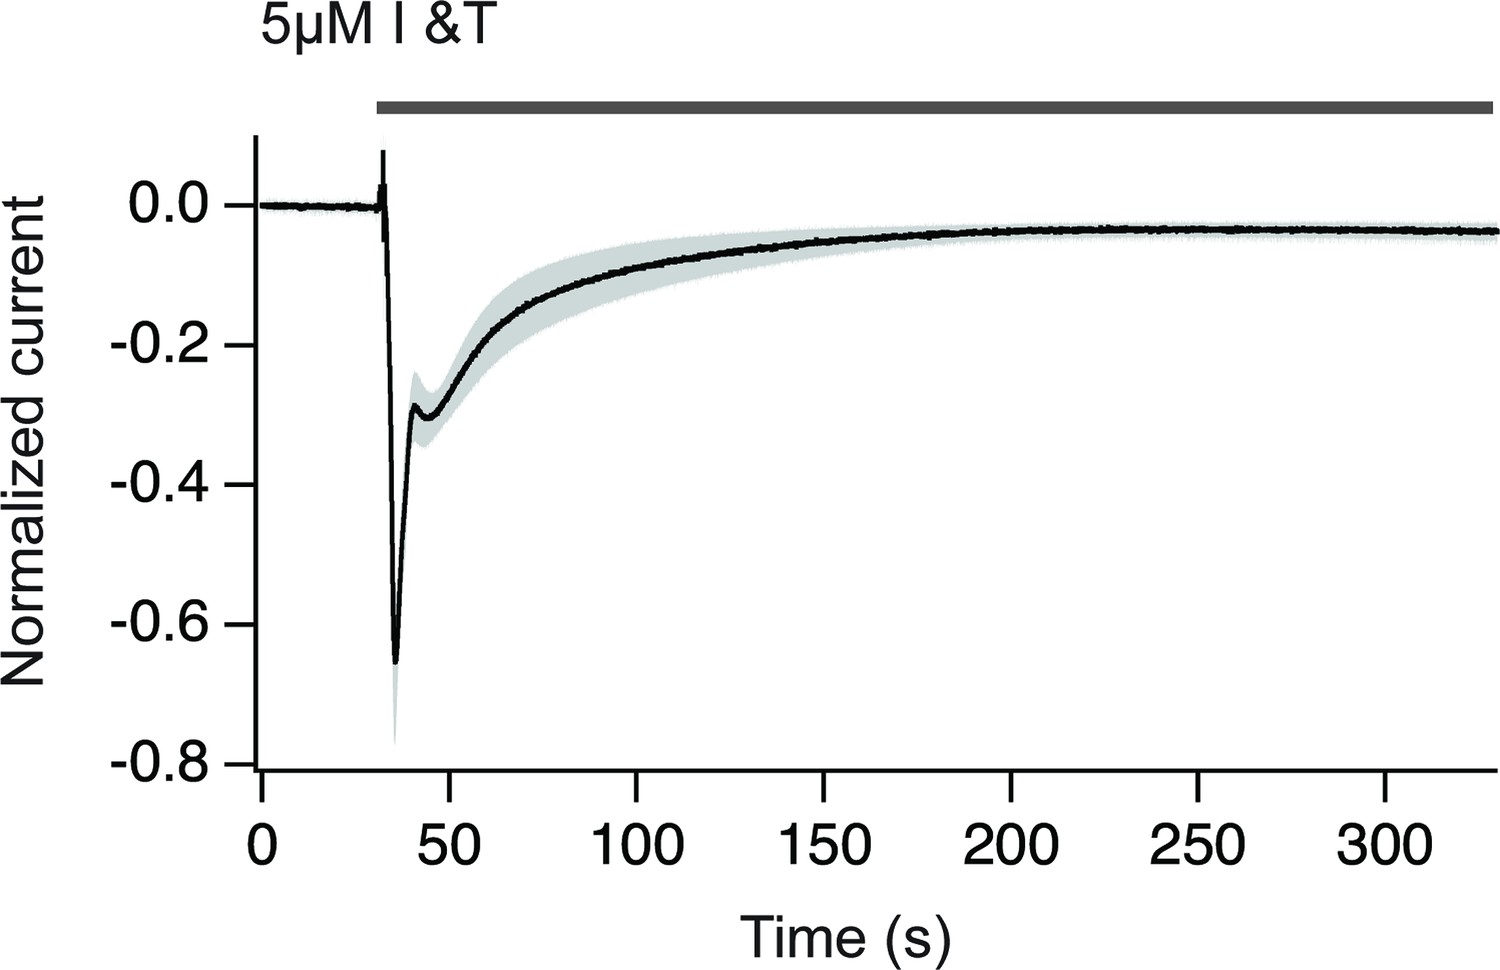
Chloride currents obtained upon treatment with ionomycin plus thapsigargin.
The increase in cytosolic Ca2+ translates in a Cl- current that can be used to estimate the amplitude and duration of the Ca2+ increase. Notice that Ca2+ returns to basal levels in approximately 150 s. The gray area indicates SEM. N=9.
Figure 8—figure supplement 2
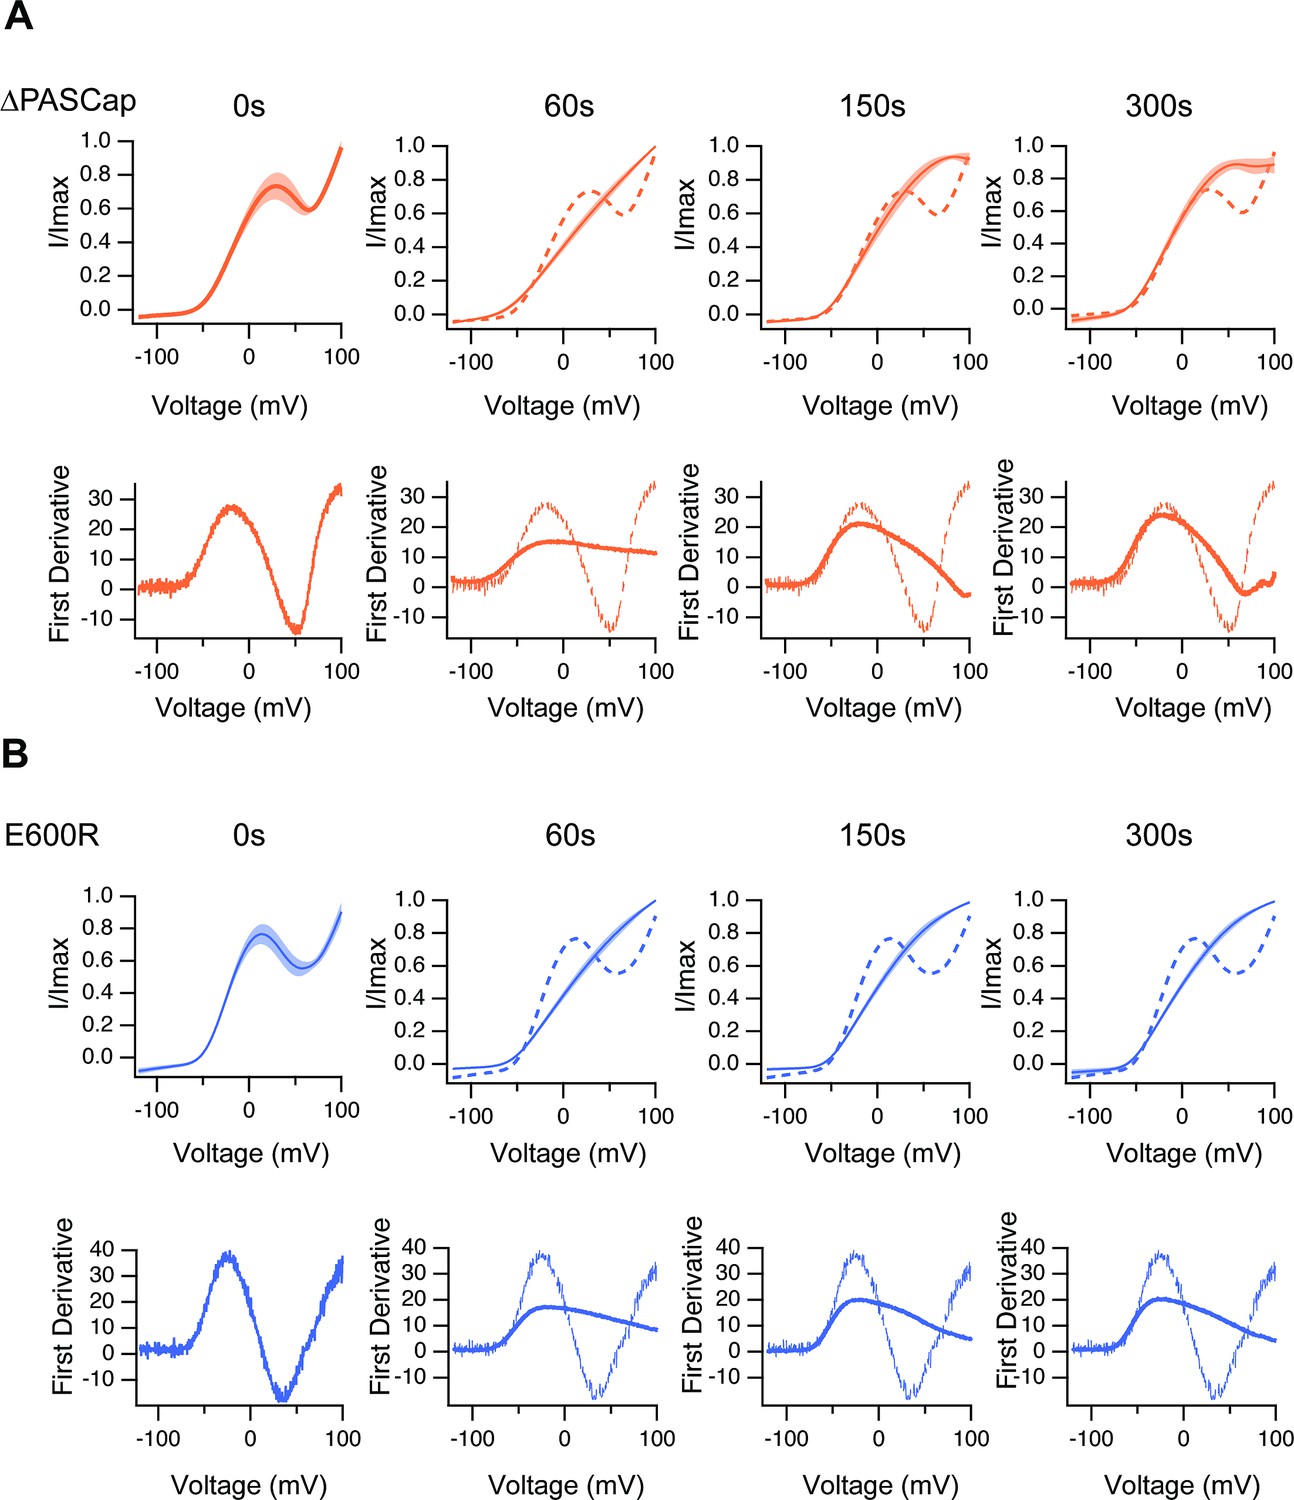
The upper traces show the average of normalized ramps at the indicated times for ∆PASCap (A) and E600R (B) after induction of Ca2+ rise.
At 60, 150, and 300 s, the dashed line corresponds to the ramp at time 0. The shadowed area indicates SEM (N: ∆PASCap = 8, E600R=10). The lower panels correspond to the first derivative of the current traces to illustrate the changes in slope.
Figure 8—figure supplement 3
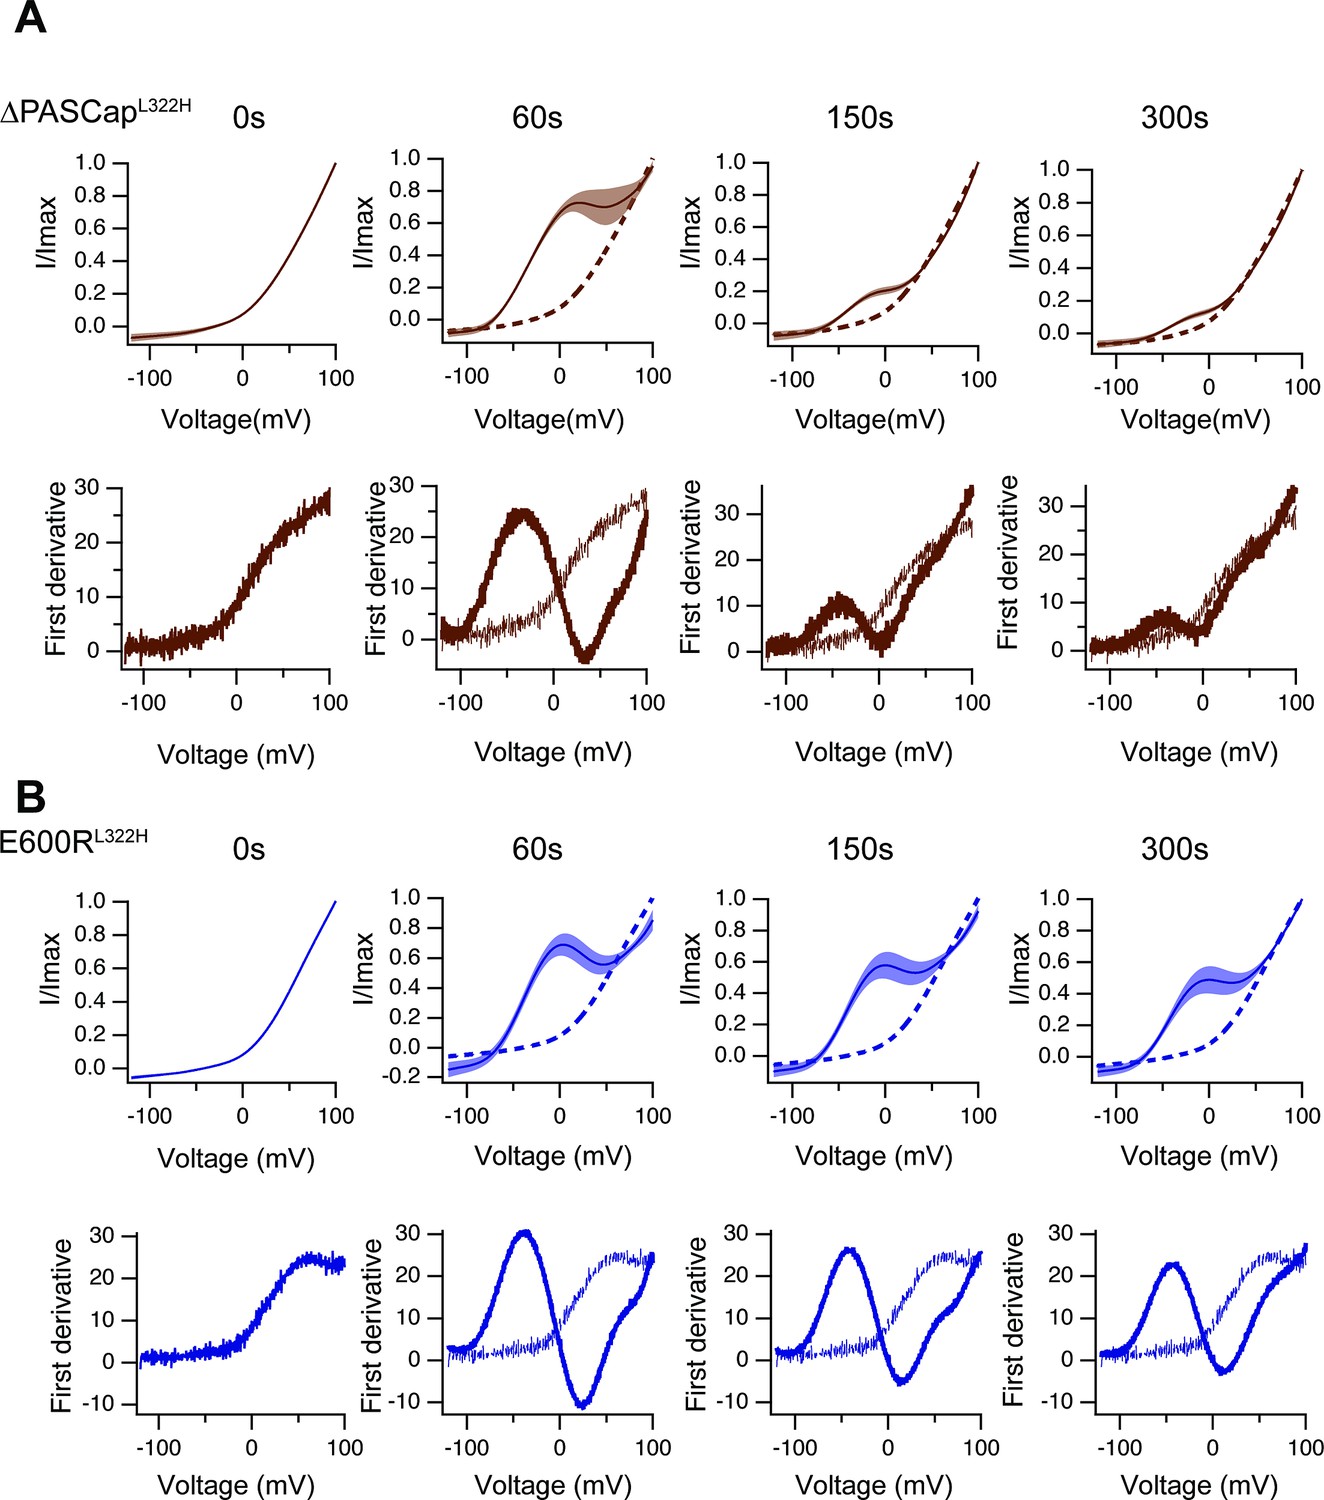
Like in Figure 8—figure supplement 2, the upper traces show the average of normalized ramps for ∆PASCapL322H.
(A) and E600RL322H (B) at the indicated times after induction of Ca2+ rise. At 60, 150, and 300 s, the dashed line corresponds to the ramp at time 0. The shadowed area indicates SEM (N: ∆PASCapL322H = 5, E600RL322H = 11). The lower panels correspond to the first derivative of the current traces to illustrate the changes in slope.
Figure 8—figure supplement 4
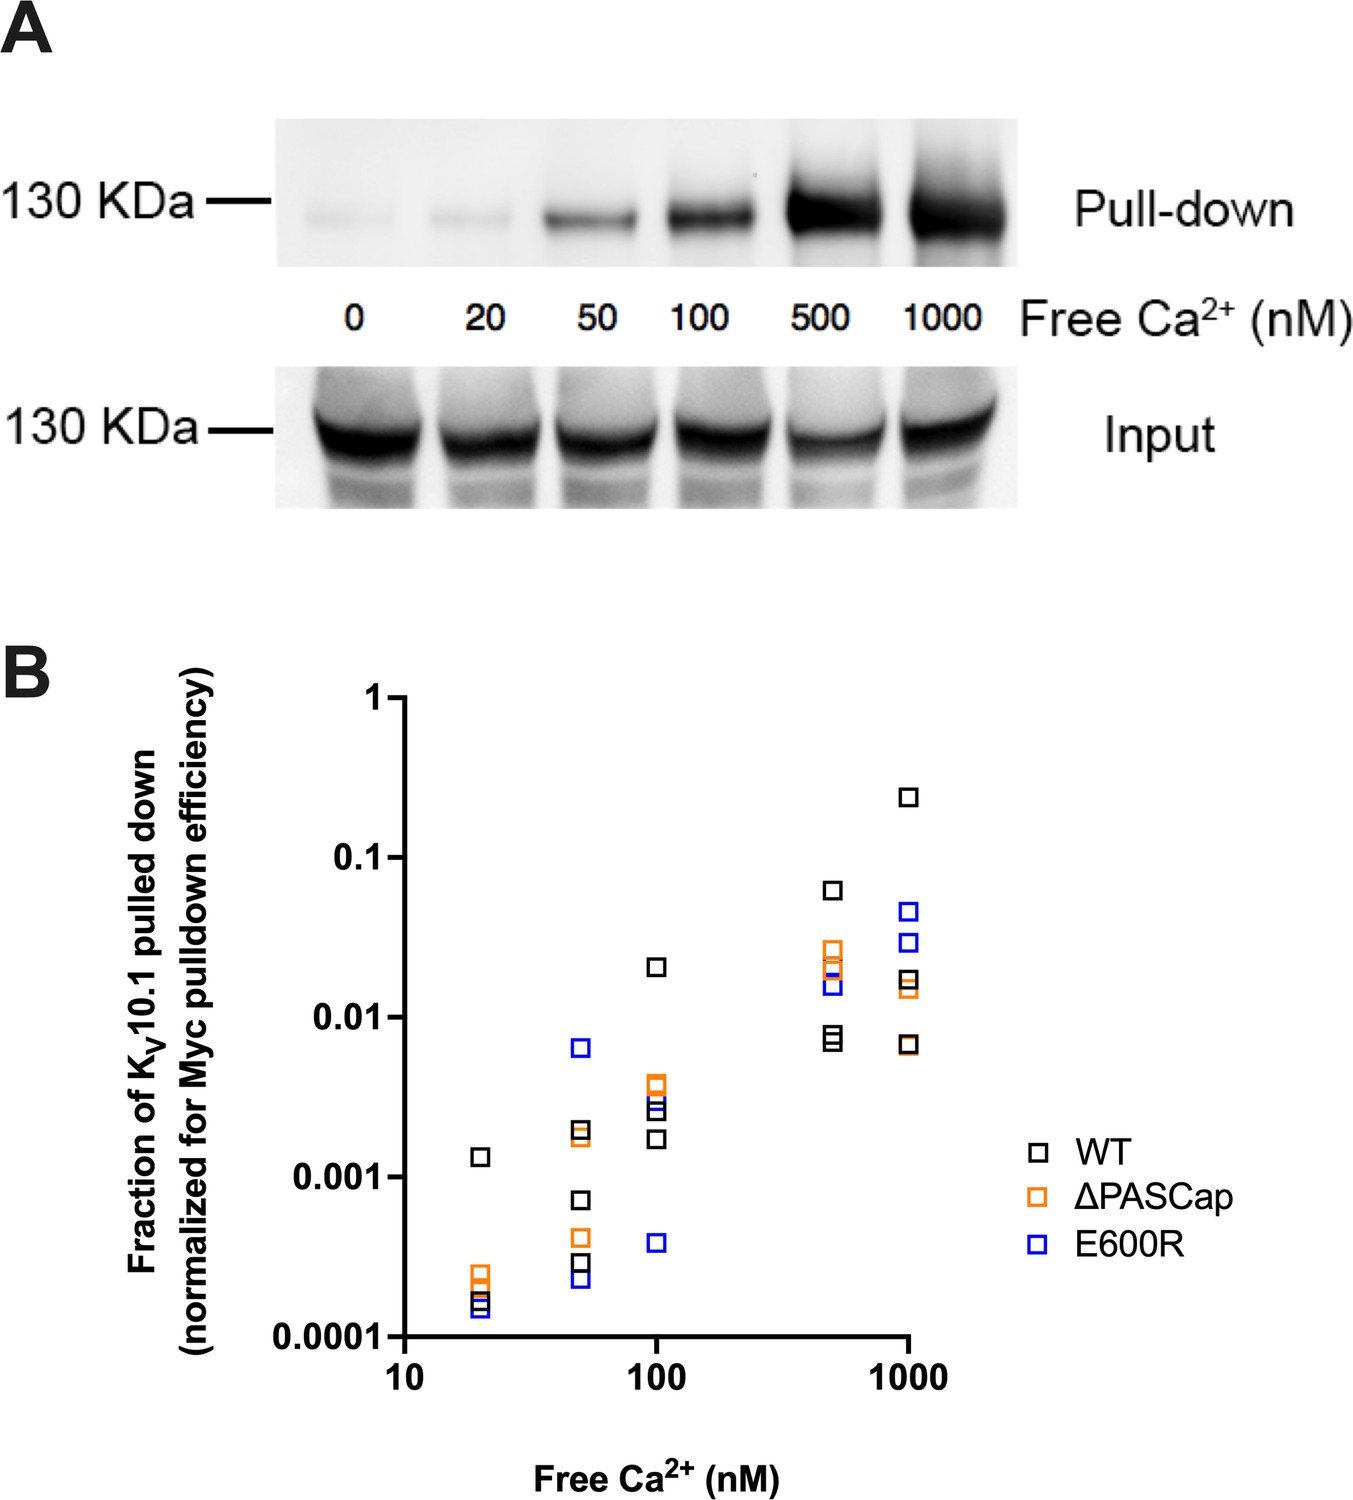
Ca2+ is required for efficient interaction between KV10.1 and CaM.
(A) Ca2+-dependent binding of CaM to KV10.1. CaM was precipitated with anti-Myc antibody and the resulting pulled down fraction was immunoblotted using polyclonal anti- KV10.1 antibody. (B) Quantification of all experiments reveals a strong dependence on Ca2+ concentration in WT and to a similar extent in mutant channels. The fraction of KV10.1 pulled down increases by two orders of magnitude in high Ca2+.
Figure 9 with 5 supplements
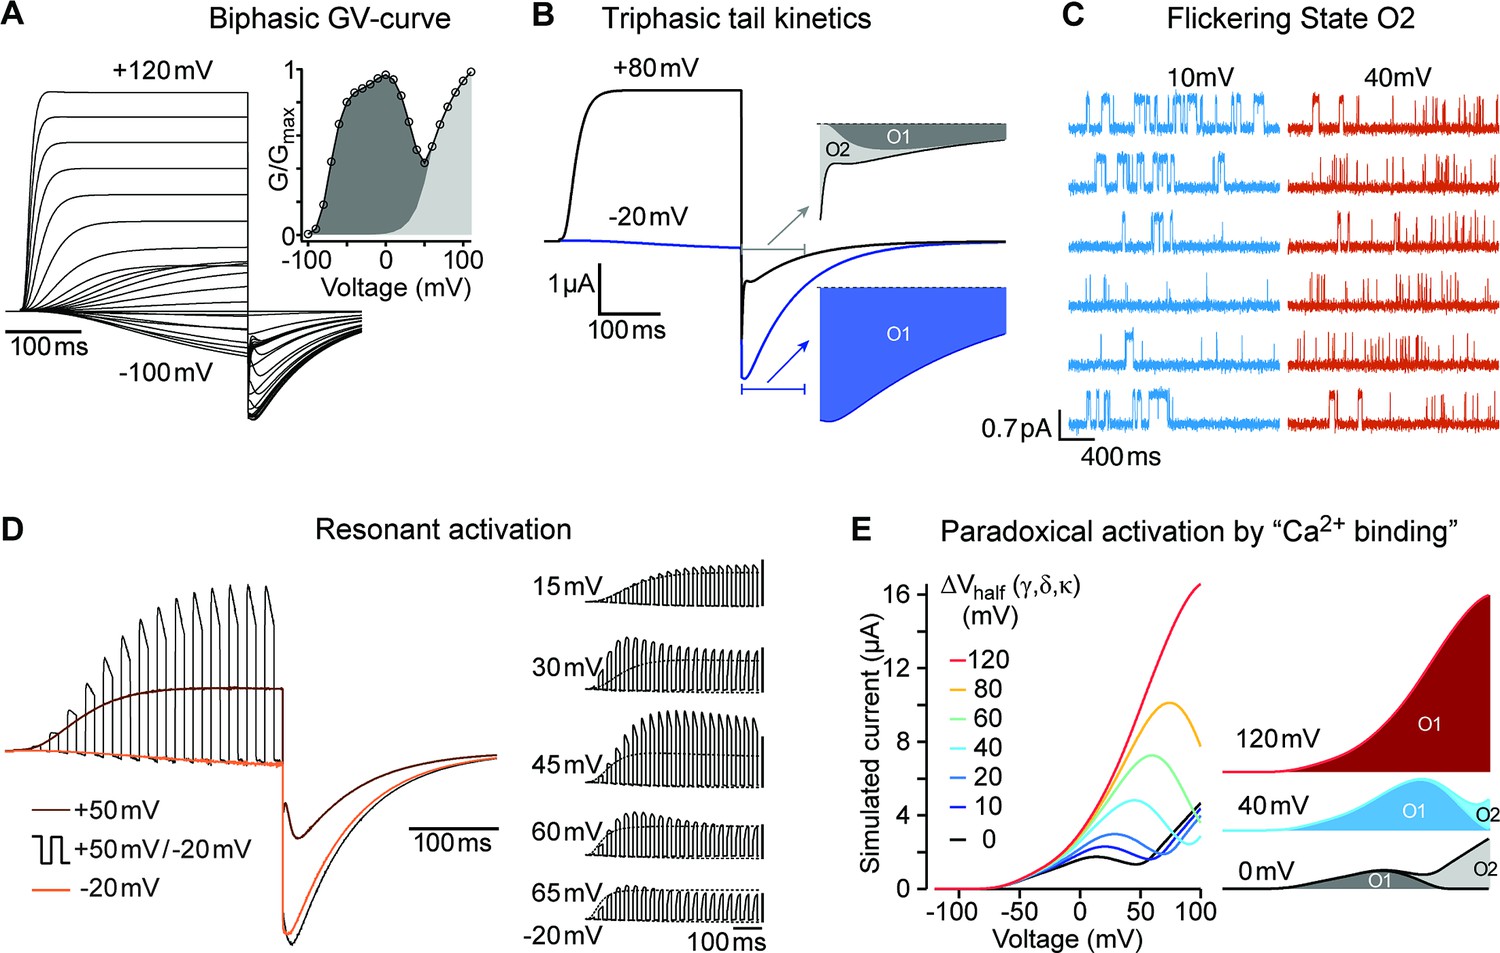
A single model can reproduce all experimental observations.
(A) In response to an I-V-protocol (Figure 1A), the model displays biphasic activation, more clearly represented in the derived G-V curve (right, compare to Figure 1B). The filled area indicates the contributions of the two open states. The tail-currents show a complex dependence on test-pulse voltage and time. (B) Two traces from A, shown with longer repolarization. The first 100ms of the tail currents are displayed on an extended timescale. Colored areas indicate the contributions of the two open states. After weak depolarization to –20 mV, the tail-current originates almost entirely from the mutant-specific open state O1 (blue area). After strong depolarization, O2 mediated currents initially dominate (light grey). For details, see Figure 9—figure supplement 2. (C) The model predicts the differences in single channel behavior of ∆PASCap upon depolarization to +10 or+40 mV (Compare to Figure 5). (D) In response to 10ms pulses alternating between –20 and +50 mV, the model shows currents that exceed the currents obtained with constant pulses to +50 mV (compare Figure 4B). Relating the currents during the positive and negative pulses to the concurrent currents elicited by the two constant pulses (brown and orange), the ratio lies by about 1.6 for the period starting 200ms after the pulse onset. This excess current depends sensitively on the duration and voltage of the two pulse components. The right series of simulations displays the results for 15ms pulses to –20 mV, alternating with 15ms pulses to voltages from 15 mV to 65 mV. The corresponding responses to the constant pulses are displayed with thin dotted lines. To facilitate perception of the excess current, the five groups of traces are scaled individually, so that the peak amplitude of the dotted response elicited by the stronger depolarizations is displayed at equal size throughout. The vertical scalebars correspond to the same absolute current. From top to bottom, the excess current ratios at 200ms changes are 1.05, 1.38, 1.74, 1.46, and 1.16. (E). The binding of Ca2+-CaM is implemented through change in the activation energy, corresponding to a shift in the equilibrium voltage of the gating transitions. The decomposition of the current into the individual open states’ contribution shows that for increasing voltage shifts – representing high [Ca2+]i – the mutant-specific O1 closes later into the ramp, until eventually all current is carried by O1.
Figure 9—figure supplement 1
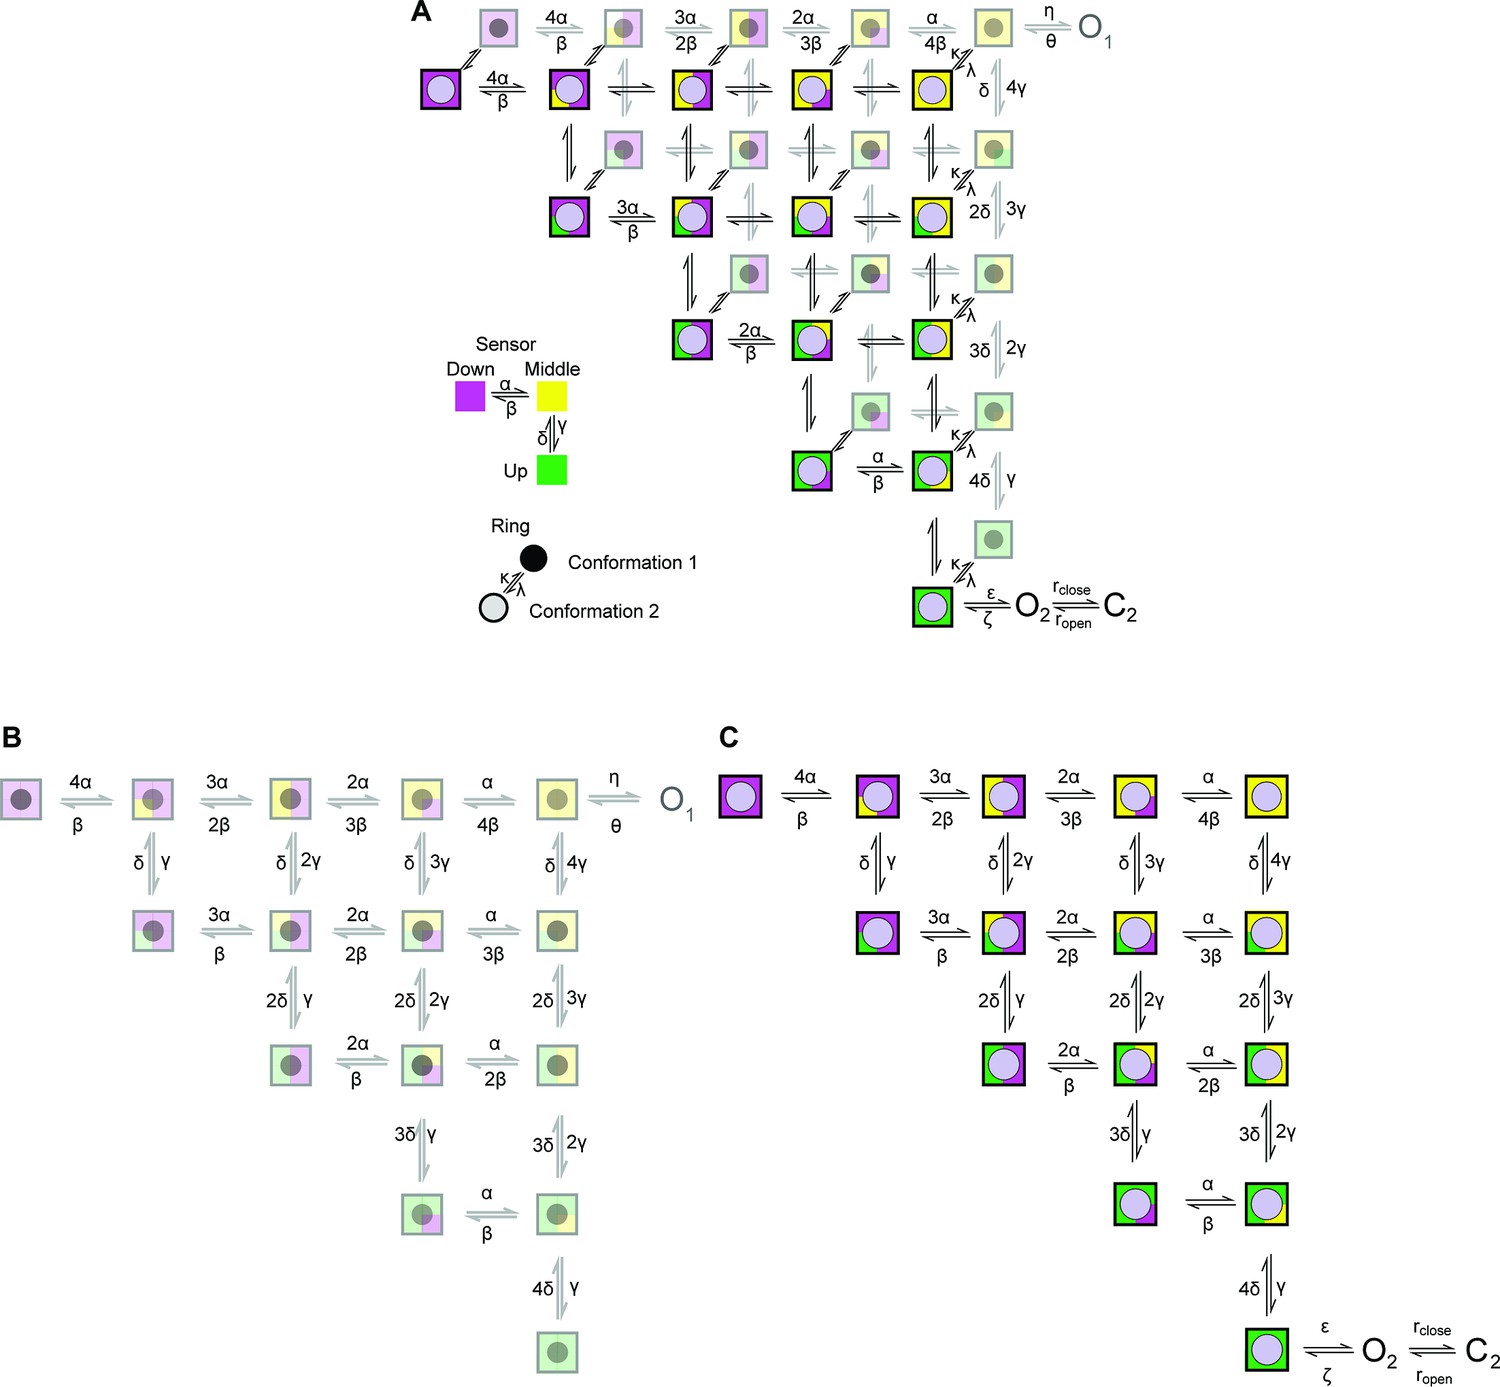
Cartoon depicting the state model proposed.
A two-layer Markov-Model depicting possible conformations for the sensor and the ring. The sensor in each subunit can independently adopt one of three conformations (up, middle, and down) (Zhang et al., 2023). The up conformation represents the active conformation. The conformation of the ring changes across the two layers. The second conformation in the upper layer allows the channel to access ‘O2’ provided that all sensors are in the up conformation. Transitions within each layer is governed by (α, β, γ, δ), we proposed that the transitions are identical in the two layers. Transitions between the two levels are governed by the rate constants k and λ.
Figure 9—figure supplement 2
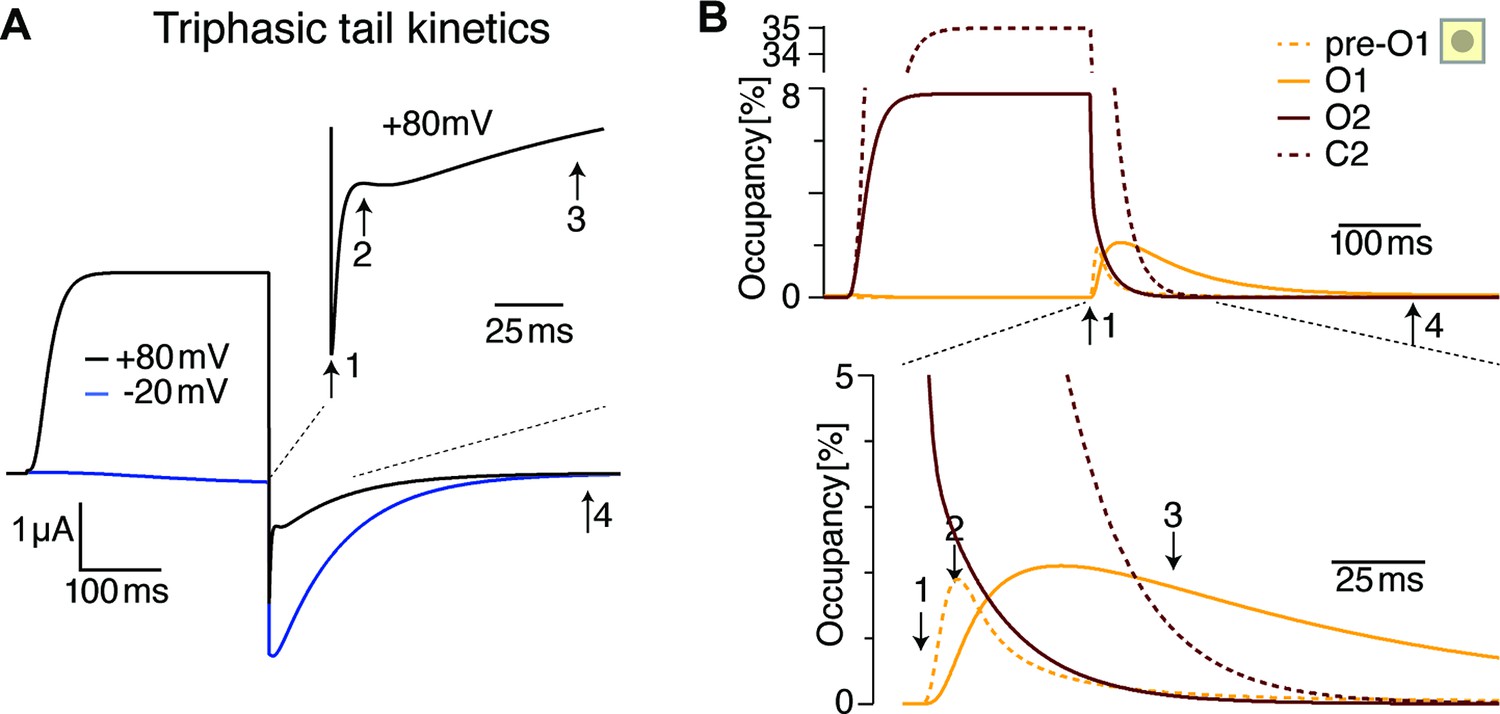
The triphasic tail currents result from transient re-population of O1 during channel deactivation.
(A) Simulated currents from Figure 9B display simple, monophasic tail currents after weak depolarizations but triphasic tail current after +80 mV depolarization, similar to experimental results (see Figure 1E). (B) Occupancy of O2, O1 and its neighboring state as a function of time during a depolarization to +80 mV and repolarization to –100 mV. The three phases result from rapid initial vacation of O2, followed by a slower process resulting from the delayed vacation of C2 through O2. This results in an increased occupancy of the neighboring state to O1 (pre-O1), which drives a transient increase in O1 occupancy that is the basis for the transient tail current increase around time point 2. Slowly, deeper closed states are repopulated, and in the process, pre-O1 and eventually O1 fall empty from time point 3–4.
Figure 9—figure supplement 3
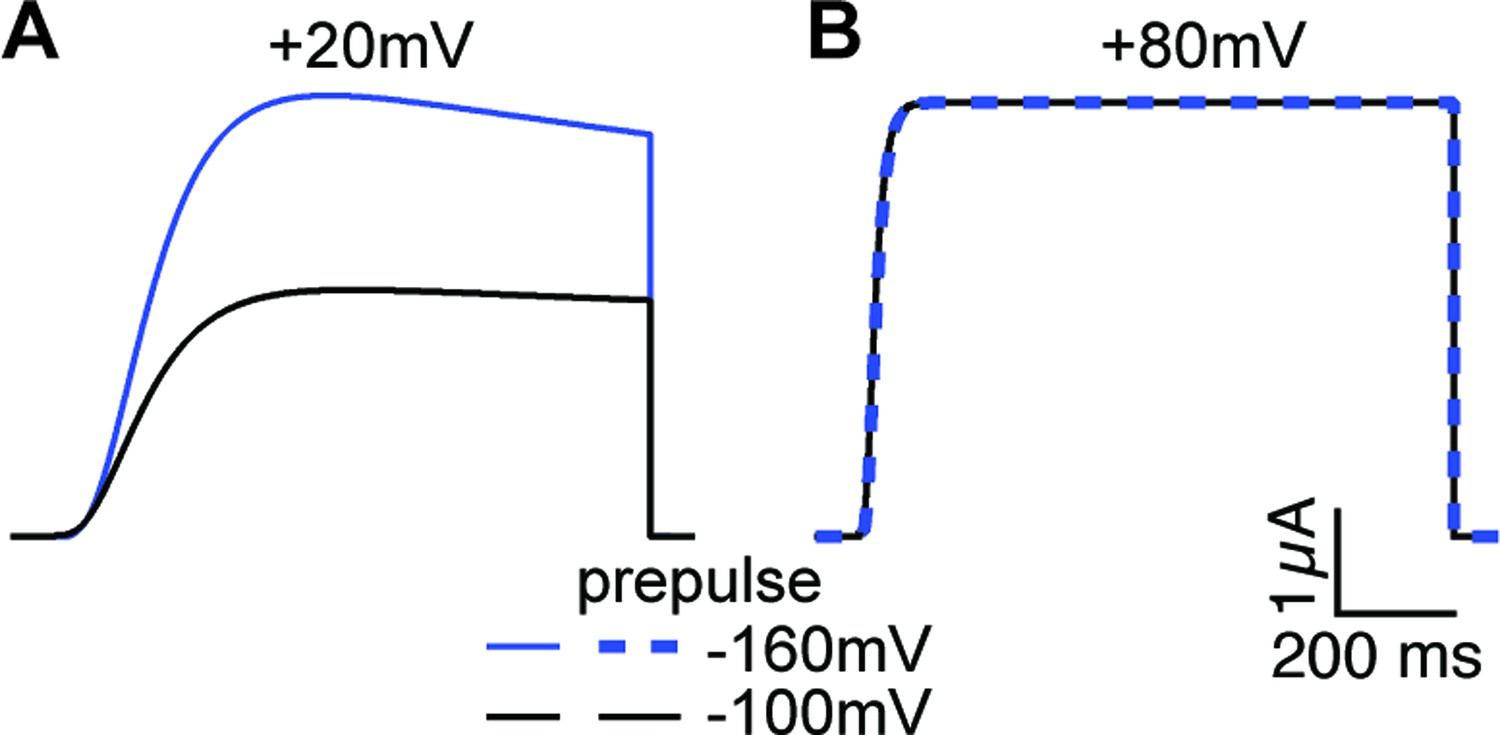
Current simulations for ∆PASCap upon depolarization to +20 and+80 mV after a conditioning pulse to –160 or –100 mV.
The current at +20 mV is larger after –160 mV, while the current at +80 mV is unaffected by the conditioning pulse (see Figure 6A).
Figure 9—figure supplement 4
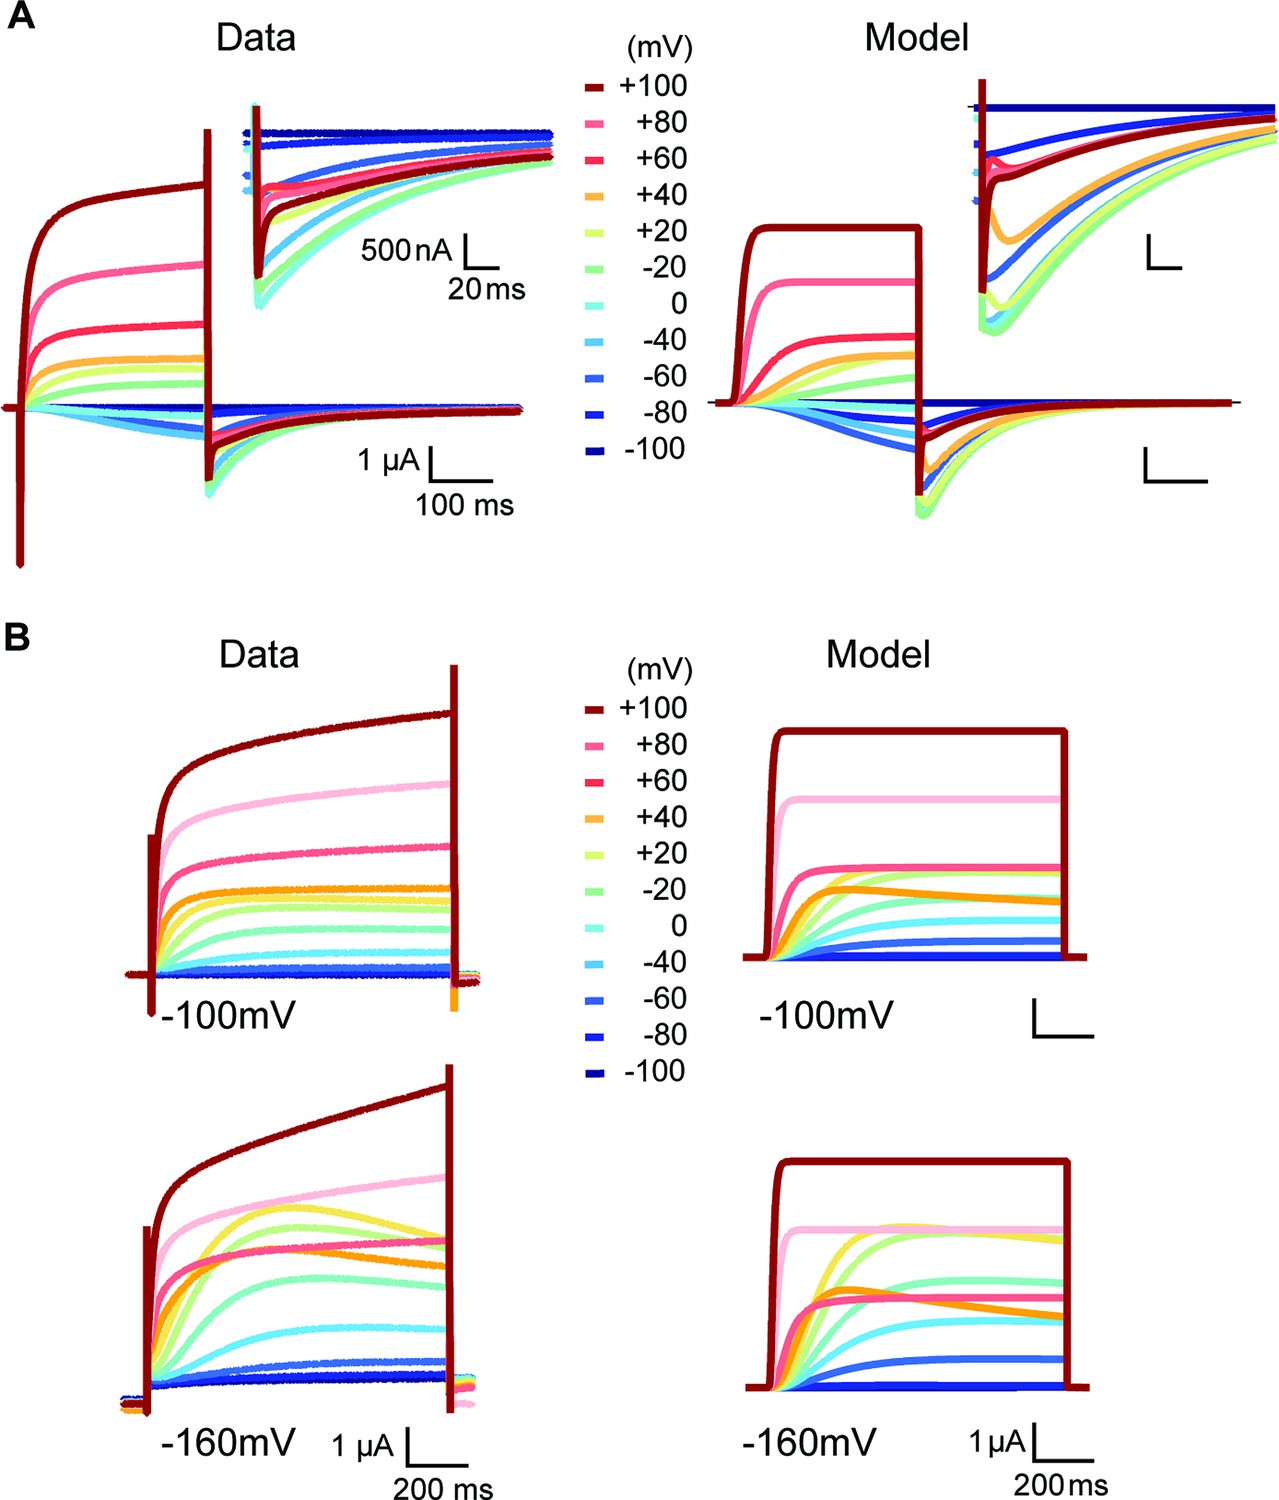
Side-by-side comparison of experimental data and model prediction during depolarizations between –100 and +100 mV in the presence of high (60 mM) (A) or low extracellular [K+] (2.5 mM) (B).
The model describes the features of the experimentally observed currents, except the sustained rising phase during strong depolarizations.
Figure 9—figure supplement 5
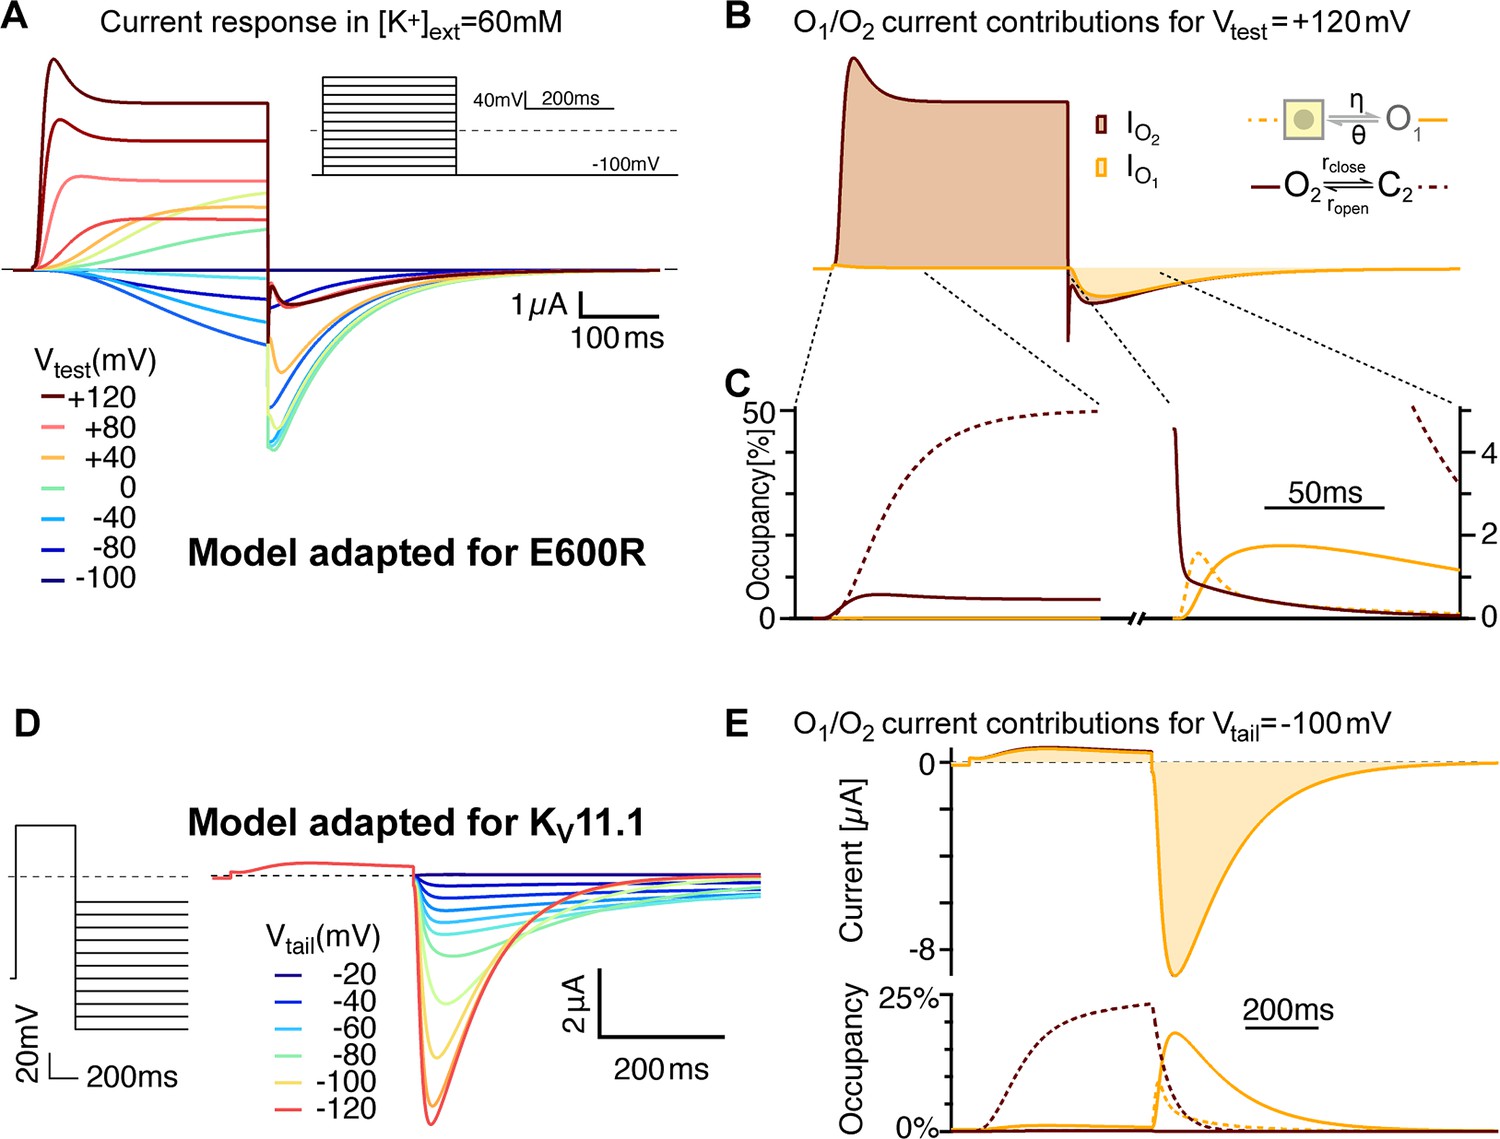
Model variants can account for features of related channels and mutated variants.
(A) E600R gating features are consistent with slower flickering of a less populated O2. After lowering the stability of O2 (larger rclose/ropen and larger ζ/ε) and an overall slower flickering between O2 and C2 (Supplementary file 2), simulated currents show transient peaks during strong depolarizations and larger tails with more pronounced triphasic waveforms. Those features resemble the measurements with the E600R mutant (Figure 1A). (B) The relative currents of C2 and O2 differ even more than in the ∆PASCap model. The transient peak results from a delayed O2-C2 equilibration due to reduced flicker rates. Traces are shown in the same units as in A. (C) As close-up of the states’ occupancies shows that the mechanism of triphasic tail currents remains the same in the E600R model version (compare Supplement 2 to Figure 9). (D) The model recapitulates key features of KV11.1 when the balance between O2 and C2 is further biased towards the closed state and with slowed transitions between closed states (see Supplementary file 2). The traces were generated for high extracellular [K+] (50 mM), to allow for comparison with experimental recordings in Lörinczi et al., 2015.
Tables
Appendix 1—key resources table
| Reagent type (species) or resource | Designation | Source or reference | Identifiers | Additional information |
|---|---|---|---|---|
| Gene (Homo sapiens) | Kv10.1 | NA | NCBI NM_002238.4 | |
| Antibody | anti-Myc | SIGMA | M4439, RRID:AB_439694 | 3 µg IP, 1:1000 immunoblot |
| Antibody | anti-Myc | Abcam | ab206486; RRID:AB_2861226 | 3 µg IP |
| Antibody | anti-Kv10.1 | Chen et al., 2011 | polyclonal anti-Kv10.1 | 1:1500 |
| Recombinant DNA reagent | pSGEM Kv10.1 | Addgene #85704 | ||
| Chemical compound, drug | Thapsigargin | Abcam | ab120286 | 5 µM |
| Chemical compound, drug | Ionomycin | Abcam | ab120116 | 5 µM |
| Chemical compound, drug | Astemizole | Esteve Química | N/A | 100 µM |
| Software, algorithm | Patch Master | HEKA | ||
| Software, algorithm | FitMaster | HEKA | ||
| Software, algorithm | Igor Pro | WaveMetrics |
Additional files
-
Supplementary file 1
Parameters of a global fit that linked the first component of the biphasic response.
- https://cdn.elifesciences.org/articles/91420/elife-91420-supp1-v1.docx
-
Supplementary file 2
Model parameters.
- https://cdn.elifesciences.org/articles/91420/elife-91420-supp2-v1.docx
-
Supplementary file 3
Primers used for infusion cloning or site-directed mutagenesis.
The sequences are listed 5’–3'. For mutagenesis primers, only the sense sequences are given. The reverse primers corresponded to the reverse-complement sequence.
- https://cdn.elifesciences.org/articles/91420/elife-91420-supp3-v1.docx
-
MDAR checklist
- https://cdn.elifesciences.org/articles/91420/elife-91420-mdarchecklist1-v1.pdf
Download links
A two-part list of links to download the article, or parts of the article, in various formats.
Downloads (link to download the article as PDF)
Open citations (links to open the citations from this article in various online reference manager services)
Cite this article (links to download the citations from this article in formats compatible with various reference manager tools)
Revealing a hidden conducting state by manipulating the intracellular domains in KV10.1 exposes the coupling between two gating mechanisms
eLife 12:RP91420.
https://doi.org/10.7554/eLife.91420.4


