Reduced discrimination between signals of danger and safety but not overgeneralization is linked to exposure to childhood adversity in healthy adults
- Institute for Systems Neuroscience, University Medical Center Hamburg-Eppendorf, Germany
- Department of Psychiatry, Psychosomatics and Psychotherapy, Center of Mental Health, University Hospital of Würzburg, University of Würzburg, Germany
- Department of Psychiatry and Psychotherapy, Medical Center - University of Freiburg, Faculty of Medicine, University of Freiburg, Germany
- Institute for Translational Psychiatry, University of Münster, Germany
- Department of Psychiatry, Psychosomatic Medicine and Psychotherapy, University Hospital Frankfurt – Goethe University, Germany
- Department of Psychology, Humboldt-Universität zu Berlin, Germany
- German Center of Mental Health (DZPG), partner site Berlin-Potsdam, Germany
- Fraunhofer Institute for Translational Medicine and Pharmacology ITMP, Germany
- Department of Child and Adolescent Psychiatry, Psychosomatics and Psychotherapy, Center of Mental Health, University Hospital of Würzburg, University of Würzburg, Germany
- Kbo Inn Salzach Hospital Clinical Center for Psychiatry, Germany
- Department of Psychiatry, Ludwig-Maximilian-University Munich, Germany
- Department of Psychology and Center of Mental Health, Julius-Maximilians-University of Würzburg, Germany
- Department of Psychology, Biological Psychology and Cognitive Neuroscience, University of Bielefeld, Germany
Figures
Figure 1
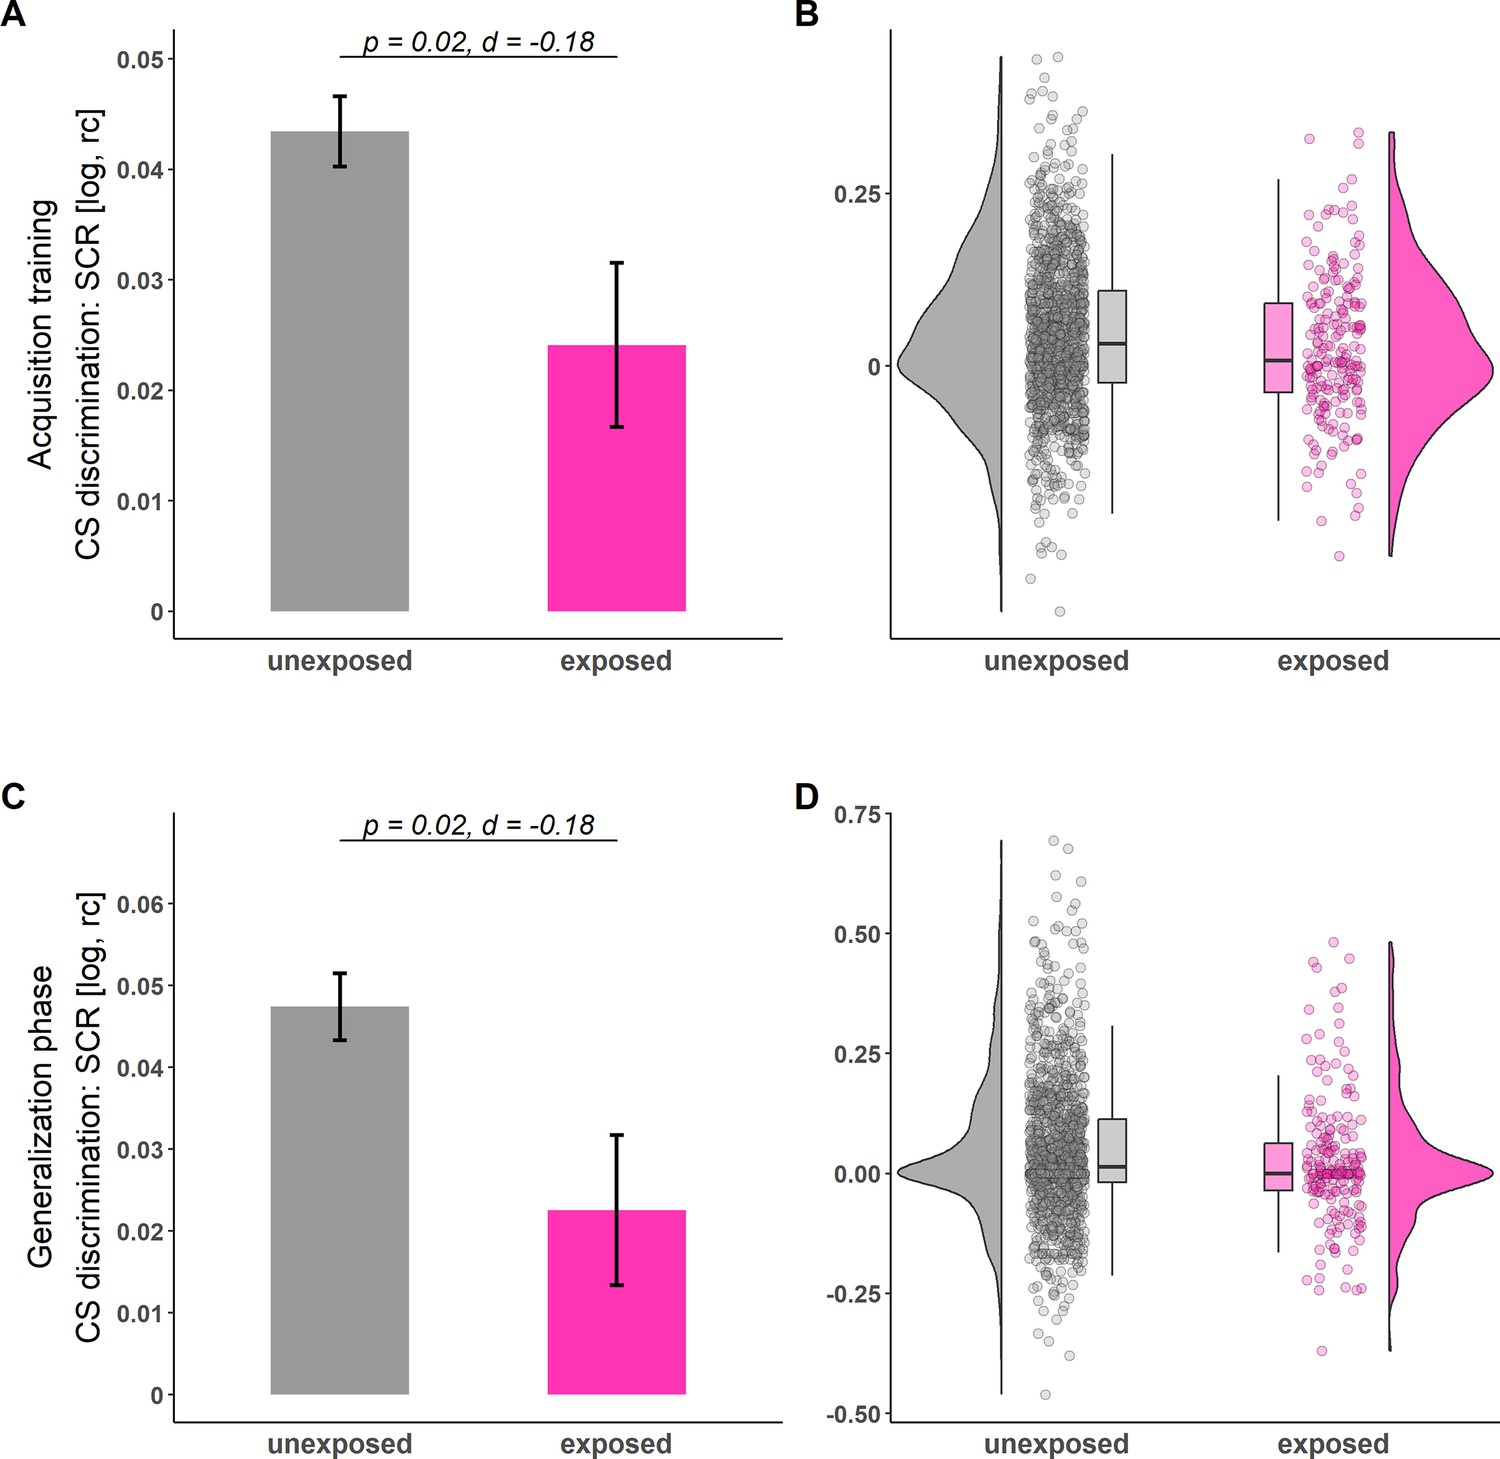
Illustration of conditioned stimulus (CS) discrimination in skin conductance responses (SCRs) during acquisition training (A–B) and generalization phase (C–D) for individuals unexposed (gray) and exposed (pink) to childhood adversity.
Barplots (A and C) with error bars represent means and standard errors of the means (SEMs) including nunexposed = 1199 and nexposed = 203, respectively. The statistical parameters presented in A and C are derived from two-tailed independent-samples t-tests. The a priori significance level was set to α = 0.05. Distributions of the data are illustrated in the raincloud plots (B and D). Points next to the densities represent the CS discrimination of each participant averaged across phases. Boxes of boxplots represent the interquartile range (IQR) crossed by the median as a bold line, ends of whiskers represent the minimum/maximum value in the data within the range of 25th/75th percentiles ± 1.5 IQR. For trial-by-trial SCRs across all phases, see Appendix 1—figure 4. log = log-transformed, rc = range-corrected.
Figure 2
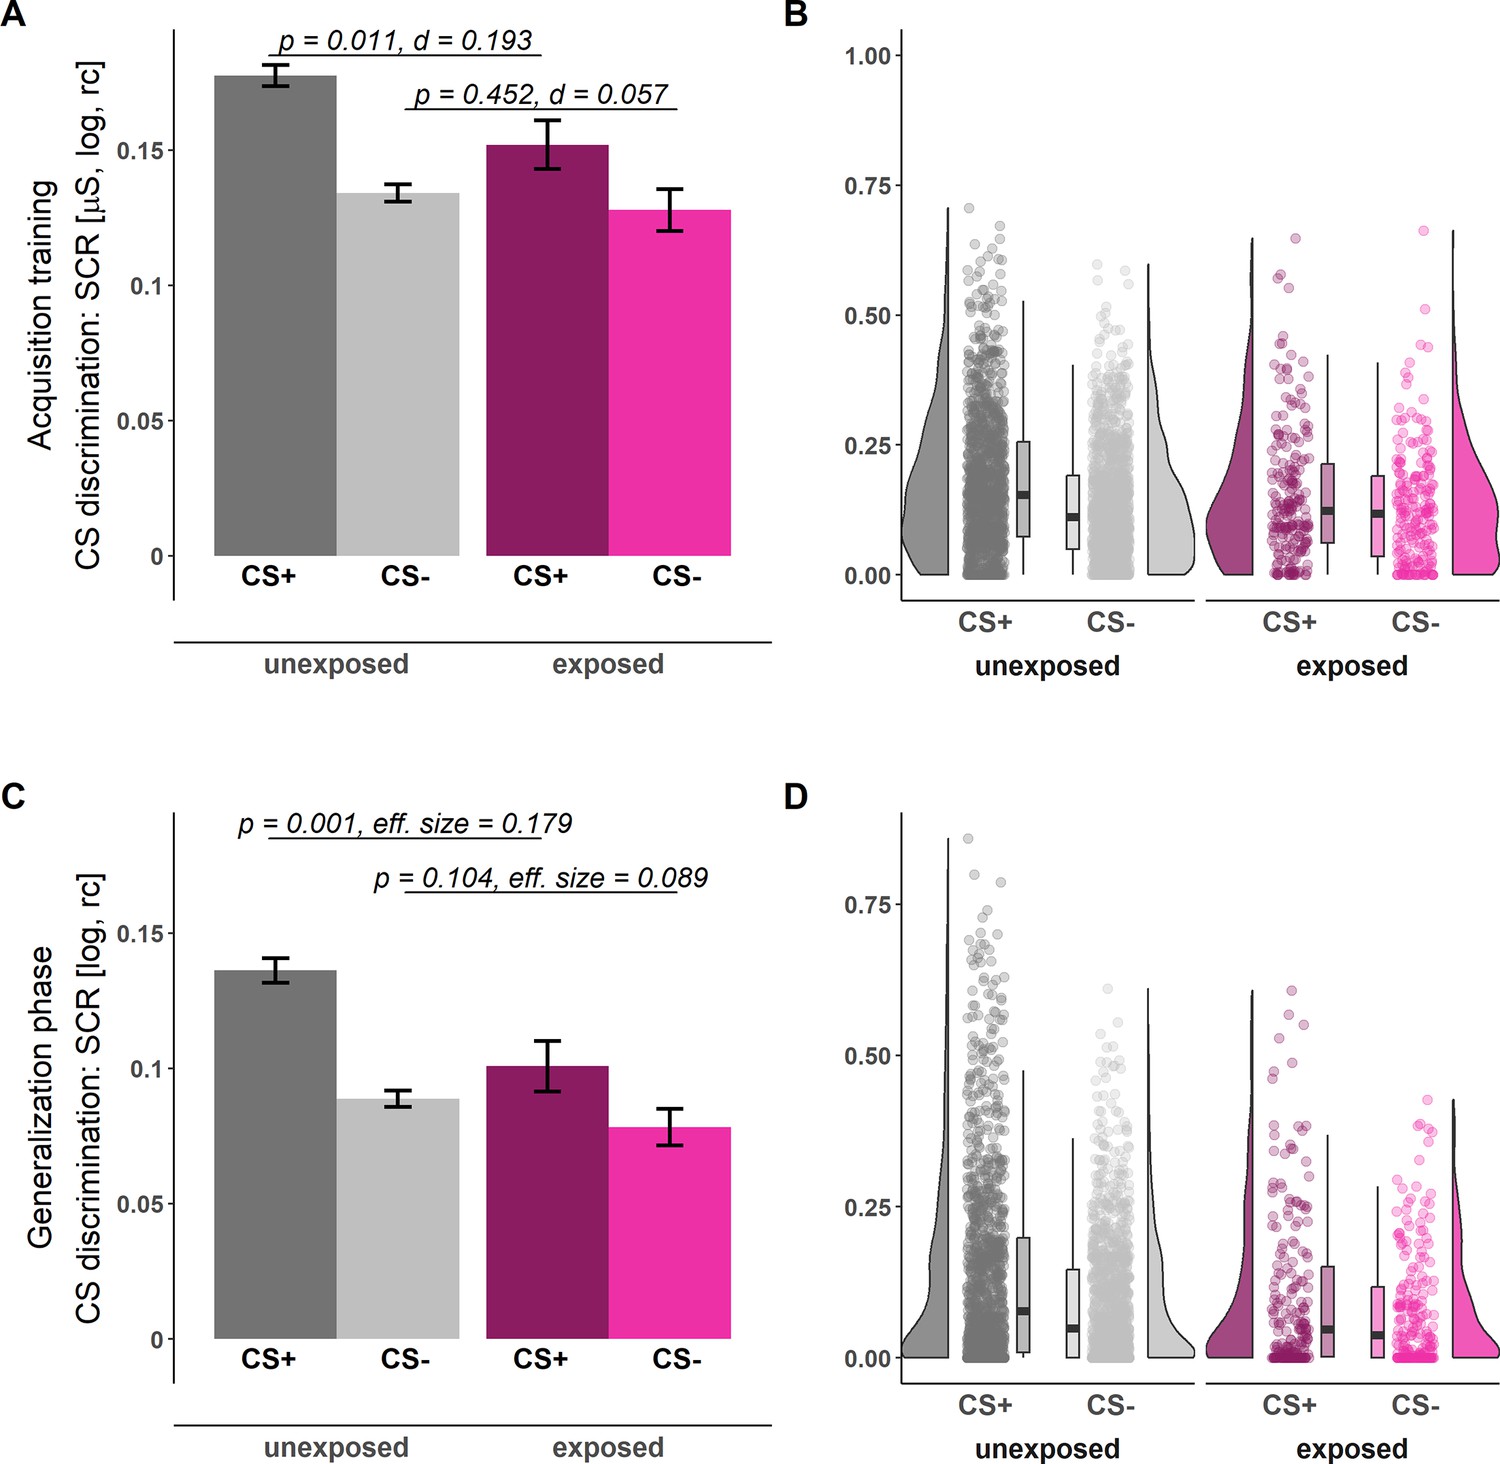
Illustration of skin conductance responses (SCRs) during acquisition training (A–B) and the generalization phase (C–D) for individuals unexposed (gray) and exposed (pink) to childhood adversity separated by stimulus types (CS+: dark shades, CS-: light shades).
Barplots (A and C) with error bars represent means and standard errors of the means (SEMs) including nunexposed = 1199 and nexposed = 203, respectively. The presented statistical parameters are derived from a two-tailed independent-samples t-test (A) and a Yuen independent-samples t-test for trimmed means (C). The a priori significance level was set to α = 0.05. Distributions of the data are illustrated in the raincloud plots (B and D). Points next to the densities represent the SCRs of each participant as a function of stimulus type averaged across phases. Boxes of boxplots represent the interquartile range (IQR) crossed by the median as a bold line, ends of whiskers represent the minimum/maximum value in the data within the range of 25th/75th percentiles ± 1.5 IQR. CS = conditioned stimulus, log = log-transformed, rc = range-corrected.
Figure 3
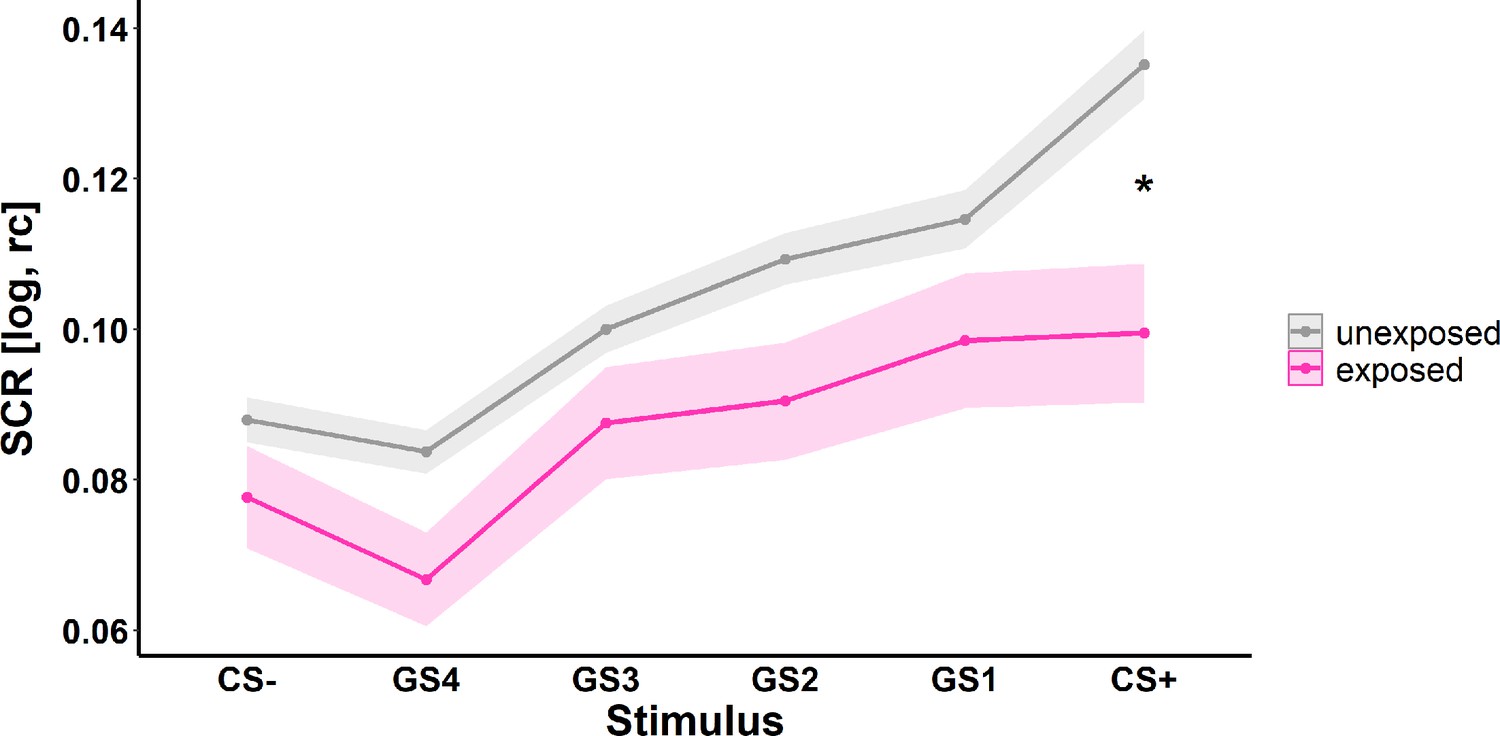
Illustration of skin conductance responses (SCRs) to the different stimulus types during the generalization phase (i.e. generalization gradients) for individuals unexposed (gray) and exposed (pink) to childhood adversity.
Ribbons represent standard errors of the means (SEMs) including nunexposed = 1199 and nexposed = 203, respectively. CS = conditioned stimulus, GS = generalization stimuli with gradual perceptual similarity to the CS+ and CS-, respectively. log = log-transformed, rc = range-corrected. *p<0.05.
Figure 4
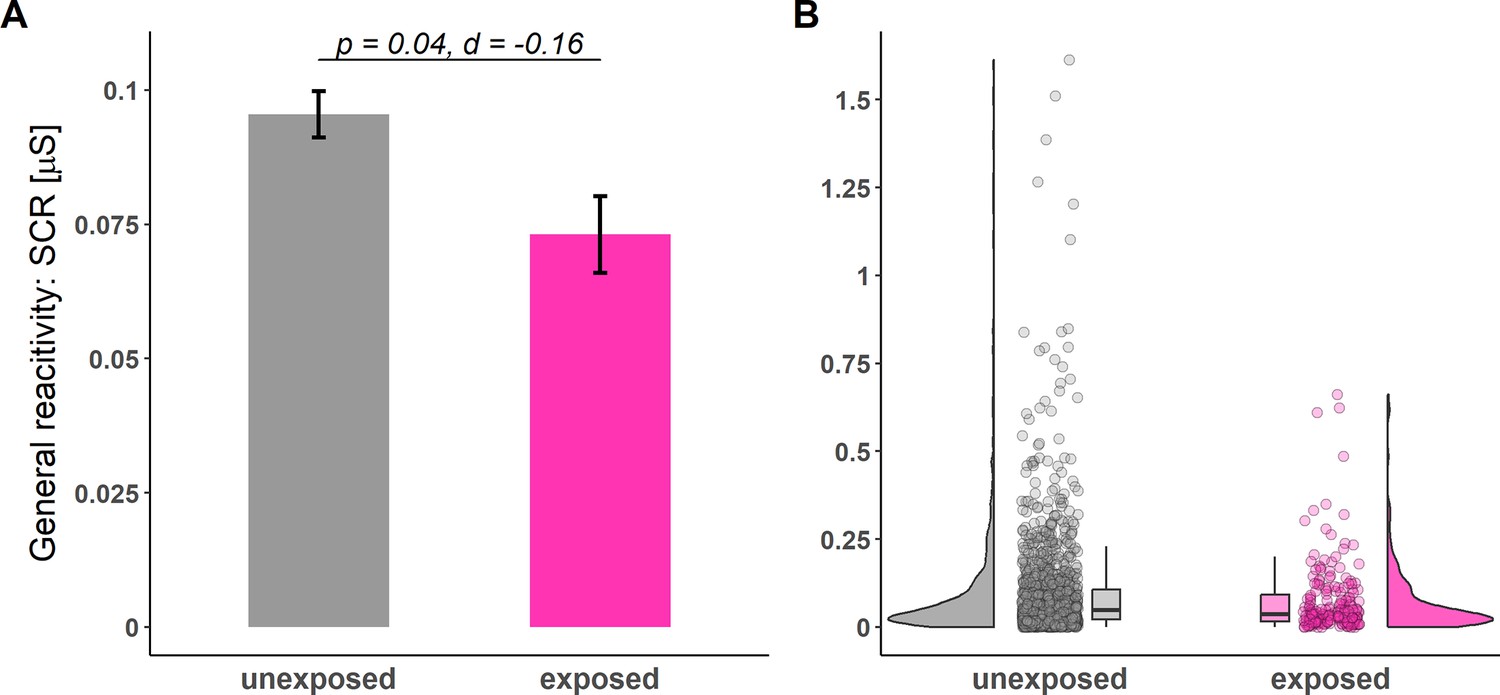
Illustration of general reactivity in skin conductance responses (SCRs) across all experimental phases for individuals unexposed (gray) and exposed (pink) to childhood adversity.
Barplots (A) with error bars represent means and standard errors of the means (SEMs) including nunexposed = 1199 and nexposed = 203, respectively. The statistical parameters presented in A are derived from a two-tailed independent-samples t-test. The a priori significance level was set to α = 0.05. Distributions of the data are illustrated in the raincloud plots (B). Points next to the densities represent the general reactivity of each participant averaged across all phases. Boxes of boxplots represent the interquartile range interquartile range (IQR) crossed by the median as a bold line, ends of whiskers represent the minimum/maximum value in the data within the range of 25th/75th percentiles ± 1.5 IQR.
Figure 5
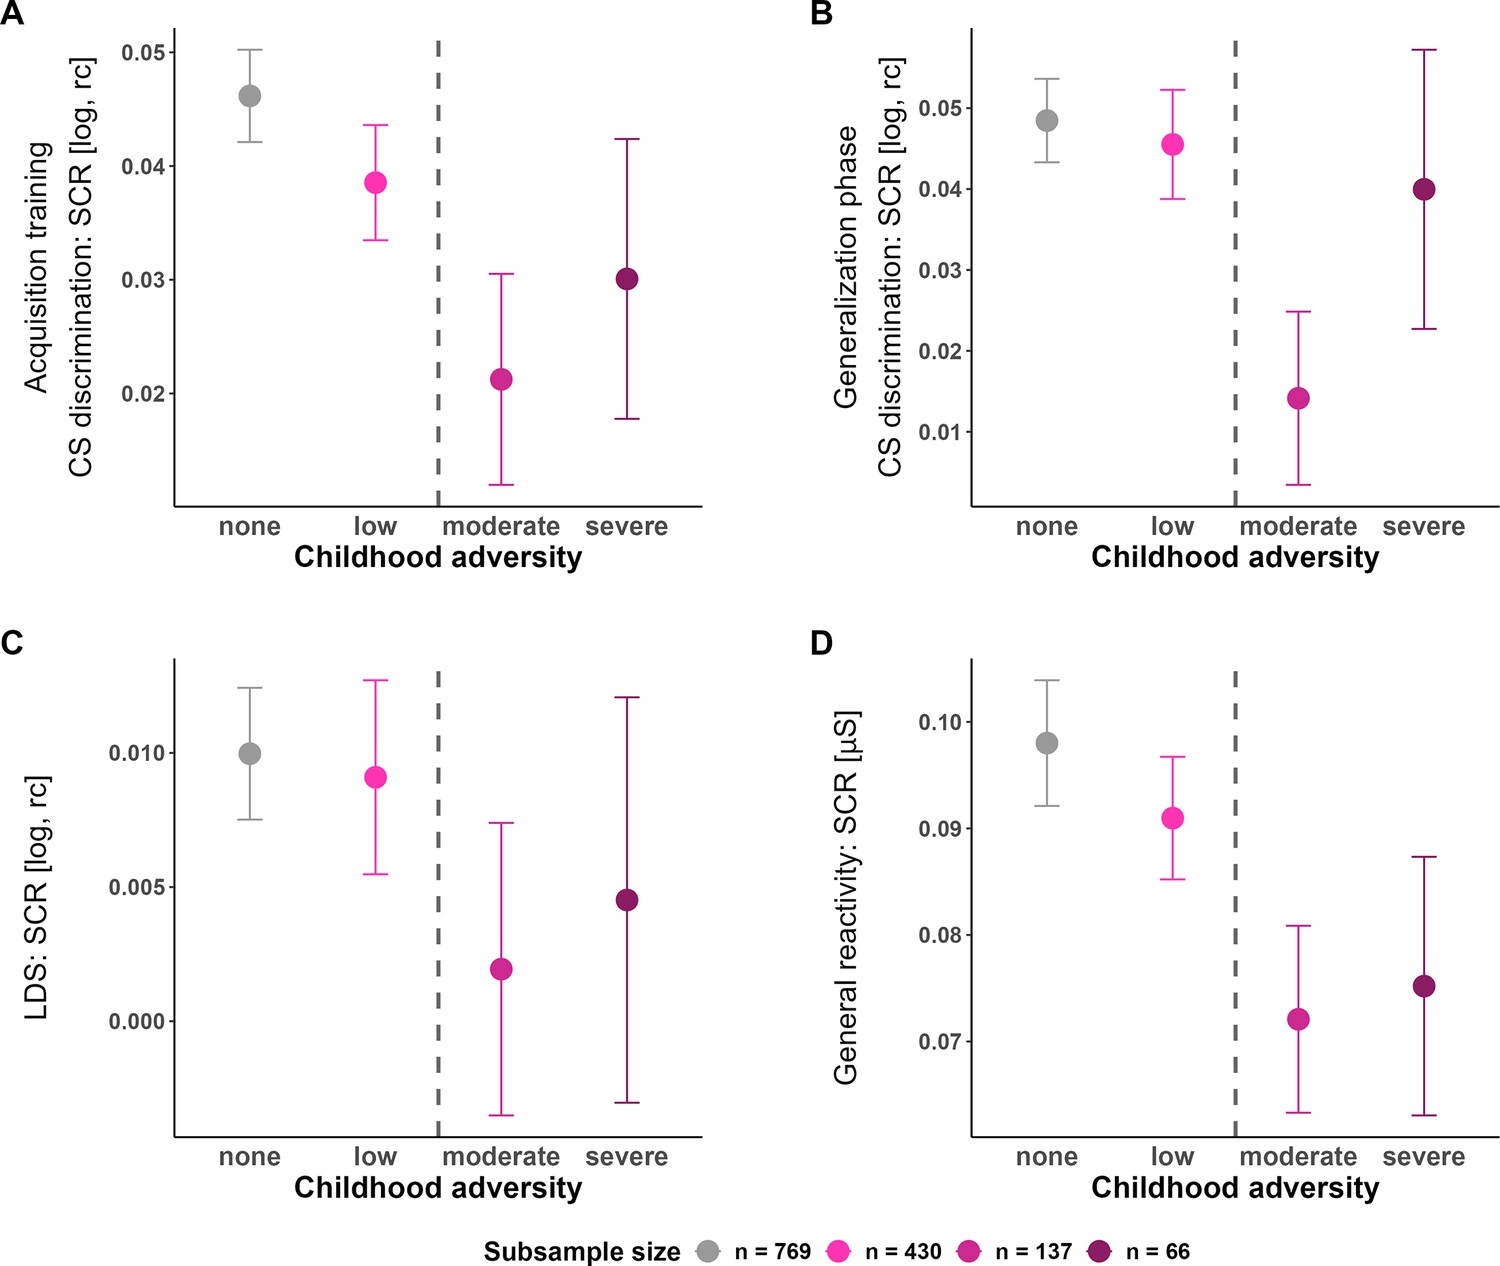
Means and standard errors of the mean (SEMs) of conditioned stimulus (CS) discrimination in skin conductance responses (SCRs) during acquisition training (A) and the generalization phase (B), Linear deviation score (LDS) (C), and general reactivity in SCRs (D) for the four Childhood Trauma Questionnaire (CTQ) severity groups, respectively.
The dashed line indicates the moderate CTQ cut-off frequently used in the literature and hence also employed in our main analyses: On a descriptive level, CS discrimination in SCRs during acquisition training and generalization test, as well as the strength of generalization (i.e. LDS) and the general reactivity are lower in all groups exposed to childhood adversity at an at least moderate level as compared to those with no or low exposure - which corresponds to the main analyses (see above). log = log-transformed, rc = range-corrected.
Figure 6
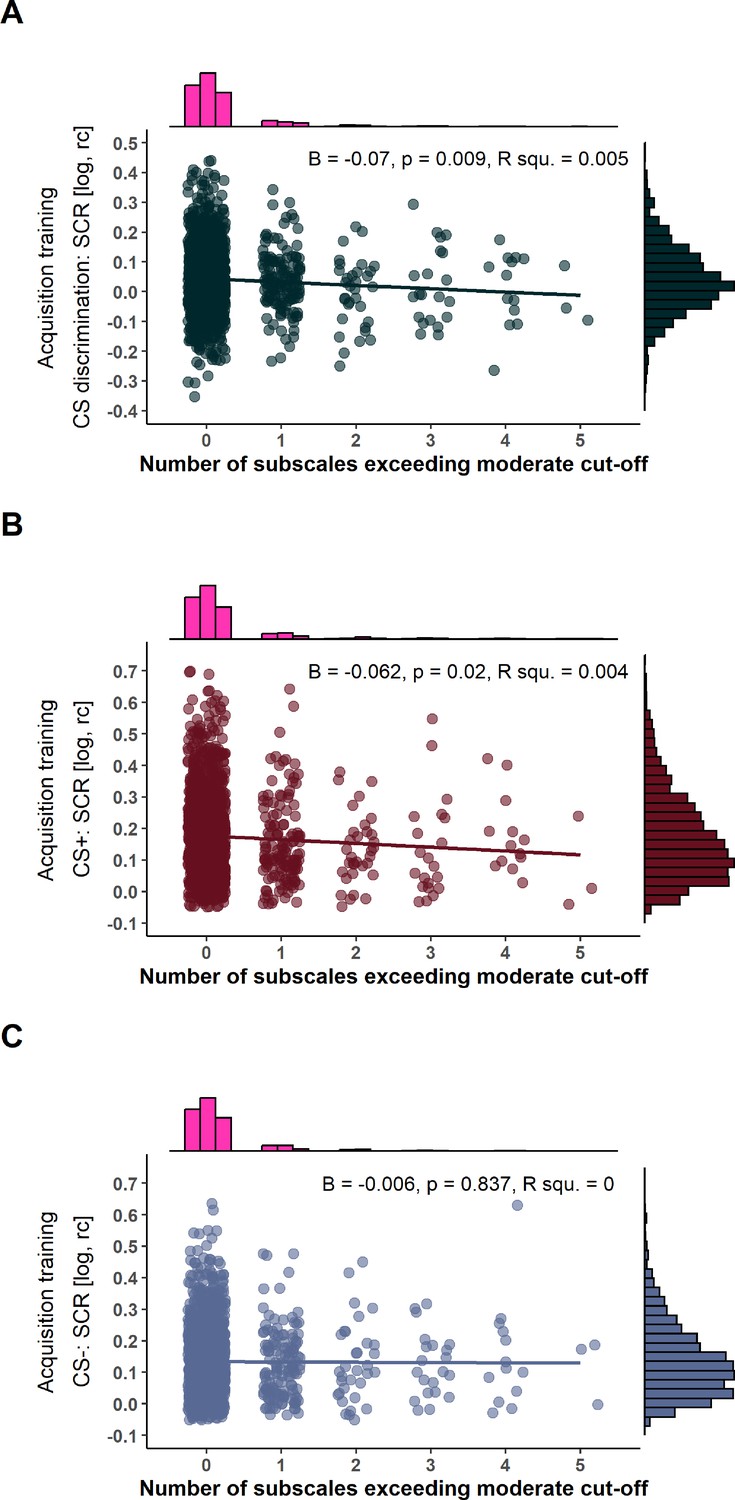
Scatterplots with marginal densities illustrating the associations between the number of Childhood Trauma Questionnaire (CTQ) subscales exceeding a moderate or higher cut-off (Häuser et al., 2011) and conditioned stimulus (CS) discrimination in skin conductance responses (SCRs) (A) as well as SCRs to the CS+ (B) and CS- (C) during acquisition training.
log = log-transformed, rc = range-corrected.
Figure 7

Scatterplots with marginal densities illustrating the associations between Childhood Trauma Questionnaire (CTQ) composite scores of abuse (left panel) and neglect (right panel) and conditioned stimulus (CS) discrimination in skin conductance responses (SCRs) (A and B) as well as SCRs to the CS+ (C and D) and CS- (E and F) during acquisition training.
Note that the different ranges of CTQ composite scores result from summing up two and three subscales for the neglect and abuse composite scores, respectively (see also Table 1 for more details). log = log-transformed, rc = range-corrected, R squ.=R squared.
Appendix 1—figure 1
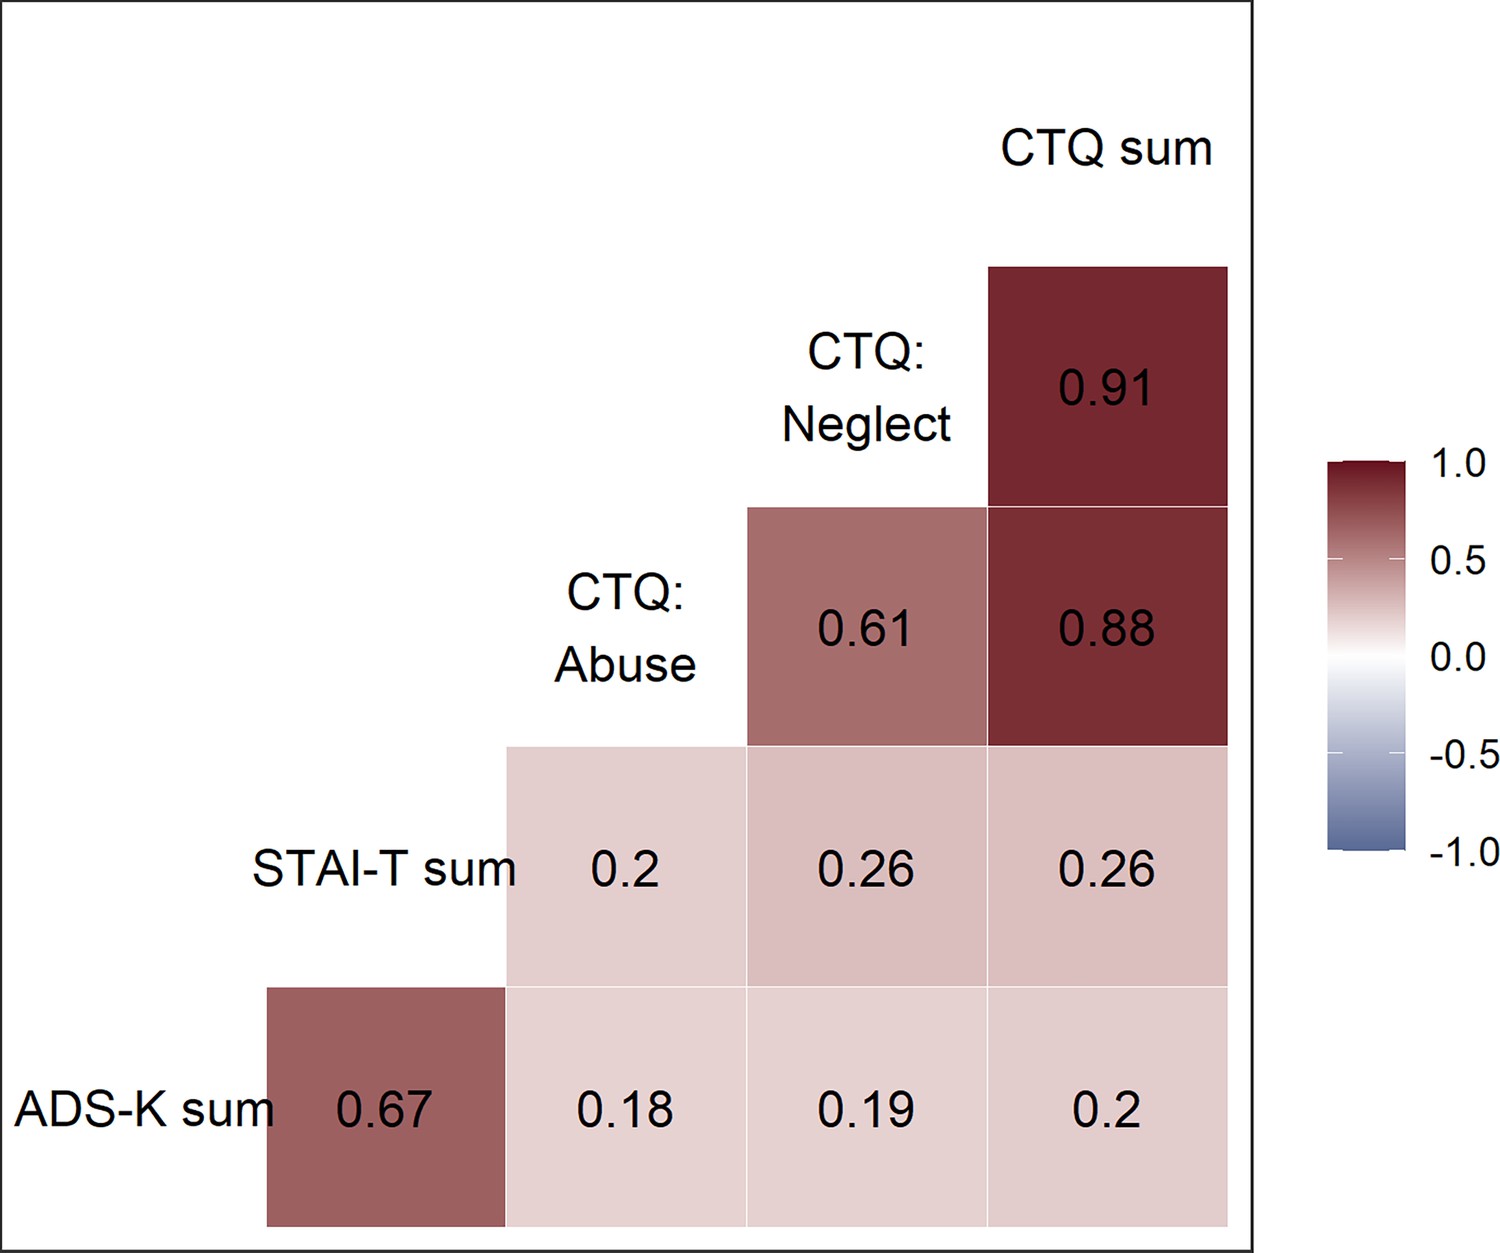
Illustration of zero-order correlations (Pearson’s correlation coefficient) between relevant sample characteristics: different scores of childhood adversity (CTQ sum, CTQ: Neglect, CTQ: Abuse), trait anxiety (STAI-T sum), and depression (ADS-K sum).
All depicted correlations were significant (all p’s<0.001). ADS-K=short version of the Center for Epidemiological Studies-Depression Scale (Hautzinger and Bailer, 1993), STAI-T=State-Trait Anxiety Inventory, Trait (Spielberger, 1983), Abuse and Neglect = composite scores built from childhood trauma questionnaire subscales (CTQ-SF, Bernstein et al., 2003; Wingenfeld et al., 2010).
Appendix 1—figure 2
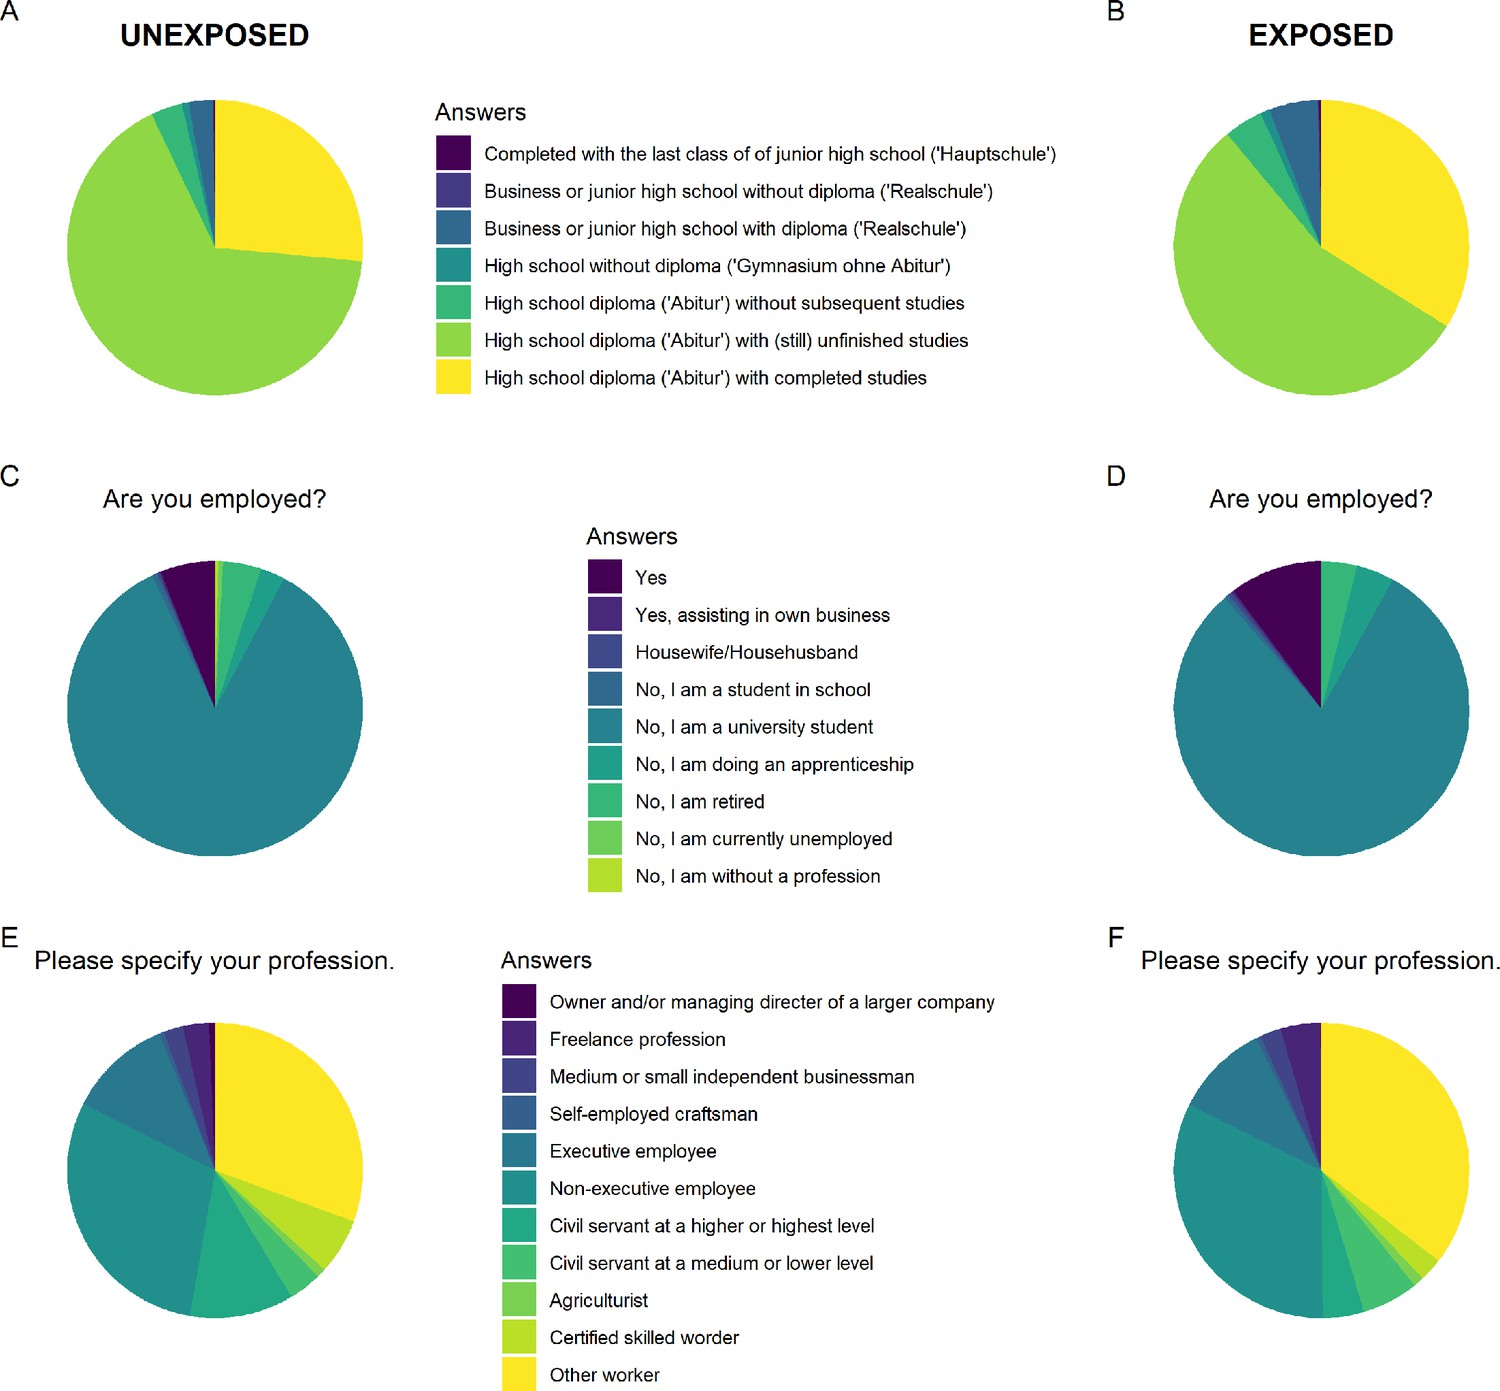
Illustration of the socioeconomic status information of individuals unexposed (left) and exposed (right) to childhood adversity (according to an at least moderate childhood adversity cut-off) inferred from questions about the school degree (A and B), and the current occupational status (C and D) including the type of employment (E and F).
Appendix 1—figure 3
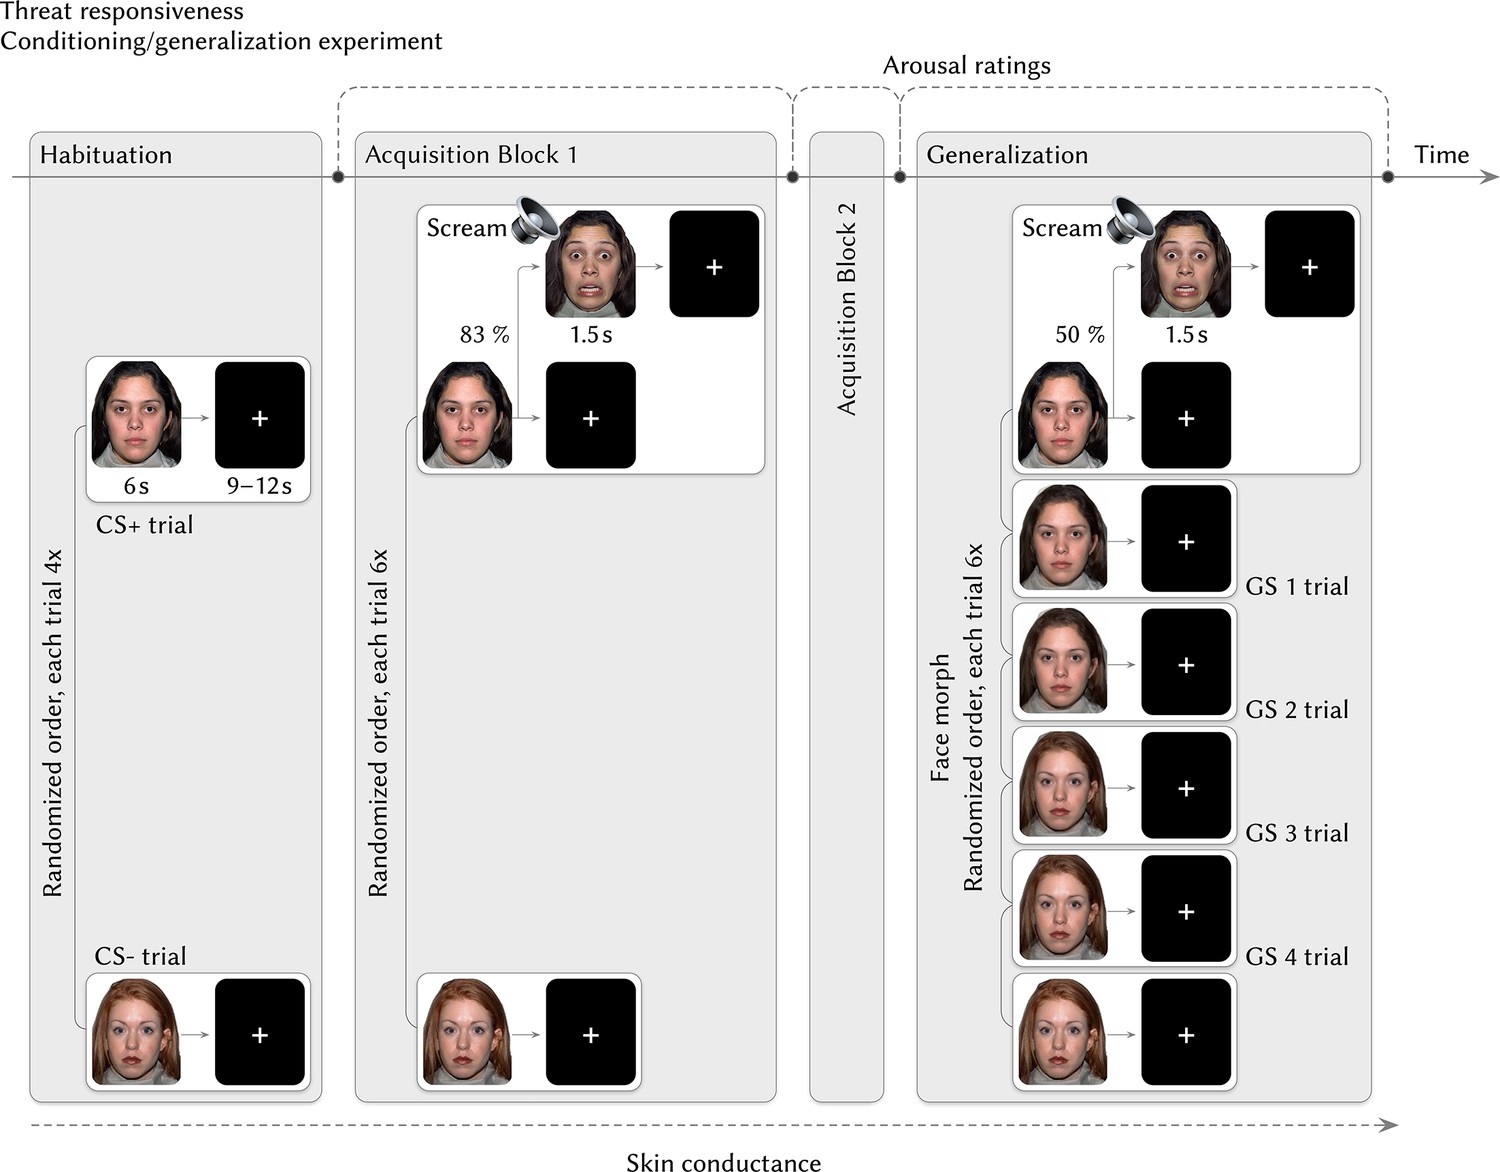
This illustration of the study design was created as part of the publication ‘Prediction of Changes in Negative Affect During the COVID-19 Pandemic by Experimental Fear Conditioning and Generalization Measures’ by Imholze et al., 2023; Figure 1; https://doi.org/10.1027/2151-2604/a000523, which was distributed as a Hogrefe OpenMind article under the license CC BY 4.0 (https://creativecommons.org/licenses/by/4.0).
Please note that the face stimuli used in the actual experiment are different from those shown here. For copyright reasons, we are unable to present the blonde women and have used an image of a redheaded woman as a substitute.
Appendix 1—figure 4
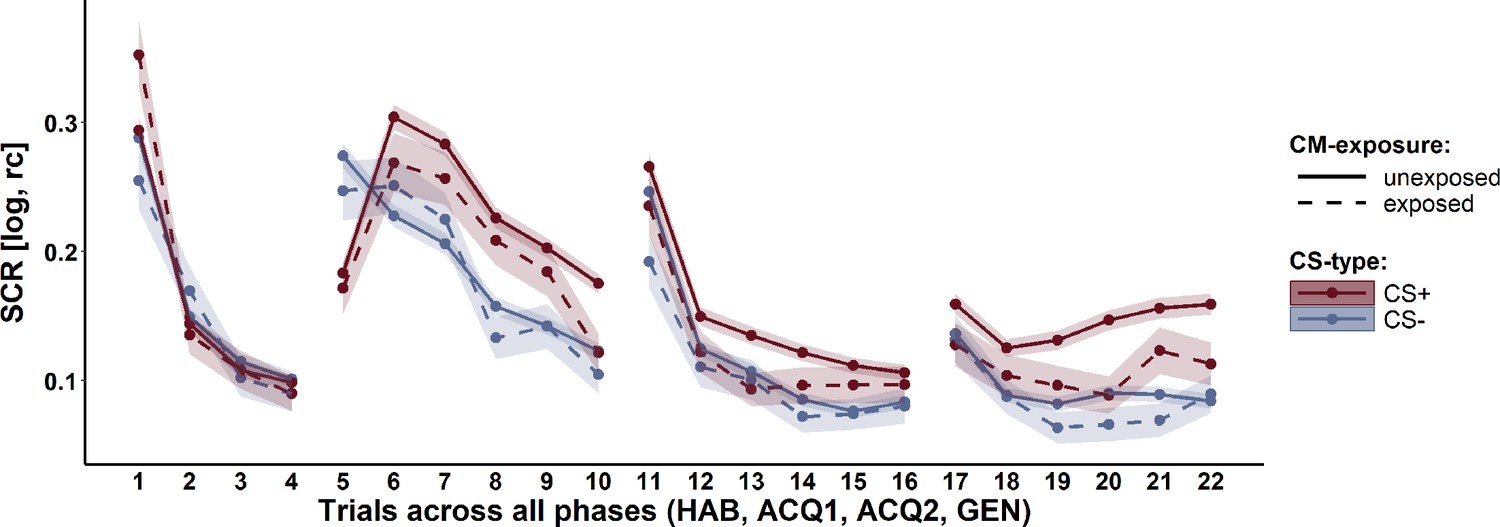
Trial-by-trial skin conductance response (SCR) data across all experimental phases for the CS+ (red) and CS- (blue) for individuals exposed (dashed lines) and unexposed (solid lines) to childhood adversity separately.
Ribbons represent standard errors of the means (SEMs) including nunexposed = 1199 and nexposed = 203.
Appendix 1—figure 5
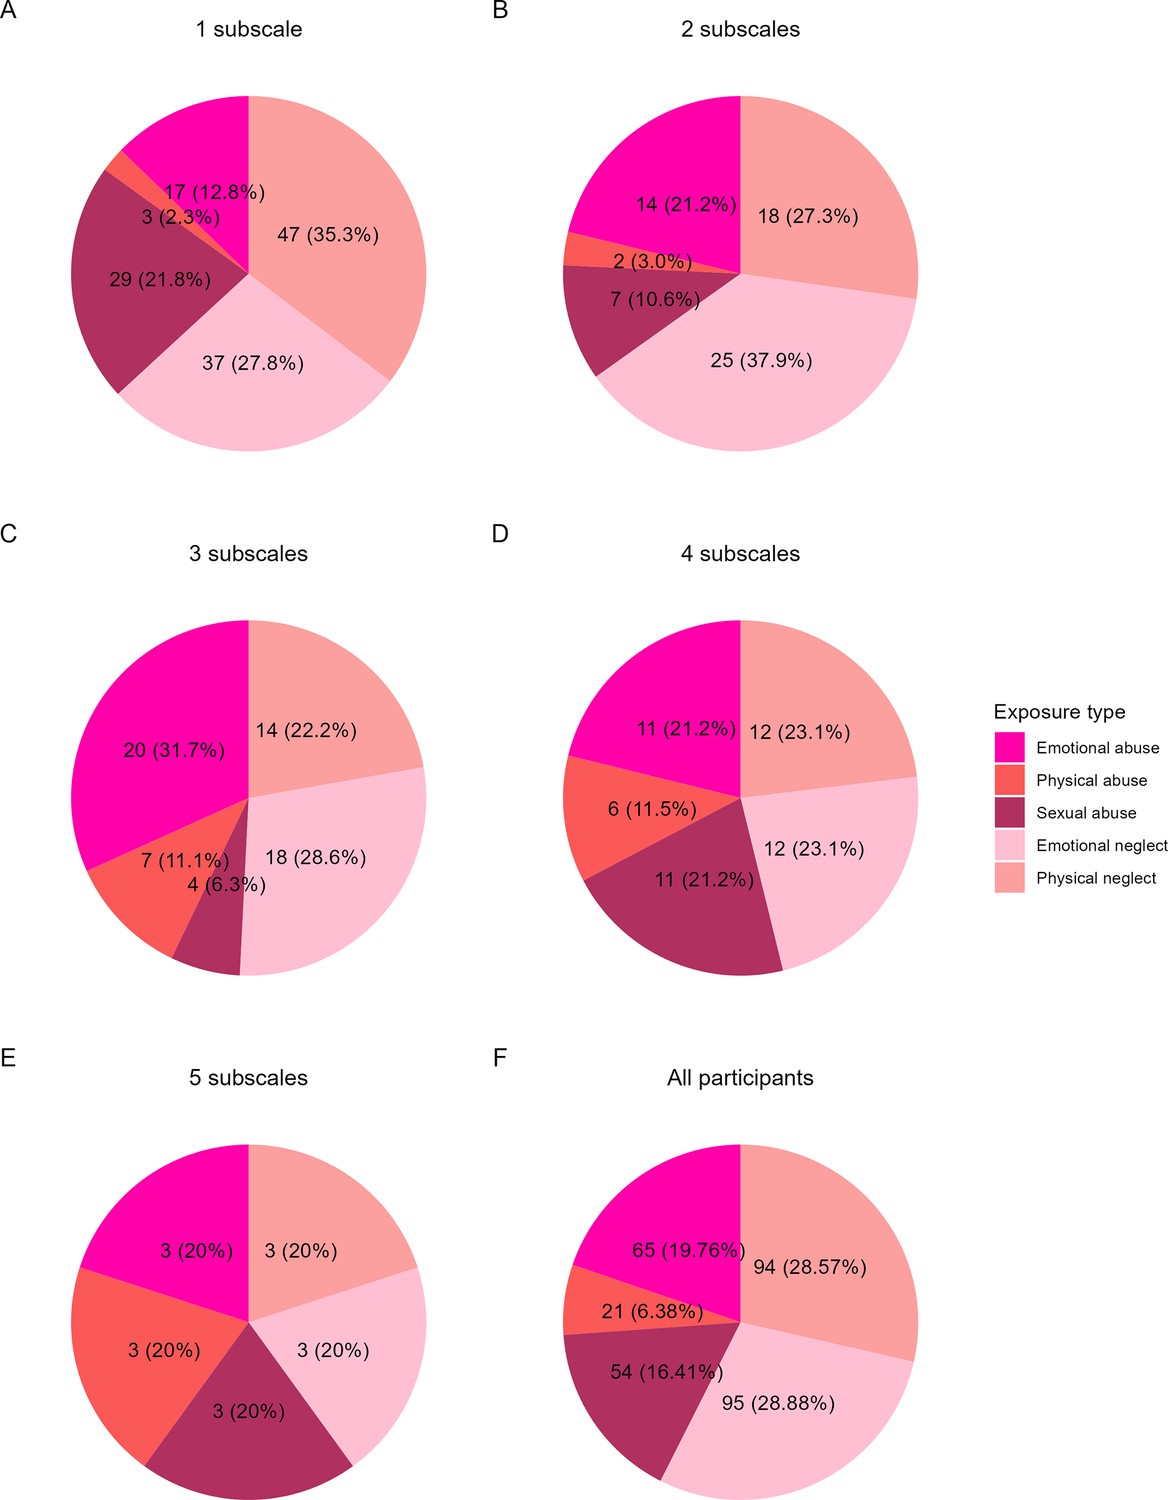
Illustration of the distribution of the different numbers (i.e. 1–5) of exceeded subscales among the Childhood Trauma Questionnaire (CTQ) exposure types emotional abuse, physical abuse, emotional neglect, and physical neglect (A-E) and distribution of exposure types across all participants (F).
Appendix 1—figure 6
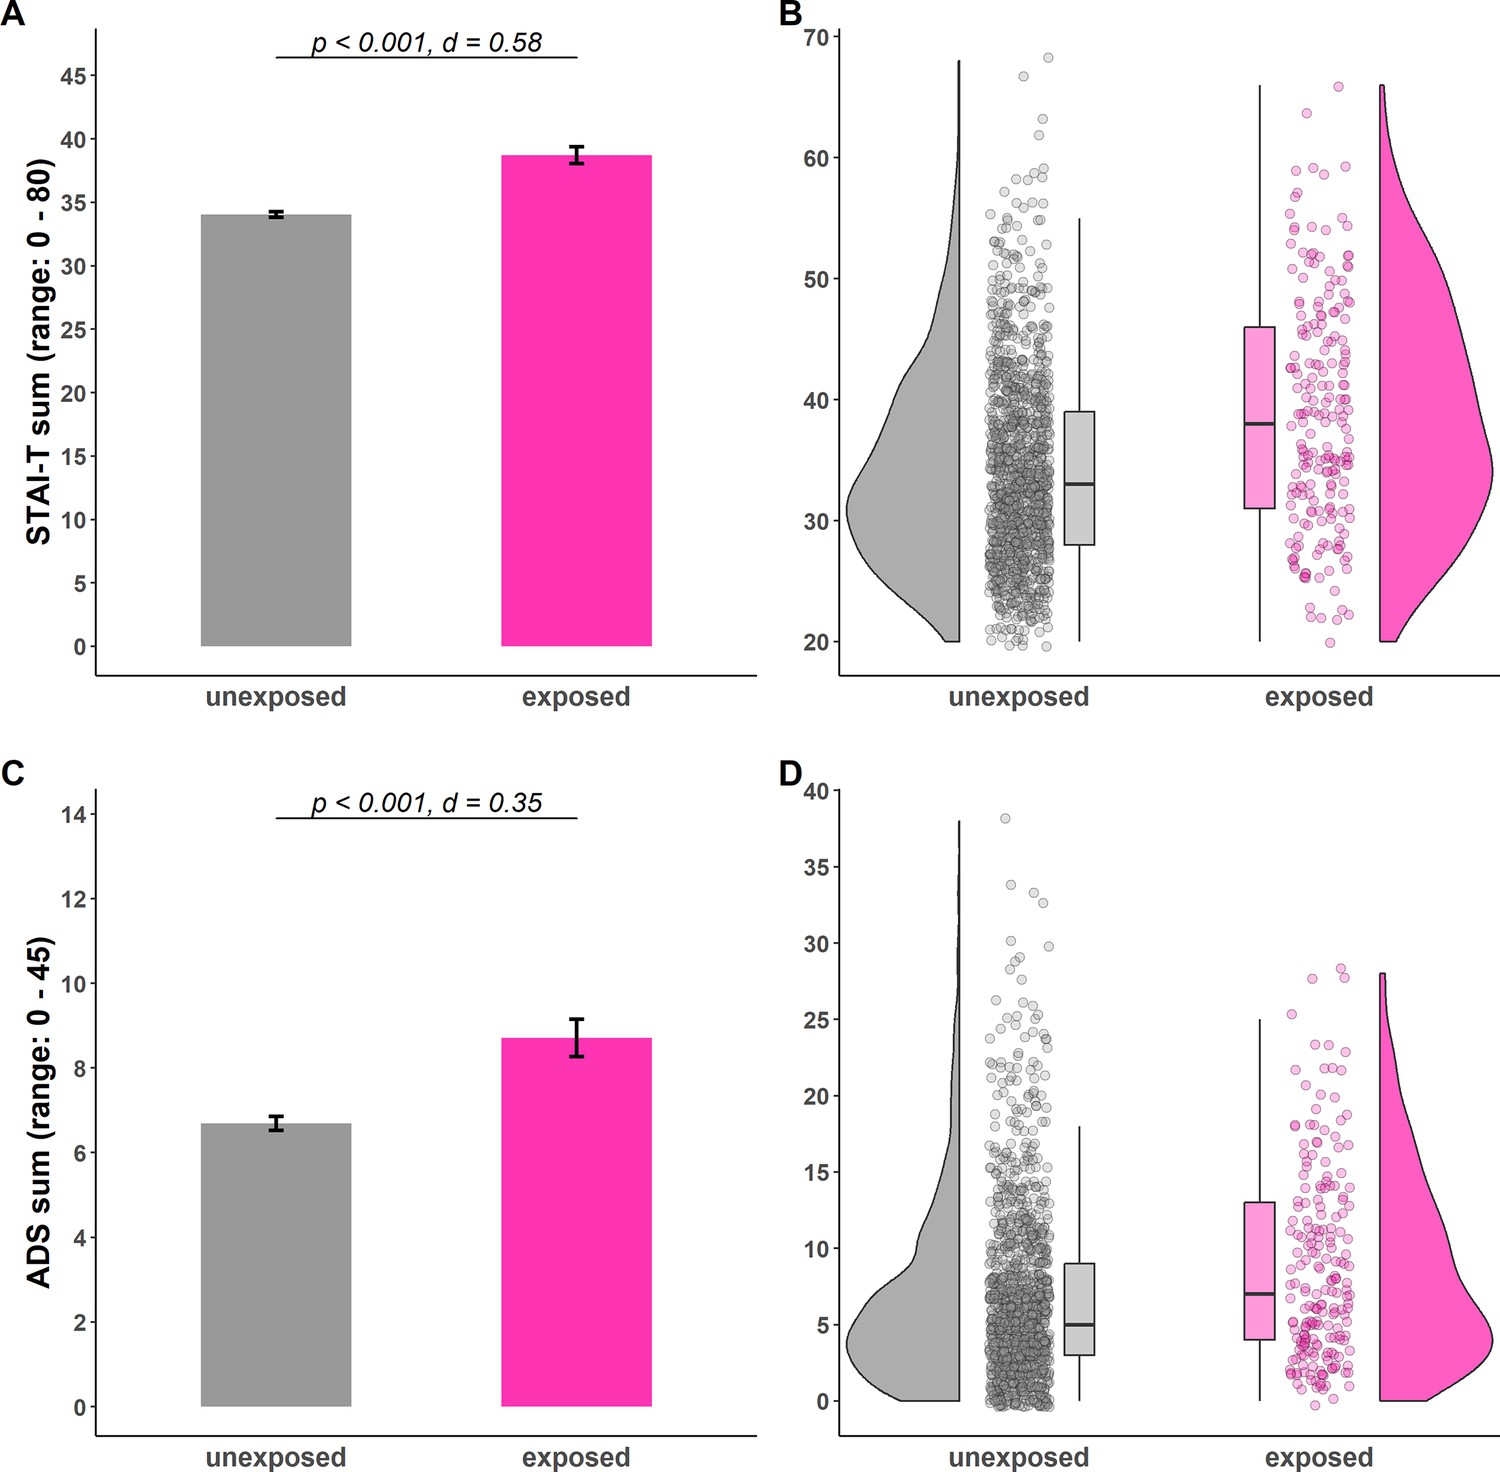
Illustration of STAI-T (A–B) and ADS-K (C–D) sum scores for individuals unexposed (gray) and exposed (pink) to childhood adversity.
Barplots (A and C) with error bars represent means and standard errors of the means (SEMs) with nunexposed = 1199 and nexposed = 203, respectively. The statistical parameters presented in A and C are derived from Welch's tests. The a priori significance level was set to α = 0.05. Distributions of the data are illustrated in the raincloud plots (B and D). Points next to the densities represent the sum scores of each participant. Boxes of boxplots represent the interquartile range (IQR) crossed by the median as a bold line, ends of whiskers represent the minimum/maximum value in the data within the range of 25th/75th percentiles ± 1.5 IQR. STAI-T=Trait scale of the State-Trait Anxiety Inventory (Spielberger, 1983); ADS-K = Allgemeine Depressionsskala - Kurzform (short version of the Center for Epidemiological Studies-Depression Scale, CES-D; Hautzinger and Bailer, 1993).
Appendix 1—figure 7
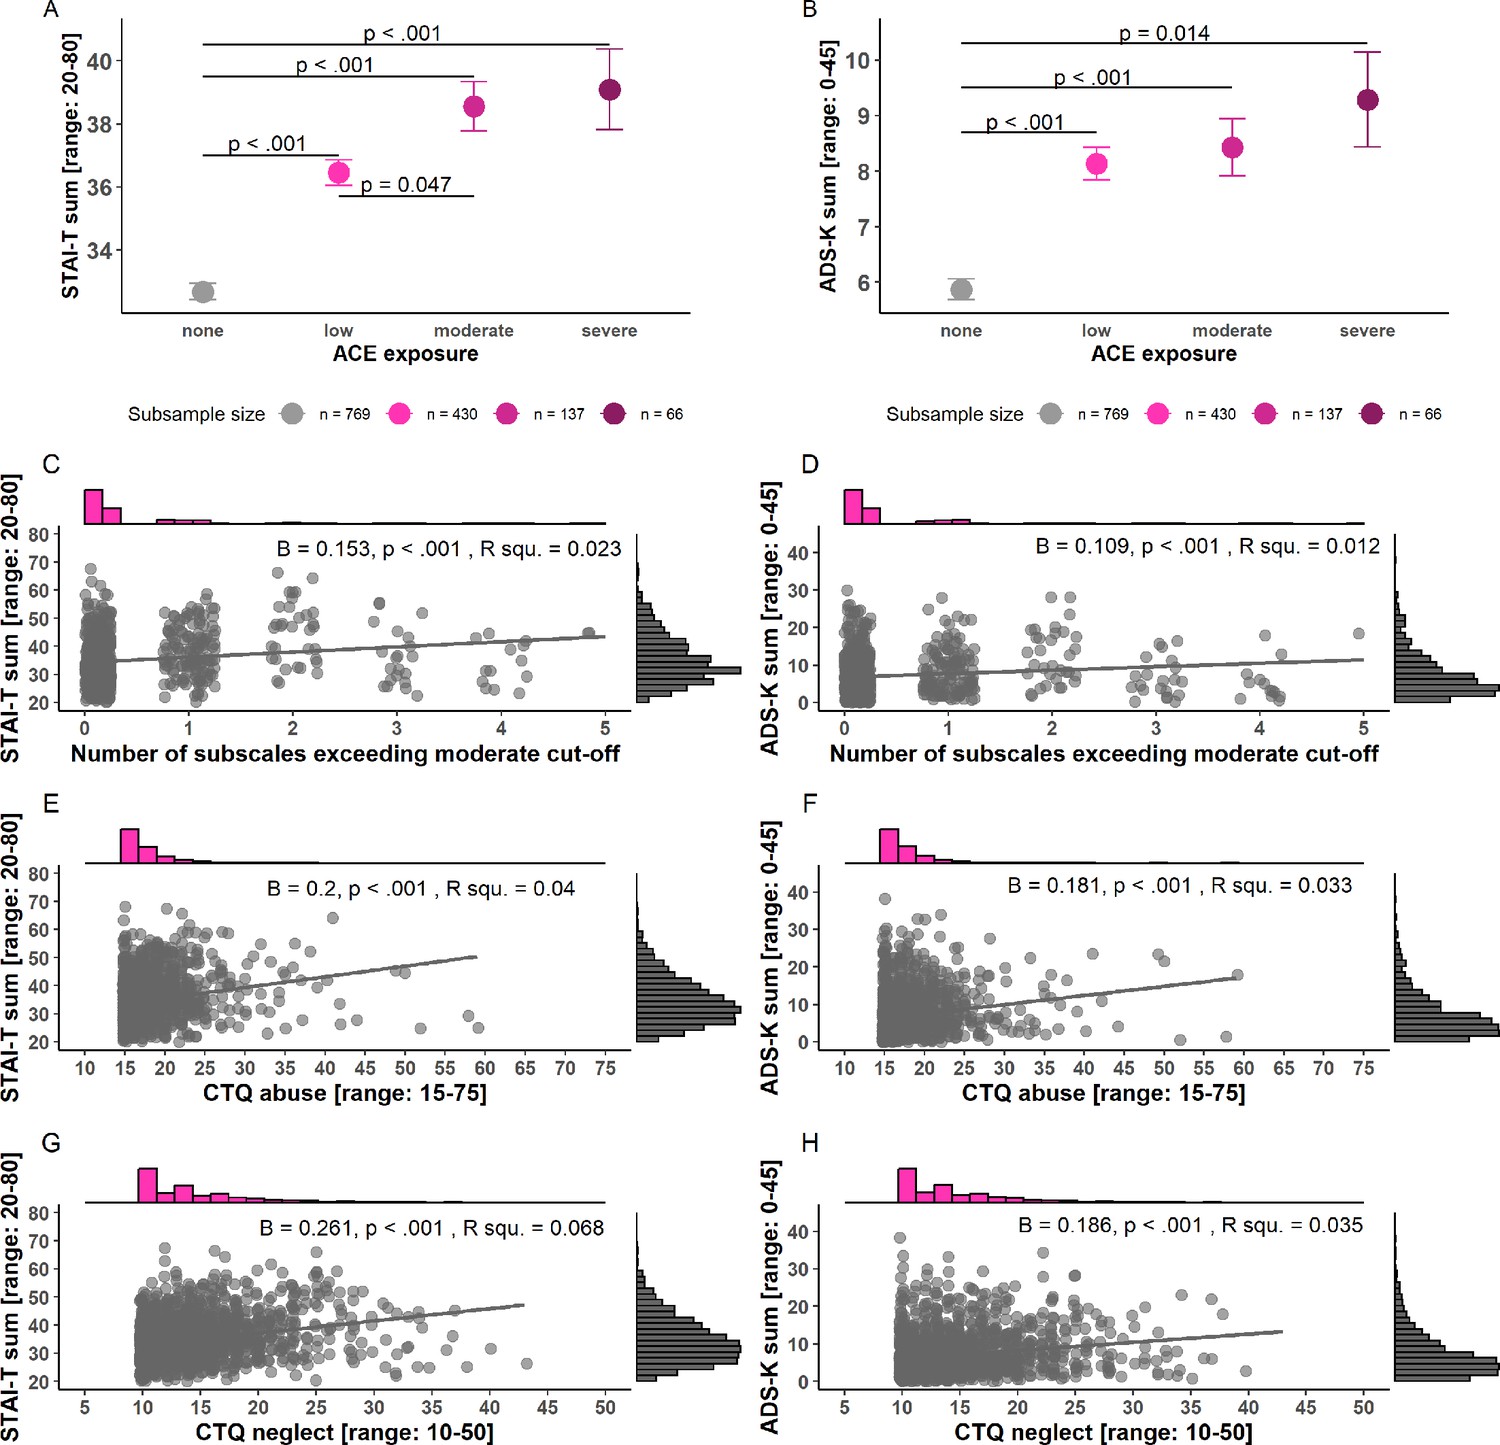
Illustration of associations of STAI-T (A, C, E, G) and ADS-K (B, D, F, H) with childhood adversity operationalized as cumulative risk models (A-D) and the specificity model (E-H).
STAI-T=Trait scale of the State-Trait Anxiety Inventory (Spielberger, 1983); ADS-K = Allgemeine Depressionsskala - Kurzform (short version of the Center for Epidemiological Studies-Depression Scale, CES-D; Hautzinger and Bailer, 1993).
Tables
Table 1
Operationalization of childhood adversity in different theoretical approaches and challenges of their statistical translation.
| Approach name and reference | Operationalization of childhood adversity | Challenges in translating theory into a statistical model |
|---|---|---|
| Main analyses | ||
| Moderate exposure based on CTQ (exposed vs. unexposed) | Short description: At least one subscale met the published cut-off for at least moderate exposure (Bernstein and Fink, 1998; Häuser et al., 2011). The moderate cut-off was chosen, as it was recently identified as the most commonly used in the literature (for a review see Ruge et al., 2024) Procedure: Dichotomization of the sample into exposed vs. unexposed individuals based on published cut-offs: emotional abuse ≥ 13, physical abuse ≥ 10, sexual abuse ≥ 8, emotional neglect ≥ 15, physical neglect ≥ 10. Such cut-off of moderate exposure was employed in previous work by our team (Koppold et al., 2023) and in the literature (Ruge et al., 2024) Statistical test: See Materials and methods: Statistical analyses |
|
| Exploratory analyses | ||
| Cumulative risk model (Evans et al., 2013; McEwen, 2003) | Short description: Based on the assumed key role of cumulative exposure (exposure intensity and frequency) Procedure (a): Classification into four severity groups (no, low, moderate, severe exposure) based on cut-offs published by Bernstein and Fink, 1998 Statistical test (a): Comparison of conditioned responding of the four severity groups by using one-way ANOVAs Procedure (b): Number of subscales exceeding an at least moderate cut-off based on Bernstein and Fink, 1998 and Häuser et al., 2011 Statistical test (b): Number of sub-scales exceeding an at least moderate cut-off as a predictor and conditioned responding as the criterion in simple linear regression models |
|
| Specificity model (McMahon et al., 2003; Pollak et al., 2000; Pollak and Tolley-Schell, 2004) | Short description: Consideration of specific exposure types (abuse vs. neglect) Procedure: Summing up the CTQ subscales of emotional abuse, physical abuse, and sexual abuse yielding a composite score for exposure to ‘abuse’ and summing up the subscales of emotional neglect and physical neglect to yield a composite score for ‘neglect’ (or threat vs. deprivation as done by Sheridan et al., 2017) Statistical test: The abuse and neglect composite scores are tested for associations with conditioned responding in separate regression models. In our sample, n=52 and n=96 individuals were exposed to abuse only and neglect only, respectively, while n=55 reported to have experienced both abuse and neglect. We included all participants in all analyses as done previously (Sheridan et al., 2017) |
|
| Dimensional model (McLaughlin et al., 2016; McLaughlin et al., 2021) | Short description: Consideration of specific exposure types (i.e. abuse and neglect) that are assumed to co-occur and be controlled for the effect of one another (as opposed to the specificity model) Procedure: See specificity model Statistical test: Abuse and neglect scores are tested for associations with conditioned responding in a single linear regression model in which the influence of the other exposure type is controlled for |
|
| General operationalizational challenges |
| |
Table 2
Results of t-tests comparing conditioned stimulus (CS) discrimination, the linear deviation score (i.e. strength of generalization), and general reactivity between exposed and unexposed participants.
| Outcome | Phase | Measure | t | df | p | Cohen’s d | LL (95% CI) | UL (95% CI) |
|---|---|---|---|---|---|---|---|---|
| CS discrimination | ACQ | SCR | 2.33 | 1,400 | 0.020 | –0.18 | –0.33 | –0.03 |
| Arousal ratings | –1.52 | 1,400 | 0.128 | 0.12 | –0.03 | 0.26 | ||
| Valence ratings | 0.20 | 1,400 | 0.845 | –0.01 | –0.16 | 0.13 | ||
| Contigency ratings | 0.70 | 1,400 | 0.484 | –0.05 | –0.20 | 0.10 | ||
| GEN | SCR | 2.34 | 1,400 | 0.020 | –0.18 | –0.33 | –0.03 | |
| Arousal ratings | –0.28 | 1,400 | 0.777 | 0.02 | –0.13 | 0.17 | ||
| Valence ratings | 0.06 | 1,400 | 0.953 | 0.00 | –0.15 | 0.14 | ||
| Contigency ratings | 0.58 | 1,400 | 0.560 | –0.04 | –0.19 | 0.10 | ||
| LDS | GEN | SCR | 1.41 | 295 | 0.158 | –0.10 | –0.25 | 0.05 |
| Arousal ratings | –0.62 | 1,400 | 0.538 | 0.05 | –0.10 | 0.20 | ||
| Valence ratings | 0.30 | 1,400 | 0.765 | –0.02 | –0.17 | 0.13 | ||
| Contigency ratings | –0.95 | 1,400 | 0.344 | 0.07 | –0.08 | 0.22 | ||
| General reactivity | ALL | SCR | 2.06 | 1,400 | 0.040 | –0.16 | –0.31 | –0.01 |
| Arousal ratings | –0.10 | 1,400 | 0.920 | 0.01 | –0.14 | 0.16 | ||
| Valence ratings | 0.83 | 1,400 | 0.408 | –0.06 | –0.21 | 0.09 | ||
| Contigency ratings | –0.97 | 250 | 0.334 | 0.07 | –0.09 | 0.24 |
-
Note. ACQ = acquisition training, GEN = generalization phase, LDS = linear deviation score. Bold numbers indicate significant results (p<0.05).
Table 3
Descriptive information on the subsamples being exposed or unexposed to childhood adversity.
| Variable | Exposed | Unexposed | Statistics |
|---|---|---|---|
| N | 203 (14%) | 1199 (86%) | Χ2(1)=707.57, p<0.001 |
| Female/Male | 124 (61%) / 79 (39%) | 721 (61%) / 478 (39%) | Χ2(1)=0.03, p=0.858 |
| Age (M/SD) | 26.80 (6.99) | 25.14 (5.50) | t(246.1)=–3.21, p<0.001, d=0.29 |
| STAI-T sum (M/SD) | 38.73 (9.52) | 34.04 (7.83) | t(250.4)=–6.65, p<0.001, d=0.58 |
| ADS-K sum (M/SD) | 8.71 (6.31) | 6.69 (5.70) | t(261)=–4.28, p<0.001, d=0.35 |
-
Note. STAI-T = State-Trait Anxiety Inventory, Trait scale (Spielberger, 1983), ADS-K = Allgemeine Depressionsskala - Kurzform (short version of the Center for Epidemiological Studies-Depression Scale, CES-D; Hautzinger and Bailer, 1993). Individuals were classified as exposed to childhood adversity if at least one subscale met the published cut-off (Bernstein and Fink, 1998; Häuser et al., 2011) for an at least moderate exposure (i.e. emotional abuse ≥13, physical abuse ≥10, sexual abuse ≥8, emotional neglect ≥15, physical neglect ≥10).
Appendix 1—table 1
Split-half reliability for skin conductance responses (SCRs).
| Phase | Stimulus type | r | r lower CI | r upper CI |
|---|---|---|---|---|
| Acquisition | CS+ | 0.802 | 0.783 | 0.820 |
| CS- | 0.735 | 0.710 | 0.758 | |
| CS discr. | 0.322 | 0.274 | 0.368 | |
| Generalization | CS+ | 0.720 | 0.693 | 0.744 |
| CS- | 0.470 | 0.429 | 0.510 | |
| CS discr. | 0.346 | 0.299 | 0.391 | |
| GS1 | 0.656 | 0.625 | 0.684 | |
| GS2 | 0.550 | 0.512 | 0.585 | |
| GS3 | 0.561 | 0.524 | 0.596 | |
| GS4 | 0.288 | 0.240 | 0.336 |
-
Note. CS = conditioned stimulus, GS = generalization stimulus, CS discr. = CS discrimination.
Appendix 1—table 2
Resu of the repetition of our main analyses using linear mixed models for skin conductance response (SCR) (A), arousal (B), valence (C), and contingency ratings (D).
| A | ||||||||||||||||
|---|---|---|---|---|---|---|---|---|---|---|---|---|---|---|---|---|
| CS discrimination SCR during ACQ | CS discrimination SCR during GEN | LDS SCR | General reactivity SCR | |||||||||||||
| Predictors | Estimates | CI | p | df | Estimates | CI | p | df | Estimates | CI | p | df | Estimates | CI | p | df |
| (Intercept) | 0.18 | –0.03–0.40 | 0.1 | 1367.26 | 0.03 | –0.25–0.30 | 0.841 | 1347.55 | 0.02 | –0.12–0.16 | 0.771 | 1387.92 | 0.16 | –0.10–0.43 | 0.23 | 130.64 |
| Age | 0 | –0.00 – 0.00 | 0.327 | 1388.92 | 0 | –0.00 – 0.00 | 0.334 | 1388.97 | 0 | –0.00 – 0.00 | 0.655 | 1163.35 | 0 | –0.00 – 0.00 | 0.429 | 1386.32 |
| Sex [1] | –0.02 | –0.03 to –0.01 | <0.001 | 1388.87 | 0 | –0.02–0.01 | 0.818 | 1388.99 | 0 | –0.00–0.01 | 0.427 | 1074.14 | 0.01 | –0.00–0.02 | 0.176 | 1386.33 |
| dummy(School level)1 | 0.12 | –0.18–0.41 | 0.448 | 1386 | 0.24 | –0.14–0.63 | 0.22 | 1386 | 0.09 | –0.11–0.28 | 0.382 | 1386.16 | 0.02 | –0.32–0.36 | 0.913 | 1386 |
| dummy(School level)2 | –0.15 | –0.37–0.07 | 0.193 | 1386.7 | 0.03 | –0.26–0.31 | 0.844 | 1386.54 | 0.02 | –0.12–0.17 | 0.753 | 1386.6 | –0.05 | –0.30–0.20 | 0.706 | 1386.03 |
| dummy(School level)3 | –0.09 | –0.33–0.14 | 0.431 | 1386.54 | –0.06 | –0.36–0.24 | 0.699 | 1386.42 | 0.01 | –0.14–0.16 | 0.931 | 1388.1 | –0.06 | –0.33–0.20 | 0.654 | 1386.02 |
| dummy(School level)4 | –0.16 | –0.37–0.06 | 0.153 | 1386.67 | 0.04 | –0.23–0.31 | 0.775 | 1386.52 | 0 | –0.14–0.13 | 0.951 | 1387.75 | –0.03 | –0.27–0.22 | 0.83 | 1386.03 |
| dummy(School level)5 | –0.17 | –0.39–0.05 | 0.132 | 1386.36 | 0.05 | –0.23–0.33 | 0.708 | 1386.28 | –0.01 | –0.16–0.13 | 0.846 | 1388.84 | –0.04 | –0.29–0.21 | 0.754 | 1386.02 |
| dummy(School level)6 | –0.13 | –0.35–0.08 | 0.221 | 1386.47 | 0.02 | –0.25–0.30 | 0.871 | 1386.36 | –0.01 | –0.14–0.13 | 0.936 | 1388.97 | –0.04 | –0.28–0.20 | 0.751 | 1386.02 |
| dummy(School level)7 | –0.14 | –0.35–0.07 | 0.193 | 1386.45 | 0.05 | –0.23–0.32 | 0.745 | 1386.34 | –0.01 | –0.15–0.13 | 0.898 | 1388.96 | –0.04 | –0.28–0.20 | 0.754 | 1386.02 |
| dummy(School level)8 | –0.14 | –0.36–0.07 | 0.181 | 1386.38 | 0.03 | –0.24–0.31 | 0.809 | 1386.29 | –0.01 | –0.14–0.13 | 0.928 | 1388.97 | –0.05 | –0.29–0.20 | 0.713 | 1386.02 |
| dummy(School level)9 | –0.21 | –0.51–0.09 | 0.163 | 1386.59 | –0.09 | –0.47–0.30 | 0.659 | 1386.45 | –0.1 | –0.30–0.09 | 0.29 | 1387.6 | –0.05 | –0.40–0.29 | 0.754 | 1386.03 |
| Childhood adversity [1] | –0.02 | –0.04 to –0.00 | 0.017 | 1386.71 | –0.02 | –0.04 to –0.00 | 0.024 | 1386.55 | –0.01 | –0.02–0.00 | 0.178 | 1386.58 | –0.02 | –0.04 to –0.00 | 0.024 | 1386.03 |
| Random effects | ||||||||||||||||
| σ2 | 0.01 | 0.02 | 0 | 0.02 | ||||||||||||
| τ00 | 0.00 Site | 0.00 Site | 0.00 Site | 0.01 Site | ||||||||||||
| ICC | 0.03 | 0.04 | 0.41 | |||||||||||||
| N | 4 Site | 4 Site | 4 Site | 4 Site | ||||||||||||
| Observations | 1402 | 1402 | 1402 | 1402 | ||||||||||||
| Marginal R2/Conditional R2 | 0.021/0.049 | 0.012/0.049 | 0.006/NA | 0.004/0.414 | ||||||||||||
| B | ||||||||||||||||
| CS discrimination arousal ratings during ACQ | CS discrimination arousal ratings during GEN | LDS arousal ratings | General reactivity arousal ratings | |||||||||||||
| Predictors | Estimates | CI | p | df | Estimates | CI | p | df | Estimates | CI | p | df | Estimates | CI | p | df |
| (Intercept) | 4.73 | 0.46–9.00 | 0.03 | 1387.12 | 3.89 | –0.92–8.69 | 0.113 | 1386.01 | 1.37 | –1.27–4.01 | 0.308 | 1388.45 | 3.22 | 0.85–5.59 | 0.008 | 1333.36 |
| Age | –0.02 | –0.04–0.01 | 0.19 | 1381.61 | 0 | –0.02–0.03 | 0.854 | 1384.27 | 0.01 | –0.00–0.03 | 0.063 | 1213.66 | –0.01 | –0.03 to –0.00 | 0.034 | 1388.87 |
| Sex [1] | –0.72 | –0.96 to –0.49 | <0.001 | 1380.21 | –0.68 | –0.94 to –0.42 | <0.001 | 1383.34 | –0.1 | –0.24–0.05 | 0.198 | 1151.26 | –0.22 | –0.35 to –0.09 | 0.001 | 1388.9 |
| dummy(School level)1 | –2.02 | –7.98–3.95 | 0.507 | 1386.01 | 1 | –5.70–7.70 | 0.769 | 1386.01 | –1.49 | –5.17–2.19 | 0.428 | 1386.12 | 1.74 | –1.56–5.03 | 0.301 | 1386 |
| dummy(School level)2 | –1.93 | –6.33–2.48 | 0.391 | 1387.53 | –1.08 | –6.03–3.87 | 0.668 | 1387.35 | –1.2 | –3.92–1.52 | 0.388 | 1388.08 | 0.66 | –1.78–3.09 | 0.596 | 1386.48 |
| dummy(School level)3 | –1.96 | –6.58–2.67 | 0.407 | 1387.23 | –1.29 | –6.49–3.91 | 0.627 | 1387.07 | –1.02 | –3.88–1.84 | 0.484 | 1388.8 | 0.45 | –2.11–3.01 | 0.73 | 1386.37 |
| dummy(School level)4 | –1.46 | –5.71–2.79 | 0.499 | 1387.45 | –0.86 | –5.64–3.91 | 0.723 | 1387.28 | –1.2 | –3.82–1.43 | 0.372 | 1388.6 | 1.26 | –1.09–3.61 | 0.294 | 1386.46 |
| dummy(School level)5 | –0.71 | –5.06–3.64 | 0.747 | 1386.81 | –0.42 | –5.31–4.47 | 0.868 | 1386.71 | –1.8 | –4.49–0.89 | 0.189 | 1388.62 | 1.57 | –0.83–3.98 | 0.2 | 1386.25 |
| dummy(School level)6 | –0.8 | –5.06–3.46 | 0.712 | 1387.04 | –0.48 | –5.26–4.31 | 0.845 | 1386.91 | –1.34 | –3.97–1.29 | 0.317 | 1388.98 | 1.16 | –1.19–3.51 | 0.333 | 1386.32 |
| dummy(School level)7 | –1.27 | –5.49–2.96 | 0.556 | 1387.01 | –0.47 | –5.22–4.27 | 0.845 | 1386.89 | –1.19 | –3.80–1.42 | 0.373 | 1388.98 | 1.28 | –1.05–3.62 | 0.281 | 1386.3 |
| dummy(School level)8 | –1.29 | –5.52–2.93 | 0.549 | 1386.85 | –0.42 | –5.17–4.33 | 0.862 | 1386.75 | –1.23 | –3.84–1.38 | 0.356 | 1388.8 | 1.29 | –1.04–3.63 | 0.278 | 1386.26 |
| dummy(School level)9 | 1.99 | –3.99–7.96 | 0.514 | 1387.32 | 2.92 | –3.79–9.64 | 0.393 | 1387.16 | –3.15 | –6.84–0.55 | 0.095 | 1388.59 | 1.59 | –1.72–4.89 | 0.346 | 1386.4 |
| Childhood adversity [1] | 0.26 | –0.06–0.59 | 0.108 | 1387.55 | 0.06 | –0.30–0.42 | 0.752 | 1387.37 | 0.04 | –0.16–0.24 | 0.67 | 1388.05 | 0.03 | –0.15–0.21 | 0.738 | 1386.48 |
| Random effects | ||||||||||||||||
| σ2 | 4.62 | 5.83 | 1.76 | 1.41 | ||||||||||||
| τ00 | 0.05 Site | 0.08 Site | 0.00 Site | 0.06 Site | ||||||||||||
| ICC | 0.01 | 0.01 | 0 | 0.04 | ||||||||||||
| N | 4 Site | 4 Site | 4 Site | 4 Site | ||||||||||||
| Observations | 1402 | 1402 | 1402 | 1402 | ||||||||||||
| Marginal R2/Conditional R2 | 0.036/0.046 | 0.021/0.034 | 0.009/0.010 | 0.019/0.061 | ||||||||||||
| C | ||||||||||||||||
| CS discrimination valence ratings during ACQ | CS discrimination valence ratings during GEN | LDS valence ratings | General reactivity valence ratings | |||||||||||||
| Predictors | Estimates | CI | p | df | Estimates | CI | p | df | Estimates | CI | p | df | Estimates | CI | p | df |
| (Intercept) | 3.58 | –0.74–7.90 | 0.104 | 1377.81 | 3.4 | –1.67–8.48 | 0.189 | 1388.66 | 2.39 | –0.25–5.02 | 0.076 | 1382.58 | 5.82 | 3.94–7.70 | <0.001 | 1365.32 |
| Age | –0.03 | –0.06 to –0.01 | 0.005 | 1388.31 | –0.02 | –0.04–0.01 | 0.266 | 1243.67 | 0 | –0.01–0.02 | 0.884 | 1387.16 | –0.01 | –0.02–0.00 | 0.062 | 1388.96 |
| Sex [1] | –0.55 | –0.79 to –0.31 | <0.001 | 1388.11 | –0.66 | –0.94 to –0.38 | <0.001 | 1195.8 | –0.07 | –0.21–0.08 | 0.352 | 1386.74 | –0.01 | –0.11–0.10 | 0.916 | 1388.92 |
| dummy(School level)1 | –2.03 | –8.05–3.98 | 0.507 | 1386 | –1.02 | –8.11–6.08 | 0.779 | 1386.1 | –1.75 | –5.42–1.93 | 0.351 | 1386 | –0.84 | –3.46–1.77 | 0.527 | 1386 |
| dummy(School level)2 | –2.53 | –6.98–1.91 | 0.263 | 1386.89 | –1.19 | –6.44–4.05 | 0.655 | 1388.63 | –2.08 | –4.79–0.64 | 0.134 | 1387.08 | –1.14 | –3.07–0.79 | 0.246 | 1386.68 |
| dummy(School level)3 | –0.48 | –5.15–4.19 | 0.84 | 1386.7 | –1.2 | –6.71–4.30 | 0.668 | 1388.97 | –1.33 | –4.18–1.52 | 0.361 | 1386.84 | –1.55 | –3.58–0.48 | 0.134 | 1386.52 |
| dummy(School level)4 | –0.31 | –4.59–3.98 | 0.889 | 1386.85 | 0.19 | –4.87–5.25 | 0.941 | 1388.88 | –1.91 | –4.53–0.71 | 0.154 | 1387.02 | –0.85 | –2.72–1.01 | 0.371 | 1386.65 |
| dummy(School level)5 | 0.07 | –4.32–4.46 | 0.976 | 1386.46 | 0.58 | –4.60–5.75 | 0.827 | 1388.45 | –2.3 | –4.99–0.38 | 0.092 | 1386.56 | –0.36 | –2.27–1.55 | 0.711 | 1386.35 |
| dummy(School level)6 | 0.07 | –4.22–4.37 | 0.973 | 1386.6 | 0.11 | –4.95–5.18 | 0.965 | 1388.89 | –1.81 | –4.44–0.81 | 0.176 | 1386.72 | –0.91 | –2.78–0.96 | 0.338 | 1386.45 |
| dummy(School level)7 | –0.53 | –4.79–3.73 | 0.807 | 1386.57 | –0.12 | –5.14–4.91 | 0.964 | 1388.89 | –1.85 | –4.46–0.75 | 0.163 | 1386.7 | –0.74 | –2.59–1.11 | 0.433 | 1386.43 |
| dummy(School level)8 | –0.4 | –4.67–3.86 | 0.853 | 1386.48 | 0.04 | –4.99–5.07 | 0.987 | 1388.64 | –1.83 | –4.43–0.78 | 0.17 | 1386.59 | –0.75 | –2.61–1.10 | 0.426 | 1386.36 |
| dummy(School level)9 | 2.2 | –3.83–8.23 | 0.474 | 1386.75 | 2.68 | –4.43–9.80 | 0.459 | 1388.9 | –3.61 | –7.30–0.07 | 0.055 | 1386.91 | –0.41 | –3.04–2.21 | 0.757 | 1386.57 |
| Childhood adversity [1] | –0.02 | –0.35–0.31 | 0.902 | 1386.9 | –0.01 | –0.40–0.37 | 0.95 | 1388.6 | –0.03 | –0.23–0.17 | 0.754 | 1387.09 | –0.04 | –0.18–0.10 | 0.581 | 1386.69 |
| Random effects | ||||||||||||||||
| σ2 | 4.7 | 6.53 | 1.76 | 0.89 | ||||||||||||
| τ00 | 0.10 Site | 0.01 Site | 0.03 Site | 0.03 Site | ||||||||||||
| ICC | 0.02 | 0 | 0.02 | 0.03 | ||||||||||||
| N | 4 Site | 4 Site | 4 Site | 4 Site | ||||||||||||
| Observations | 1402 | 1402 | 1402 | 1402 | ||||||||||||
| Marginal R2/Conditional R2 | 0.035/0.055 | 0.021/0.022 | 0.006/0.023 | 0.015/0.044 | ||||||||||||
| D | ||||||||||||||||
| CS discrimination contingency ratings during ACQ | CS discrimination contingency ratings during GEN | LDS contingency ratings | General reactivity contingency ratings | |||||||||||||
| Predictors | Estimates | CI | p | df | Estimates | CI | p | df | Estimates | CI | p | df | Estimates | CI | p | df |
| (Intercept) | 5.56 | –57.39–68.52 | 0.862 | 1381.99 | 83.3 | 25.26–141.34 | 0.005 | 1384.67 | 43.25 | 10.35–76.14 | 0.01 | 1379.65 | 21.72 | –3.20–46.65 | 0.088 | 1169.04 |
| Age | –0.18 | –0.53–0.16 | 0.303 | 1387.39 | 0.2 | –0.12–0.52 | 0.217 | 1385.88 | 0.03 | –0.15–0.21 | 0.728 | 1388.01 | 0 | –0.15–0.15 | 0.963 | 1170.37 |
| Sex [1] | –6.28 | –9.74 to –2.82 | <0.001 | 1387.01 | –3.72 | –6.91 to –0.53 | 0.022 | 1385.23 | 0.58 | –1.22–2.39 | 0.526 | 1387.75 | –1.58 | –3.05 to –0.11 | 0.036 | 1159.35 |
| dummy(School level)1 | 94.82 | 7.05–182.59 | 0.034 | 1386 | 0.2 | –80.74–81.14 | 0.996 | 1386.01 | 0.03 | –45.82–45.88 | 0.999 | 1386 | 9.17 | –25.54–43.88 | 0.604 | 1169 |
| dummy(School level)2 | 21.75 | –43.07–86.58 | 0.51 | 1387.05 | –45.11 | –104.90–14.67 | 0.139 | 1387.21 | –30.03 | –63.89–3.83 | 0.082 | 1386.95 | 9.97 | –15.78–35.73 | 0.447 | 1170.68 |
| dummy(School level)3 | 35.78 | –32.32–103.88 | 0.303 | 1386.82 | –34.55 | –97.35–28.25 | 0.281 | 1386.96 | –29.19 | –64.76–6.38 | 0.108 | 1386.74 | 13.87 | –13.07–40.81 | 0.313 | 1170.47 |
| dummy(School level)4 | 46.02 | –16.56–108.60 | 0.149 | 1386.99 | –32.68 | –90.40–25.03 | 0.267 | 1387.15 | –29.54 | –62.23–3.15 | 0.076 | 1386.9 | 20.52 | –4.28–45.31 | 0.105 | 1170.59 |
| dummy(School level)5 | 55.51 | –8.54–119.57 | 0.089 | 1386.54 | –35.9 | –94.97–23.17 | 0.233 | 1386.63 | –35.79 | –69.25 to –2.33 | 0.036 | 1386.49 | 23.91 | –1.66–49.49 | 0.067 | 1169.58 |
| dummy(School level)6 | 49.68 | –12.99–112.35 | 0.12 | 1386.7 | –31.66 | –89.46–26.13 | 0.283 | 1386.82 | –32.52 | –65.26–0.22 | 0.052 | 1386.64 | 21.1 | –3.75–45.94 | 0.096 | 1170.1 |
| dummy(School level)7 | 53.68 | –8.52–115.88 | 0.091 | 1386.68 | –29.33 | –86.69–28.03 | 0.316 | 1386.79 | –30.67 | –63.16–1.82 | 0.064 | 1386.61 | 18.22 | –6.39–42.83 | 0.147 | 1170.18 |
| dummy(School level)8 | 56.22 | –6.02–118.46 | 0.077 | 1386.57 | –30.69 | –88.08–26.71 | 0.294 | 1386.67 | –30.51 | –63.02–2.00 | 0.066 | 1386.51 | 17.44 | –7.18–42.07 | 0.165 | 1169.91 |
| dummy(School level)9 | 89.88 | 1.91–177.85 | 0.045 | 1386.89 | –57.56 | –138.69–23.57 | 0.164 | 1387.04 | –35.92 | –81.87–10.03 | 0.125 | 1386.8 | –0.23 | –35.05–34.58 | 0.989 | 1170.57 |
| Childhood adversity [1] | –0.86 | –5.61–3.89 | 0.723 | 1387.06 | –1.26 | –5.65–3.12 | 0.572 | 1387.23 | 1.13 | –1.35–3.62 | 0.37 | 1386.96 | 0.77 | –1.27–2.81 | 0.461 | 1170.8 |
| Random effects | ||||||||||||||||
| σ2 | 1001 | 851.3 | 273.12 | 156.5 | ||||||||||||
| τ00 | 18.22 Site | 12.82 Site | 5.58 Site | 0.88 Site | ||||||||||||
| ICC | 0.02 | 0.01 | 0.02 | 0.01 | ||||||||||||
| N | 4 Site | 4 Site | 4 Site | 3 Site | ||||||||||||
| Observations | 1402 | 1402 | 1402 | 1184 | ||||||||||||
| Marginal R2/Conditional R2 | 0.029/0.047 | 0.009/0.024 | 0.008/0.028 | 0.020/0.025 | ||||||||||||
-
Note. Due to its categorical nature, we included school level as a dummy variable.
Appendix 1—table 3
Exploratory results of testing the cumulative risk model involving severity groups using ANOVAs with exposure to abuse as between-subject factor and conditioned stimulus (CS) discrimination, LDS, and general reactivity as dependent variable.
| Outcome | Phase | Measure | Mean 'none' | SD 'none' | Mean 'low' | SD 'low' | Mean 'moderate' | SD 'moderate' | Mean ’severe' | SD ’severe' | dfNum | dfDen | F | p | partial Eta2 |
|---|---|---|---|---|---|---|---|---|---|---|---|---|---|---|---|
| CS discrimination | ACQ | SCR | 0.05 | 0.11 | 0.04 | 0.10 | 0.02 | 0.11 | 0.03 | 0.10 | 3 | 1,398 | 2.35 | 0.071 | 0.00 |
| Arousal ratings | 2.80 | 2.21 | 2.76 | 2.18 | 2.99 | 2.07 | 3.13 | 2.21 | 3 | 1,398 | 0.86 | 0.459 | 0.00 | ||
| Valence ratings | 2.05 | 2.19 | 2.21 | 2.21 | 2.11 | 2.21 | 2.00 | 2.41 | 3 | 1,398 | 0.54 | 0.655 | 0.00 | ||
| Contingency ratings | 53.01 | 31.88 | 52.06 | 32.00 | 52.37 | 33.16 | 48.03 | 35.02 | 3 | 1,398 | 0.51 | 0.673 | 0.00 | ||
| GEN | SCR | 0.05 | 0.14 | 0.05 | 0.14 | 0.01 | 0.12 | 0.04 | 0.14 | 3 | 1,398 | 2.36 | 0.070 | 0.00 | |
| Arousal ratings | 3.23 | 2.44 | 3.02 | 2.42 | 3.12 | 2.35 | 3.39 | 2.77 | 3 | 1,398 | 0.91 | 0.437 | 0.00 | ||
| Valence ratings | 2.66 | 2.64 | 2.73 | 2.41 | 2.66 | 2.53 | 2.71 | 2.89 | 3 | 1,398 | 0.07 | 0.975 | 0.00 | ||
| Contingency ratings | 58.20 | 28.95 | 56.12 | 28.66 | 56.93 | 30.43 | 54.55 | 35.09 | 3 | 137 | 0.80 | 0.498 | 0.13 | ||
| LDS | GEN | SCR | 0.01 | 0.07 | 0.01 | 0.07 | 0.00 | 0.06 | 0.00 | 0.06 | 3 | 1,398 | 0.60 | 0.615 | 0.00 |
| Arousal ratings | 0.52 | 1.32 | 0.38 | 1.32 | 0.48 | 1.40 | 0.63 | 1.25 | 3 | 1,398 | 1.38 | 0.248 | 0.00 | ||
| Valence ratings | 0.56 | 1.33 | 0.54 | 1.33 | 0.50 | 1.23 | 0.59 | 1.49 | 3 | 1,398 | 0.14 | 0.935 | 0.00 | ||
| Contingency ratings | 14.11 | 16.42 | 13.91 | 16.79 | 14.82 | 17.43 | 16.10 | 16.32 | 3 | 1,398 | 0.40 | 0.754 | 0.00 | ||
| General reactivity | ALL | SCR | 0.10 | 0.16 | 0.09 | 0.12 | 0.07 | 0.10 | 0.07 | 0.10 | 3 | 1,398 | 1.64 | 0.178 | 0.00 |
| Arousal ratings | 4.01 | 1.22 | 4.04 | 1.24 | 4.15 | 1.09 | 3.79 | 1.12 | 3 | 1,398 | 1.43 | 0.234 | 0.00 | ||
| Valence ratings | 4.81 | 0.96 | 4.77 | 0.98 | 4.78 | 0.83 | 4.64 | 0.92 | 3 | 1,398 | 0.78 | 0.508 | 0.00 | ||
| Contingency ratings | 39.42 | 12.21 | 39.09 | 13.71 | 40.54 | 11.64 | 39.50 | 11.32 | 3 | 120 | 0.54 | 0.656 | 0.15 |
-
Note. ACQ = acquisition training, GEN = generalization phase, LDS = linear deviation score, SD = standard deviation. Italic lines indicate the application of robust ANOVAs. In this context, effect sizes do not indicate partial eta squared, but the explanatory measure of effect size (Mair and Wilcox, 2020). Values of 0.10, 0.30, and 0.50 represent small, medium, and large effect sizes, respectively.
Appendix 1—table 4
Exploratory results of testing the cumulative risk model involving the number of subscales exceeding an at least moderate cut-off using regressions with the number of subscales as predictor and conditioned stimulus (CS) discrimination, LDS, and general reactivity as criterion.
| Outcome | Phase | Measure | beta | SEb | LL (95% CI) | UL (95% CI) | Beta | t | df | p | R2 | Cohen’s f2 |
|---|---|---|---|---|---|---|---|---|---|---|---|---|
| CS discrimination | ACQ | SCR | –0.01 | 0.00 | –0.02 | 0.00 | –0.07 | –2.62 | 1,400 | 0.009 | 0 | 0 |
| Arousal ratings | 0.07 | 0.09 | –0.09 | 0.24 | 0.02 | 0.85 | 1,400 | 0.393 | 0 | 0 | ||
| Valence ratings | –0.05 | 0.09 | –0.22 | 0.12 | –0.01 | –0.55 | 1,400 | 0.582 | 0 | 0 | ||
| Contingency ratings | –2.53 | 1.25 | –4.98 | –0.07 | –0.05 | –2.02 | 1,400 | 0.044 | 0 | 0 | ||
| GEN | SCR | –0.01 | 0.00 | –0.02 | 0.00 | –0.03 | –1.23 | 1,400 | 0.218 | 0 | 0 | |
| Arousal ratings | 0.00 | 0.10 | –0.19 | 0.19 | 0.00 | 0.00 | 1,400 | 0.997 | 0 | 0 | ||
| Valence ratings | 0.03 | 0.10 | –0.17 | 0.22 | 0.01 | 0.27 | 1,400 | 0.789 | 0 | 0 | ||
| Contingency ratings | –1.61 | 1.14 | –3.85 | 0.63 | –0.04 | –1.41 | 1,400 | 0.159 | 0 | 0 | ||
| LDS | GEN | SCR | 0.00 | 0.00 | –0.01 | 0.00 | –0.01 | –0.48 | 1,400 | 0.629 | 0 | 0 |
| Arousal ratings | 0.03 | 0.05 | –0.07 | 0.13 | 0.01 | 0.56 | 1,400 | 0.579 | 0 | 0 | ||
| Valence ratings | 0.00 | 0.05 | –0.10 | 0.10 | 0.00 | 0.04 | 1,400 | 0.965 | 0 | 0 | ||
| Contingency ratings | 0.71 | 0.65 | –0.56 | 1.98 | 0.03 | 1.10 | 1,400 | 0.272 | 0 | 0 | ||
| General reactivity | ALL | SCR | –0.01 | 0.00 | –0.02 | 0.00 | –0.04 | –1.91 | 1,400 | 0.057 | 0 | 0 |
| Arousal ratings | –0.03 | 0.05 | –0.12 | 0.06 | –0.02 | –0.65 | 1,400 | 0.517 | 0 | 0 | ||
| Valence ratings | –0.04 | 0.04 | –0.11 | 0.03 | –0.03 | –1.06 | 1,400 | 0.290 | 0 | 0 | ||
| Contingency ratings | 0.59 | 0.55 | –0.48 | 1.66 | 0.03 | 1.08 | 1,182 | 0.281 | 0 | 0 |
-
Note. ACQ = acquisition training, GEN = generalization phase, LDS = linear deviation score. Bold numbers indicate significant results (p<0.05).
Appendix 1—table 5
Exploratory results of testing the specificity model using regressions with exposure to abuse as predictor and conditioned stimulus (CS) discrimination, LDS, and general reactivity as criterion.
| Outcome | Phase | Measure | beta | SEb | LL (95% CI) | UL (95% CI) | Beta | t | df | p | R2 | Cohen’s f2 |
|---|---|---|---|---|---|---|---|---|---|---|---|---|
| CS discrimination | ACQ | SCR | 0.00 | 0.00 | 0.00 | 0.00 | –0.03 | –1.26 | 1,400 | 0.209 | 0 | 0 |
| Arousal ratings | 0.01 | 0.01 | –0.02 | 0.03 | 0.02 | 0.59 | 1,400 | 0.556 | 0 | 0 | ||
| Valence ratings | 0.00 | 0.01 | –0.02 | 0.03 | 0.01 | 0.27 | 1,400 | 0.789 | 0 | 0 | ||
| Contingency ratings | –0.25 | 0.20 | –0.64 | 0.14 | –0.03 | –1.25 | 1,400 | 0.211 | 0 | 0 | ||
| GEN | SCR | 0.00 | 0.00 | 0.00 | 0.00 | 0.03 | 1.01 | 1,400 | 0.311 | 0 | 0 | |
| Arousal ratings | 0.00 | 0.01 | –0.02 | 0.04 | 0.01 | 0.35 | 1,400 | 0.725 | 0 | 0 | ||
| Valence ratings | 0.02 | 0.02 | –0.01 | 0.05 | 0.03 | 1.20 | 1,400 | 0.230 | 0 | 0 | ||
| Contingency ratings | –0.13 | 0.18 | –0.48 | 0.23 | –0.02 | –0.71 | 1,400 | 0.479 | 0 | 0 | ||
| LDS | GEN | SCR | 0.00 | 0.00 | 0.00 | 0.00 | –0.01 | –0.22 | 1,400 | 0.825 | 0 | 0 |
| Arousal ratings | 0.00 | 0.01 | –0.02 | 0.01 | 0.00 | –0.08 | 1,400 | 0.933 | 0 | 0 | ||
| Valence ratings | 0.00 | 0.01 | –0.02 | 0.01 | –0.01 | –0.47 | 1,400 | 0.639 | 0 | 0 | ||
| Contingency ratings | 0.07 | 0.10 | –0.13 | 0.27 | 0.02 | 0.68 | 1,400 | 0.496 | 0 | 0 | ||
| General reactivity | ALL | SCR | 0.00 | 0.00 | 0.00 | 0.00 | 0.00 | –0.02 | 1,400 | 0.984 | 0 | 0 |
| Arousal ratings | 0.00 | 0.01 | –0.01 | 0.02 | 0.02 | 0.66 | 1,400 | 0.511 | 0 | 0 | ||
| Valence ratings | 0.00 | 0.01 | –0.01 | 0.01 | 0.00 | –0.19 | 1,400 | 0.853 | 0 | 0 | ||
| Contingency ratings | 0.12 | 0.09 | –0.05 | 0.29 | 0.04 | 1.38 | 1,182 | 0.167 | 0 | 0 |
-
Note. ACQ = acquisition training, GEN = generalization phase, LDS = linear deviation score.
Appendix 1—table 6
Exploratory results of testing the specificity model using regressions with exposure to neglect as predictor and conditioned stimulus (CS) discrimination, LDS, and general reactivity as criterion.
| Outcome | Phase | Measure | beta | SEb | LL (95% CI) | UL (95% CI) | Beta | t | df | p | R2 | Cohen’s f2 |
|---|---|---|---|---|---|---|---|---|---|---|---|---|
| CS discrimination | ACQ | SCR | 0.00 | 0.00 | 0.00 | 0.00 | –0.07 | –2.53 | 1,400 | 0.012 | 0 | 0 |
| Arousal ratings | 0.01 | 0.01 | –0.02 | 0.03 | 0.01 | 0.50 | 1,400 | 0.615 | 0 | 0 | ||
| Valence ratings | 0.00 | 0.01 | –0.02 | 0.03 | 0.00 | 0.10 | 1,400 | 0.919 | 0 | 0 | ||
| Contingency ratings | –0.41 | 0.17 | –0.75 | –0.07 | –0.06 | –2.36 | 1,400 | 0.018 | 0 | 0 | ||
| GEN | SCR | 0.00 | 0.00 | 0.00 | 0.00 | –0.04 | –1.29 | 1,400 | 0.196 | 0 | 0 | |
| Arousal ratings | –0.01 | 0.01 | –0.03 | 0.02 | –0.02 | –0.59 | 1,400 | 0.558 | 0 | 0 | ||
| Valence ratings | 0.00 | 0.01 | –0.03 | 0.02 | –0.01 | –0.27 | 1,400 | 0.789 | 0 | 0 | ||
| Contingency ratings | –0.40 | 0.16 | –0.71 | –0.09 | –0.07 | –2.52 | 1,400 | 0.012 | 0 | 0 | ||
| LDS | GEN | SCR | 0.00 | 0.00 | 0.00 | 0.00 | –0.02 | –0.66 | 1,400 | 0.512 | 0 | 0 |
| Arousal ratings | 0.00 | 0.01 | –0.02 | 0.01 | –0.01 | –0.25 | 1,400 | 0.799 | 0 | 0 | ||
| Valence ratings | 0.00 | 0.01 | –0.01 | 0.01 | 0.00 | 0.08 | 1,400 | 0.935 | 0 | 0 | ||
| Contingency ratings | 0.01 | 0.09 | –0.17 | 0.19 | 0.00 | 0.11 | 1,400 | 0.915 | 0 | 0 | ||
| General reactivity | ALL | SCR | 0.00 | 0.00 | 0.00 | 0.00 | –0.06 | –2.31 | 1,400 | 0.021 | 0 | 0 |
| Arousal ratings | 0.00 | 0.01 | –0.02 | 0.01 | –0.02 | –0.67 | 1,400 | 0.504 | 0 | 0 | ||
| Valence ratings | –0.01 | 0.00 | –0.02 | 0.00 | –0.05 | –1.76 | 1,400 | 0.079 | 0 | 0 | ||
| Contingency ratings | 0.07 | 0.07 | –0.08 | 0.22 | 0.03 | 0.91 | 1,182 | 0.365 | 0 | 0 |
-
Note. ACQ = acquisition training, GEN = generalization phase, LDS = linear deviation score. Bold numbers indicate significant results (p<0.05).
Appendix 1—table 7
Exploratory results of testing the dimensional model using multiple regressions with exposure to both abuse and neglect as predictors and conditioned stimulus (CS) discrimination, LDS, and general reactivity as criterion.
| Outcome | Phase | Measure | predictor | beta | SEb | LL (95% CI) | UL (95% CI) | Beta | t | df | p | adj. R2 | Cohen’s f2 |
|---|---|---|---|---|---|---|---|---|---|---|---|---|---|
| CS discrimination | ACQ | SCR | abuse | 0.00 | 0.00 | –0.01 | 0.00 | –0.09 | –1.19 | 1,398 | 0.234 | 0 | 0 |
| neglect | 0.00 | 0.00 | –0.01 | 0.00 | –0.17 | –2.33 | 1,398 | 0.020 | 0 | 0 | |||
| interaction | 0.00 | 0.00 | 0.00 | 0.00 | 0.19 | 1.49 | 1,398 | 0.137 | 0 | 0 | |||
| Arousal ratings | abuse | 0.05 | 0.04 | –0.03 | 0.12 | 0.09 | 1.17 | 1,398 | 0.240 | 0 | 0 | ||
| neglect | 0.04 | 0.03 | –0.03 | 0.10 | 0.08 | 1.09 | 1,398 | 0.275 | 0 | 0 | |||
| interaction | 0.00 | 0.00 | 0.00 | 0.00 | –0.14 | –1.13 | 1,398 | 0.258 | 0 | 0 | |||
| Valence ratings | abuse | 0.04 | 0.04 | –0.04 | 0.12 | 0.08 | 1.03 | 1,398 | 0.303 | 0 | 0 | ||
| neglect | 0.03 | 0.03 | –0.04 | 0.10 | 0.07 | 0.88 | 1,398 | 0.382 | 0 | 0 | |||
| interaction | 0.00 | 0.00 | 0.00 | 0.00 | –0.13 | –1.02 | 1,398 | 0.309 | 0 | 0 | |||
| Contingency ratings | abuse | 0.81 | 0.58 | –0.33 | 1.95 | 0.11 | 1.39 | 1,398 | 0.165 | 0 | 0 | ||
| neglect | 0.18 | 0.49 | –0.78 | 1.14 | 0.03 | 0.37 | 1,398 | 0.712 | 0 | 0 | |||
| interaction | –0.03 | 0.02 | –0.08 | 0.01 | –0.18 | –1.43 | 1,398 | 0.154 | 0 | 0 | |||
| GEN | SCR | abuse | 0.00 | 0.00 | 0.00 | 0.01 | 0.05 | 0.64 | 1,398 | 0.525 | 0 | 0 | |
| neglect | 0.00 | 0.00 | –0.01 | 0.00 | –0.11 | –1.42 | 1,398 | 0.156 | 0 | 0 | |||
| interaction | 0.00 | 0.00 | 0.00 | 0.00 | 0.05 | 0.38 | 1,398 | 0.705 | 0 | 0 | |||
| Arousal ratings | abuse | 0.03 | 0.04 | –0.06 | 0.12 | 0.05 | 0.63 | 1,398 | 0.527 | 0 | 0 | ||
| neglect | –0.01 | 0.04 | –0.08 | 0.06 | –0.01 | –0.20 | 1,398 | 0.838 | 0 | 0 | |||
| interaction | 0.00 | 0.00 | 0.00 | 0.00 | –0.04 | –0.28 | 1,398 | 0.782 | 0 | 0 | |||
| Valence ratings | abuse | 0.04 | 0.05 | –0.05 | 0.13 | 0.06 | 0.83 | 1,398 | 0.405 | 0 | 0 | ||
| neglect | –0.02 | 0.04 | –0.10 | 0.06 | –0.04 | –0.47 | 1,398 | 0.636 | 0 | 0 | |||
| interaction | 0.00 | 0.00 | 0.00 | 0.00 | –0.01 | –0.10 | 1,398 | 0.918 | 0 | 0 | |||
| Contingency ratings | abuse | 0.56 | 0.53 | –0.48 | 1.60 | 0.08 | 1.05 | 1,398 | 0.293 | 0 | 0 | ||
| neglect | –0.26 | 0.44 | –1.13 | 0.62 | –0.04 | –0.58 | 1,398 | 0.564 | 0 | 0 | |||
| interaction | –0.01 | 0.02 | –0.06 | 0.03 | –0.09 | –0.67 | 1,398 | 0.502 | 0 | 0 | |||
| LDS | GEN | SCR | abuse | 0.00 | 0.00 | 0.00 | 0.00 | –0.03 | –0.38 | 1,398 | 0.702 | 0 | 0 |
| neglect | 0.00 | 0.00 | 0.00 | 0.00 | –0.06 | –0.77 | 1,398 | 0.443 | 0 | 0 | |||
| interaction | 0.00 | 0.00 | 0.00 | 0.00 | 0.07 | 0.53 | 1,398 | 0.596 | 0 | 0 | |||
| Arousal ratings | abuse | –0.01 | 0.02 | –0.06 | 0.04 | –0.03 | –0.35 | 1,398 | 0.726 | 0 | 0 | ||
| neglect | –0.01 | 0.02 | –0.05 | 0.03 | –0.04 | –0.50 | 1,398 | 0.618 | 0 | 0 | |||
| interaction | 0.00 | 0.00 | 0.00 | 0.00 | 0.06 | 0.43 | 1,398 | 0.667 | 0 | 0 | |||
| Valence ratings | abuse | 0.00 | 0.02 | –0.05 | 0.05 | 0.00 | 0.02 | 1,398 | 0.982 | 0 | 0 | ||
| neglect | 0.01 | 0.02 | –0.03 | 0.05 | 0.04 | 0.51 | 1,398 | 0.612 | 0 | 0 | |||
| interaction | 0.00 | 0.00 | 0.00 | 0.00 | –0.04 | –0.34 | 1,398 | 0.738 | 0 | 0 | |||
| Contingency ratings | abuse | –0.04 | 0.30 | –0.63 | 0.55 | –0.01 | –0.14 | 1,398 | 0.891 | 0 | 0 | ||
| neglect | –0.16 | 0.25 | –0.66 | 0.33 | –0.05 | –0.64 | 1,398 | 0.523 | 0 | 0 | |||
| interaction | 0.01 | 0.01 | –0.02 | 0.03 | 0.07 | 0.52 | 1,398 | 0.603 | 0 | 0 | |||
| General reactivity | ALL | SCR | abuse | 0.00 | 0.00 | 0.00 | 0.01 | 0.03 | 0.42 | 1,398 | 0.676 | 0 | 0 |
| neglect | 0.00 | 0.00 | –0.01 | 0.00 | –0.11 | –1.42 | 1,398 | 0.156 | 0 | 0 | |||
| interaction | 0.00 | 0.00 | 0.00 | 0.00 | 0.04 | 0.28 | 1,398 | 0.778 | 0 | 0 | |||
| Arousal ratings | abuse | 0.04 | 0.02 | 0.00 | 0.09 | 0.15 | 1.94 | 1,398 | 0.053 | 0 | 0 | ||
| neglect | 0.01 | 0.02 | –0.02 | 0.05 | 0.06 | 0.74 | 1,398 | 0.459 | 0 | 0 | |||
| interaction | 0.00 | 0.00 | 0.00 | 0.00 | –0.19 | –1.50 | 1,398 | 0.133 | 0 | 0 | |||
| Valence ratings | abuse | 0.01 | 0.02 | –0.02 | 0.05 | 0.06 | 0.73 | 1,398 | 0.468 | 0 | 0 | ||
| neglect | –0.01 | 0.01 | –0.04 | 0.02 | –0.05 | –0.69 | 1,398 | 0.493 | 0 | 0 | |||
| interaction | 0.00 | 0.00 | 0.00 | 0.00 | –0.04 | –0.27 | 1,398 | 0.785 | 0 | 0 | |||
| Contingency ratings | abuse | –0.10 | 0.26 | –0.60 | 0.40 | –0.03 | –0.40 | 1,180 | 0.689 | 0 | 0 | ||
| neglect | –0.17 | 0.22 | –0.60 | 0.25 | –0.07 | –0.80 | 1,180 | 0.424 | 0 | 0 | |||
| interaction | 0.01 | 0.01 | –0.01 | 0.03 | 0.13 | 0.94 | 1,180 | 0.350 | 0 | 0 |
-
Note. ACQ = acquisition training, GEN = generalization phase, LDS = linear deviation score. Bold numbers indicate significant results (p<0.05).
Appendix 1—table 8
Pearson correlations of STAI-T and ADS-K with skin conductance response (SCR).
| STAI-T | ADS-K | |
|---|---|---|
| CS discrimination in SCR (ACQ) | r=–0.05, p=0.06 | r=–0.057, p=0.033 |
| SCR to the CS+ (ACQ) | r=–0.057, p=0.032 | r=–0.057, p=0.032 |
| SCR to the CS- (ACQ) | r=–0.019, p=0.467 | r=–0.013, p=0.638 |
| CS discrimination in SCR (GEN) | r=0.001, p=0.964 | r=–0.032, p=0.234 |
| LDS in SCR | r=–0.045, p=0.091 | r=–0.038, p=0.153 |
| Mean reactivity in SCR | r=–0.019, p=0.484 | r=–0.006, p=0.835 |
-
Note. ACQ = acquisition training; GEN = generalization phase; STAI-T = Trait scale of the State-Trait Anxiety Inventory (Spielberger, 1983); ADS-K = Allgemeine Depressionsskala - Kurzform (short version of the Center for Epidemiological Studies-Depression Scale, [CES-D; Hautzinger and Bailer, 1993]); LDS = linear deviation score. Bold numbers indicate significant results (p<0.05).
Additional files
Download links
A two-part list of links to download the article, or parts of the article, in various formats.
Downloads (link to download the article as PDF)
Open citations (links to open the citations from this article in various online reference manager services)
Cite this article (links to download the citations from this article in formats compatible with various reference manager tools)
Reduced discrimination between signals of danger and safety but not overgeneralization is linked to exposure to childhood adversity in healthy adults
eLife 12:RP91425.
https://doi.org/10.7554/eLife.91425.3


