Disordered regions and folded modules in CAF-1 promote histone deposition in Schizosaccharomyces pombe
- Université Paris-Saclay, CEA, CNRS, Institute for Integrative Biology of the Cell (I2BC), Institute Joliot, France
- Institut Curie, PSL Research University, CNRS UMR 3348, INSERM U1278, Université Paris-Saclay, Equipe labellisée Ligue contre le Cancer, France
- Institut Curie, PSL Research University, CNRS, Sorbonne Université,CNRS UMR3664, Nuclear Dynamics Unit, Équipe Labellisée Ligue contre le Cancer, France
- Synchrotron SOLEIL, HelioBio group, l'Orme des Merisiers, France
Figures
Figure 1 with 5 supplements
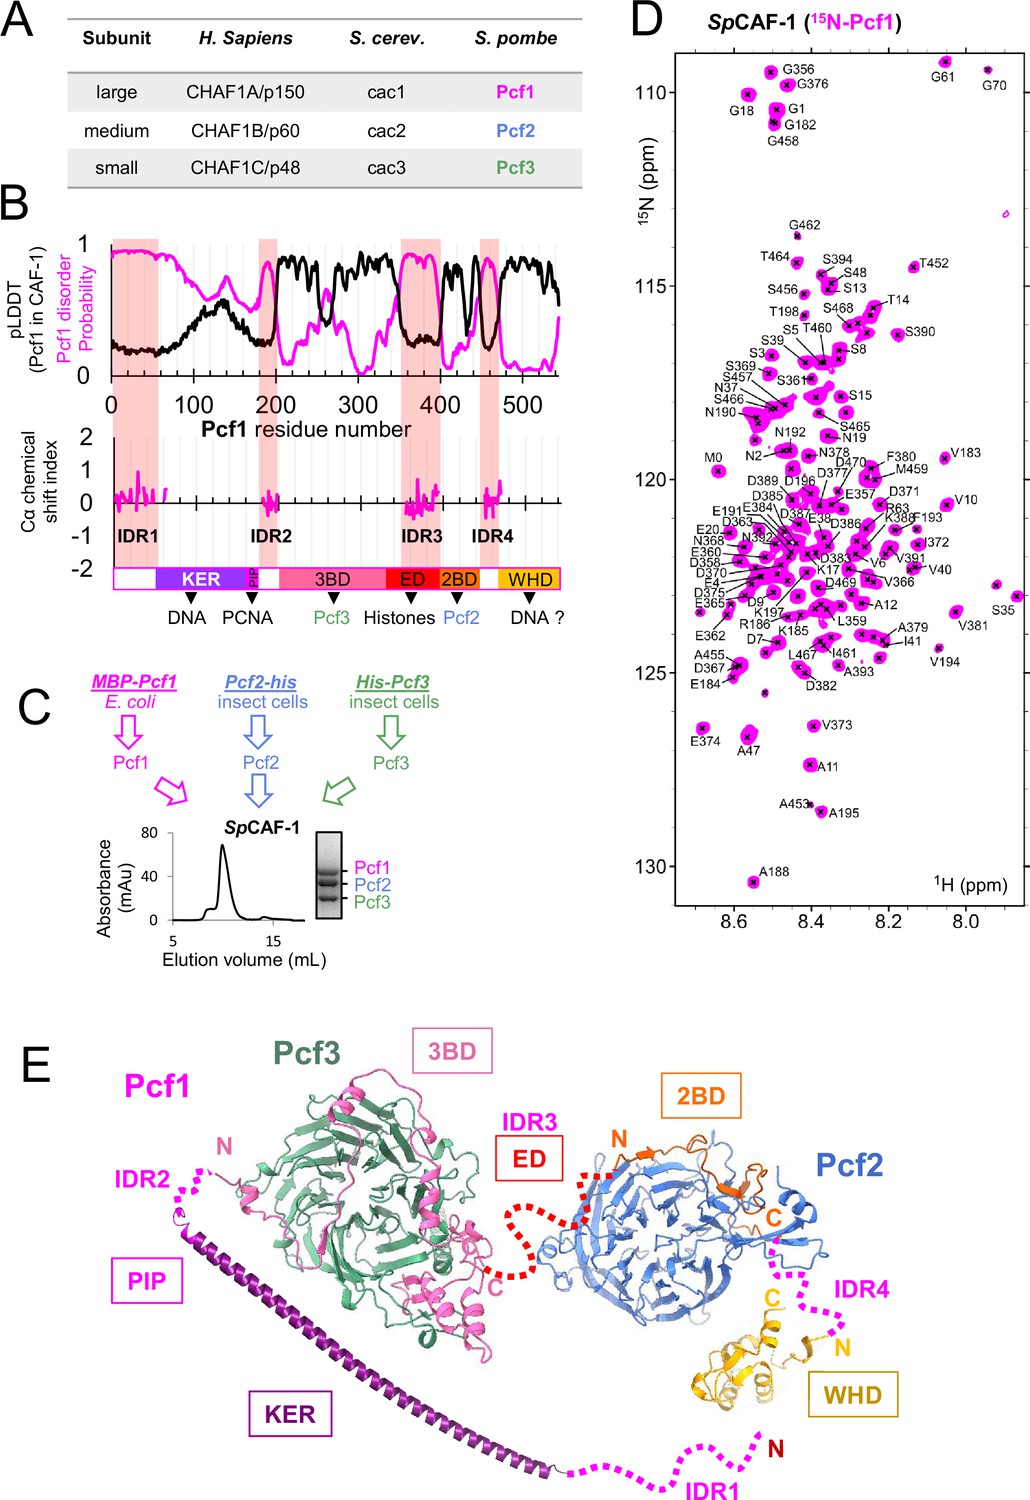
The large SpCAF-1 subunit includes four Intrinsically Disordered Regions (IDR).
(A) Names for the large, medium and small subunits of CAF-1 in H. sapiens, S. cerevisiae, and S. pombe. (B) Upper panel: The magenta line shows the predicted disorder of Pcf1 (spot disorder software) and the black line the Cα Local Distance Difference Test (pLDDT) calculated for Pcf1 residues by the AlphaFold2 model of the full SpCAF-1 complex. Lower panel: Cα chemical shift index calculated for the 101 assigned residues. This Cα chemical shift index is consistent with their disordered nature. The four IDR regions are highlighted with pink semi-transparent vertical bars. The predicted domains of Pcf1 are labeled. (C) General strategy for the production of SpCAF-1. The lower panel shows the purification SEC profile and the SDS-PAGE purity of the sample. (D) 1H-15N SOFAST-HMQC spectrum of the FL SpCAF-1 complex composed of uniformly labeled 15N-Pcf1 and unlabeled Pcf2 and Pcf3 (SpCAF-1(15N-Pcf1)). The assigned signals are labeled. (E) AF2 model of the SpCAF-1 complex. The four IDR segments are shown with a dashed line. The relative orientation of the four modules is arbitrary.
Figure 1—figure supplement 1
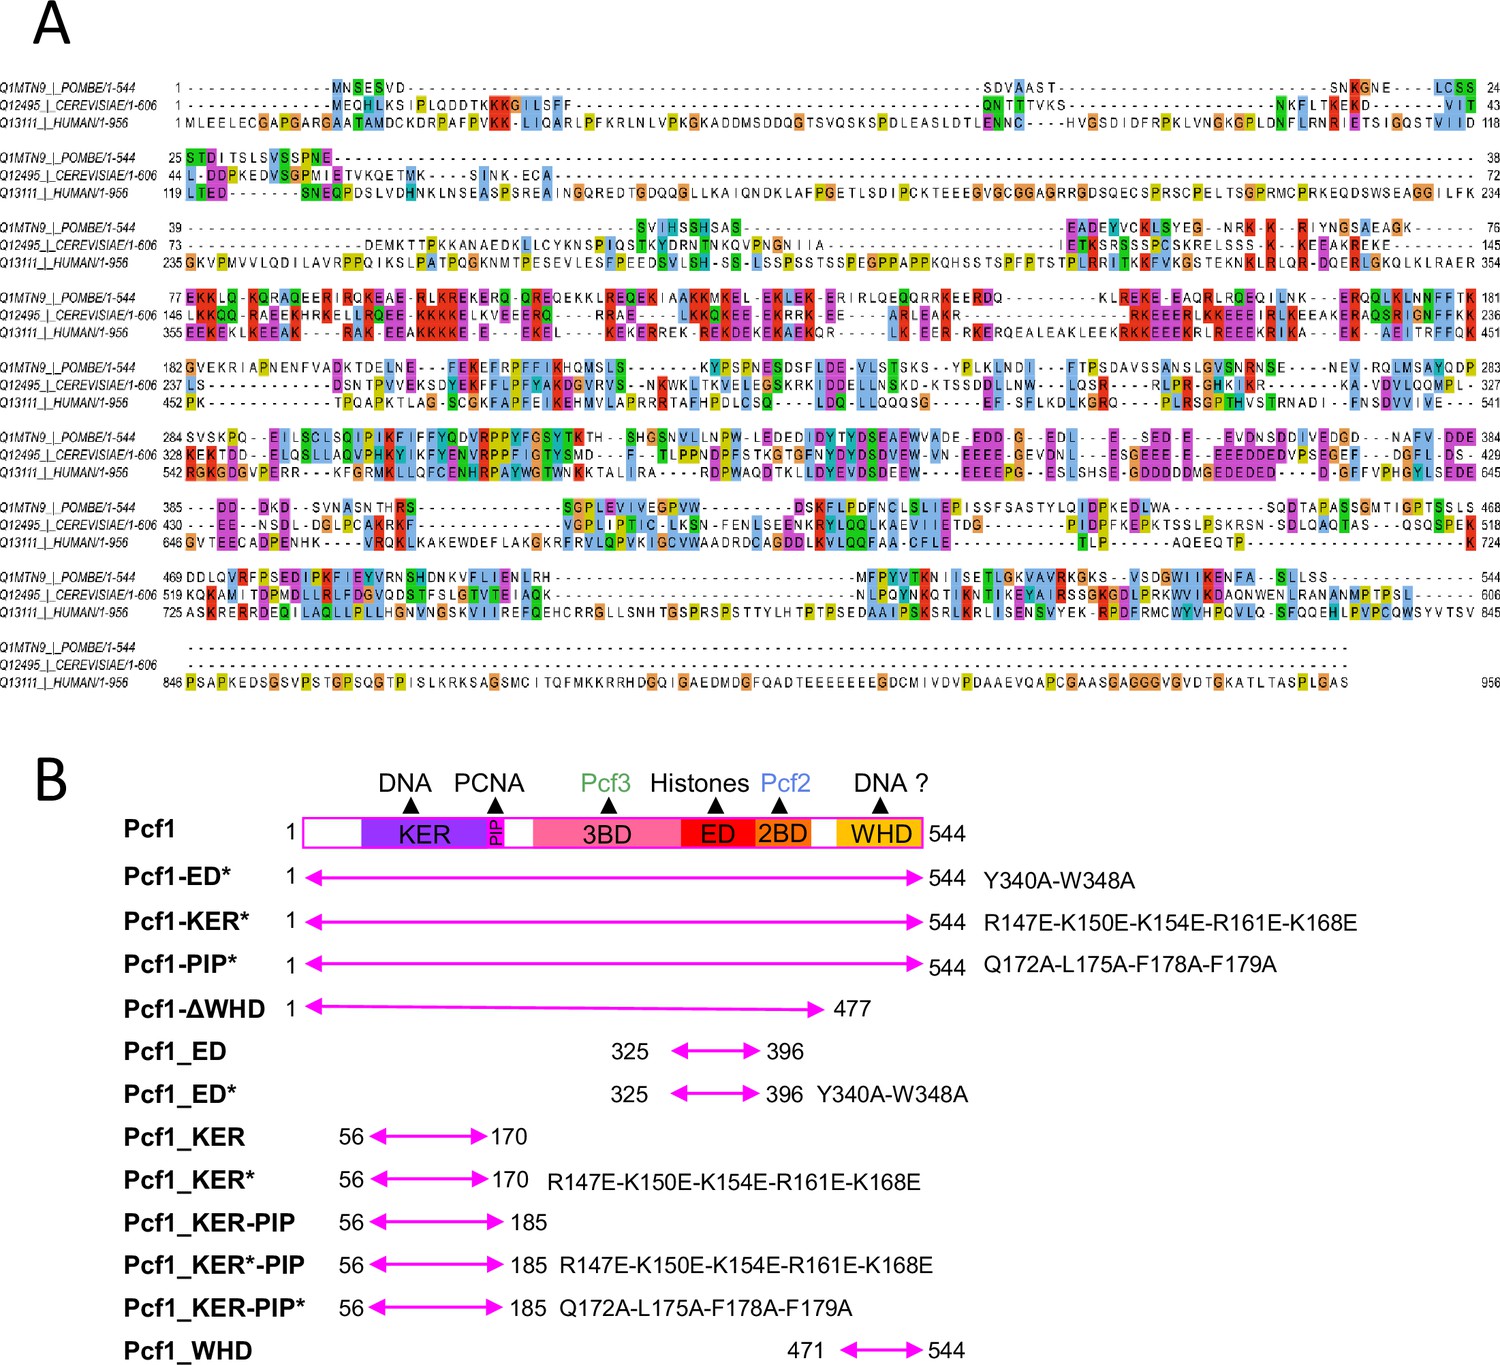
Sequence and constructions of Pcf1, the large subunit of SpCAF-1.
(A) Alignment of the large-subunit of CAF-1 from S. pombe, S. cerevisiae, and human (B) Domain composition of Pcf1 and binding predictions inferred from sequence homology. The delimitation and mutant positions of the different constructs of Pcf1 produced for this study are shown. Plasmids are available on request.
Figure 1—figure supplement 2
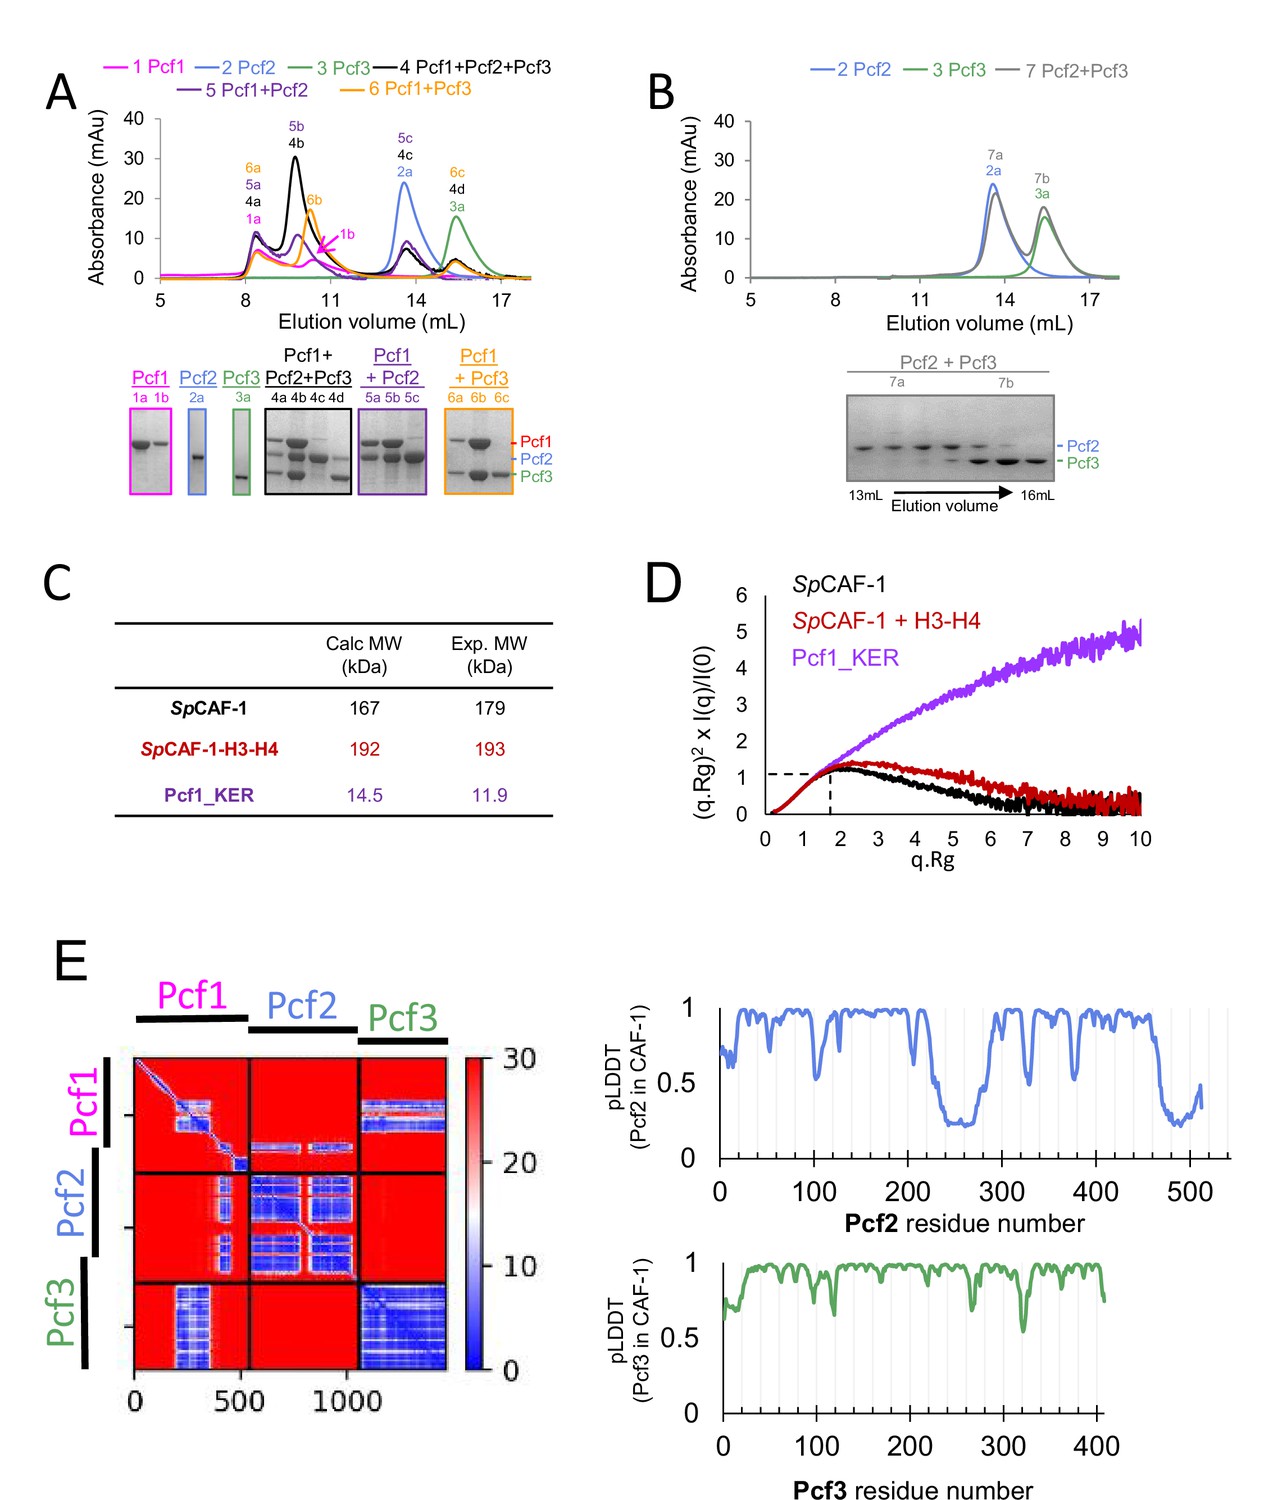
Reconstitution and structural analysis of SpCAF-1.
(A–B) SEC analysis of recombinant Pcf1, Pcf2, and Pcf3 proteins purified separately (1-3) mixed by pairs (5-7) or the mix of the three proteins (4). For each chromatograph, the composition of all peaks (identified with the run number (1-7) and the peak position (a–d)) were analysed by SDS-PAGE. (C) Molecular weight calculated with SAXS data (Exp. MW) compared to theoretical MW (Calc. MW) for SpCAF-1 Pcf1:Pcf2:Pcf3 1:1:1, for SpCAF-1−H3−H4 Pcf1:Pcf2:Pcf3:H3:H4 1:1:1:1:1 and monomeric Pcf1_KER. (D) Dimensionless Kratky plot of the SAXS experiment of SpCAF-1 (black) and SpCAF-1−H3−H4 (red) and Pcf1_KER (purple). The position of the expected maximum of the curve for a fully globular protein is shown with dashed black lines. The curve of Pcf1_KER does not tend toward zero for large q.Rg values, showing that this domain has an extended structure. The position of the maximum for the curve obtained for SpCAF-1−H3−H4 is shifted to higher values in the y and x axis compared to the SpCAF-1 curve. This indicates that the SpCAF-1−H3−H4 complex is more extended that SpCAF-1 alone. Further interpretations are given by the fit of experimental intensities with models from AlphaFold (see Figure 1—figure supplement 5A–D). (E) Left panel: Predicted Alignment Error plot (PAE) calculated by AlphaFold2 for the best model for the full SpCAF-1 complex. Right panels: Local Distance Difference Test (pLDDT) calculated by the AlphaFold2 for Pcf2 (upper right) and Pcf3 (lower right) for this model. pLDDT for Pcf1 is shown in Figure 1B.
-
Figure 1—figure supplement 2—source data 1
Uncropped SDS Page gels for the SEC analysis of recombinant Pcf1, Pcf2, and Pcf3 proteins purified separately presented in Figure 1—figure supplement 2A, B (lower panels).
- https://cdn.elifesciences.org/articles/91461/elife-91461-fig1-figsupp2-data1-v2.pdf
Figure 1—figure supplement 3
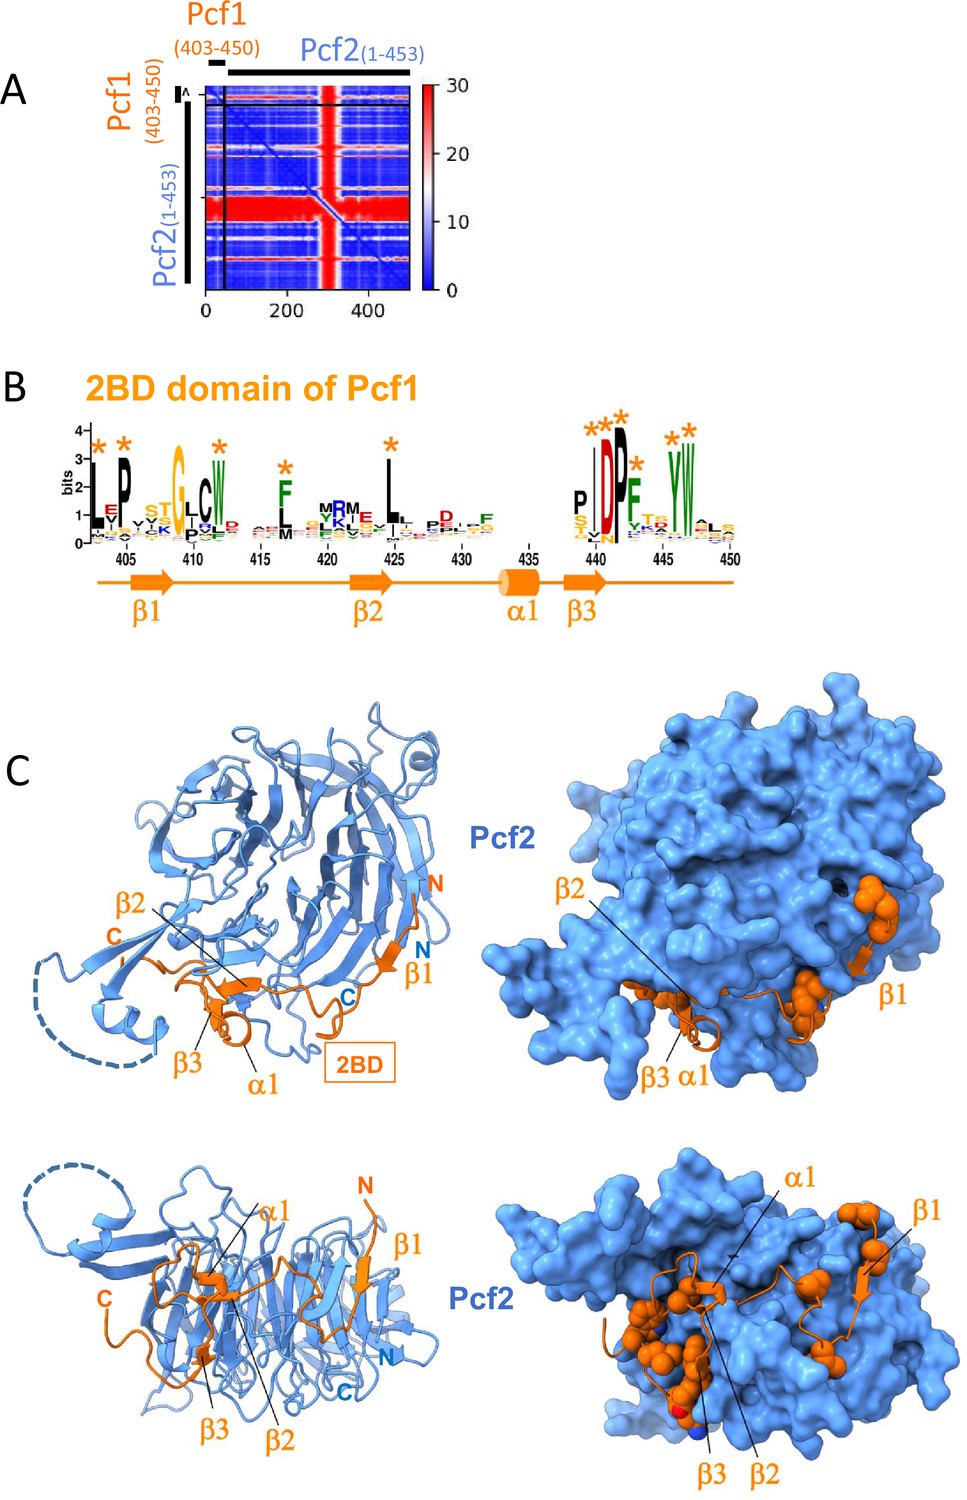
Structure prediction of the module Pcf1(403-450)-Pcf2(1-453) from SpCAF-1.
(A) Predicted Alignment Error plot (PAE) calculated by AlphaFold2 for the best model for the Pcf1(403-450)-Pcf2(1-453) complex corresponding the module of SpCAF-1 including the seven WD repeats of Pcf2 and the segment of Pcf1 covering the 2BD domain (B) Sequence logo of the 2BD region of Pcf1 (Pcf1_2BD). Residues indicated with a star correspond to conserved residues at the interface, they are shown as spheres in A. The secondary structure in the model is shown below the residue numbering. (C) Best AlphaFold2 model for this module with two perpendicular orientations (upper panels and lower panels respectively). Pcf2 is shown in blue and Pcf1_2BD in orange. In the left panels, the module is presented with cartoons and in the right panels, Pcf2 is shown with a surface and Pcf1_2BD a cartoon with conserved residues highlighted with a star in panel (B) are represented as spheres. A disordered loop (234-283) of Pcf2 is omitted and represented with a dashed line. The model is available https://www.modelarchive.org/doi/10.5452/ma-1bb5w.
Figure 1—figure supplement 4
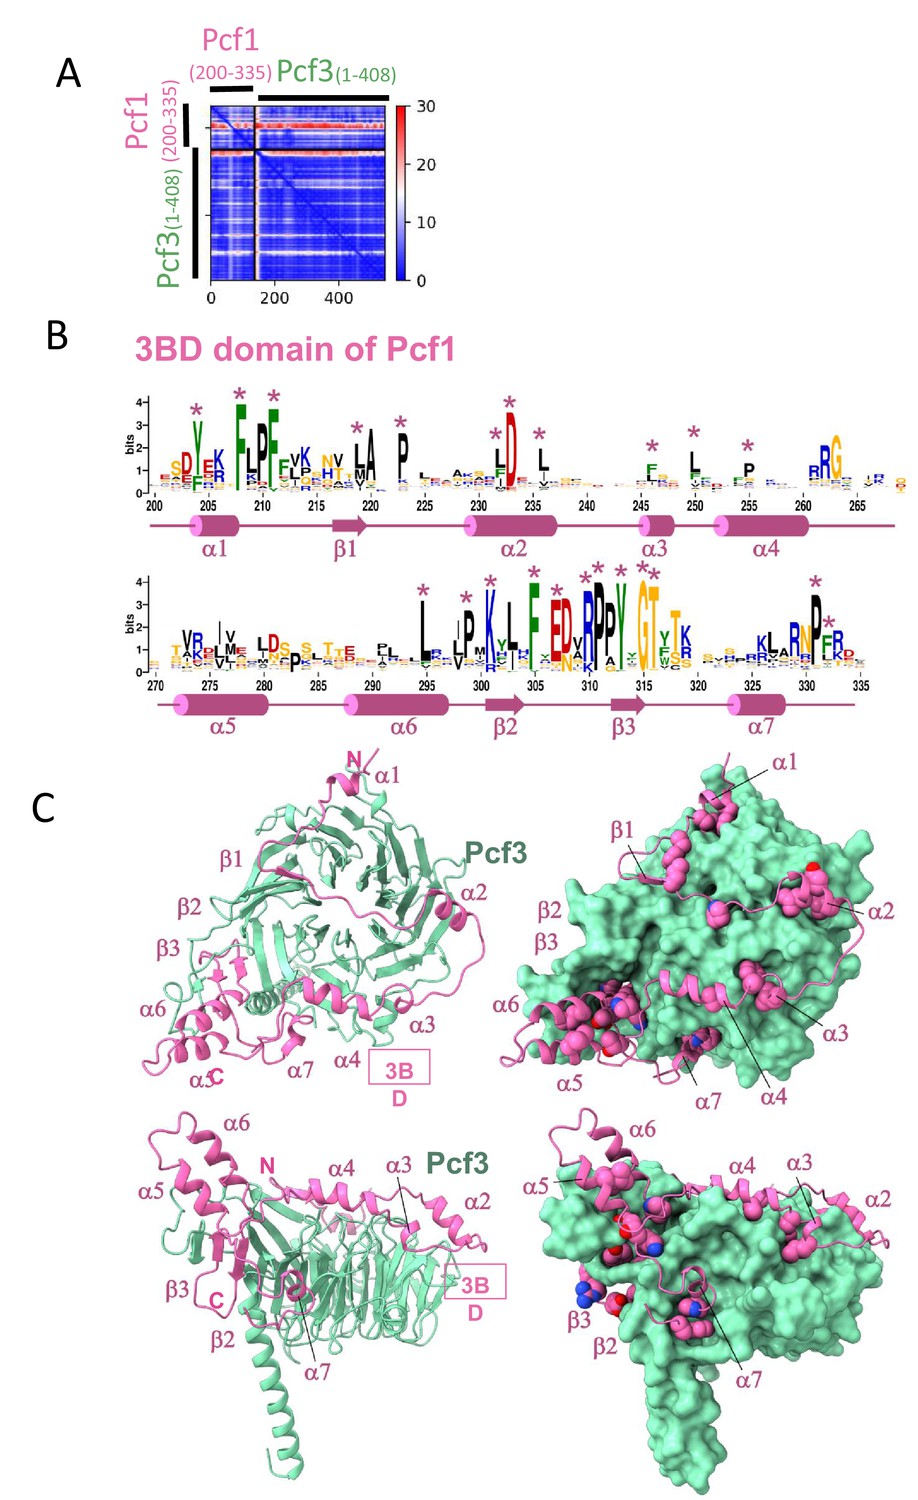
Structure prediction of the module Pcf1(200-335)-Pcf3(1-408) from SpCAF-1.
(A) Predicted Alignment Error plot (PAE) calculated by AlphaFold2 for the best model for the Pcf1(200-335)-Pcf3(1-408) complex corresponding the module of SpCAF-1 including the seven WD repeats of Pcf3 and the segment of Pcf1 covering the 3BD domain. (B) Sequence logo of the 3BD region of Pcf1 (Pcf1_3BD). Residues indicated with a star are correspond to conserved residues at the interface, they are shown as spheres in l. The secondary structure in the model is shown below the residue numbering. (C) Best AlphaFold2 model of this module corresponding to the subunit Pcf3 and Pcf1_3BD shown in panel B with two perpendicular orientations (upper panels an lower panels, respectively). Pcf3 is shown in green and Pcf1_3BD in pink. In the left panels, the module is presented with cartoons and in the right panels, Pcf3 is shown with a surface and Pcf1_3BD is shown as cartoon, conserved residues highlighted with a star in panel B are represented as spheres. The model is available https://www.modelarchive.org/doi/10.5452/ma-bxxkp.
Figure 1—figure supplement 5
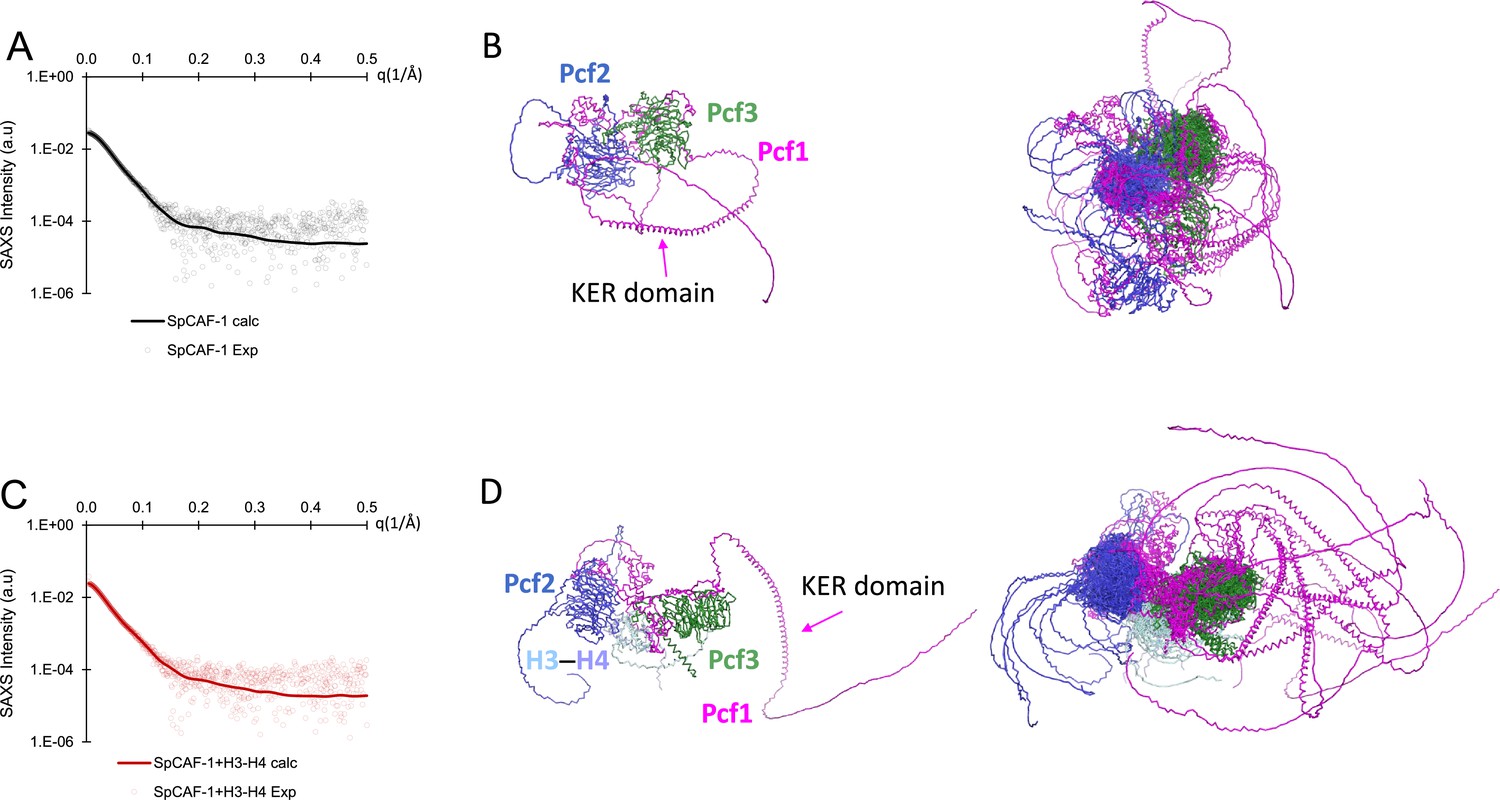
Experimental and fitted SAXS data for SpCAF-1 and SpCAF-1−H3−H4.
(A) Experimental and fitted SAXS profile intensity (I) as a function of the momentum transfer (q) for SpCAF-1 (black circles) and for the best model generated by the Dadimodo Software (Rudenko et al., 2019) (continuous black line) shown in B (left panel). (B) Ribbon representation of models generated by the Dadimodo software (Rudenko et al., 2019) fitting data in A. Left panel: Best model. Right panel: overlay of the eight best models. (C) Experimental and fitted SAXS profile intensity (I) as a function of the momentum transfer (q) for SpCAF-1−H3−H4 (red circles) and for the best model generated by Dadimodo Software (continuous red line) shown in D (left panel). (D) Ribbon representation of models generated by the Dadimodo software fitting data in C Left panel: Best model. Right panel: overlay of the 8 best models. (B, D) Pcf1 is shown in magenta, Pcf2 in blue and Pcf3 in green and H3−H4 in light blue and turquoise, respectively. SAXS experimental and fitting details are given in the Materials and methods section and Supplementary file 1a.
Figure 2 with 2 supplements
The acidic ED domain binds histones alone and in the full SpCAF-1 complex.
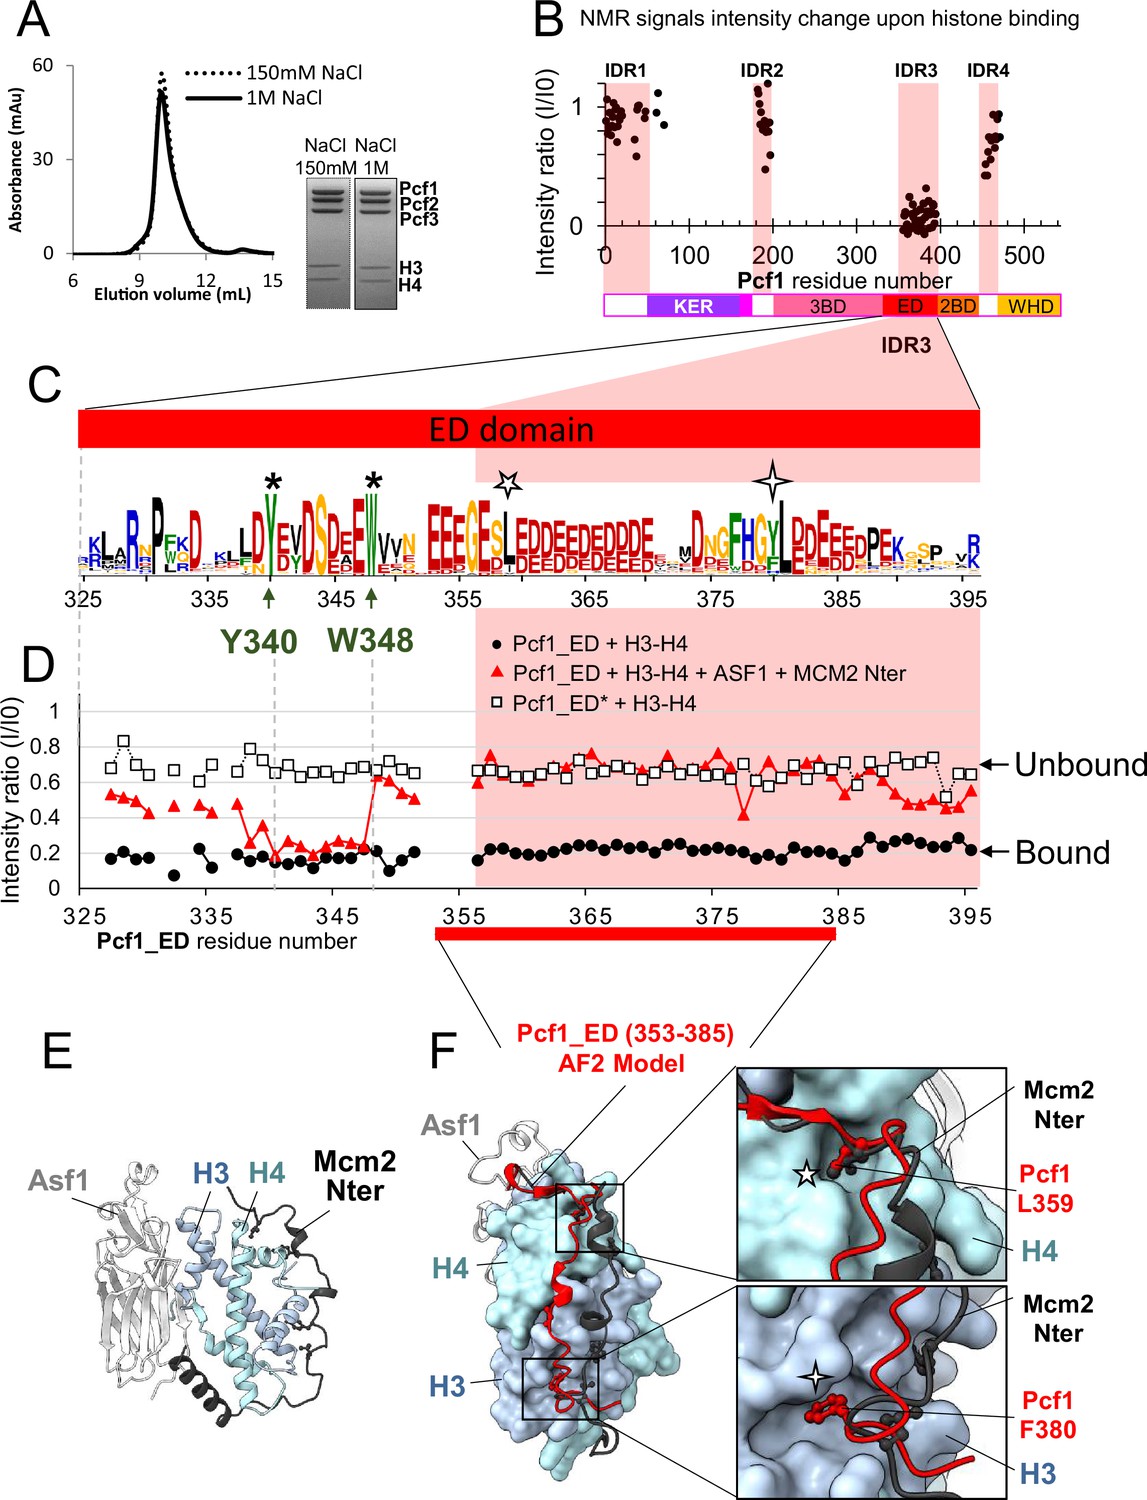
(A) SEC profile and the SDS-PAGE purity of SpCAF-1−H3−H4 histones at 150 mM NaCl and 1 M NaCl. (B) Mapping of the interaction between SpCAF-1(15N-Pcf1) and SpH3−H4 histones, using the intensities ratio (I/I0), where I and I0 are the intensity of the signals 1H-15N SOFAST-HMQC spectra before and after addition of histones, respectively. (C) Sequence Logo of the ED domain generated with a large data set of Pcf1 homologues. The position of the two conserved residues Y340 and W348, mutated in ED* are indicated with stars and conserved Pcf1 L359 and F380 residues with five and four branch stars respectively. (D) Mapping of the interaction between Pcf1_ED or Pcf1_ED* with SpH3−H4 histones using the intensities ratio (I/I0) as in b. Histones were added alone or previously complexed with histones chaperones. (E) Cartoon representation of the complex between human histones H3−H4 (light blue and cyan), Asf1 (light grey) and Mcm2 (dark grey) (PDB: 5BNX). (F) AlphaFold2 model of Pcf1 (353-385) (as red cartoon), corresponding to the segment of the ED domain indicated in red, in complex with histones H3−H4 (light blue and cyan surface) superimposed with Mcm2 and Asf1 as in panel E. The two insets represent zoomed views of the sidechains of the conserved Pcf1 L359 and F380 residues (red sticks) binding into H4 and H3 pockets, respectively. The same four and five branch stars are used to label these positions in the logo panel C.
-
Figure 2—source data 1
Uncropped SDS PAGE gels presented in Figure 2A and Figure 2—figure supplement 2B.
- https://cdn.elifesciences.org/articles/91461/elife-91461-fig2-data1-v2.pdf
Figure 2—figure supplement 1
The acidic ED domain binds histones alone and in the full CAF-1 complex.
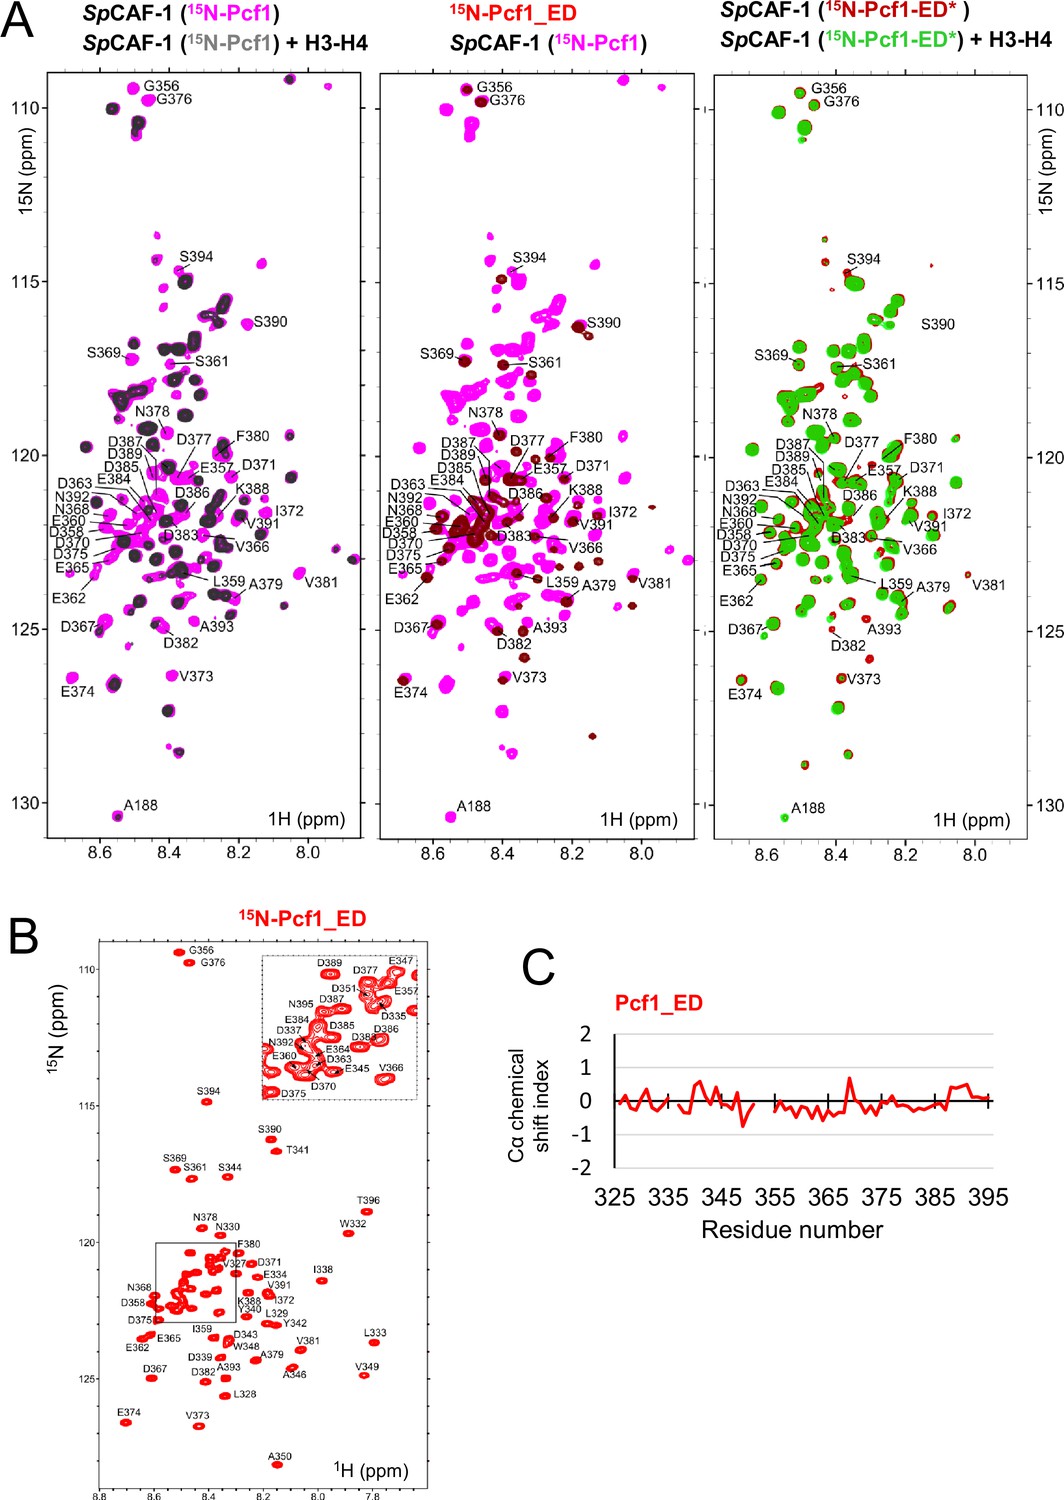
(A) Left panel: Overlay of the NMR 1H-15N SOFAST-HMQC spectrum of S. pombe CAF-1(15N-Pcf1) alone (magenta) and after addition of S. pombe H3−H4 (1:1) (black). middle panel: Overlay of the 1H-15N SOFAST-HMQC spectrum of S. pombe CAF-1(15N-Pcf1) alone (magenta) with the 1H-15N Pcf1_ED spectrum in the same buffer conditions (red). right panel: Overlay of the 1H-15N SOFAST-HMQC spectrum of S. pombe CAF-1(15N-Pcf1-ED*) alone (red) and after addition of S. pombe H3−H4 (1:1) (green). The assignments of residues from IDR3 are indicated in all panels. (B) 1H-15N HSQC spectra of Pcf1_ED (325-396). The assignments of the central area of the spectrum are zoomed in the box at the top right of the spectrum. Spectral dispersion of HN resonances, ranging from 8.1 to 8.6 ppm are consistent with all residues being mainly disordered. (C) Cα chemical shift index of the isolated Pcf1-ED domain. Values close to zero of the Cα chemical shift index confirms the unfolded nature of the ED_domain. All spectra were recorded at 10 °C.
Figure 2—figure supplement 2
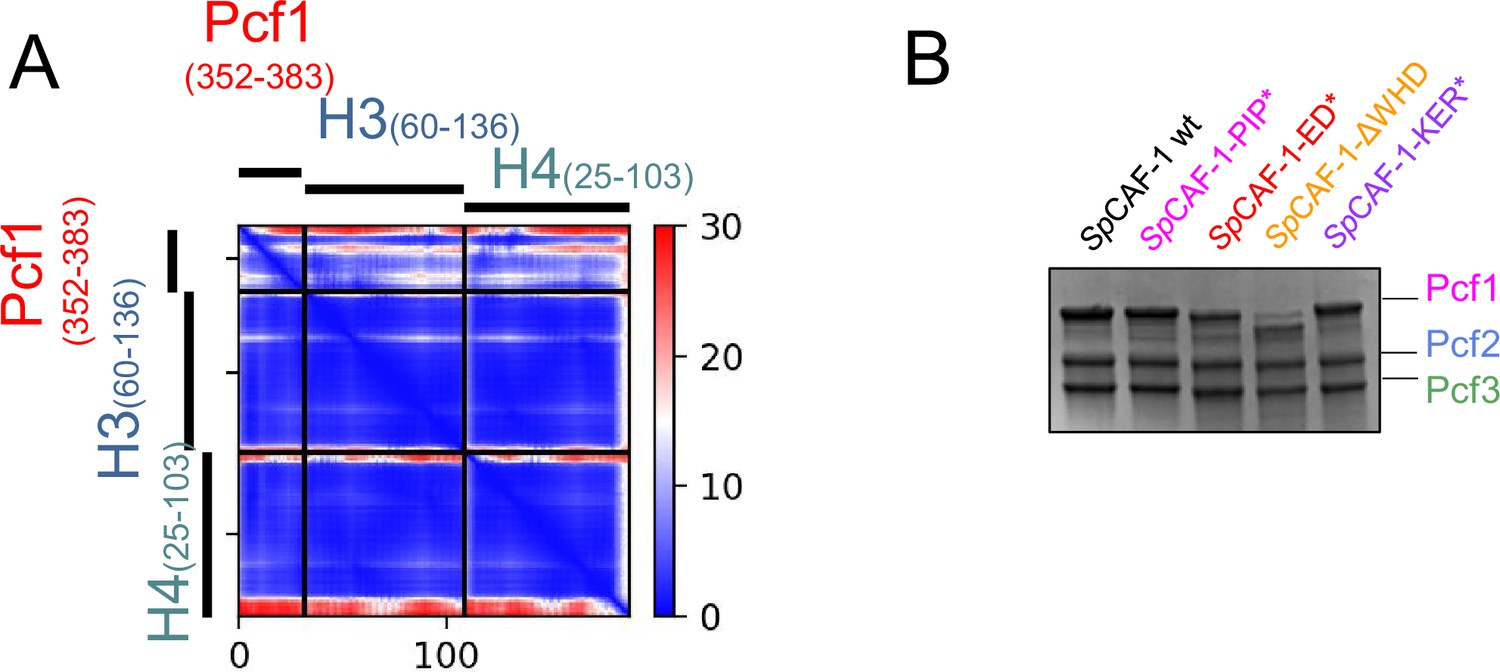
Structure prediction of the module Pcf1(352-383)−H3−H4 from SpCAF-1 and purification of reconstituted CAF-1 complexes WT and mutants.
(A) Predicted Alignment Error plot (PAE) calculated by AlphaFold2 for the best model for the Pcf1(352-383)−H3(60–136)−H4(25–103). (B) SDS-PAGE electrophoresis of the reconstituted CAF-1 complexes WT and mutants used in this study. The model is available https://www.modelarchive.org/doi/10.5452/ma-htx0n.
Figure 3 with 4 supplements
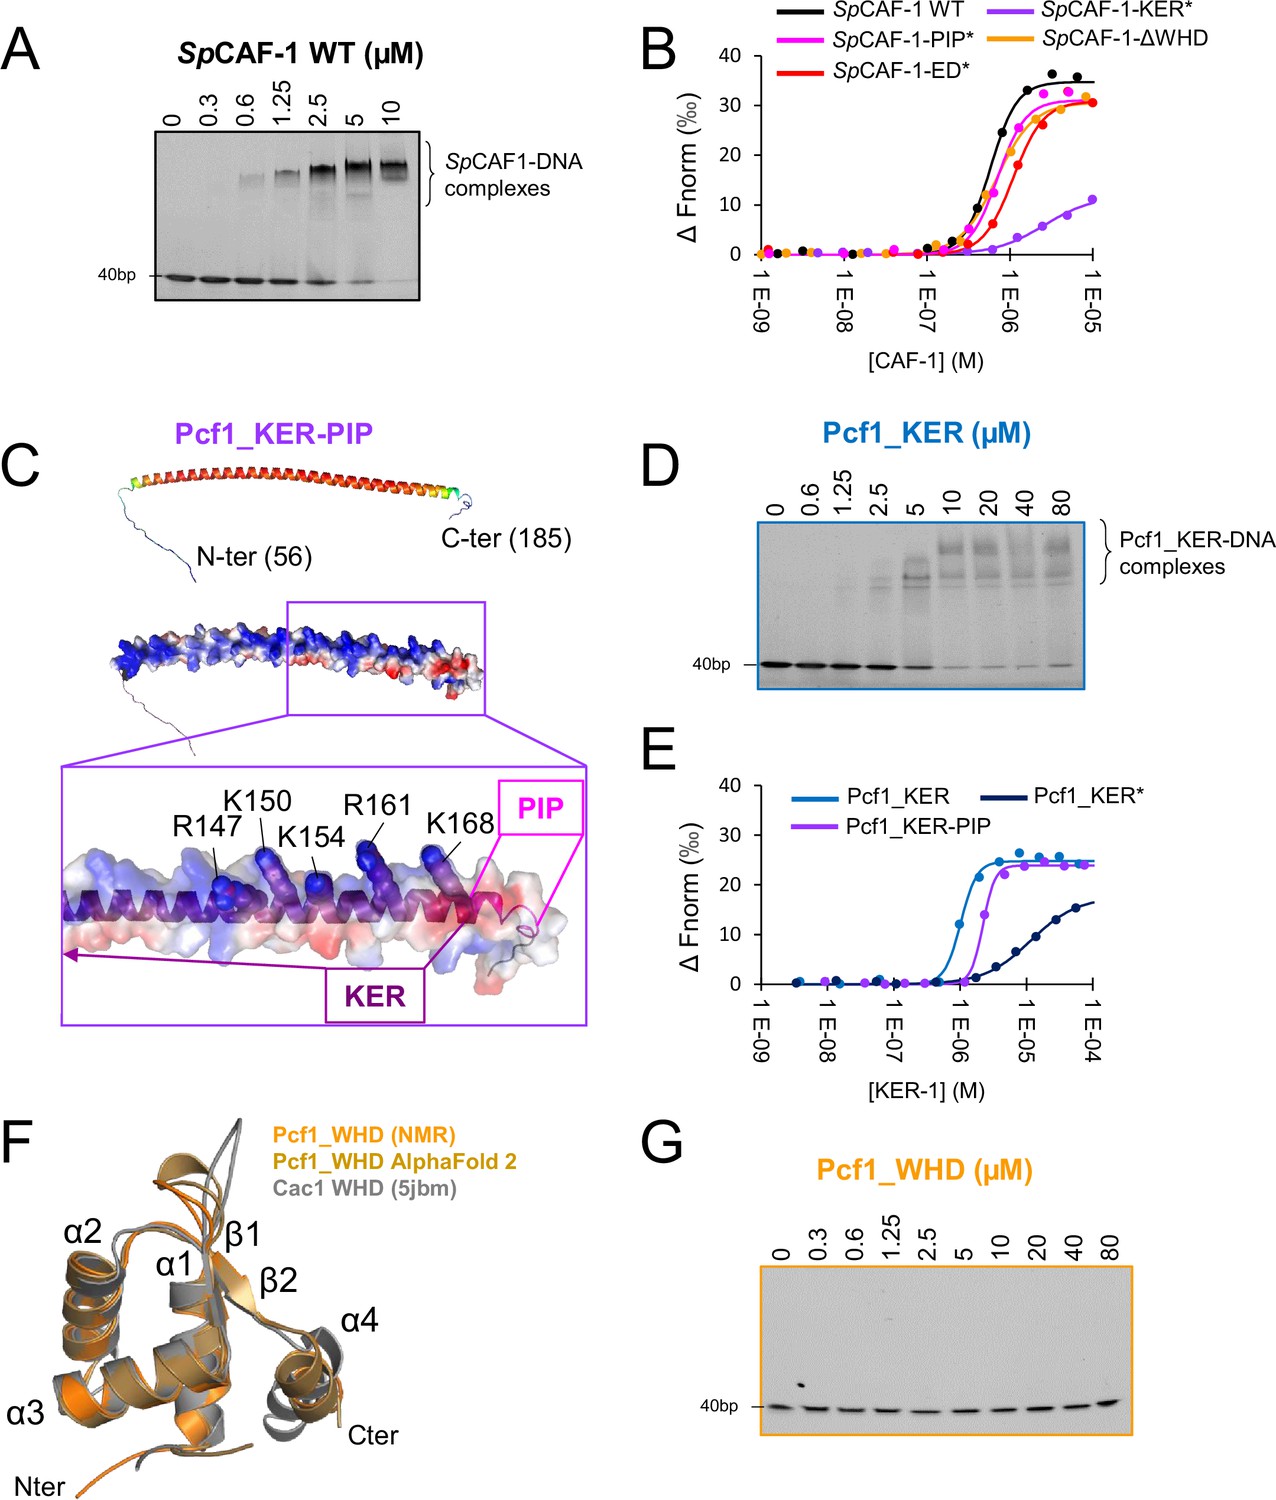
Pcf1_KER is the main DNA binding domain of SpCAF-1.
(A) EMSA with SpCAF-1 and 40 dsDNA (1 µM) revealed with SYBR SAFE staining. (B) MicroScale thermophoresis (MST) fitted curves of SpCAF-1 WT and mutants with 40 bp dsDNA. (C) Upper panel: Modeled structure of the Pcf1_KER-PIP domain (56-185) rainbow coloured according to the pLDDT of each residue. Red corresponds to pLDDT values of 1 and dark blue of 0. Middle panel same model represented with its electrostatic surface. Lower panel: zoom of the C-terminus of the KER domain and the PIP motif. The five mutated residues are labeled and highlighted with spheres. (D) EMSA of Pcf1_KER binding with a 40 bp dsDNA (1 µM) revealed with SYBR SAFE staining. (E) MST fitted curves of Pcf1_KER constructs and mutants with 40 bp dsDNA. (F) Overlay of the calculated model of the WHD domain obtained with the CS-rosetta software (light orange) using NMR assignments of the domain (Figure 3—figure supplement 4A), with AlphaFold2 (gold) and the structure of Cac1 WHD from budding yeast (PDB 5jbm, in grey) (Liu et al., 2016) (Grey). (G) EMSA revealed with SYBR SAFE staining of Pcf1_WHD domain with a 40 dsDNA (1 µM).
-
Figure 3—source data 1
Uncropped SDS PAGE gels presented in Figure 3 and Figure 3—figure supplements 1–4.
- https://cdn.elifesciences.org/articles/91461/elife-91461-fig3-data1-v2.pdf
Figure 3—figure supplement 1
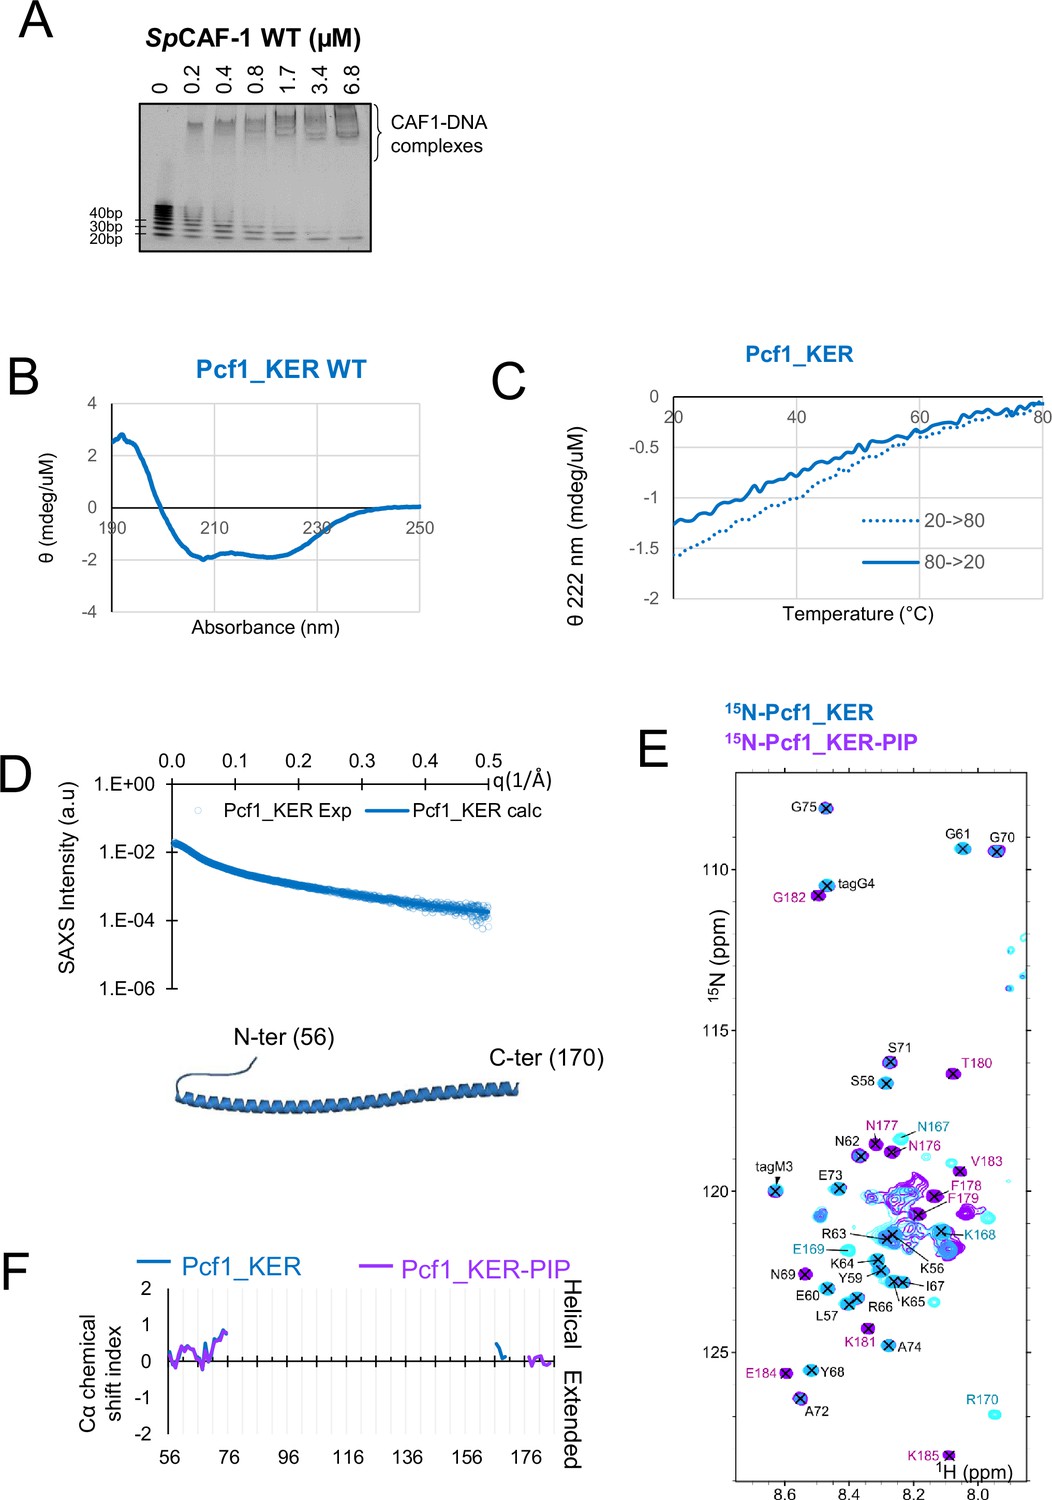
Structural characterization of the Pcf1_KER domain.
(A) EMSA with SpCAF-1 and a ladder of 20–100 bp dsDNA fragments revealed with SYBR SAFE staining. (B) Circular dichroism (CD) spectrum of the Pcf1_KER domain (56-170) at 20 °C. The measured signal confirms the high helical content of this fragment. (C) Evolution of the CD measurements of Pcf1_KER at 222 nm during a ramp temperature from 20°C to 80°C (forth with a dashed line and back with a continuous line). The linear unfolding without any cooperativity is consistent with the absence of tertiary structure of this domain. (D) Upper panel: Experimental SAXS profile intensity (I) as a function of the momentum transfer (q) for Pcf1_KER (cyan circles) and fitted (continuous blue line). Lower panel: Cartoon representation of the best model fitting the experimental SAXS data. Fitting details are given in Materials and methods section and Supplementary file 1a. The models are in very good accuracy with the AF2 models of a strait helix. (E) Overlay of the 1H-15N SOFAST-HMQC spectrum of 15N-Pcf1_KER (cyan) and 15N-Pcf1_KER-PIP (purple) at 10 °C. Assigned resonances are indicated in black for signals that overlap for both constructs, in blue for resonances observed only for 15N-Pcf1_KER and in purple for residues observed only for 15N-Pcf1_KER-PIP. For 15N-Pcf1_KER (cyan), as expected for a long anisotropic helix, only the few signals that were assigned to its 20 first and 4 last residues were visible, whereas helical residues are not visible in the spectrum. For the 15N-Pcf1_KER-PIP (purple), we did observe the NMR signals only for the last residues of the PIP box, starting at N176, suggesting that, the helix could extends toward the N-ter part of the PIP motif. (F) Cα chemical shift index of the assigned residues for Pcf1_KER (cyan) and Pcf1_KER-PIP (purple) are consistent with disordered ends of the segments, with some helical propensity at the N-and C-terminus of the long helix. Together these results are in perfect adequation with models predicted by AF2.
Figure 3—figure supplement 2
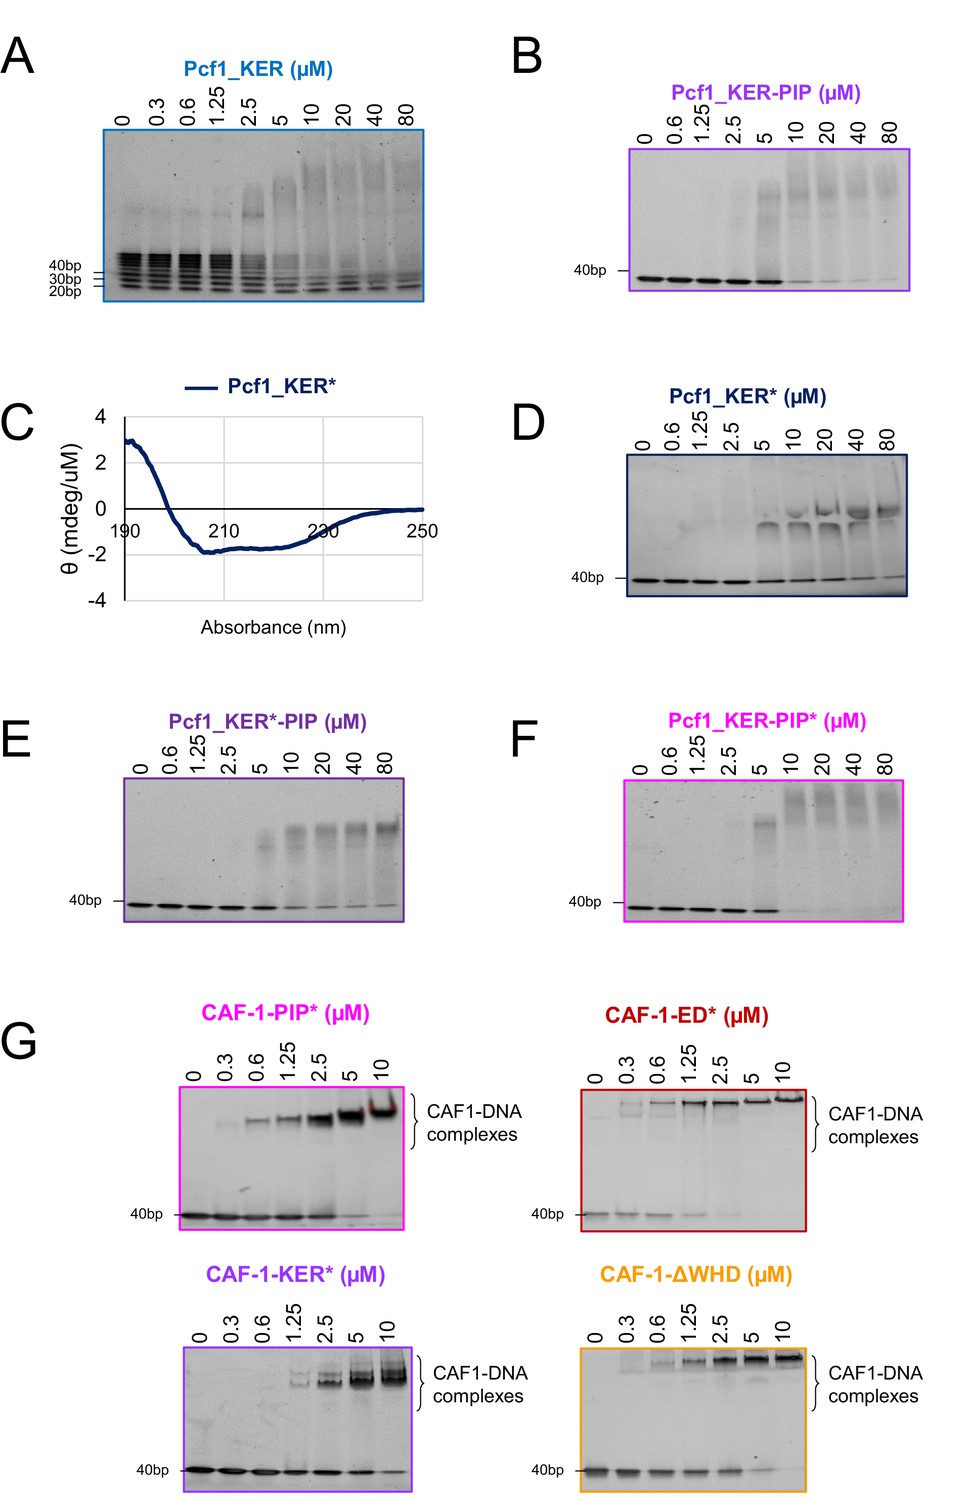
Binding of WT and mutants Pcf1_KER and SpCAF-1 to DNA analysed by EMSA.
(A) EMSA showing Pcf1_KER binding to a 20–100 bp ladder of ds DNA fragments. (B) EMSA showing Pcf1_KER-PIP binding to a 40 bp dsDNA. (C) CD spectrum of the mutated Pcf1_KER* at 20 °C. (D–F) EMSA showing the binding with a 40 bp dsDNA of Pcf1_KER* (D), Pcf1_KER*-PIP (E) and Pcf1_KER-PIP* (F). (G) EMSA showing the mutant full SpCAF-1 binding to a 40 dsDNA. EMSA are revealed with SYBR SAFE staining.
Figure 3—figure supplement 3
Binding of WT and mutants SpCAF-1 to histones H3-H4 analyzed by NMR.
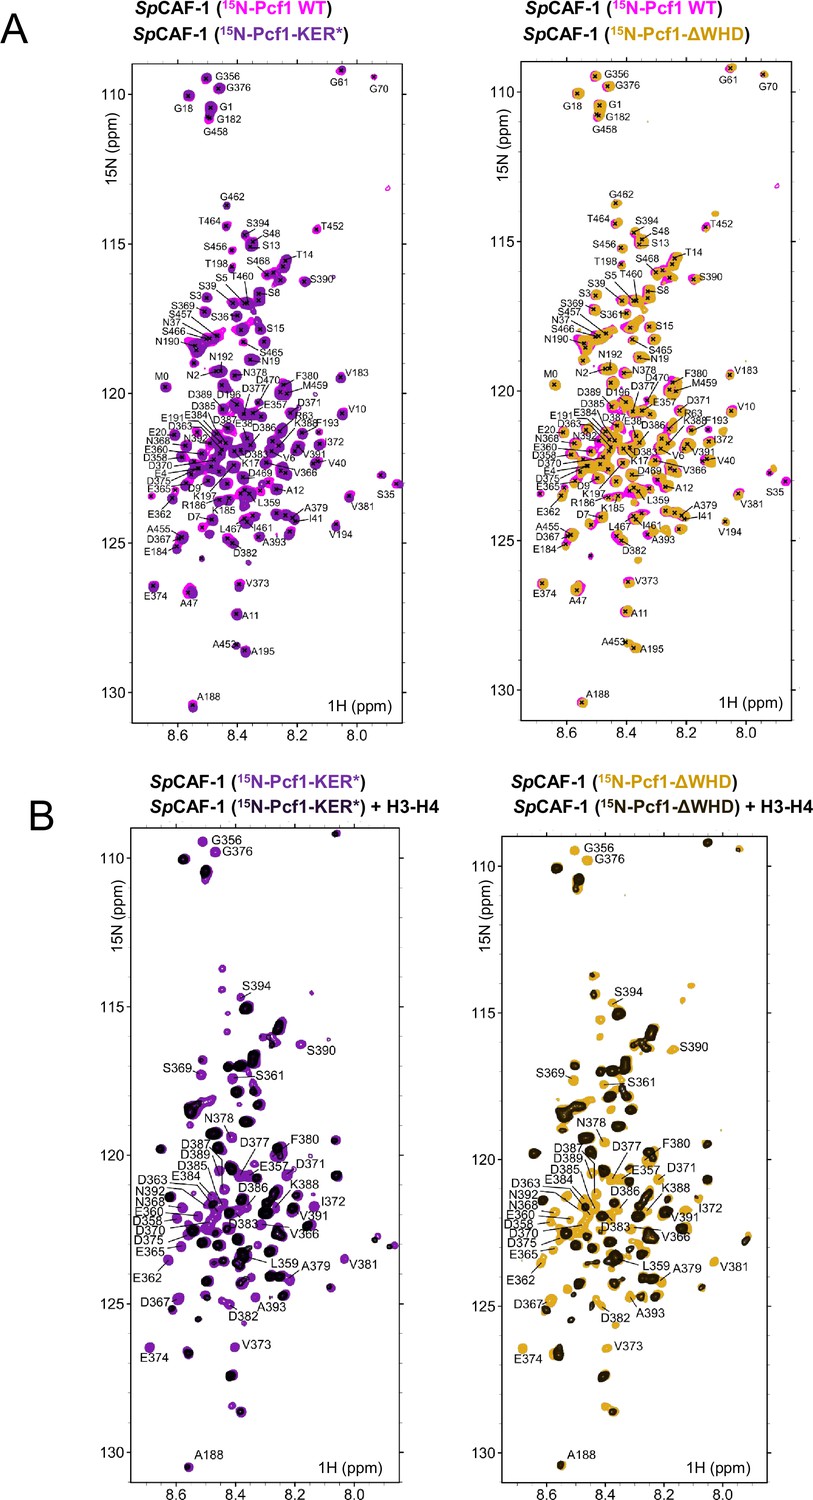
(A) Left panel: Overlay of the 1H-15N SOFAST-HMQC spectrum of the WT SpCAF-1(15N-Pcf1) (magenta) and the SpCAF-1(15N-Pcf1-KER*) (purple). Right panel: Overlay of the 1H-15N SOFAST-HMQC spectrum of the WT SpCAF-1(15N-Pcf1) (magenta) and the SpCAF-1(15N-Pcf1-ΔWHD) (yellow). Assignments of residues in SpCAF-1(15N-Pcf1) are indicated. (B) Left panel: Overlay of the1H-15N SOFAST-HMQC spectrum of SpCAF-1(15N-Pcf1-KER*) alone (purple) and after addition of SpH3−H4 (1:1) (black). Right panel: Overlay of the 1H-15N SOFAST-HMQC spectrum of SpCAF-1(15N-Pcf1-ΔWHD) alone (yellow) and after addition of SpH3−H4 (1:1) (black).
Figure 3—figure supplement 4

Pcf1_WHD domain adopts a WHD fold similar to Sc C-terminal domain of Cac1, but does not bind DNA alone.
(A) Left panel: 1H-15N HSQC spectrum of the Pcf1_WHD domain at 10 °C. Assignments are indicated. The large spectral dispersion of the HN signals is consistent with a fully folded domain Right panel: Cα chemical shift index of Pcf1_WHD. Positive values are observed in the four helices and negative values in two short beta strands. These secondary structures are consistent with the AF2 model. (B) EMSA with Pcf1_WHD domain and a ladder of 20–100 bp dsDNA revealed with SYBR SAFE staining. (C) Sequence Logo covering helix α3 and the two beta strands of WHD generated with three sequence datasets closed to S. pombe Pcf1, S. cerevisiae Cac1 and H. sapiens CHAF1A/p150, respectively. Sequences alignments were done based on structure superimposition. The two residues involved in DNA binding of ScCac1_WHD are highlighted with stars. (D) Left panel: Overlay of the calculated model of the WHD domain with CS-rosetta software (light orange), with AlphaFold2 (gold) and the structure of Cac1 WHD from budding yeast (PDB 5jbm, in grey) (Grey). Middle and right panels: SpPcf1_WHD and ScCac1_WHD, respectively, with their electrostatic potential (same orientation as in the left panel). The two basic residues responsible for DNA binding of ScCac1_WHD are highlighted with spheres and labeled, the corresponding residues in SpPcf1_WHD are also highlighted and labeled. Differences in the electrostatic surfaces may explain why Pcf1_WHD does not interact with DNA.
Figure 4 with 2 supplements
The SpCAF-1-KER* mutant is affected for PCNA binding.
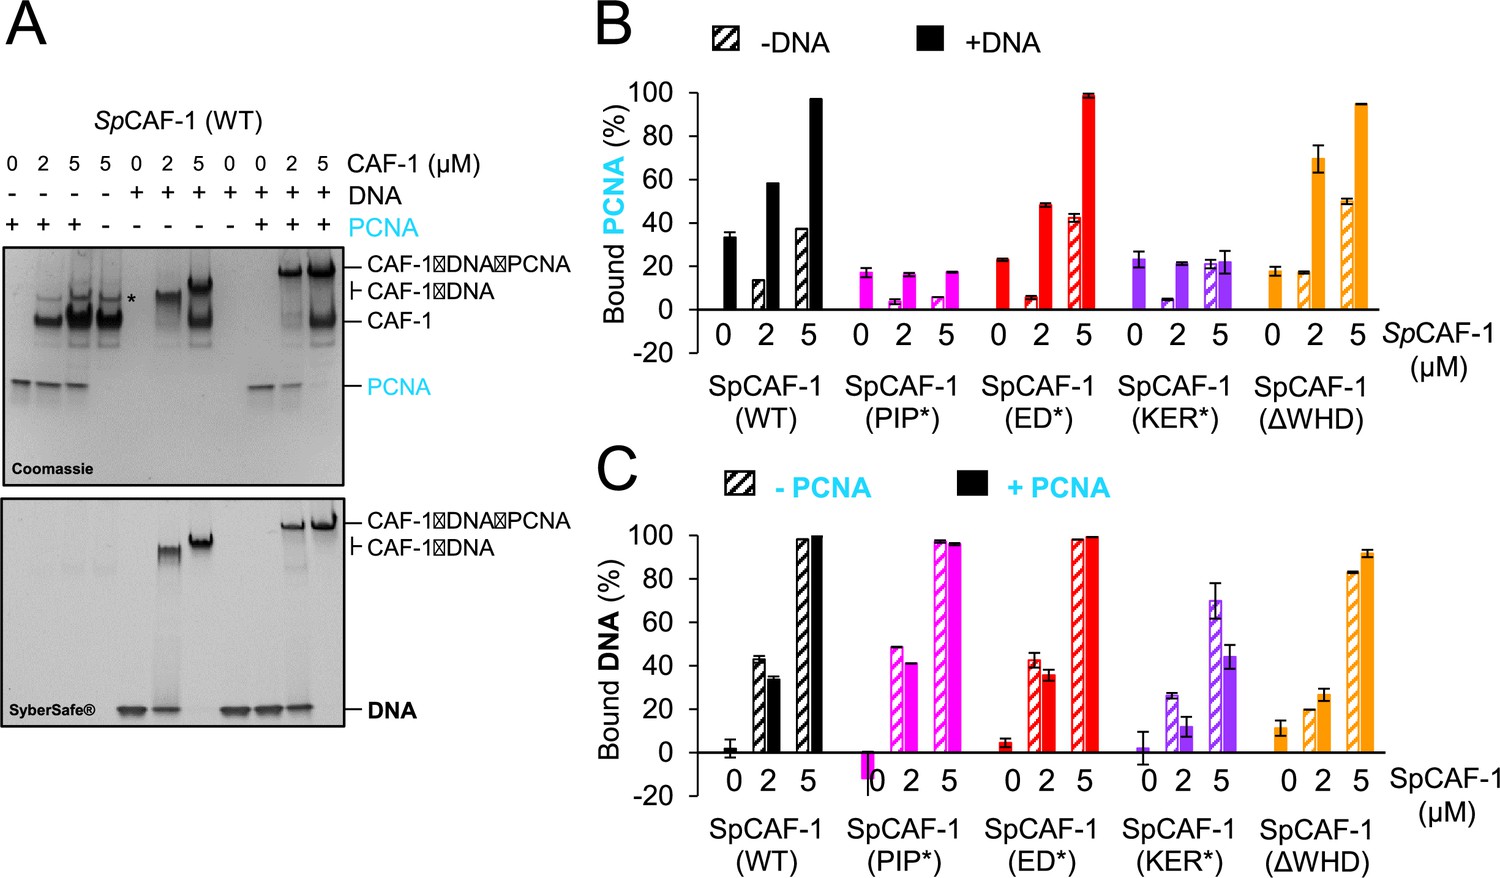
(A) EMSA showing interactions of purified SpCAF-1 (at the indicated concentrations), with or without recombinant SpPCNA (3 µM) in the presence and absence of 40 bp dsDNA (1 µM), revealed with Coomassie blue (upper panel) and with SYBR SAFE staining (lower panel). (B) Quantification of bound SpPCNA in the EMSA shown in panel A and in Figure 4—figure supplement 2 for SpCAF-1 and mutants. Values are indicated in % compared to the free PCNA reference (PCNA alone in line 1 in panel A) after addition of SpCAF-1 (WT or mutant) at the indicated concentration and in the presence (filled bars) or absence (dashed bars) of 40 bp dsDNA (1 µM). (C) Quantification of bound DNA for EMSA shown in panel A and in Figure 4—figure supplement 2 for SpCAF-1 and mutants. Bound DNA in % is compared to the free DNA reference (line 5 in panel A) after addition of SpCAF-1 (WT or mutant) at the indicated concentration and in the presence (filled bars) or absence (dashed bars) of SpPCNA (3 µM). All experiments were done in duplicates. Mean values are indicated and error bars shows their standard deviation.
Figure 4—figure supplement 1
Characterization of the Pcf1 PIP motif.
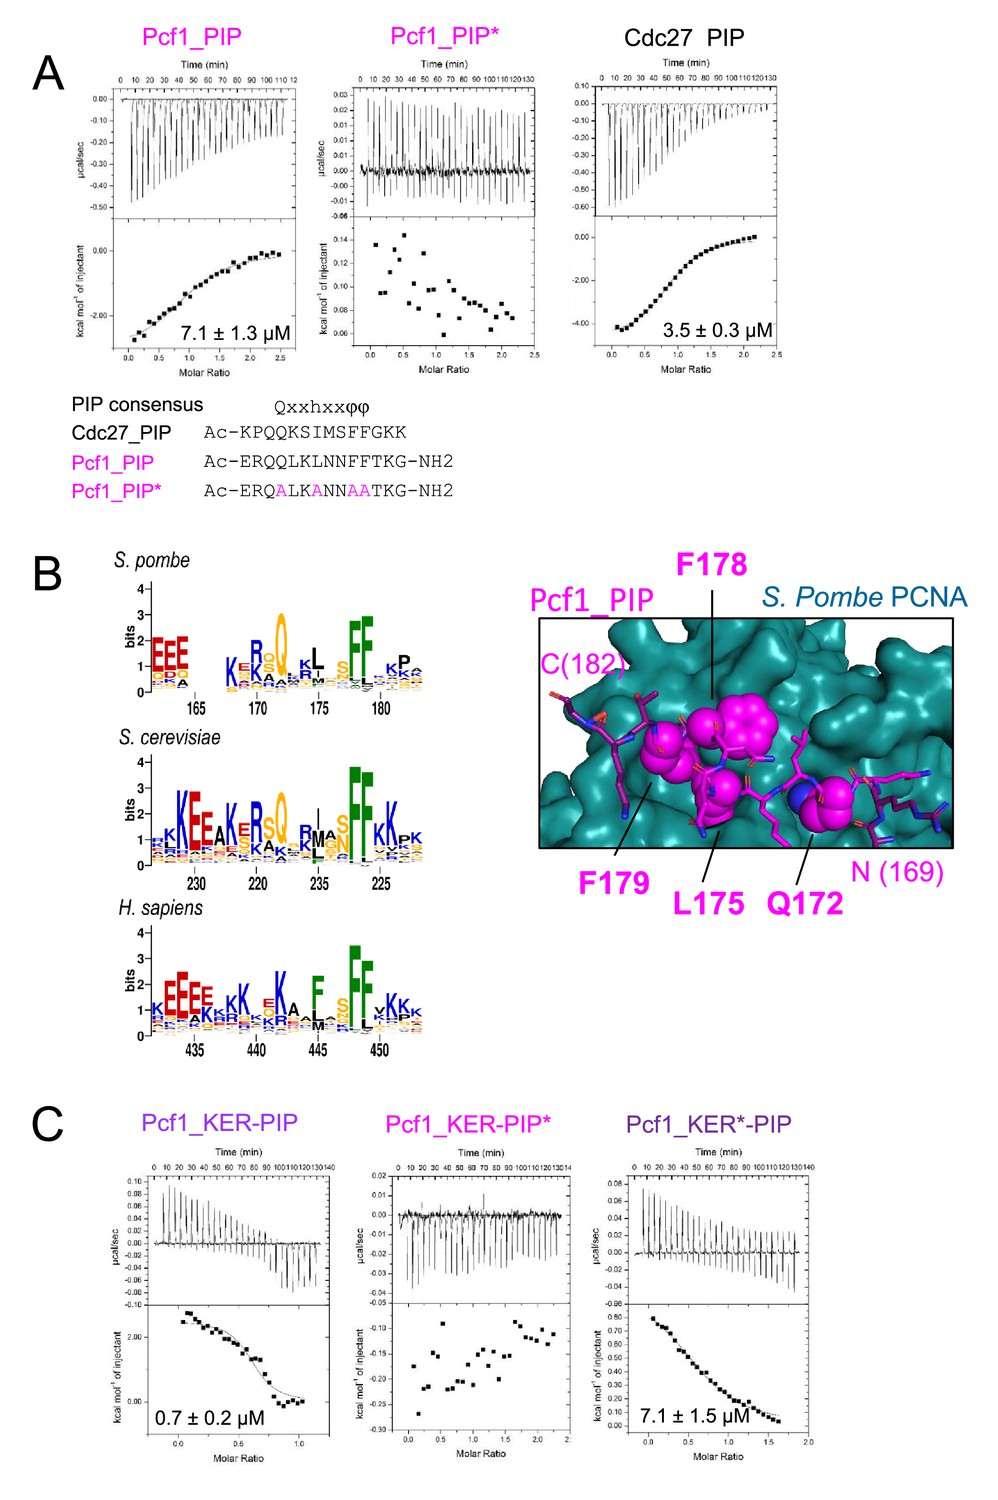
(A) ITC thermograms and data fitting for the indicated peptides upon titration of SpPCNA. The sequence of the three peptides is indicated as well as the canonical consensus for a PIP motif (h means hydrophobic residue, and φ an aromatic residue). (B) Left panel: Sequence Logo generated with a sequence data set adjacent to S. pombe Pcf1, S. cerevisiae Cac1 and H sapiens CHAF1A/p150 PIP motif, located at the C-terminus of the KER domain. Right panel: AlphaFold 2 model of Pcf1_PIP peptide (magenta) bound to SpPCNA (shown as a blue surface). Residues of the motif are highlighted with spheres and labeled. (C) ITC thermograms and data fitting for the indicated construct upon titration of SpPCNA.
Figure 4—figure supplement 2
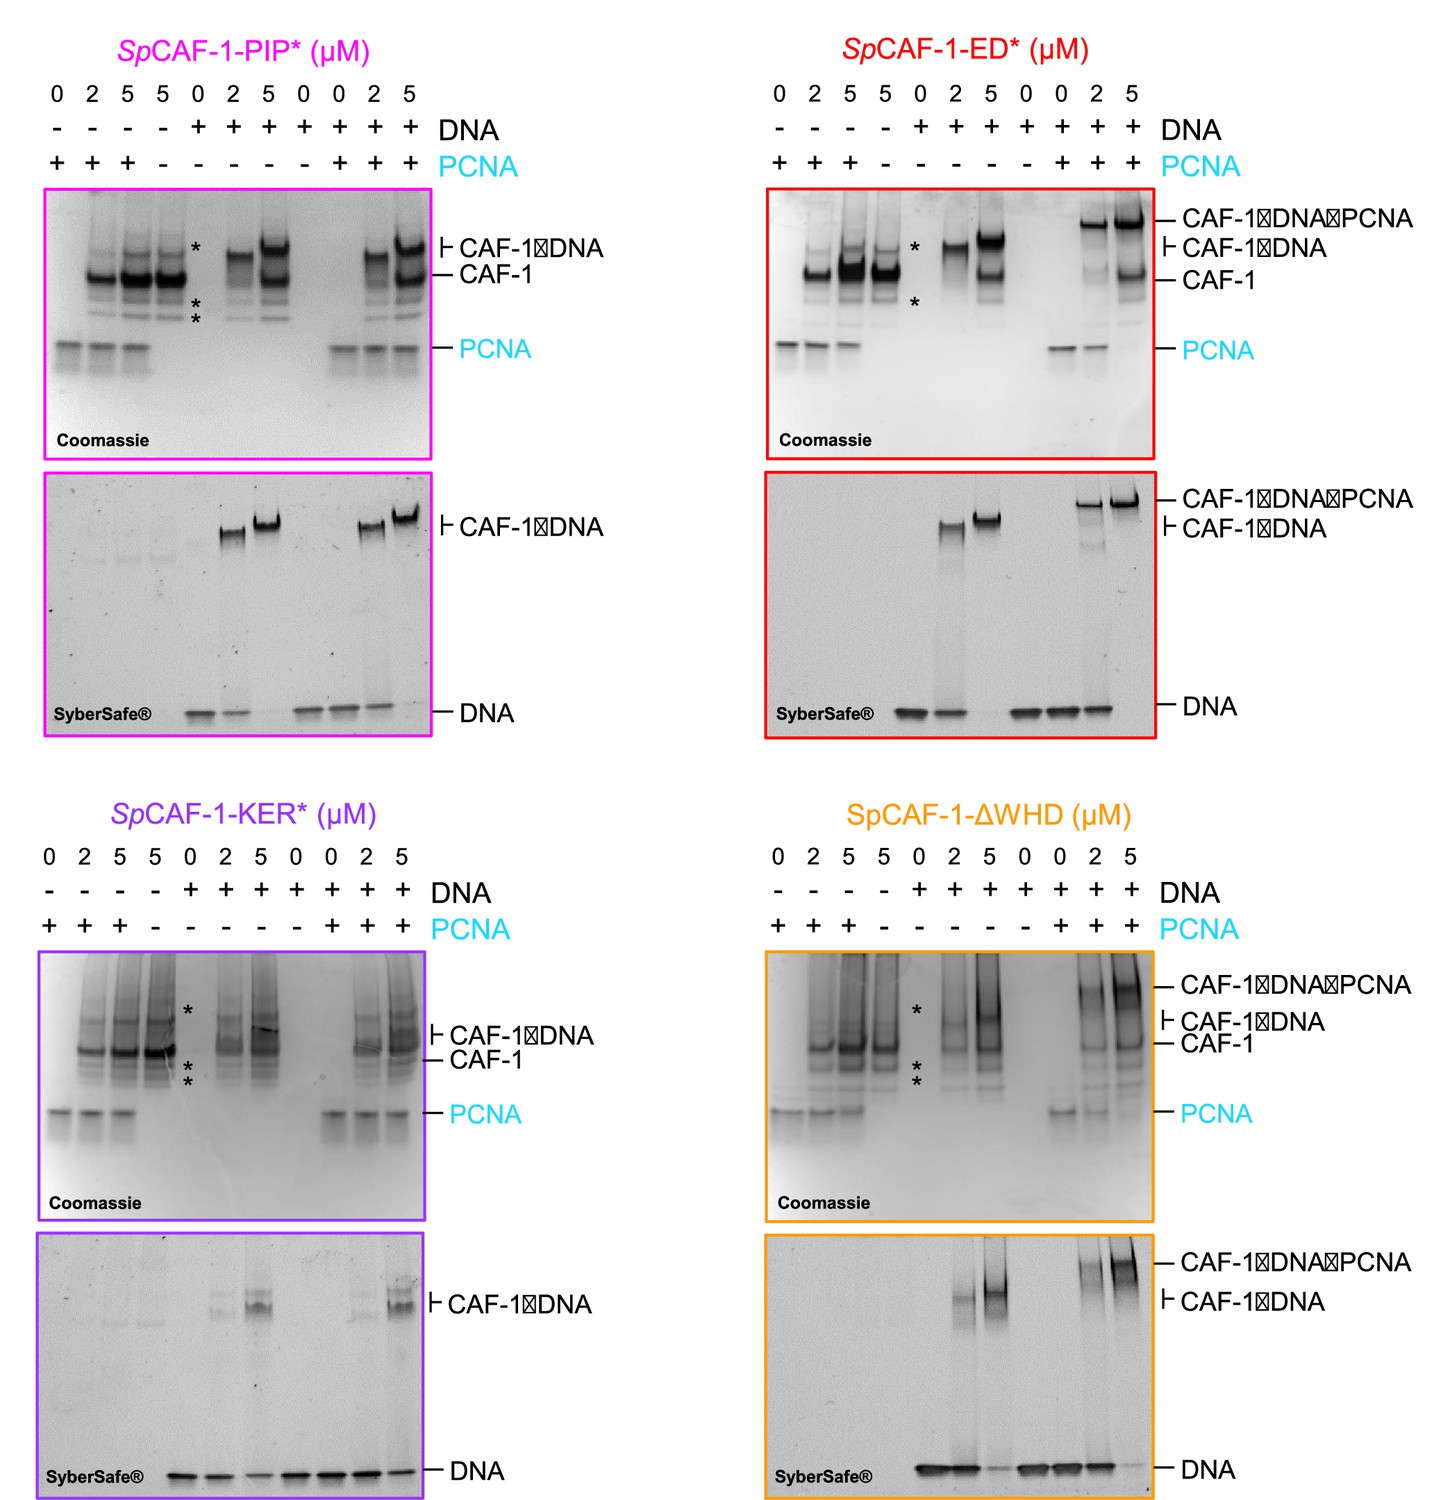
EMSA showing interactions of purified CAF-1 mutated complexes with DNA and PCNA.
EMSA showing interactions of purified CAF-1 mutated complexes (at the indicated concentrations), with or without recombinant SpPCNA (3 µM) in the presence and absence of 40 bp dsDNA (1 µM). For each mutant, the revelation was done with Coomassie blue to reveal protein shifts in the upper panel, and with SYBR SAFE staining in lower panel to reveal DNA shifts.
Figure 5 with 1 supplement

Efficient nucleosome assembly by SpCAF-1 in vitro requires interactions with H3−H4, DNA and PCNA, and the C-terminal WHD domain.
(A) Experimental scheme depicting the nucleosome assembly assay to monitor the efficiency of the SpCAF-1 complex. A plasmid with UV lesions (black star) when incubated in Xenopus HSE extracts undergoes DNA repair synthesis and the appearance of supercoiling is indicative of nucleosome assembly. In Extracts depleted from CAF-1, this nucleosome assembly coupled to DNA repair synthesis is stimulated by CAF-1 addition. The supercoiling assay separates by gel electrophoresis the relaxed plasmids (form II) not assembled from assembled plasmids, fully supercoiled (form I). DNA synthesis is monitored by biotin detection of biotin-dUTP incorporation (red). (B) Gel electrophoresis after 45 (left) and 120 (right) min incubation to monitor chromatin assembly in control mock and Xenopus p150-depleted HSE. Total DNA visualized by EtBr staining (top) and synthesized DNA visualized by biotin detection (bottom) are shown. The Xenopus p150-depleted HSE is either mock complemented (-) or complemented using SpCAF-1 complex composed of wild type Pcf1(WT) or mutants Pcf1-PIP*, Pcf1-ED*, Pcf1-KER*-, or Pcf1-ΔWHD- as indicated. T: pBS plasmid incubated without extract run in parallel serves as a migration control to locate supercoiled DNA. The position of relaxed (II) and supercoiled (I) DNA are indicated.
Figure 5—figure supplement 1

Western blot analysis of mock- and p150-depleted HSE.
Xenopus p150 and p60 CAF-1 are shown for 0.25, 0.5, 1, and 3 µL of HSE as indicated. β-actin is used as a loading control. Stars on the p60 indicate non-specific bands. M, molecular weight markers indicated on the left.
Figure 6 with 1 supplement
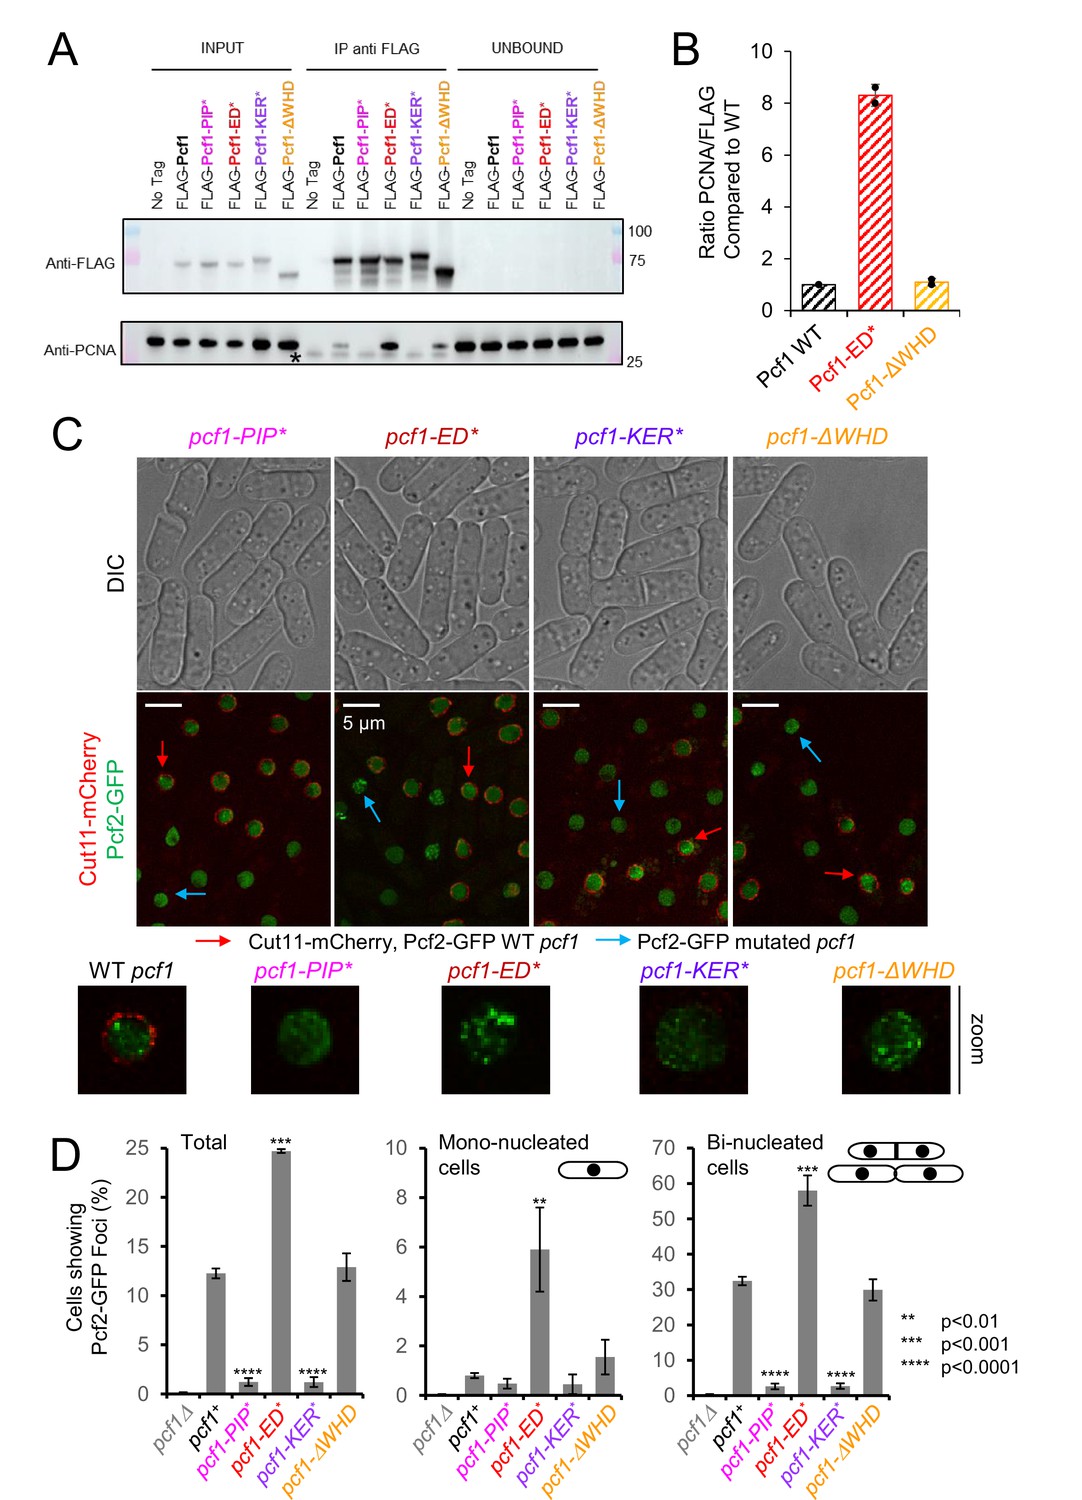
Association of CAF-1 with histone modulates PCNA interaction in vivo and foci formation.
(A) Anti-FLAG Pulldown to address PCNA−CAF-1 interaction in vivo in indicated strains. (B) Quantification of bound PCNA from (A). (C) Simultaneous acquisition of Pcf2-GFP in WT (red arrow) and pcf1 mutated strains (blue arrow). Strains were grown separately and equally mixed before to process them for cell imaging. WT pcf1 cells expressed the fusion Cut11-mCherry, a component of the nuclear pore complex, leading to a red labelling of the nuclear periphery. Under same illumination and acquisition conditions, Pcf2-GFP foci are detected in WT and pcf1-ΔWHD cells, but not in pcf1-PIP* and pcf1-KER* cells. In contrast, Pcf2-GFP foci are brighter and more abundant in pcf1-ED* cells. (D) Quantification of cells showing Pcf2-GFP foci, according to cell morphology in indicated strains. Mono-nucleated cells mark G2-phase cells and bi-nucleated cells with septum mark S-phase cells. Values are means of at least three independent experiments ± standard error of the mean (sem). At least 1000 nuclei were analysed per strain. p Values are indicated with stars and were calculated using the student test.
-
Figure 6—source data 1
Uncropped blots presented in Figure 6A.
- https://cdn.elifesciences.org/articles/91461/elife-91461-fig6-data1-v2.pdf
Figure 6—figure supplement 1
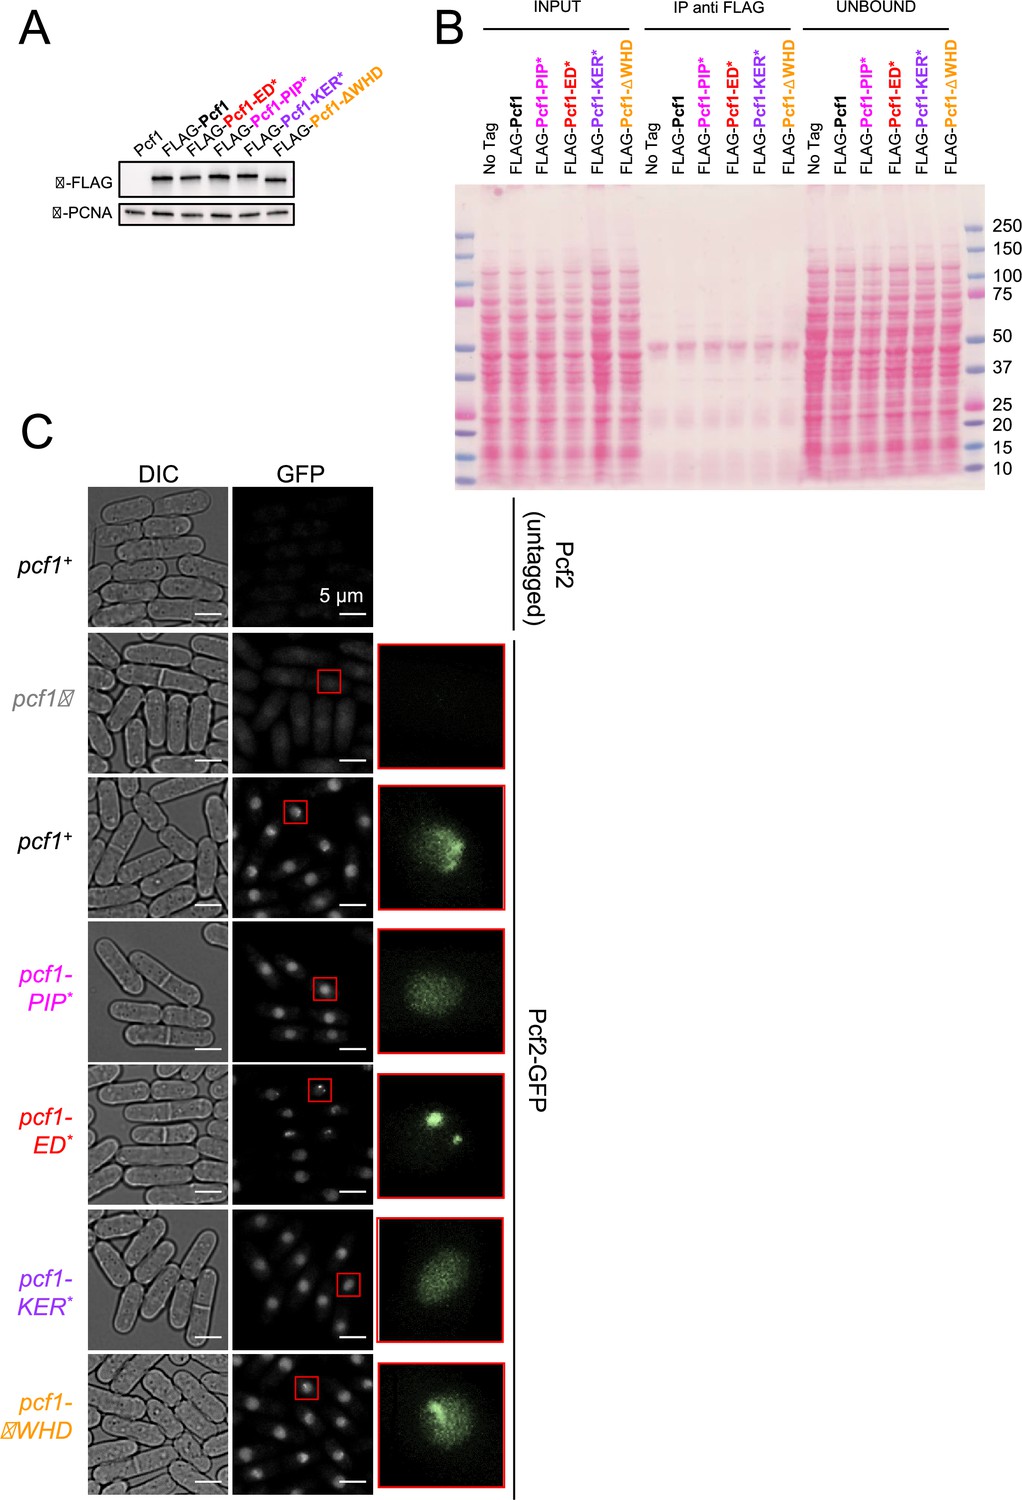
Association of CAF-1 with histone is coupled to PCNA interaction in vivo.
(A) Expression levels of the FLAG-Pcf1 in indicated strains from total extracts. PCNA was used as loading control. (B) Nitrocellulose membrane from Figure 6A stained with Red ponceau. (C) Example of Pcf2-GFP foci in living cells in indicated strains. The top strain corresponds to a strain expressing wild-type and untagged Pcf2 as a negative control of GFP fluorescence. A zoom on a S-phase nuclei (from cells exhibited a septum) is showed for each strain.
Figure 7 with 1 supplement
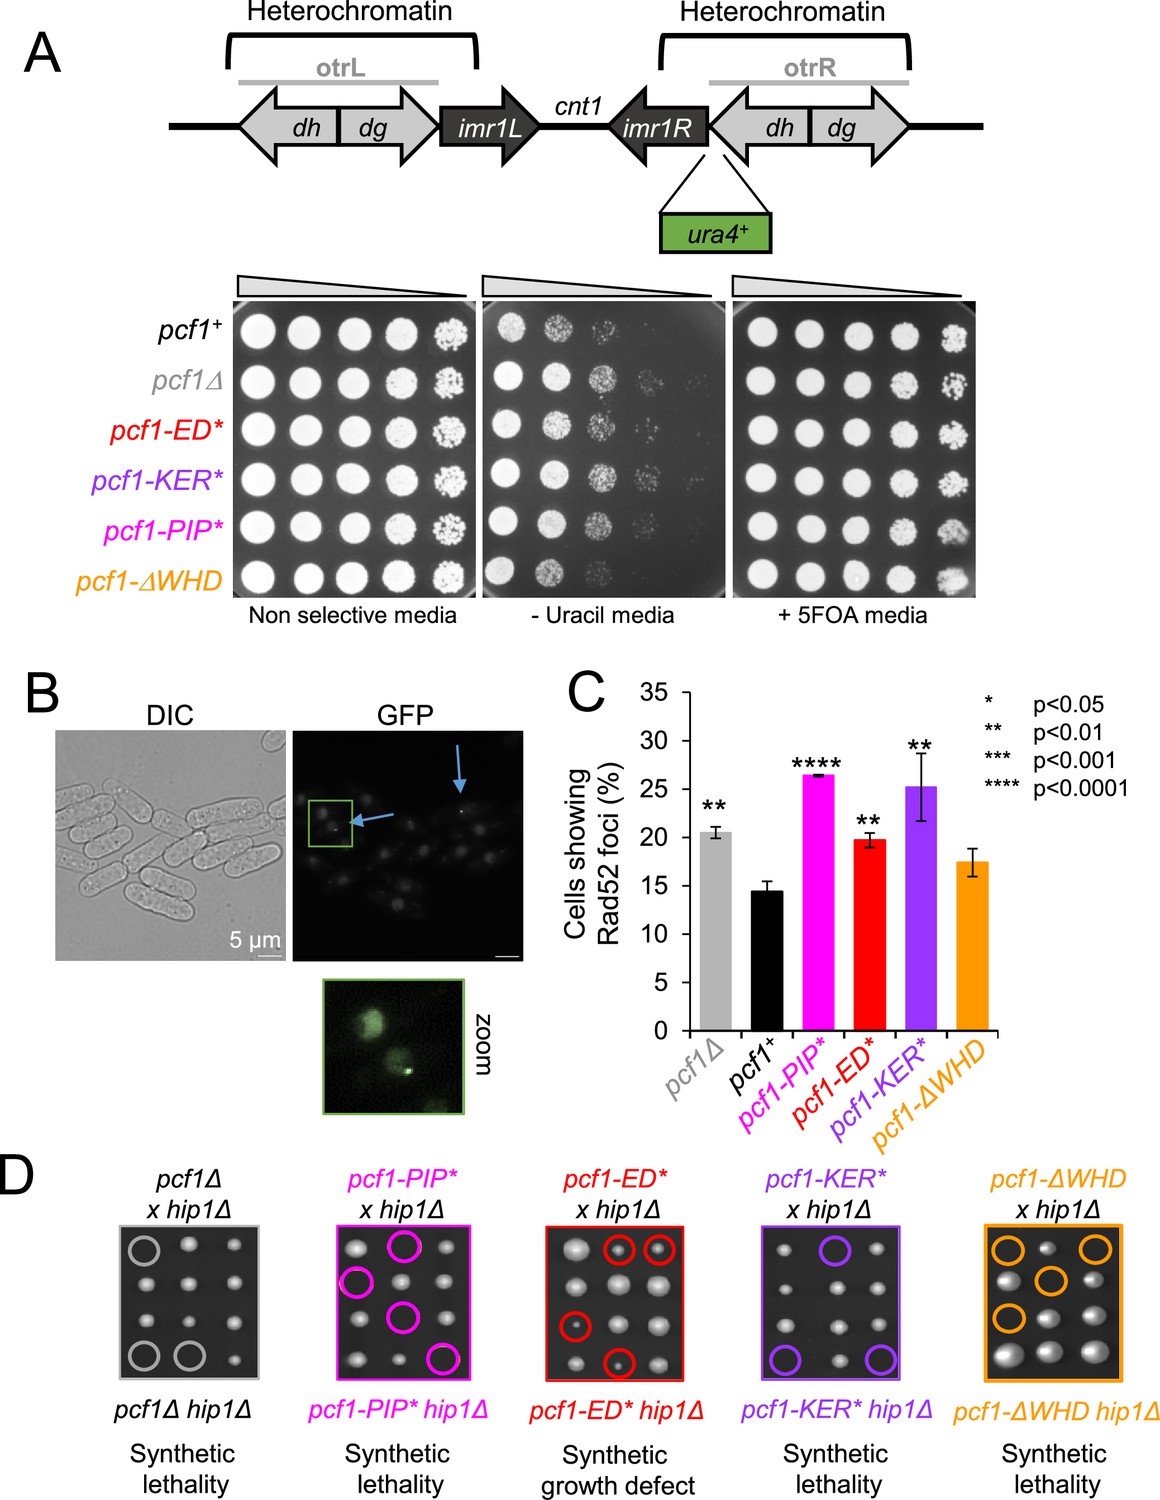
The WHD domain of SpCAF-1 specifies CAF-1 function.
(A) Top panel: Schematic representation of the silencing assay used. Otr: outer repeats; imr: inner repeats; cnt1: central core of the centromere 1. Bottom panel: Serial fivefold dilution of indicated strains on indicated media. (B) Example of Rad52-GFP foci in WT cells. Blue arrows indicate Rad52 foci-positive cells. (C) Quantification of Rad52-GFP foci in indicated strains. Values are means of at least three independent experiments ±sem. p Values are indicated as stars and were calculated with the student test. At least 1000 nuclei were analyzed per strain. (D) Co-lethality assay. Tetrad dissections of cells deleted for hip1 (hip1Δ) crossed with cells deleted for pcf1 (pcf1Δ) (grey) or harboring pcf1-PIP* (magenta), pcf1-ED* (red), pcf1-KER* (purple), or pcf1-ΔWHD* (orange). Spores with double mutations are surrounded and were deducted from the analysis of viable spores from each tetrad (see Materials and methods). At least 18 tetrads were analysed per cross.
Figure 7—figure supplement 1
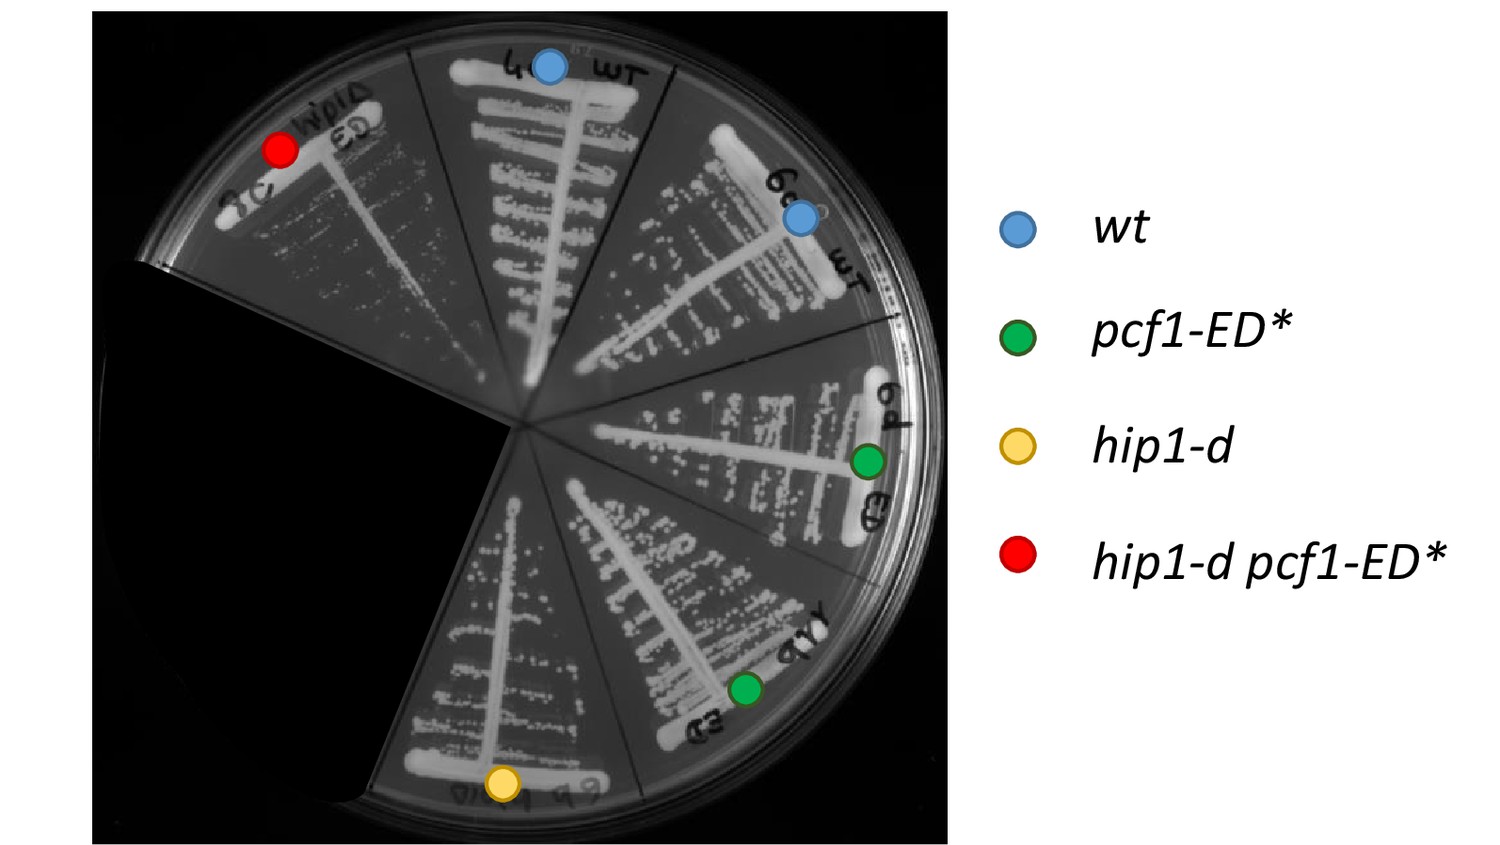
the pcf1-ED* mutation confers a synthetic growth defect when combined with hip1∆.
Spores of the indicated genotypes were streaked onto a YEA agar plate and grown at 30 °C for 3 days.
Author response image 1
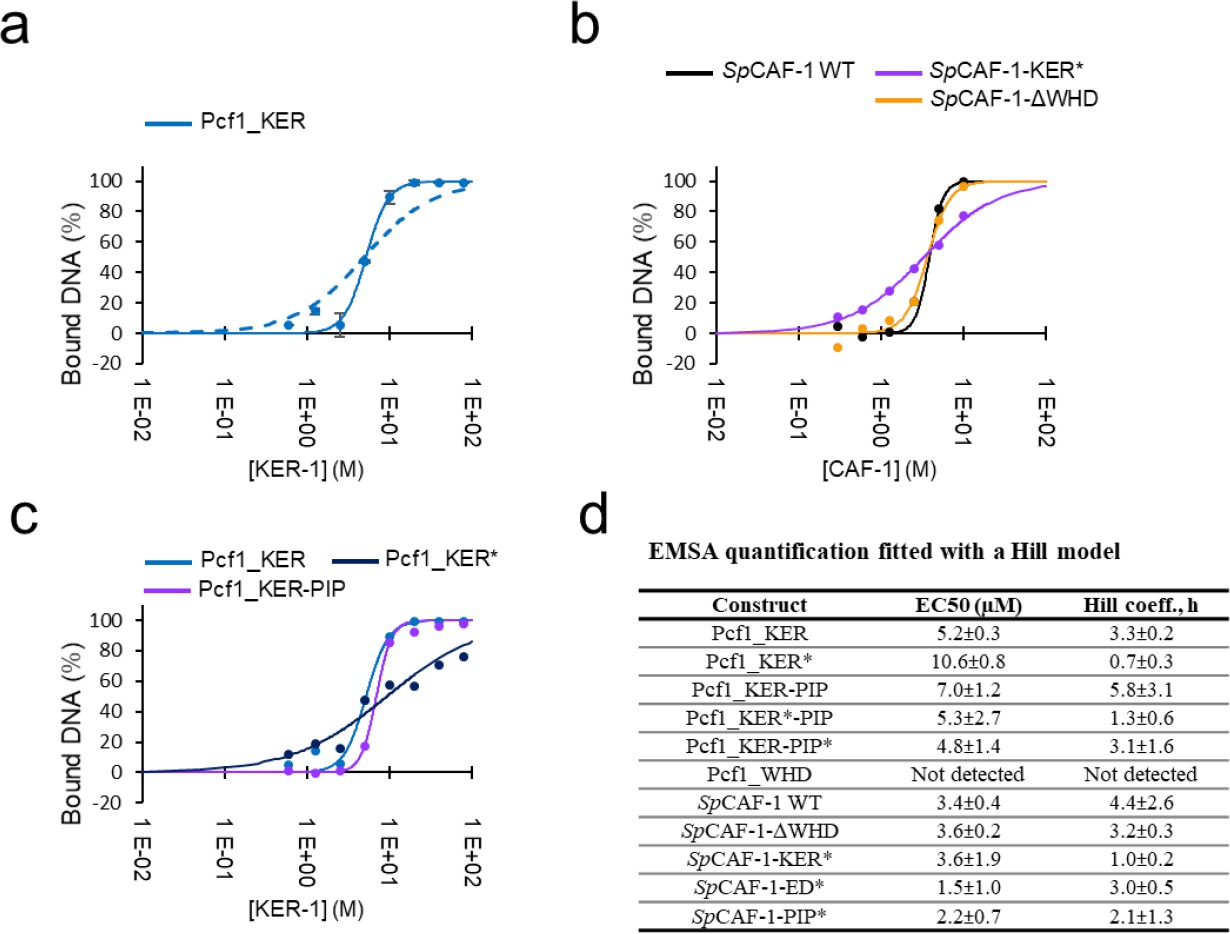
Quantitative analysis of interaction with DNA by EMSA.
a: quantification of the amount of bound DNA for the Pcf1_KER domain (blue points with error bars). The fit with a KD model is shown as a dashed line, and the fit with a Hill model with a solid line. b: Examples of quantifications and fits (Hill model) for reconstituted SpCAF-1 WT and mutants. c: Examples of quantifications and fits (Hill model) for Pcf1_KER domains WT and mutant. d: EC50 values and Hill coefficients obtained for all EMSA experiments presented in Figure 3 and S3.
Author response image 2

Tables
Table 1
Experimental affinities of different SpCAF-1 constructs with a 40 bp dsDNA measured by MicroScale thermophoresis (MST) fitted with the Hill model (Tso et al., 2018).
| Construct | EC50 (µM) | Hill coeff., h |
|---|---|---|
| Pcf1_KER | 1.1±0.2 | 3.3±0.5 |
| Pcf1_KER* | 12.2±0.7 | 1.5±0.3 |
| Pcf1_KER-PIP | 1.9±0.3 | 5.2±0.9 |
| Pcf1_WHD | Not detected | Not detected |
| SpCAF-1 WT | 0.7±0.1 | 2.7±0.2 |
| SpCAF-1-ΔWHD | 0.7±0.1 | 2.3±0.3 |
| SpCAF-1-KER* | 2.8±0.4 | 1.3±0.3 |
| SpCAF-1-ED* | 1.0±0.1 | 2.3±0.1 |
| SpCAF-1-PIP* | 0.7±0.1 | 2.7±0.3 |
Table 2
Interactions parameter with SpPCNA measured by isothermal microcalorimetry (ITC).
| Ligand | Kd (μM) | ΔG (kCal.M–1) | N* | ΔH (kCal.M–1) | -TΔS (kCal.M–1) |
|---|---|---|---|---|---|
| Pcf1_PIP | 7.1±1.3 | –6.9±0.1 | 0.97±0.08 | –2.9±0.2 | –0.39±0.3 |
| Pcf1_PIP* | Not detected | ND | ND | ND | ND |
| Pcf1_KER-PIP | 0.7±0.2 | –8.2±0.2 | 0.64±0.04 | +2.9 ± 0.6 | –11.2±0.8 |
| Pcf1_KER*-PIP | 7.1±1.5 | –6.9±1.2 | 0.7±0.2 | +1.0 ± 0.5 | –7.9±0.7 |
| Pcf1_KER-PIP* | Not detected | ND | ND | ND | ND |
| Cdc27_PIP | 3.5±0.3 | –7.3±0.1 | 0.9±0.1 | –4.8±0.02 | –2.4±0.1 |
-
*The stoichiometry (N) is calculate as a molar ratio of monomeric PCNA.
Additional files
-
MDAR checklist
- https://cdn.elifesciences.org/articles/91461/elife-91461-mdarchecklist1-v2.pdf
-
Supplementary file 1
Supplementary tables.
(A) Experimental information and modelling of SAXS data. (B) Yeast strains used in this study.
- https://cdn.elifesciences.org/articles/91461/elife-91461-supp1-v2.docx
Download links
A two-part list of links to download the article, or parts of the article, in various formats.
Downloads (link to download the article as PDF)
Open citations (links to open the citations from this article in various online reference manager services)
Cite this article (links to download the citations from this article in formats compatible with various reference manager tools)
Disordered regions and folded modules in CAF-1 promote histone deposition in Schizosaccharomyces pombe
eLife 12:RP91461.
https://doi.org/10.7554/eLife.91461.3


