Cerebellar nuclei cells produce distinct pathogenic spike signatures in mouse models of ataxia, dystonia, and tremor
- Department of Pathology & Immunology, Baylor College of Medicine, United States
- Jan and Dan Duncan Neurological Research Institute at Texas Children’s Hospital, United States
- Department of Pediatrics, Baylor College of Medicine, United States
- Development, Disease Models & Therapeutics Graduate Program, Baylor College of Medicine, United States
- Department of Neuroscience, Baylor College of Medicine, United States
Figures
Figure 1 with 3 supplements
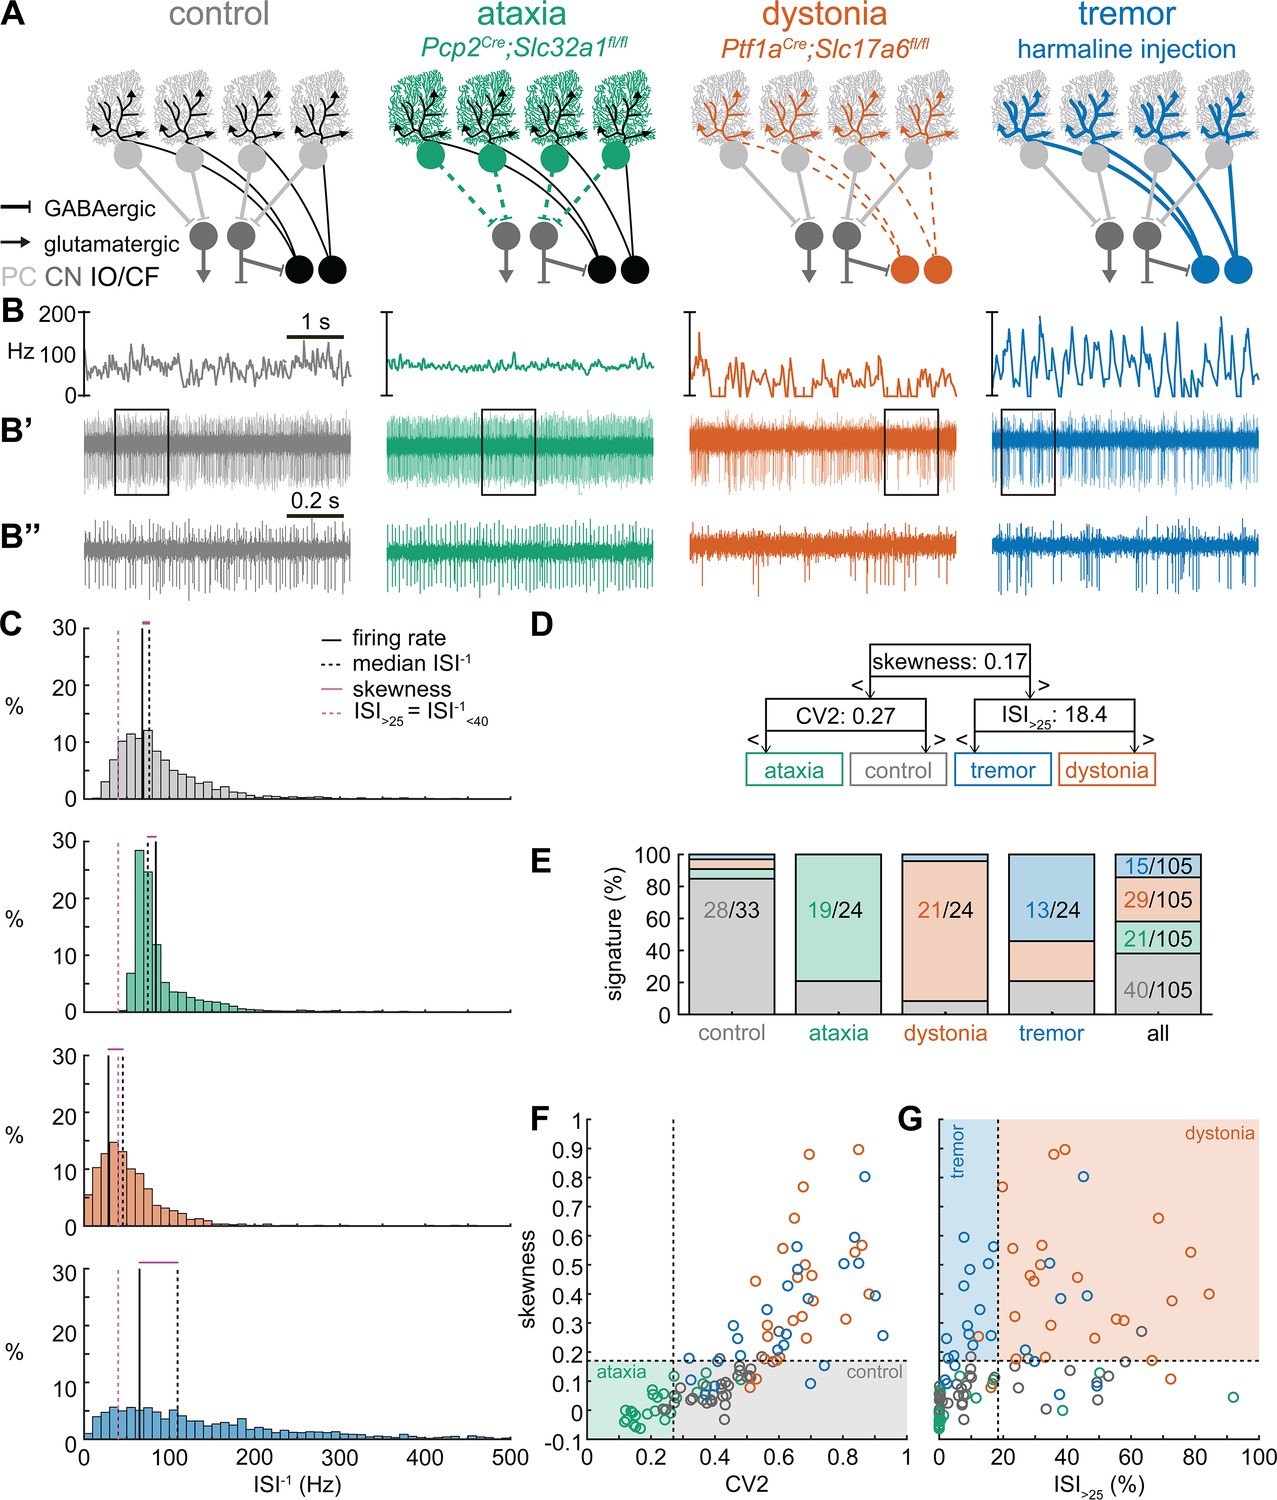
Supervised classifier model predicts mouse phenotype based on spike signatures.
(A) Schematic of network changes causing motor impairments in mouse models for ataxia, dystonia, and tremor. Dotted lines indicate lack of neurotransmission. Color-coded lines indicate primary affected cell type. (B) Example of spike firing rate averaged over previous 50 ms at each occurring spike for the 5 s spike train in (B’). (B’’) 1 s spike train for the duration indicated in the square box in (B’). (C) Histograms of instantaneous firing rate (ISI–1) of the full 30 s spike train used in the classification model. We indicate the firing rate (spikes/s), median ISI–1, skewness, and ISI>25 for all for example cells. (D) Classifier model based on training data set (control: n = 25 cells; ataxia: n = 20; dystonia: n = 20; tremor: n = 20). (E) Assigned spike signature based on spike properties in complete data set (control: n = 33 cells, N = 9 mice; ataxia: n = 24, N = 5; dystonia: n = 24, N = 9; tremor: n = 24, N = 6). Categories on x-axis indicate the origin of the recorded neurons. (F, G) Scatterplot of spike train parameters used to classify neural signatures. Colored boxes indicate the predicted phenotype, colors of circles indicate the origin of the recorded neurons. PC = Purkinje cell; CN = cerebellar nuclei; IO/CF = inferior olive/climbing fiber.
-
Figure 1—source data 1
Source data for the graphs in Figure 1 and its figure supplements.
- https://cdn.elifesciences.org/articles/91483/elife-91483-fig1-data1-v1.xlsx
Figure 1—figure supplement 1
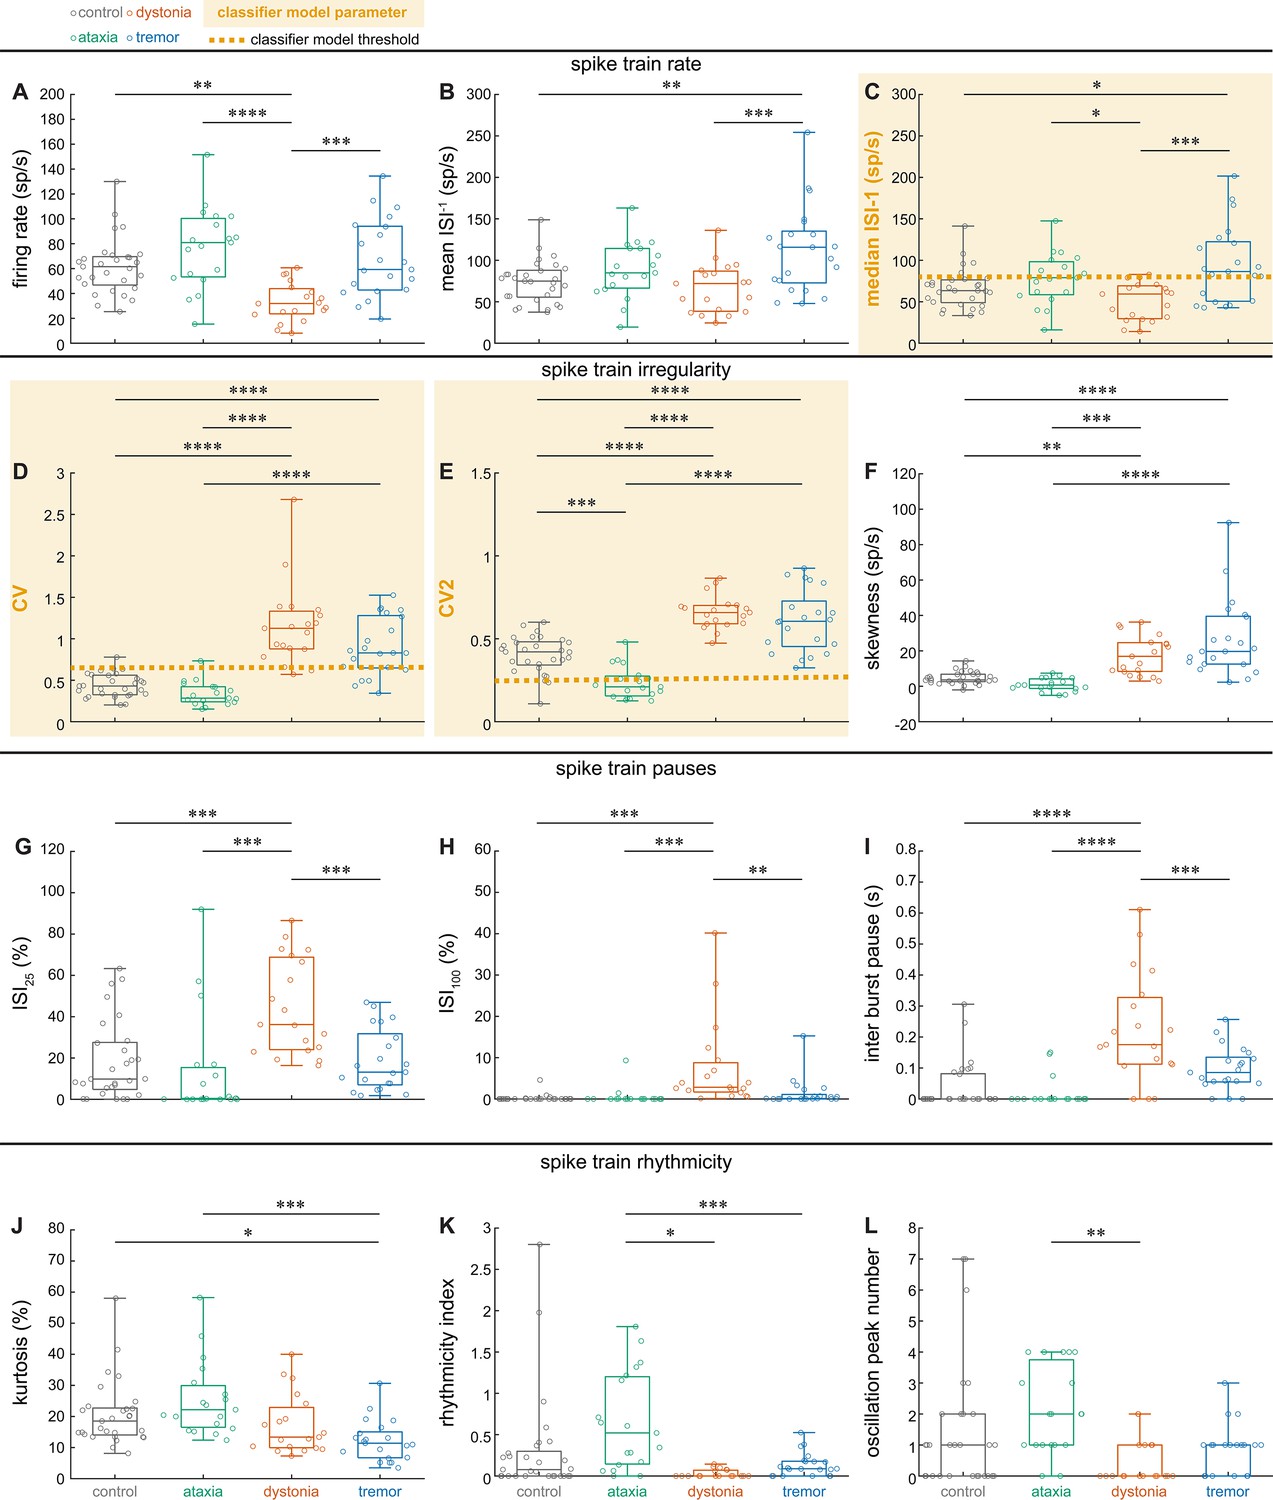
Distribution of spike train parameters in control, ataxic, dystonic, and tremor mice.
Values and group differences in spike train rate (A firing rate; B mean ISI–1; C median ISI–1), irregularity (D CV; E CV2; F skewness), pauses (G ISI25; H ISI100; I inter burst pause), and rhythmicity (J kurtosis; K rhythmicity index; L oscillation peak number) (see ‘Materials and methods’ for parameter definitions). The coarse classifier model identified the orange highlighted parameters and dotted lines as parameters and threshold values that best differentiated between the groups of cells. Boxplots indicate 25th, 50th, and 75th percentile. Each circle is the parameter value for one neuron in the training set for the coarse classifier model. * = p<0.05, ** = p<0.01, *** = p<0.001, **** = p<0.0001. For (A–K), differences were tested using one-way ANOVA followed by Tukey post hoc analyses. For (L), differences were tested using a Kolmogorov test followed by Tukey post hoc analyses. Control mice = healthy mice; ataxia model = Pcp2Cre;Slc32a1fl/fl; dystonia model = Ptf1aCre;Slc17a6fl/fl; tremor model = harmaline injection (see also Supplementary file 1). Control: n = 33 cells, N = 9 mice; ataxia: n = 24, N = 5; dystonia: n = 24, N = 9; tremor: n = 24, N = 6.
Figure 1—figure supplement 2
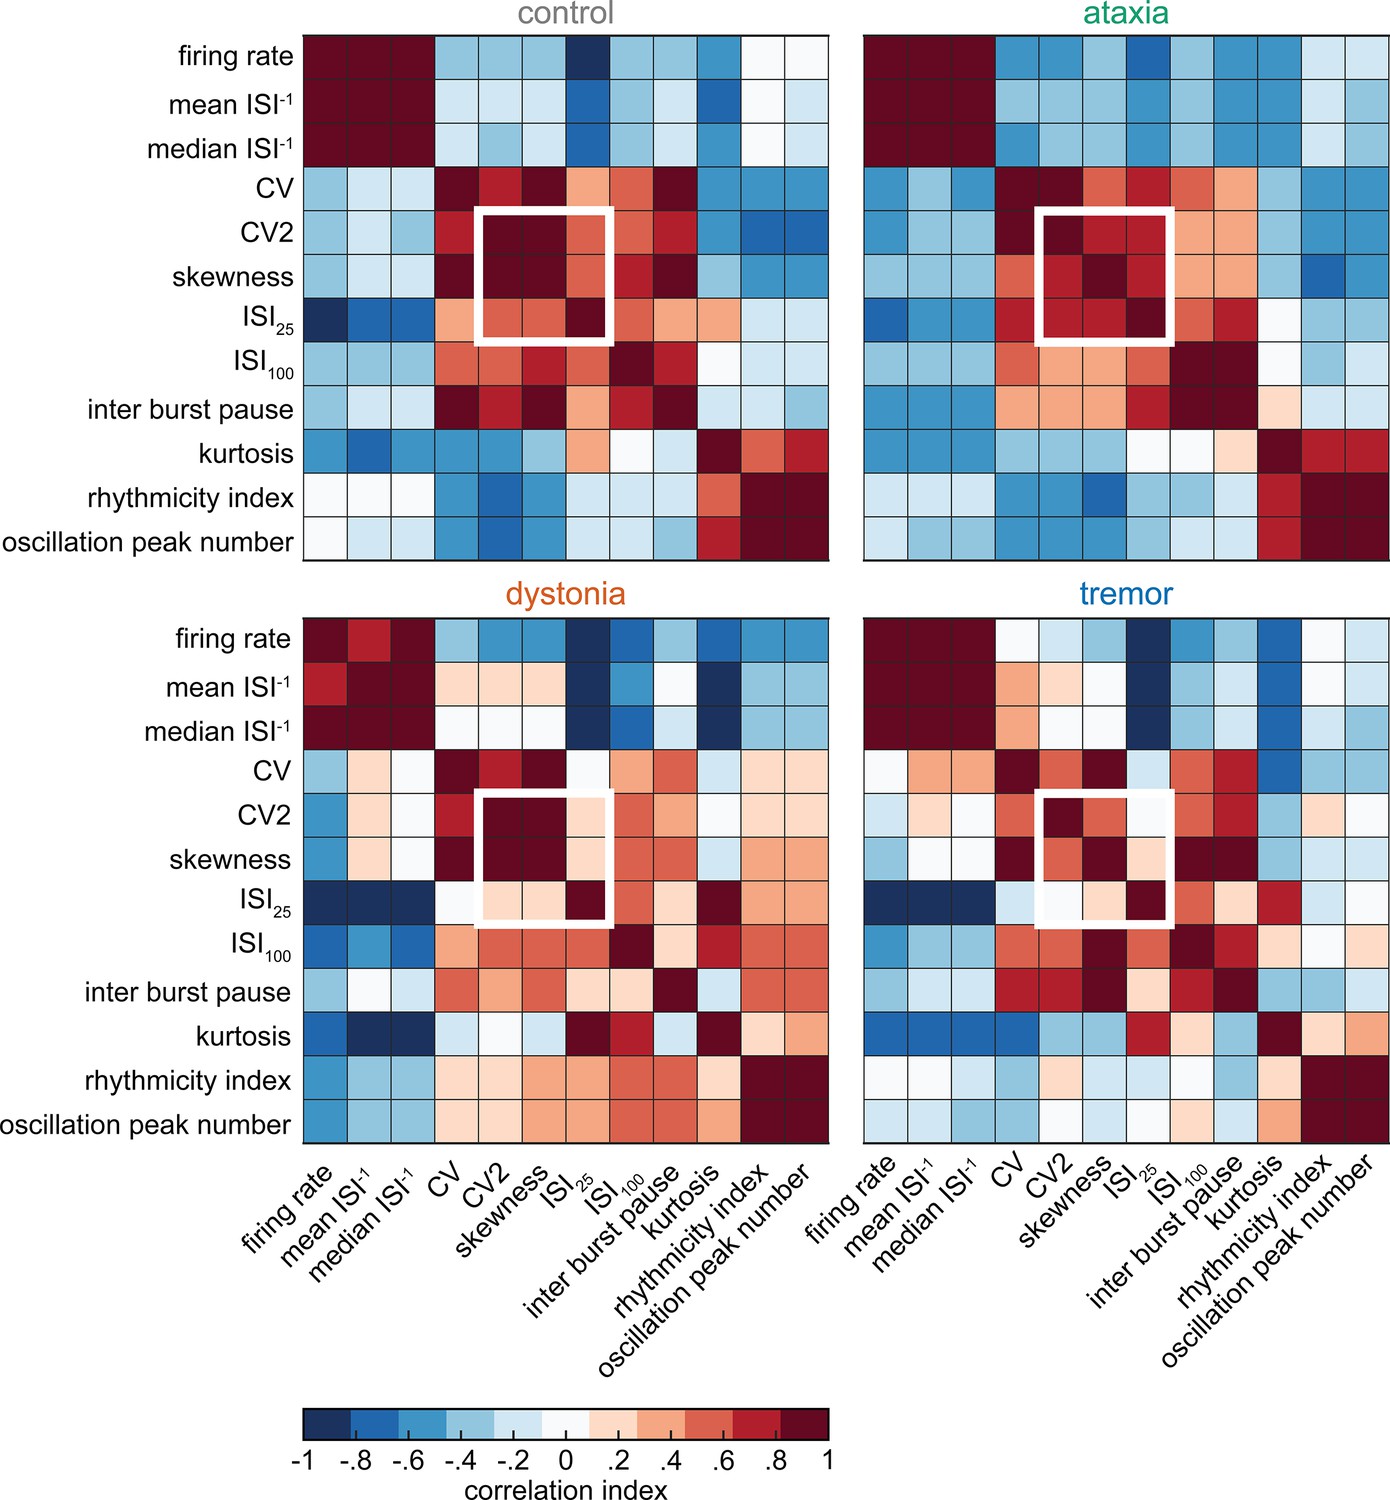
Correlation coefficients for spike parameters in control, ataxic, dystonic, and tremor mice.
We calculated the correlation coefficients in the Z-scored (based on total population of neurons) parameter values in control, ataxic, dystonic, and tremor mice. We find high correlation coefficients (correlation index >0.8) between many parameters. The three parameter values identified by our top performing classifier model (indicated with white box) had qualitatively different correlation indexes between the four groups of mice, indicating that they may hold different information for each group of neurons.
Figure 1—figure supplement 3
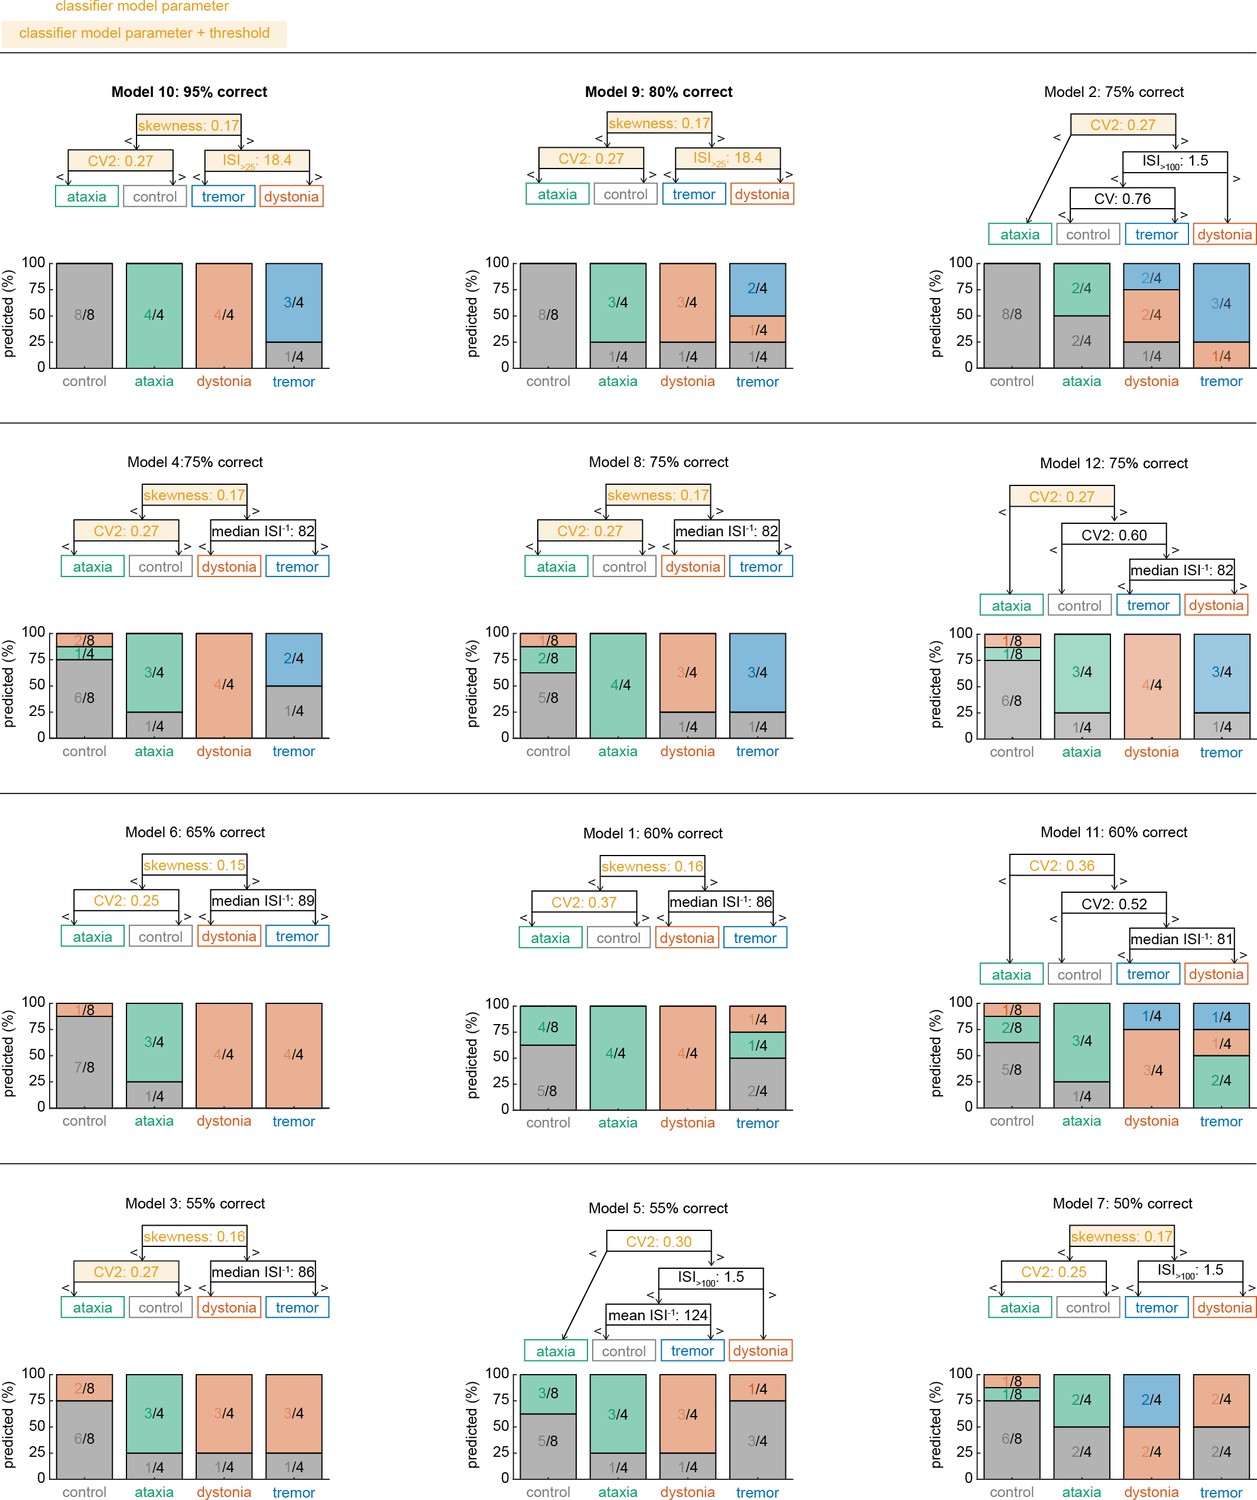
Classifier models based on 12 different sets of training data.
We trained 12 coarse classifier models based on 12 datasets with training data and non-overlapping validation sets. We ordered the classifier models based on best performance in correctly assigning a spike signature to the neuron’s recording origin. We found that models 10 and 9 had the best performances, respectively, based on the same set of parameters and parameter cutoffs.
Figure 2
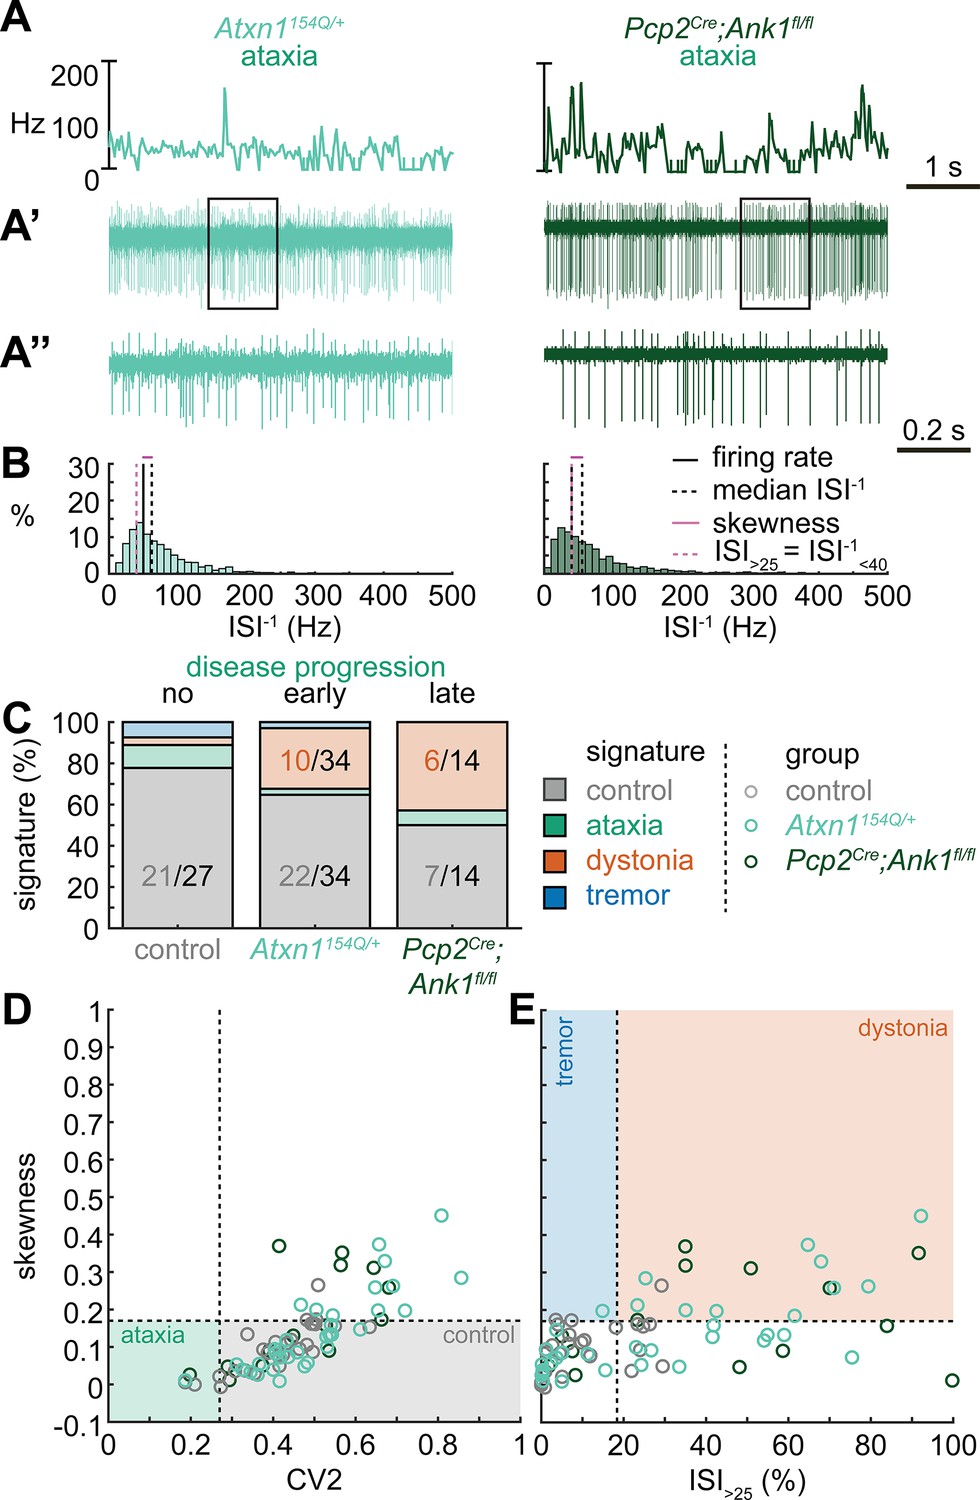
Spike signatures in ataxia models with different etiologies.
(A) 5 s example spike trains (and 1 s inset) of representative cerebellar nuclei neurons recorded in each mutant mouse model. Left: example cell from early disease progression (4-month-old) ataxic Atxn1154Q/+ mouse. Right: example cell from late disease progression (11-month-old) ataxic Pcp2Cre;Ank1fl/fl mouse. (B) Histograms of instantaneous firing rate (ISI–1) of the full 30 s spike train of the example cells in (A). We indicate the firing rate (spikes/s), median ISI–1, skewness, and ISI>25. (C) Proportion of predicted spike signatures in each of the mouse models. (D, E) Scatterplot of spike train parameters used to classify neural signatures. Colored boxes indicate the predicted phenotype, colors of circles indicate the origin of the recorded neurons. Control: n = 27 cells, N = 5 mice; Atxn1154Q/+: n = 34, N = 4; Pcp2Cre;Ank1fl/fl: n = 14, N = 3. (C–E) are based on the classifier model in Figure 1D.
-
Figure 2—source data 1
Source data for the graphs in Figure 2.
- https://cdn.elifesciences.org/articles/91483/elife-91483-fig2-data1-v1.xlsx
Figure 3
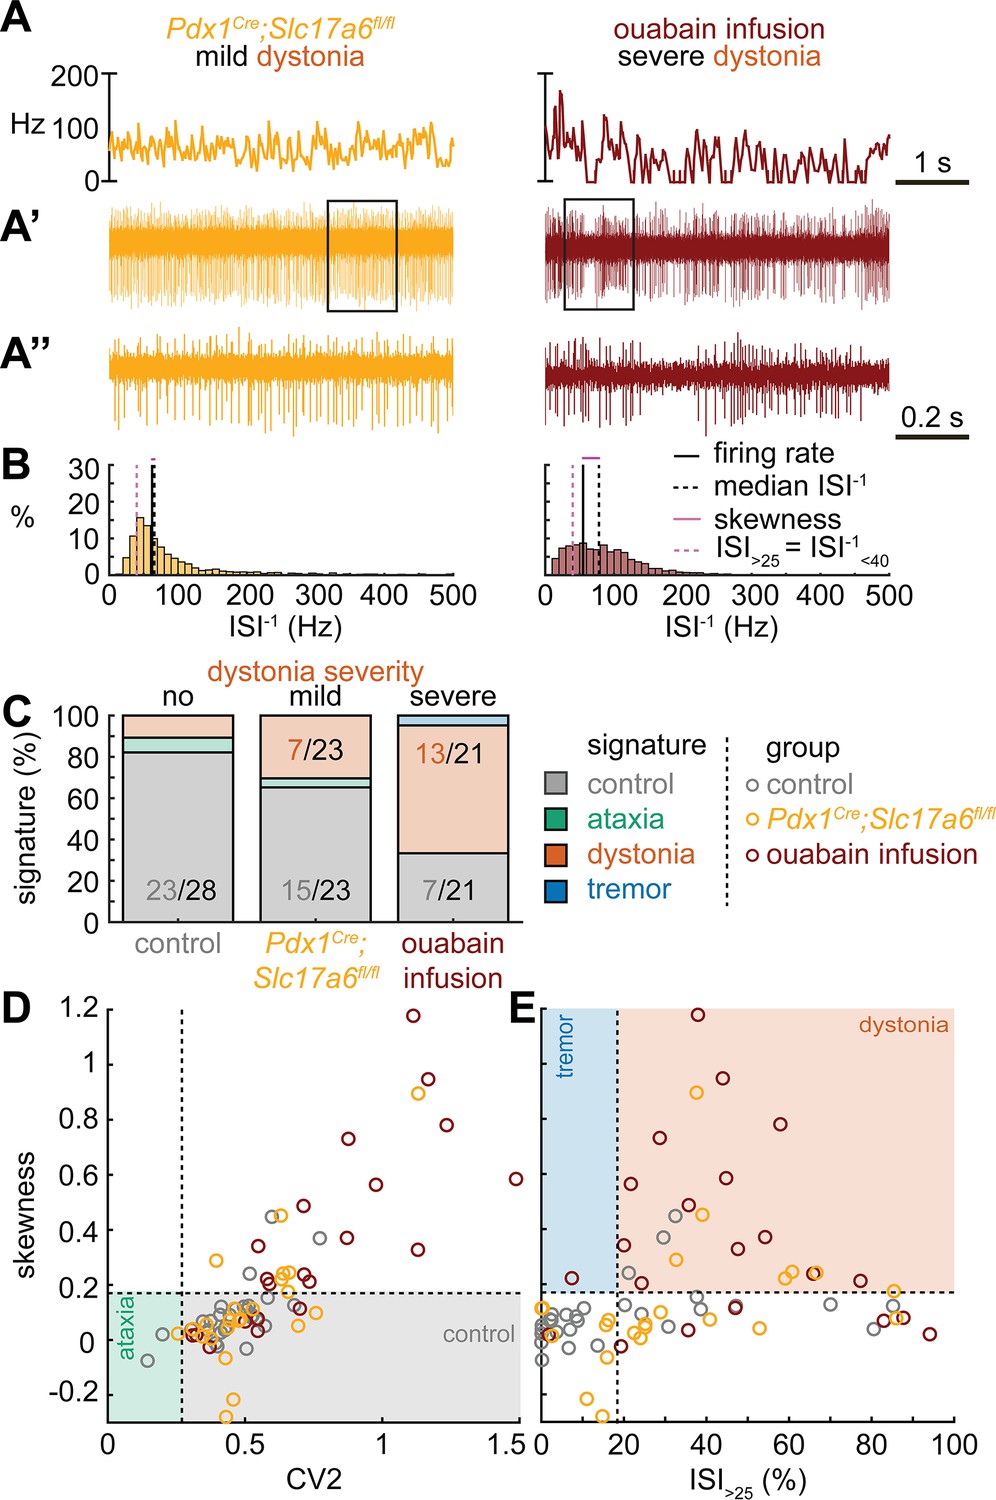
Spike signatures in dystonia models with different etiologies.
(A) 5 s example spike trains (and 1 s inset) of representative cerebellar nuclei neurons recorded in each mutant mouse model. Left: example cell from mildly dystonic Pdx1Cre;Slc17a6fl/fl mouse. Right: example cell from severely dystonic cerebellum ouabain infusion mouse. (B) Histograms of instantaneous firing rate (ISI–1) of the full 30 s spike train of the example cells in (A). We indicate the firing rate (spikes/s), median ISI–1, skewness, and ISI>25. (C) Proportion of predicted spike signatures in each of the mouse models. (D, E) Scatterplot of spike train parameters used to classify neural signatures. Colored boxes indicate the predicted phenotype, colors of circles indicate the origin of the recorded neurons. Control: n = 28 cells, N = 6 mice; Pdx1Cre;Slc17a6fl/fl: n = 23, N = 5; cerebellum ouabain infusion: n = 21, N = 4. (C–E) are based on the classifier model in Figure 1D.
-
Figure 3—source data 1
Source data for the graphs in Figure 3.
- https://cdn.elifesciences.org/articles/91483/elife-91483-fig3-data1-v1.xlsx
Figure 4
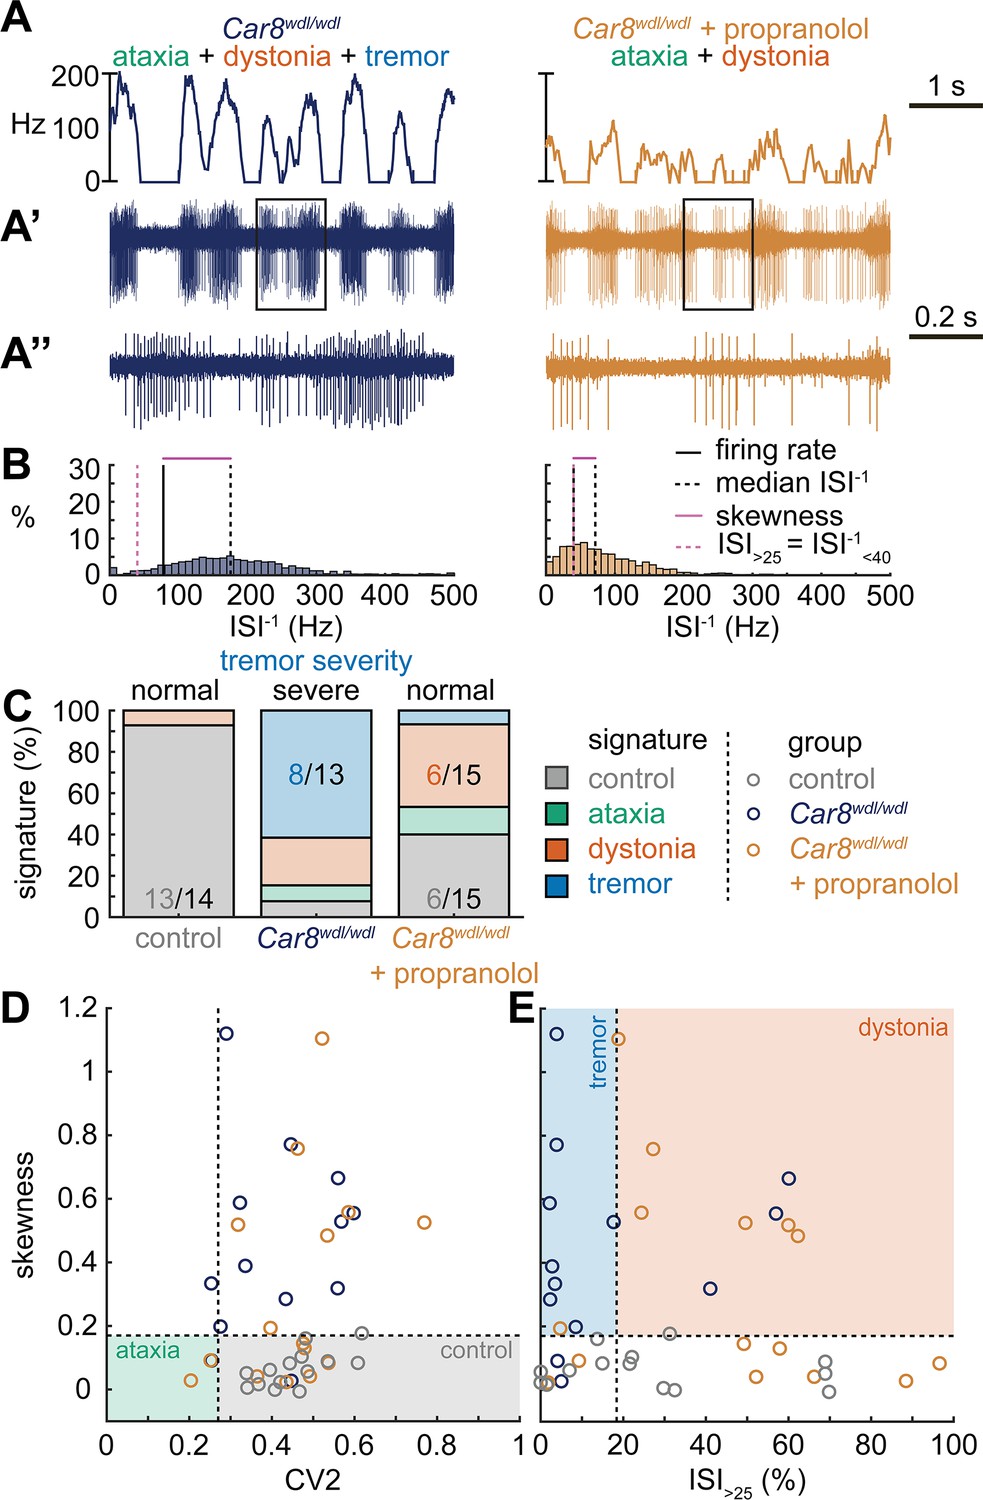
Spike signatures in tremor models with different etiologies.
(A) 5 s example spike trains (and 1 s inset) of representative cerebellar nuclei neurons recorded in each mutant mouse model. Left: example cell from Car8wdl/wdl mouse with complex phenotype including severe tremor. Right: example cell from Car8wdl/wdl mouse with complex phenotype treated with propranolol to treat tremor. (B) Histograms of instantaneous firing rate (ISI–1) of the full 30 s spike train of the example cells in (A). We indicate the firing rate (spikes/s), median ISI–1, skewness, and ISI>25. (C) Proportion of predicted spike signatures in each of the mouse models. (D, E) Scatterplot of spike train parameters used to classify neural signatures. Colored boxes indicate the predicted phenotype, colors of circles indicate the origin of the recorded neurons. Control: n = 14 cells, N = 4 mice; Car8wdl/wdl: n = 13, N = 6; Car8wdl/wdl + propranolol: n = 15, N = 6. (C–E) are based on the classifier model in Figure 1D.
-
Figure 4—source data 1
Source data for the graphs in Figure 4.
- https://cdn.elifesciences.org/articles/91483/elife-91483-fig4-data1-v1.xlsx
Figure 5 with 2 supplements
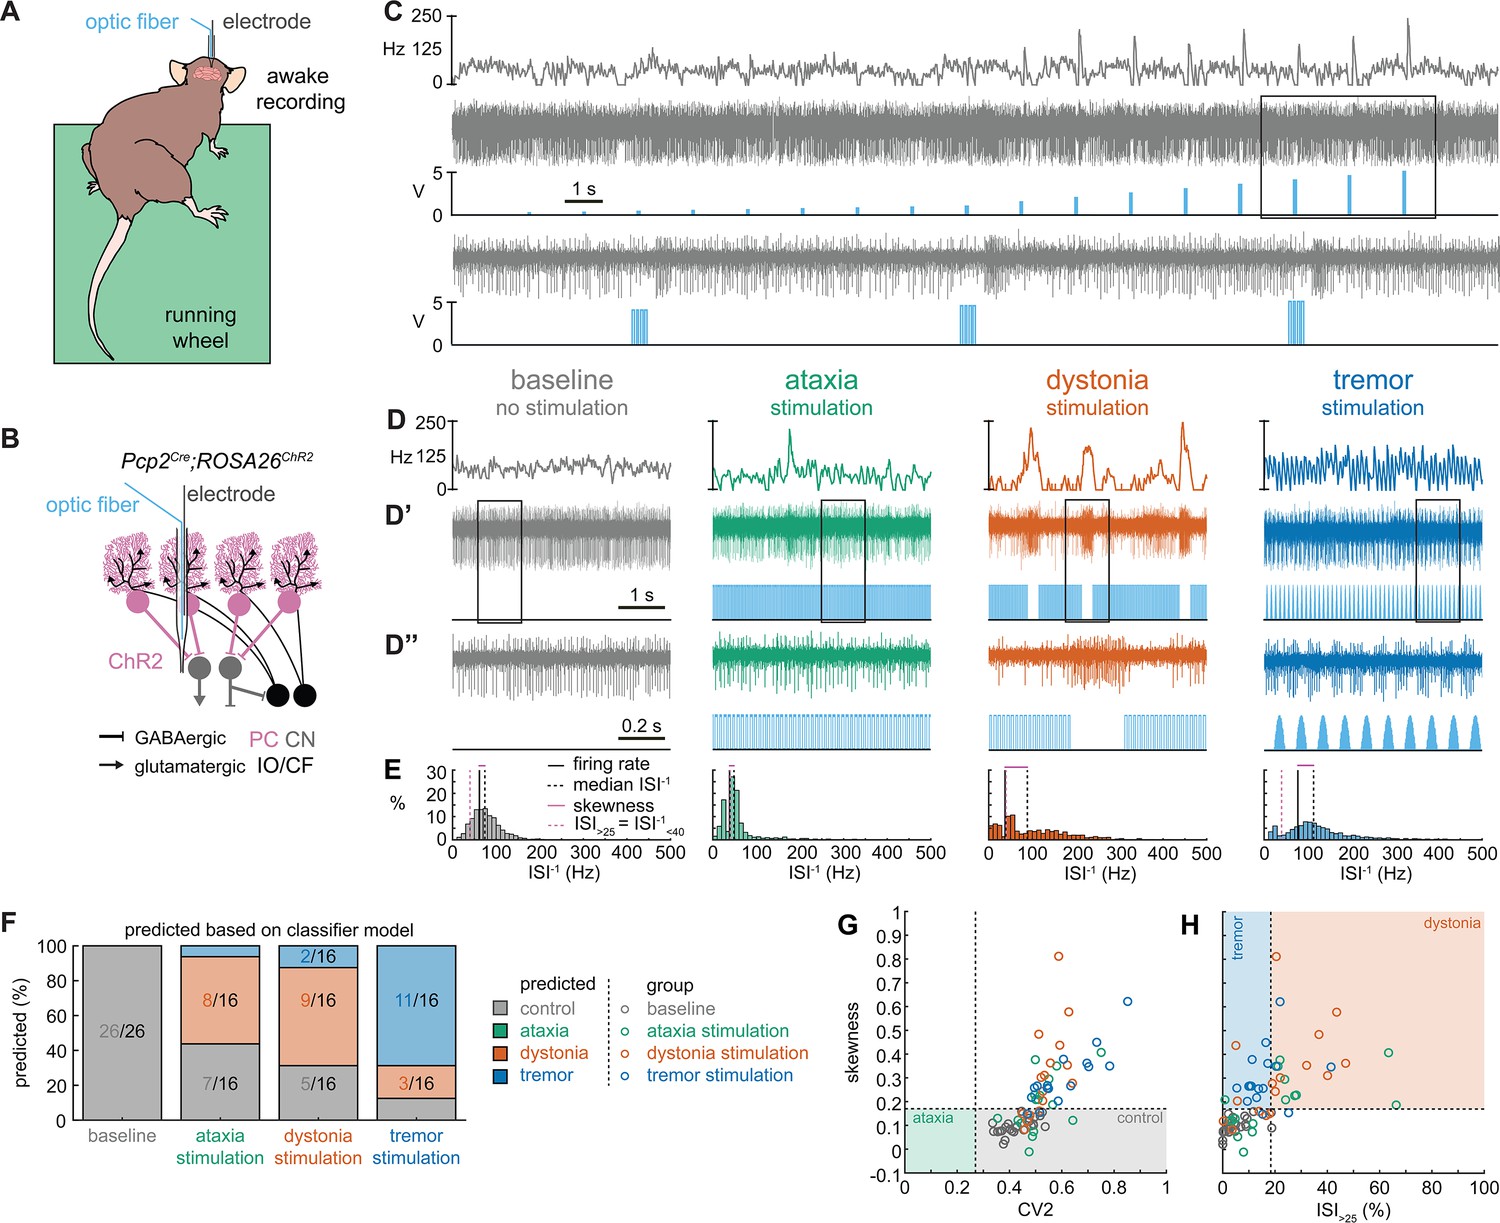
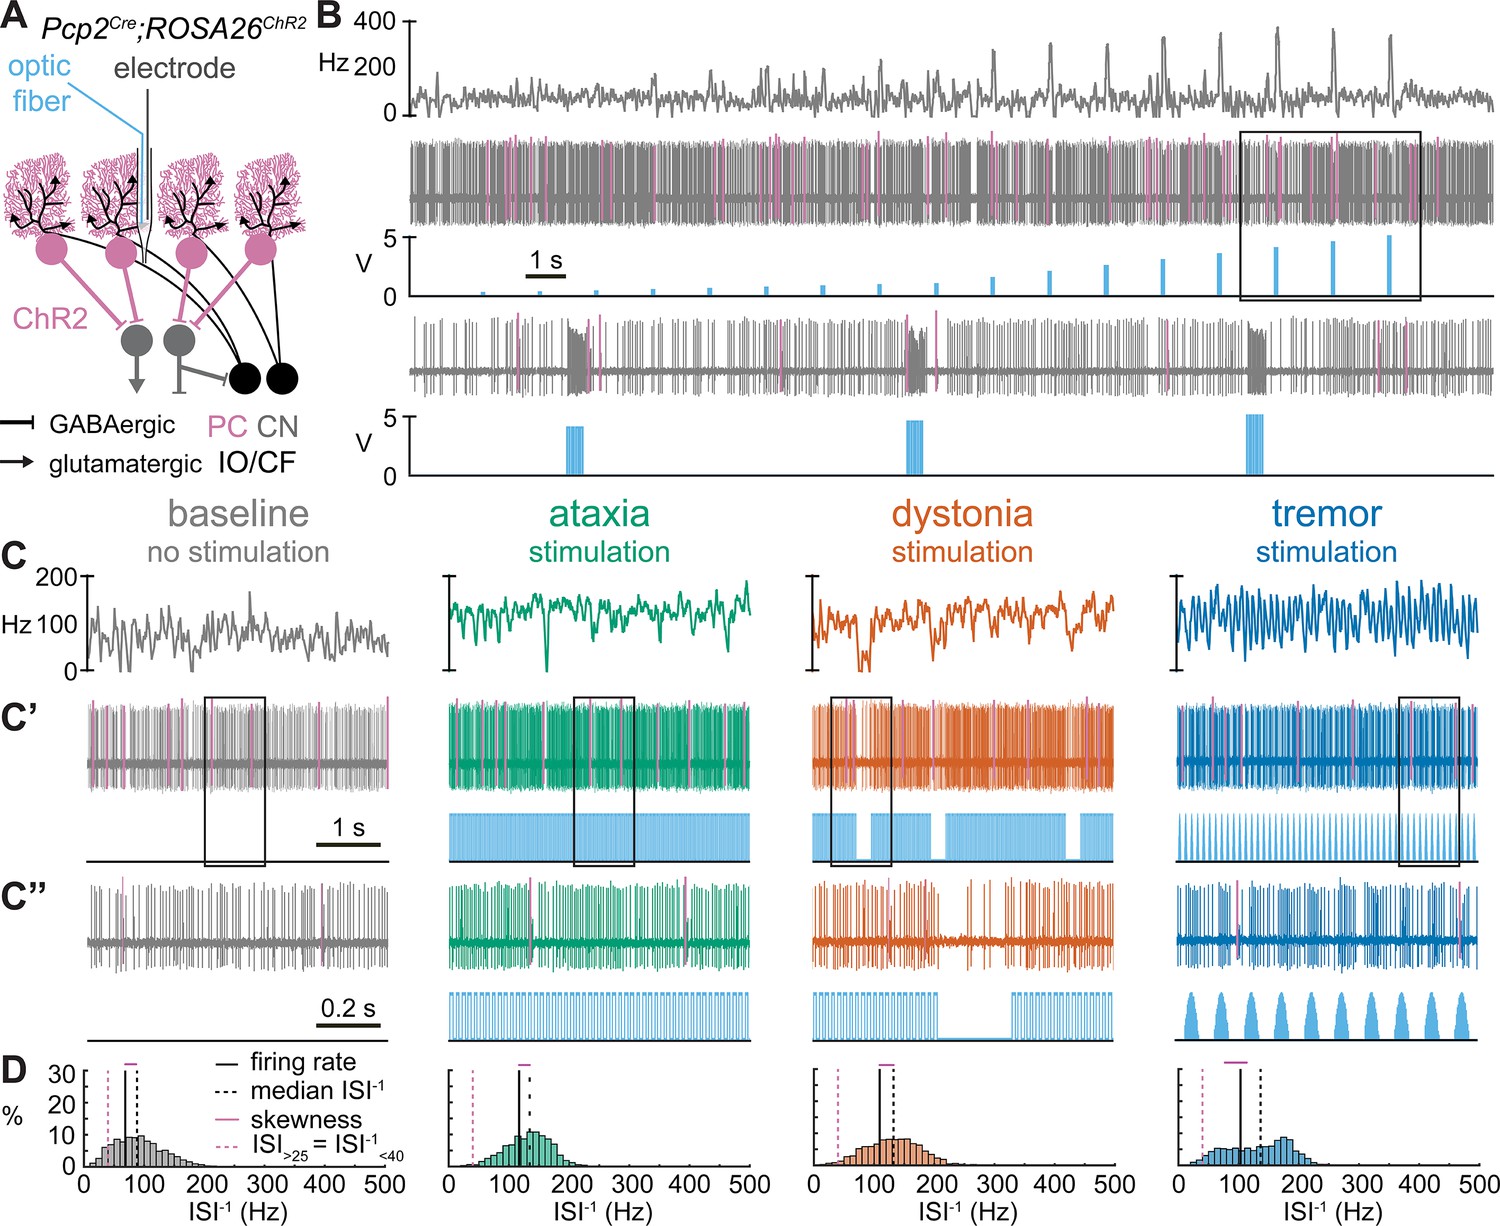
Spike signatures in cerebellar nuclei neurons can be induced by specific stimulation paradigms of Purkinje cells.
(A) Schematic of experimental setup with recordings in awake, head-fixed mice. (B) Optopatcher recordings of cerebellar nuclei neurons. The opsin is expressed in Purkinje cells (pink) and recordings of nuclei neurons are performed. PC = Purkinje cell; CN = cerebellar nuclei; IO/CF = inferior olive/climbing fiber. (C) Example validation that light stimulation of inhibitory Purkinje cells (blue bars) inhibits nuclei neurons during light stimulation. The lower trace is a blown-up view of the boxed area in the upper trace. (D) Example of spike firing rate averaged over previous 50 ms at each occurring spike for the 5 s spike train in (D’). (D’’) 1 s spike train for the duration indicated in the square box in (D’). Blue bars indicate light stimulation and are specific for ataxia, dystonia, and tremor (see ‘Materials and methods’ for light stimulation parameters). All example traces originate from the same nuclei neuron, indicating that the cell’s spike signature can change depending on the light stimulation paradigm. (E) Histograms of instantaneous firing rate (ISI–1) of the full 30 s spike train, observe the shift in distribution from baseline during the different stimulation paradigms. (F) Proportion of cells of each predicted spike signature during each of the light stimulations based on classifier model in Figure 1D. Control: n = 26 cells, N = 7 mice; ataxia: n = 16, N = 6; dystonia: n = 16, N = 5; tremor n = 16, N = 5. (G, H) Scatterplot of spike train parameters used to classify neural signatures. Colored boxes indicate the predicted phenotype, colors of circles indicate the origin of the recorded neurons.
-
Figure 5—source data 1
Source data for the graphs in Figure 5.
- https://cdn.elifesciences.org/articles/91483/elife-91483-fig5-data1-v1.xlsx
Figure 5—figure supplement 1
Purkinje cells respond differently to specific optogenetic stimulation paradigms.
(A) Schematic representation of optopatcher recordings of a Purkinje cell. The opsin is expressed in Purkinje cells (pink). (B) Example validation that light stimulation (blue bars) excites Purkinje cells. The pink lines indicate climbing fiber induced complex spikes, further confirming that these recordings are from a Purkinje cell. The lower trace is a blown-up view of the boxed area in the upper trace. (C) Example of spike firing rate averaged over previous 50 ms at each occurring spike for 5 s spike train in (C’). (C’’) 1 s spike train for the duration indicated in the square box in (C’). Blue bars indicate light stimulation and are specific for ataxia, dystonia, and tremor (see ‘Materials and methods’ for light stimulation parameters). (D) Histograms of instantaneous firing rate (ISI–1) of the full 30 s spike train of the example cells in (C) All example traces originate from the same Purkinje neuron, indicating that the cell’s spike signature can change depending on the light stimulation paradigm. PC = Purkinje cell; CN = cerebellar nuclei; IO/CF = inferior olive/climbing fiber. Representative recording for n = 7 cells, N = 5 mice.
Figure 5—figure supplement 2
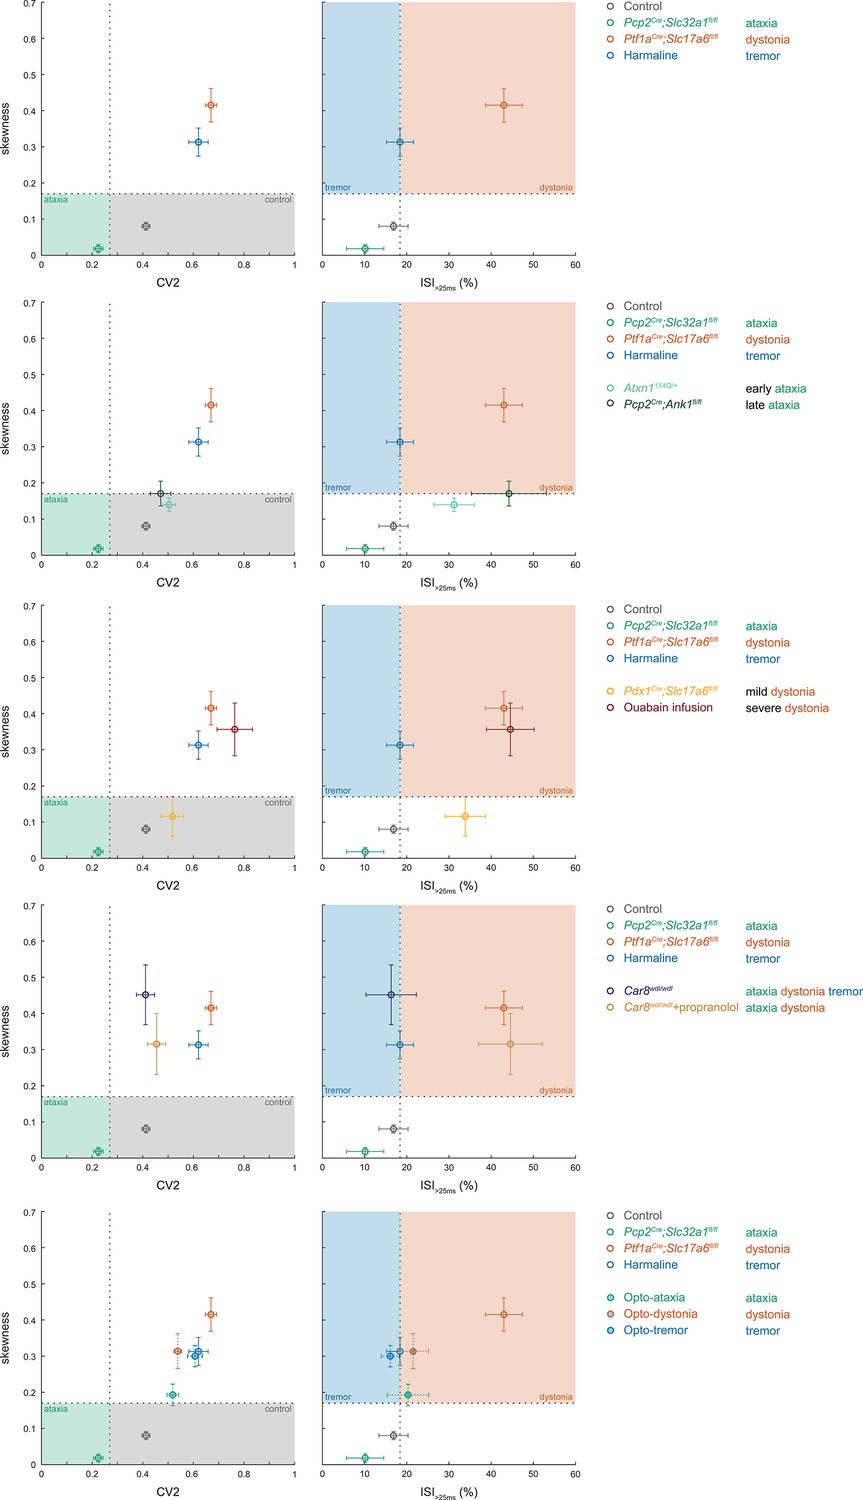
Comparison of group averages per figure.
Scatterplots of spike train parameters used to classify neural signatures arranged from top to bottom to represent the averages of the groups plotted in Figures 1—5, respectively. Each graph replots the archetypal group averages for reference. Colored boxes indicate the predicted phenotype, colors of circles indicate the origin of the recorded neurons.
Figure 6
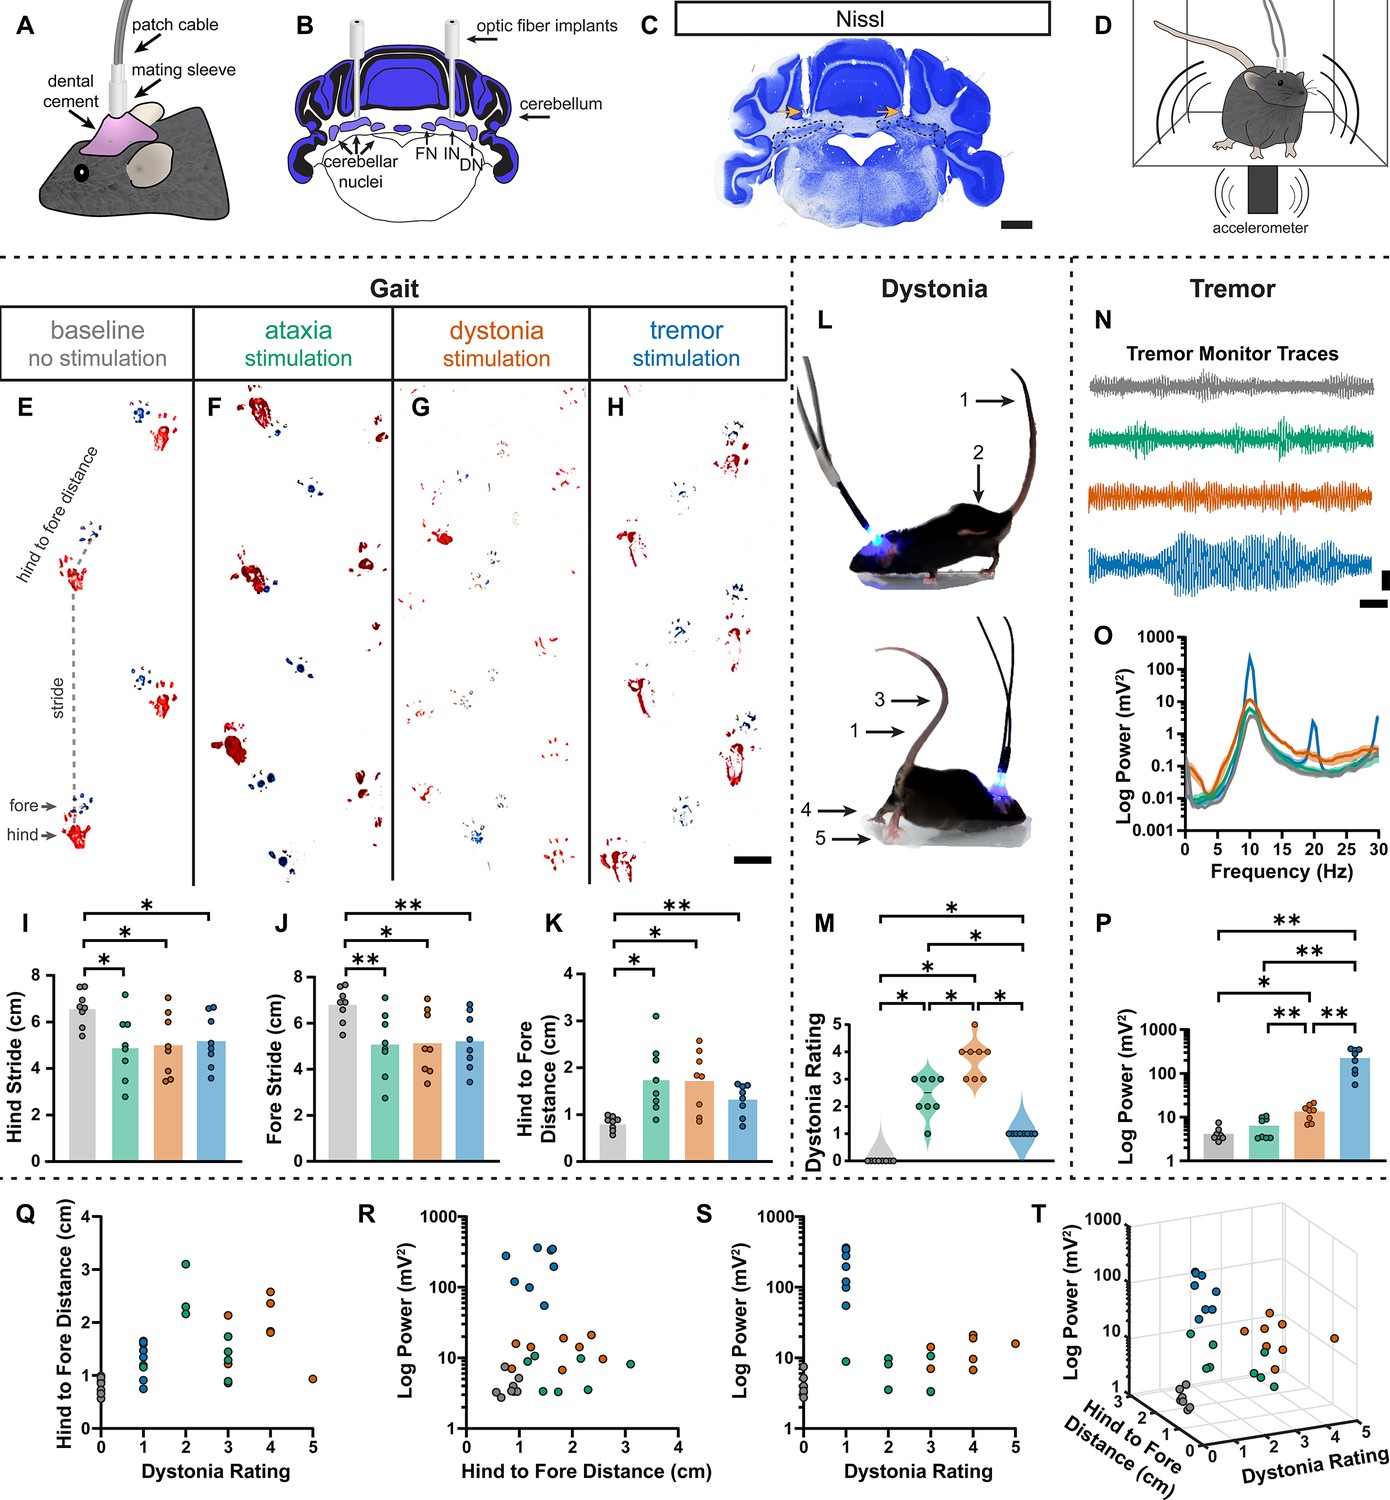
Induced spike signatures elicit distinct cerebellar phenotypes.
(A) Schematic of external view of bilateral optical fiber implant. (B) Schematic of a coronal section from a mouse cerebellum with bilateral optic fiber implants directed towards the cerebellar nuclei. FN = fastigial nucleus; IN = interposed nucleus; DN = dentate nucleus. (C) Photomicrograph of a Nissl-stained coronal section from a mouse cerebellum that had been implanted with optic fibers. Arrows = optic fiber tracks. Dotted lines surround the cerebellar nuclei indicated in (B). Scale = 1 cm. (D) Schematic of a mouse with bilateral optic fiber implants freely moving in a tremor monitor. (E–K) Data associated with gait measurements. (E–H) Example footprints from a single mouse before stimulation (baseline, E) and during ataxia (F), dystonia (G), and tremor stimulation (H). Scale = 1 cm. (I–K) Measurements of gait including the length of the hindpaw stride (I), forepaw stride (J), and distance between the hind and forepaws (K). N = 8 mice. * = p≤0.05; ** = p≤0.01. (L) Example images of phenotypes associated with dystonia. 1 = erect tail; 2 = high stepping; 3 = kinked tail; 4 = hyperextension of the limbs; 5 = splayed toes. (M) Dystonia rating of mice before stimulation and during stimulation with each paradigm. N = 8 mice. * = p≤0.05. (N) Tremor signals detected via tremor monitor from a mouse before and during stimulation with each paradigm. Horizontal scale = 1 s. Vertical scale = 50 mV. (O) Population average power spectrums of tremor. Solid line = mean power. Shaded region = SEM. (P) Peak tremor power of mice before and during stimulation with each paradigm. N = 8 mice. * = p≤0.05; ** = p≤0.01. (Q–S) 2-dimensional comparisons of gait (hind to fore distance), dystonia (rating), and tremor (peak power) measurements from all mice. N = 8 mice. (T) 3-dimensional plot of data in (Q–S).
-
Figure 6—source data 1
Source data for the graphs in Figure 6.
- https://cdn.elifesciences.org/articles/91483/elife-91483-fig6-data1-v1.xlsx
Videos
Video 1
Examples of freely moving mouse behavior in a control mouse, an ataxic mouse, a dystonic mouse, and a tremoring mouse.
Video 2
Optogenetically induced behavioral responses in head-fixed mice.
Subtle features of ataxia, dystonia, and tremor can be induced in head-fixed mice by initiating each specific spike signature. In this experiment, the optopatcher recording and stimulation allowed for tracking the inductions of spike signatures in single units and the subsequent presentation of the disease-associated behaviors. In this video, we show behavioral responses to all stimulation paradigms with their paired recordings of spike activity. All responses and paired spike recordings were from a single recording of the same cell and mouse. Voltage of the spike trace is played as audio.
Video 3
Optogenetically induced spike signatures result in severe cerebellar phenotypes.
Examples of a single freely moving mouse’s behavior at baseline and in response to bilateral induction of spike signatures.
Video 4
Optogenetically induced spike signatures affect gait.
Examples of a single mouse’s gait within a footprinting corridor at baseline and in response to bilateral induction of spike signatures.
Tables
Key resources table
| Reagent type (species) or resource | Designation | Source or reference | Identifiers | Additional information |
|---|---|---|---|---|
| Strain, strain background (Mus musculus, female and male) | Pcp2Cre | Lewis et al., 2004; DOI:10.1016/j.ydbio.2004.03.007 | ||
| Strain, strain background (M. musculus, female and male) | Ptf1aCre | Kawaguchi et al., 2002; DOI:10.1038/ng959 | ||
| Strain, strain background (M. musculus, female and male) | Slc32a1fl | JAX | #012897 | |
| Strain, strain background (M. musculus, female and male) | Slc17a6fl | JAX | #012898 | |
| Strain, strain background (M. musculus, female and male) | Pdx1Cre | Gu et al., 2002; DOI:10.1242/dev.129.10.2447 | ||
| Strain, strain background (M. musculus, female and male) | Car8wdl/wdl | JAX | #004625 | |
| Strain, strain background (M. musculus, female and male) | Atxn1154Q | JAX | #005601 | |
| Strain, strain background (M. musculus, female and male) | Ank1fl | JAX | #036512 | |
| Strain, strain background (M. musculus, female and male) | Rosa26lsl-ChR2-eYFP | JAX | #024109 | |
| Chemical compound, drug | Harmaline | Sigma-Aldrich | #H1392 | 30 mg/kg |
| Chemical compound, drug | 2,2,2-Tribromoethanol | Sigma-Aldrich | #T48402 | |
| Software, algorithm | Spike2 | CED | RRID:SCR_000903 | |
| Software, algorithm | MATLAB | MathWorks | RRID:SCR_001622 | |
| Software, algorithm | GraphPad Prism | GraphPad Software | RRID:SCR_002798 | |
| Software, algorithm | Photoshop | Adobe | RRID:SCR_014199 | |
| Software, algorithm | Illustrator | Adobe | RRID:SCR_010279 | |
| Software, algorithm | Leica Application Suite X (LAS X) | Leica Microsystems | RRID:SCR_013673 | |
| Other | Tissue-Tek O.C.T. Compound | VWR | #25608-930 | Specimen embedding compound for cryostat sectioning |
| Other | Cresyl violet acetate 0.1% aqueous | Electron Microscopy Sciences | #26089-01 | Tissue staining solution |
| Other | Cytoseal XYL | Electron Microscopy Sciences | #18009 | Mounting media |
Additional files
-
Supplementary file 1
Validation of mouse models of motor disorders.
Each model used in this article is listed in the table with the type of model, that is, the predominant phenotype reported for the model, motor behaviors that have been quantified relative to control animals (effect direction is noted when difference is statistically significant), and anatomical changes associated with the model. Only congruent and/or undisputed findings in mice are included. Abbreviations used: Purkinje cell (PC), vesicular GABA transporter (Slc32a1), immunohistochemistry (IHC), wheat germ agglutinin (WGA), tyrosine hydroxylase (TH), vesicular glutamate transporter 2 (Slc17a6), inferior olive (IO), electromyography (EMG), cerebellar nuclei (CN), spinocerebellar ataxia type 1 (SCA1), carbonic anhydrase-related protein 8 (Car8), granule cell (GC), climbing fiber (CF), mossy fiber (MF), lateral hypothalamus (LH), and not available (NA).
- https://cdn.elifesciences.org/articles/91483/elife-91483-supp1-v1.docx
-
MDAR checklist
- https://cdn.elifesciences.org/articles/91483/elife-91483-mdarchecklist1-v1.docx
Download links
A two-part list of links to download the article, or parts of the article, in various formats.
Downloads (link to download the article as PDF)
Open citations (links to open the citations from this article in various online reference manager services)
Cite this article (links to download the citations from this article in formats compatible with various reference manager tools)
Cerebellar nuclei cells produce distinct pathogenic spike signatures in mouse models of ataxia, dystonia, and tremor
eLife 12:RP91483.
https://doi.org/10.7554/eLife.91483.3


