Scaling between cell cycle duration and wing growth is regulated by Fat-Dachsous signaling in Drosophila
- Department of Molecular Biosciences, Northwestern University, United States
- NSF-Simons Center for Quantitative Biology, Northwestern University, United States
- NSF-Simons National Institute for Theory and Mathematics in Biology, United States
Figures
Figure 1 with 5 supplements
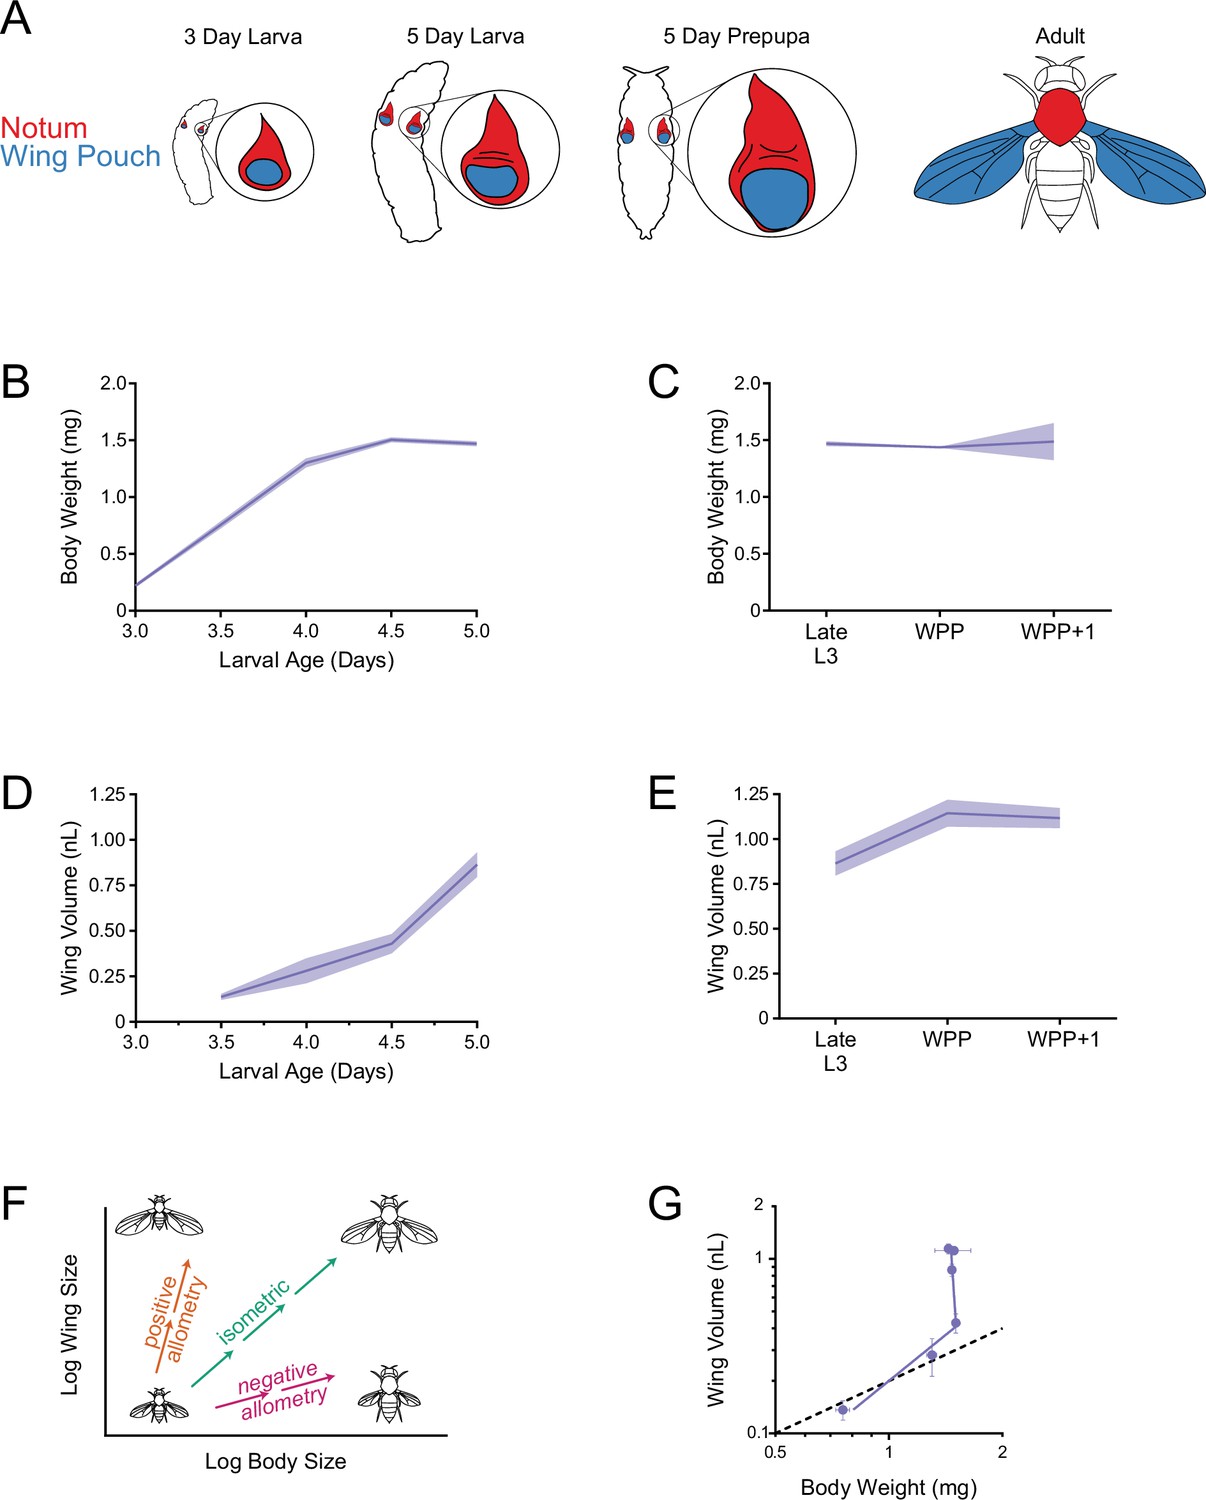
Allometric growth of the third instar wing pouch in Drosophila.
(A) Schematic depicting relative size of the wing imaginal discs inside a larva starting from 3 days after egg laying (AEL). The wing pouch (blue) begins everting during the larva-pupa transition and eventually becomes the adult wing blade. The notum and hinge (red) surrounding the wing pouch becomes the wing hinge and notum of the adult. (B) Wet-weight of third instar larvae as a function of age measured every 12 hr. Lines connect average weight measurements, and the shaded region denotes the standard error of the mean. (C) At 5 days AEL, the larva-pupa transition begins. Wet-weight of wildtype animals at early pupariation stages. Lines connect average weight measurements, and the shaded region denotes the standard error of the mean. WPP + 1 denotes 1 hr after white prepupae (WPP) stage onset. (D) Volume of the wing pouch as a function of age. Lines connect average volume measurements and the shaded region denotes the standard error of the mean. (E) Volume of wing pouch at early pupariation stages. Lines connect average volume measurements and the shaded region denotes the standard error of the mean. (F) Schematic depicting isometric growth (green arrow) where growth rates of the organ (wing) and the body are the same, positive allometric growth (orange arrow) where the organ is growing faster than the body, and negative allometric growth (magenta arrow) where the organ is growing slower than the body. (G) Allometric growth relationship during third instar between the wing pouch and body weight. Dashed line depicts the trajectory for an isometric growth curve. Error bars denote standard error of the mean.
Figure 1—figure supplement 1

Measured volume of individuals correlates with measured weight throughout the third instar larval and WPP stages.
Since the weight of 1 µL water is 1 mg, the wet weight predicted by volume measurements is close to the measured weight. The strong correlation is independent of age and genotype of measured individuals. Genotypes listed are described later in the Results.
Figure 1—figure supplement 2

Strategy for segmenting the third instar wing pouch.
(A) Schematic depicting a late third instar wing disc. The perspective is an apical or top-down view of the disc. (B) Saggital or side view of the wing disc. The columnar epithelium of the disc proper is highly folded. Blue and red lines denote the apical surface of the wing pouch and hinge/notum domains of the disc proper epithelium, respectively, while black lines denote the basal domain of the epithelium. The disc proper is continuous with a squamous epithelium called the peripodial membrane (purple). The box outlines the wing pouch and neighboring hinge-notum tissue. The z-stack that encompasses this box is computationally split into two at the plane labelled with the dotted line, which is located at the outer crease of the fold. The two resulting z-stacks are then separately processed using ImSAnE. The leftmost z-stack comprises the apical region of the wing pouch as shown in (A). The rightmost z-stack comprises the folded region of the wing pouch and hinge/notum as shown in (C). ImSAnE is then used to remove the hinge-notum signal (red) along the inner crease of the fold. The remaining pouch signal is analyzed. (C) Schematic depicting the surface of the wing pouch within folds of an older wing disc. The everting wing pouch results in a portion of the dorsal and a majority of the ventral compartment being folded underneath itself.
Figure 1—figure supplement 3
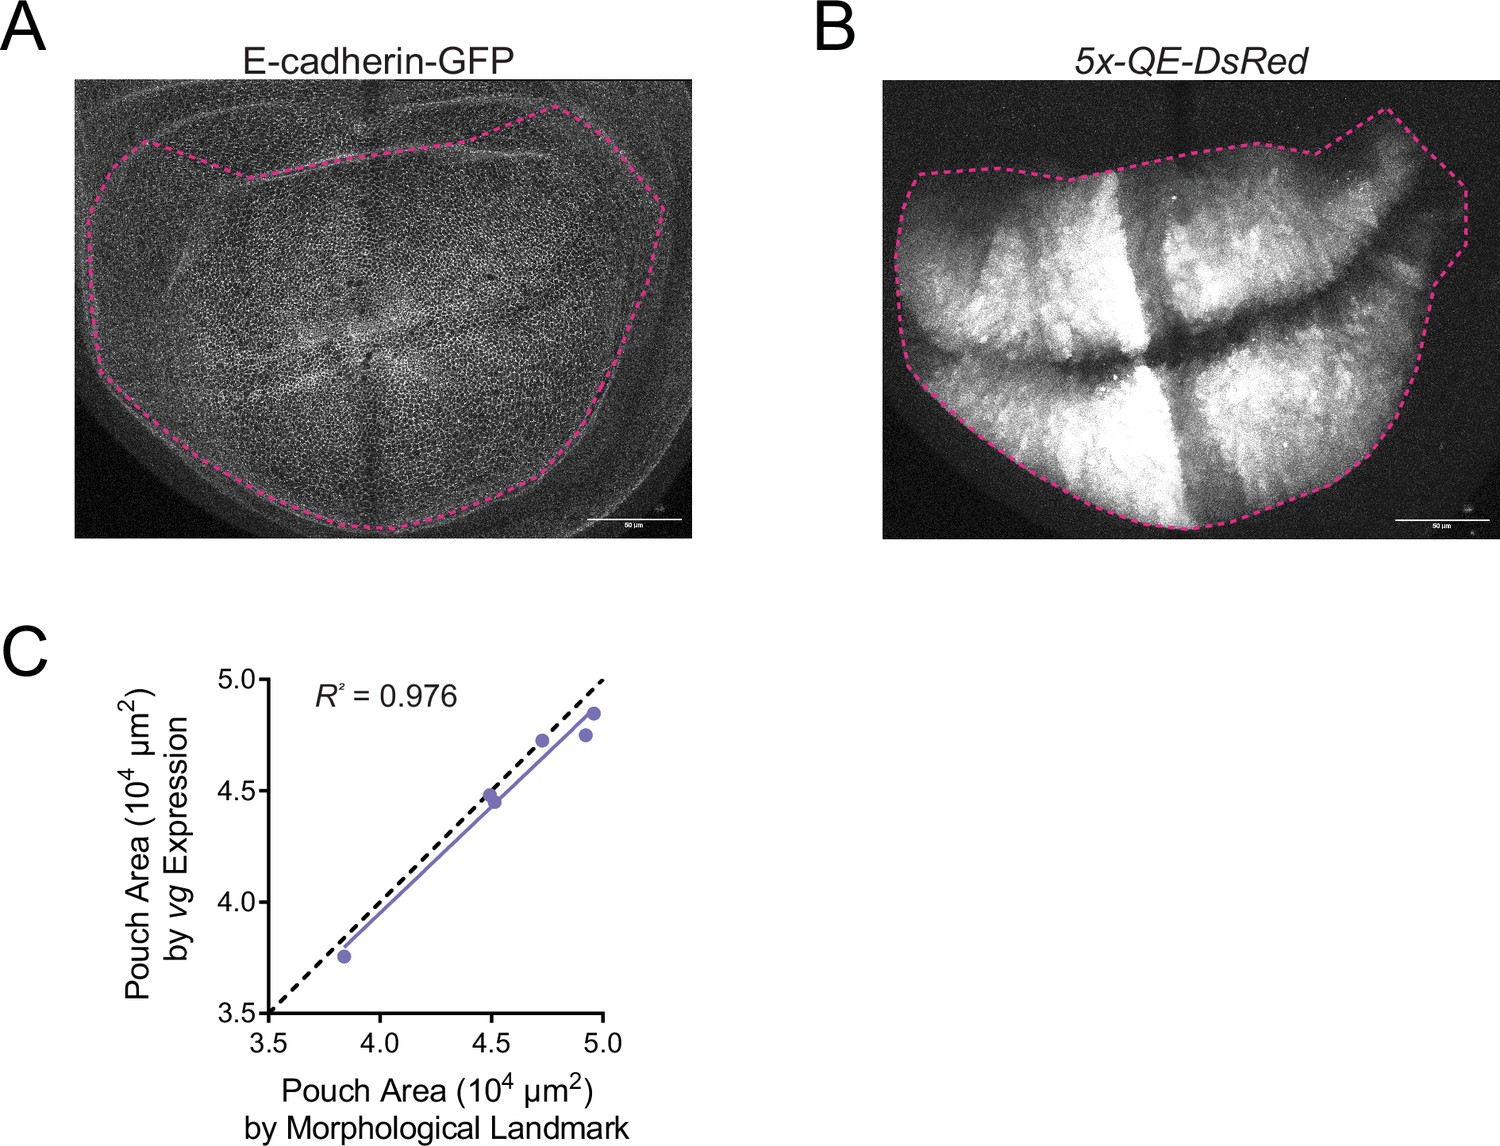
Validation of method in defining the wing pouch boundary.
(A) Confocal image of E-cadherin-GFP in a wing disc, which displays folds in the epithelium as morphological landmarks that define the wing pouch. In magenta is the marked wing pouch boundary. (B) Confocal image of wing disc expression of the vestigial gene reporter 5x-QE-dsRed, which is specifically expressed in the wing pouch. In magenta is the marked wing pouch boundary. (C) Comparison of wing pouch area measured in third instar larval wing discs using the two methods. Dotted line shows outcome if both methods were in perfect agreement (slope = 1.0000). Linear regression of the measurement data shows the two methods are in strong agreement (slope = 0.9554).
Figure 1—figure supplement 4
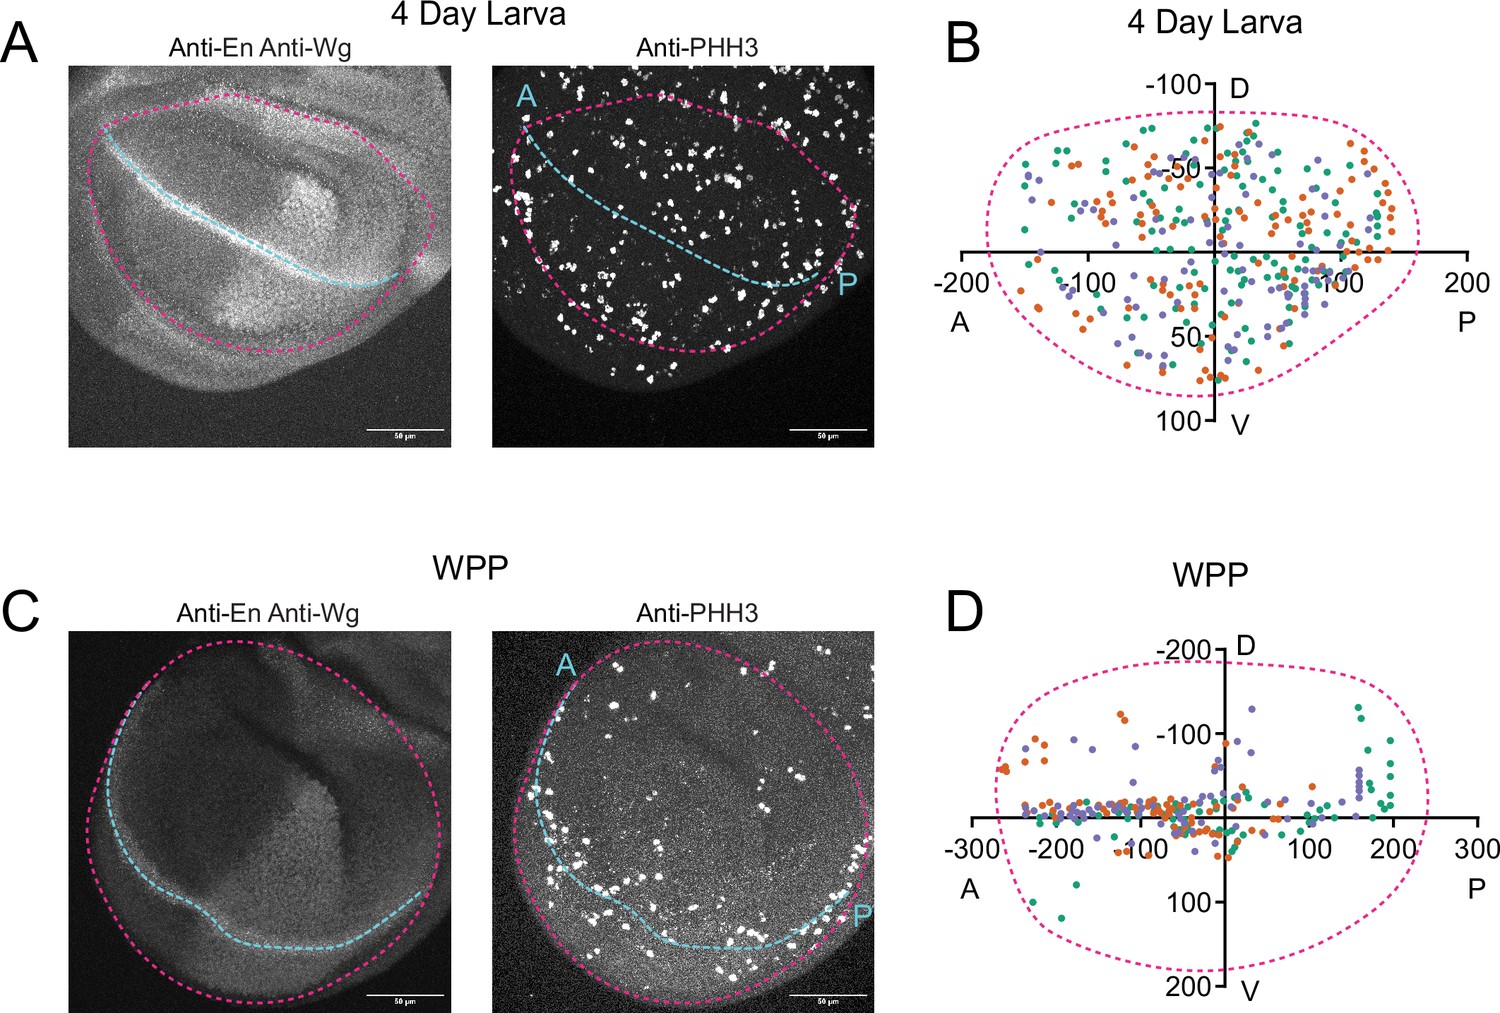
Pattern of cell proliferation in the wing pouch as it ages.
(A) Confocal image of a 4-day-old larval wing pouch stained with anti-En and anti-Wg on the left and anti-PHH3 on the right. Wg and En label the AP and DV axes, respectively. The pouch boundary is highlighted with a magenta dashed line while the AP axis is illustrated with cyan dashed line. Scale bar is 50 µm. (B) Centroid positions of PHH3-positive nuclei in the 4-day-old larval wing pouch are plotted to show the distribution of cell divisions in the wing pouch. Three wing replicates are shown in different colors. Magenta dashed line illustrates a typical wing pouch. (C) Confocal image of a WPP wing pouch stained with anti-En and anti-Wg on the left and anti-PHH3 on the right. The pouch boundary is highlighted with a magenta dashed line while the AP axis is illustrated with cyan dashed line. Scale bar is 50 µm. (D) Centroid positions of PHH3-positive nuclei in the WPP wing pouch are plotted to show the distribution of cell divisions in the wing pouch. Three wing replicates are shown in different colors. Magenta dashed line illustrates a typical wing pouch. Note the concentration of dividing cells along the AP axis of symmetry, where sensory organ precursor cells are dividing.
Figure 1—figure supplement 5
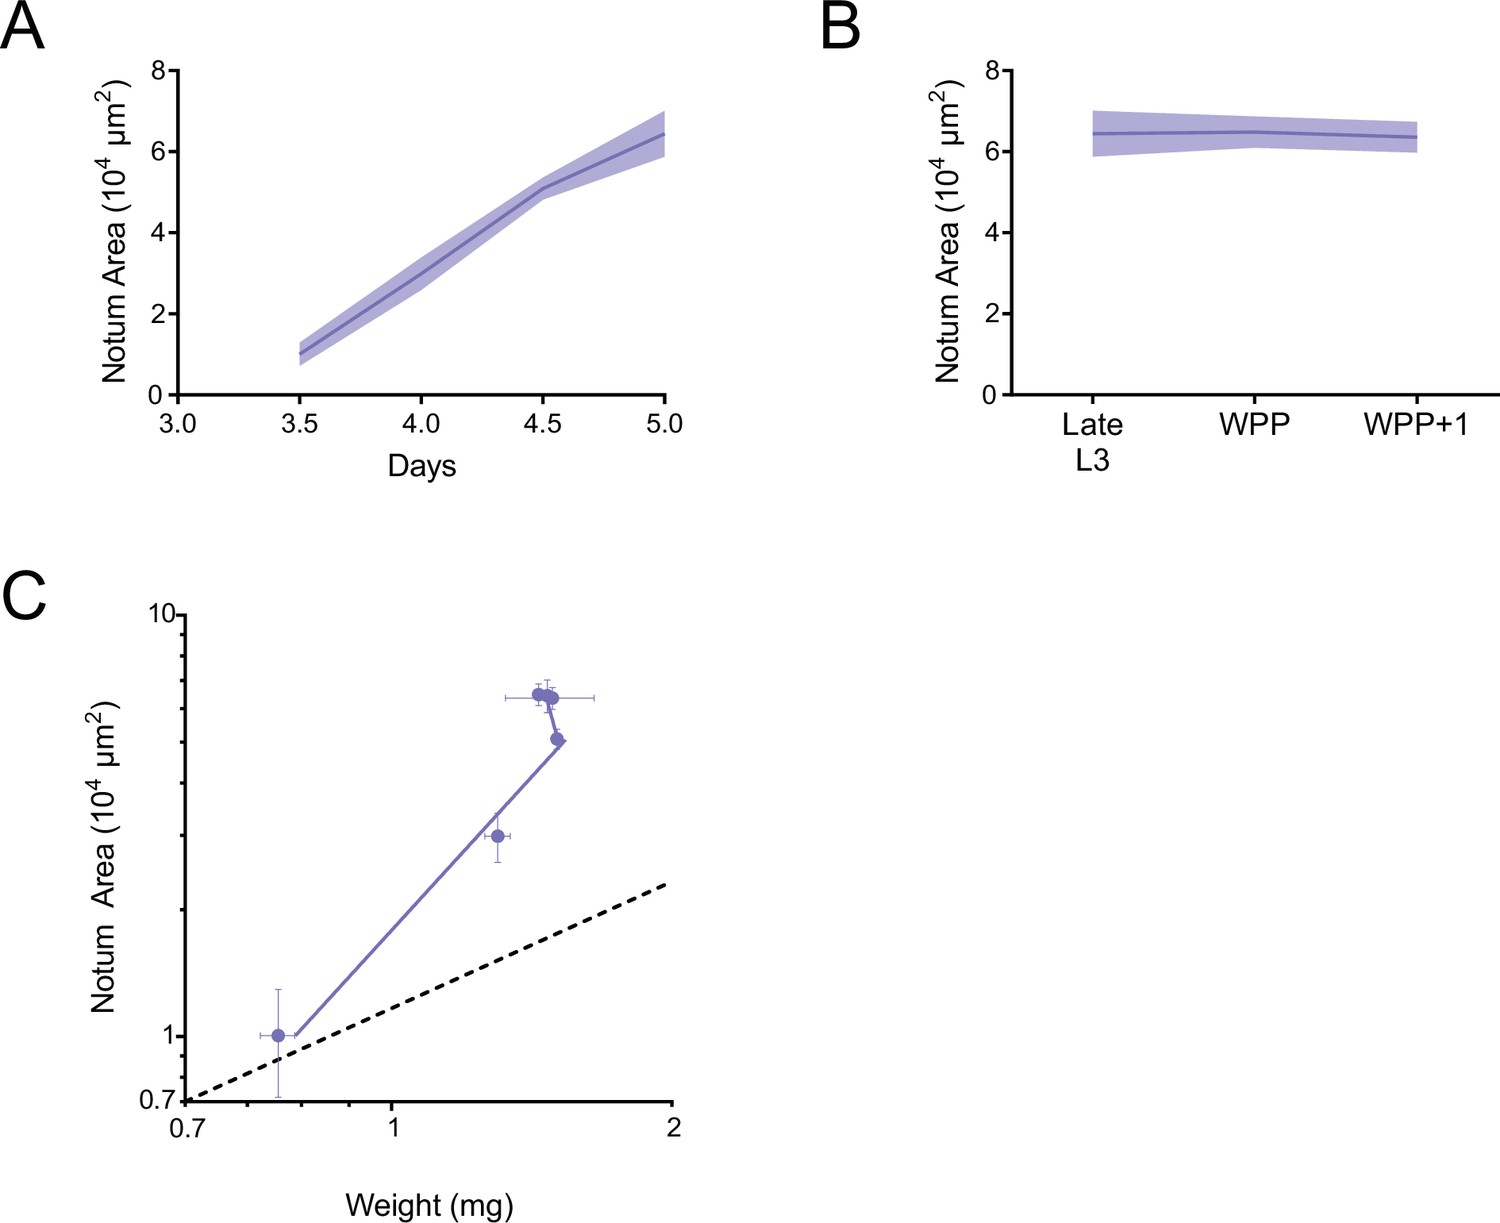
Allometric growth of the notum-hinge during third instar.
(A) Area of the larval notum-hinge as a function of larval age. Lines connect average area measurements, and the shaded region denotes the standard error of the mean. (B) Area of the notum-hinge at early pupariation stages. Lines connect average area measurements, and the shaded region denotes the standard error of the mean. (C) Allometric growth relationship of the notum-hinge versus body weight. Dashed line depicts the trajectory for an isometric growth curve. Error bars denote standard error of the mean.
Figure 2 with 3 supplements
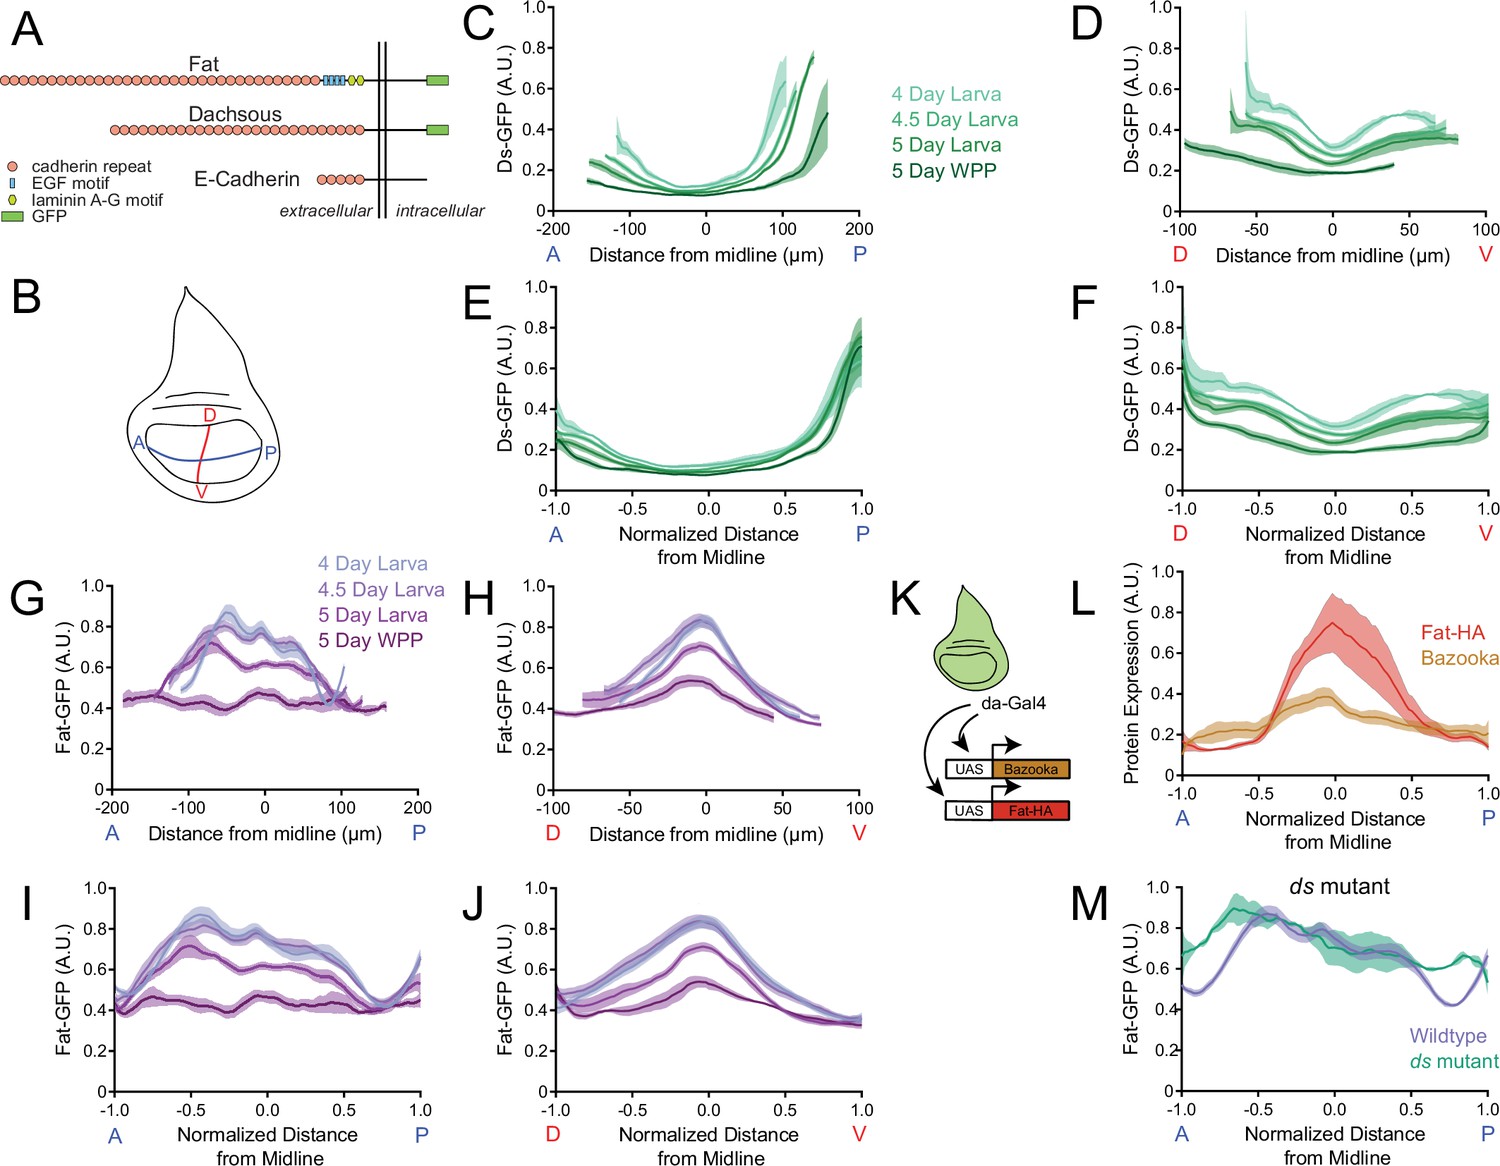
Dynamics of Ds and Fat protein distributions across the wing pouch during third instar.
(A) Schematic representation of E-cadherin, Fat and Ds protein structures, which are endogenously tagged with GFP at the C-terminus. Adapted from Tanoue and Takeichi, 2005. (B) Schematic of the wing disc depicting the anterior-posterior (AP, blue) and dorsal-ventral (DV, red) axes of symmetry. (C) Moving line average of Ds-GFP fluorescence as a function of position along the AP axis. Shown are profiles from wing pouches of different ages, as indicated. Shaded regions for each profile represent the standard error of the mean. (D) Moving line average of Ds-GFP fluorescence as a function of position along the DV axis. Shown are profiles from wing pouches of different ages, as indicated. Shaded regions for each profile represent the standard error of the mean. In the WPP, the pouch begins everting and only a portion of the ventral compartment is visible. (E) Moving line average of Ds-GFP fluorescence as a function of position along the AP axis normalized to the total distance of the axis. Shown are profiles from wing pouches of different ages, each normalized independently. (F) Moving line average of Ds-GFP fluorescence as a function of position along the DV axis normalized to the total distance of the axis. Shown are profiles from wing pouches of different ages, each normalized independently. (G) Moving line average of Fat-GFP fluorescence as a function of position along the AP axis. Shown are profiles from wing pouches of different ages, as indicated at right. Shaded regions for each profile represent the standard error of the mean. (H) Moving line average of Fat-GFP fluorescence as a function of position along the DV axis. Shown are profiles from wing pouches of different ages, as indicated at right. Shaded regions for each profile represent the standard error of the mean. (I) Moving line average of Fat-GFP fluorescence as a function of position along the AP axis normalized to the total distance of the axis. Shown are profiles from wing pouches of different ages, each normalized independently. (J) Moving line average of Fat-GFP fluorescence as a function of position along the DV axis normalized to the total distance of the axis. Shown are profiles from wing pouches of different ages, each normalized independently. (K) Schematic of the da-Gal4 driver, active everywhere in the wing disc, co-expressing UAS-fat-HA and the control reporter UAS-bazooka-mCherry. (L) Moving line averages of Fat-HA (red) and Bazooka-mCherry (brown) fluorescence along the normalized AP axis in third instar larval wing pouches. Shaded regions for each profile represent the standard error of the mean. (M) Moving line average of Fat-GFP fluorescence along the normalized AP axis of wildtype and ds33k/UAO71 mutant wing pouches from 4-day-old larvae. Shaded regions for each profile represent the standard error of the mean.
Figure 2—figure supplement 1
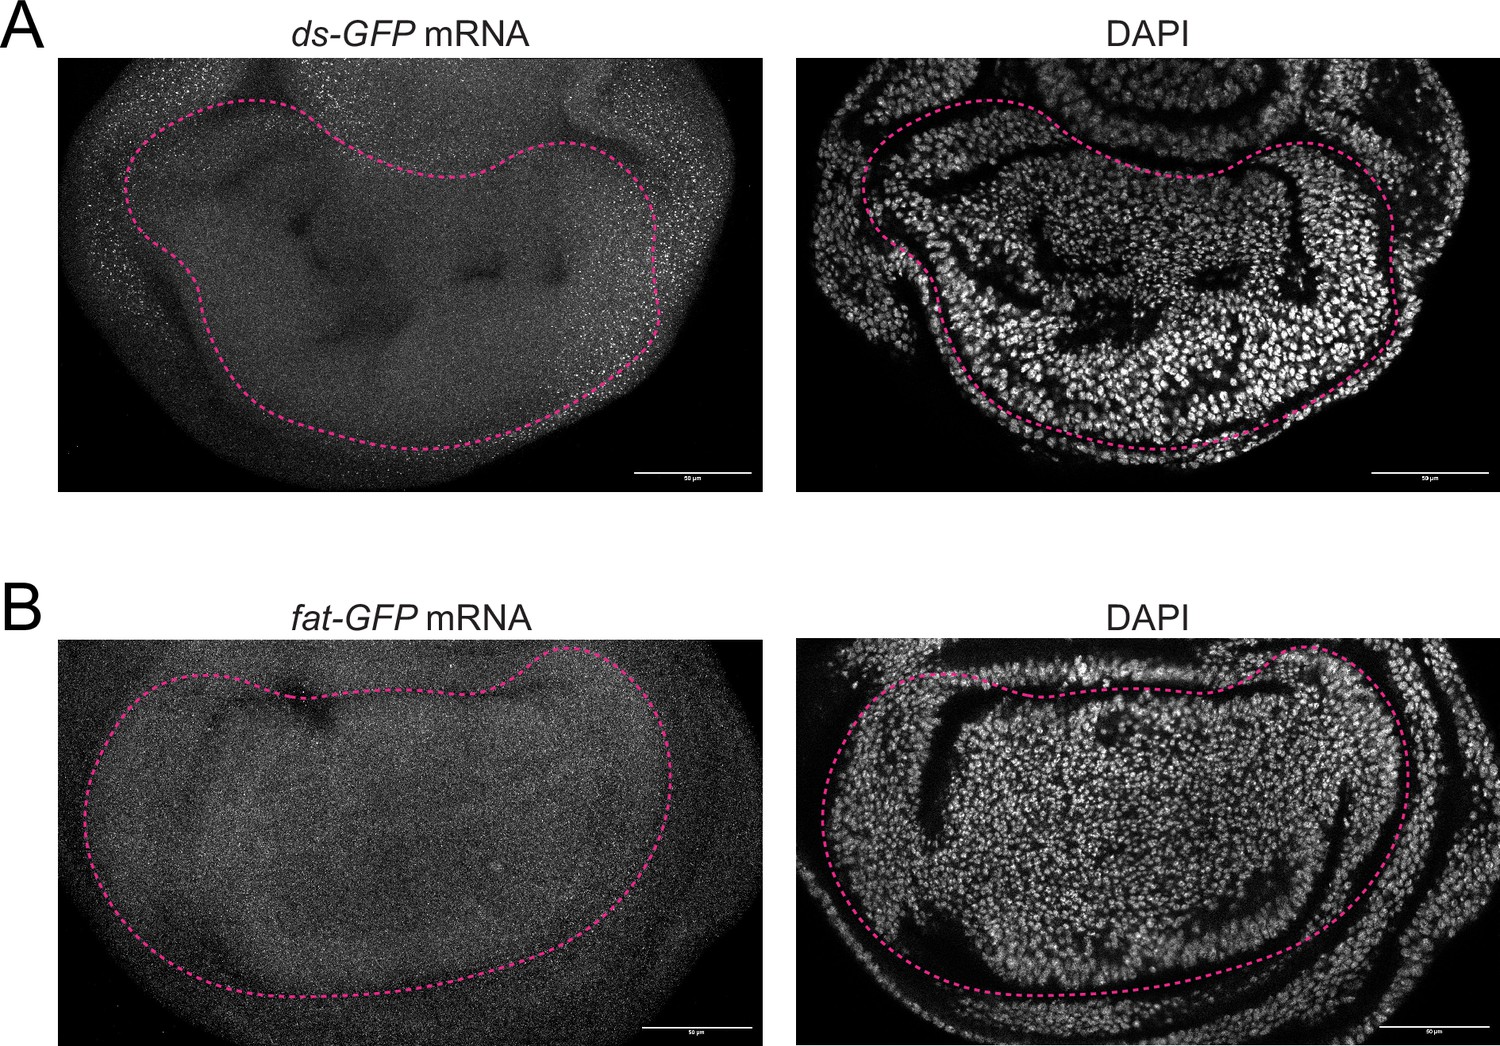
smFISH images of fat and ds expression in the third instar wing pouch.
(A) Confocal images of a ds-GFP third instar larval wing pouch stained for GFP mRNAs (left) and DAPI (right). Scale bar is 50 micrometers. (B) Confocal images of a fat-GFP third instar larval wing pouch stained for GFP mRNAs (left) and DAPI (right). Scale bar is 50 µm.
Figure 2—figure supplement 2
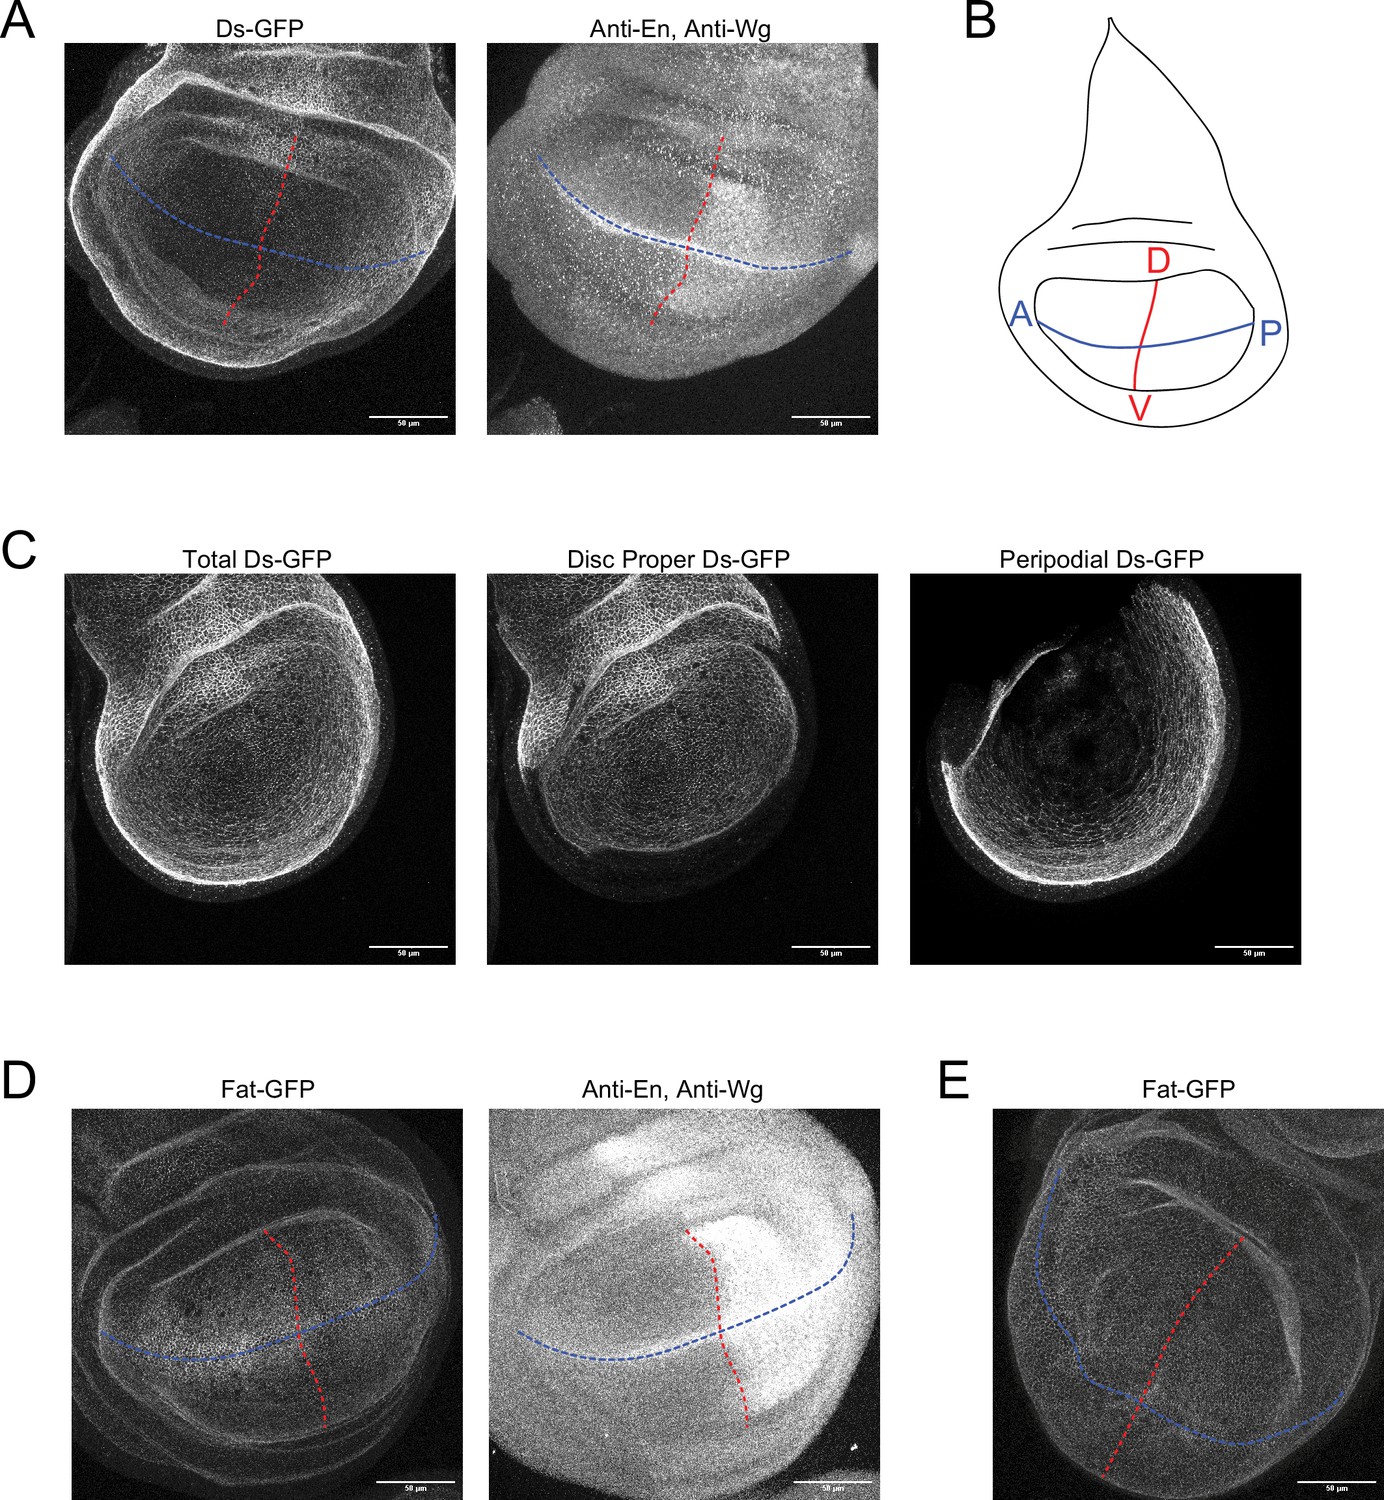
Methods to measure distributions of Ds-GFP and Fat-GFP.
(A) Confocal images of a ds-GFP third instar larval wing pouch showing GFP fluorescence (left) and staining of En and Wg proteins (right). Blue and red lines are the AP and DV axes of symmetry, respectively. Scale bar is 50 µm. (B) Schematic of the wing disc depicting the AP (blue) and DV (red) axes of symmetry. (C) Representative Ds-GFP fluorescence image in which fluorescence from cells in the disc proper has been computationally segregated from signal from the peripodial membrane. Left is a max projection of all sections. Middle is the surface projected signal from the disc proper. Right is the projected signal from the peripodial membrane. (D) Confocal images of a fat-GFP third instar larval wing pouch showing GFP fluorescence (left) and staining of En and Wg proteins (right). Blue and red lines are the AP and DV axes of symmetry, respectively. Scale bar is 50 µm. (F) Confocal image of a fat-GFP WPP wing pouch. Blue and red lines are the AP and DV axes of symmetry, respectively. Scale bar is 50 µm.
Figure 2—figure supplement 3
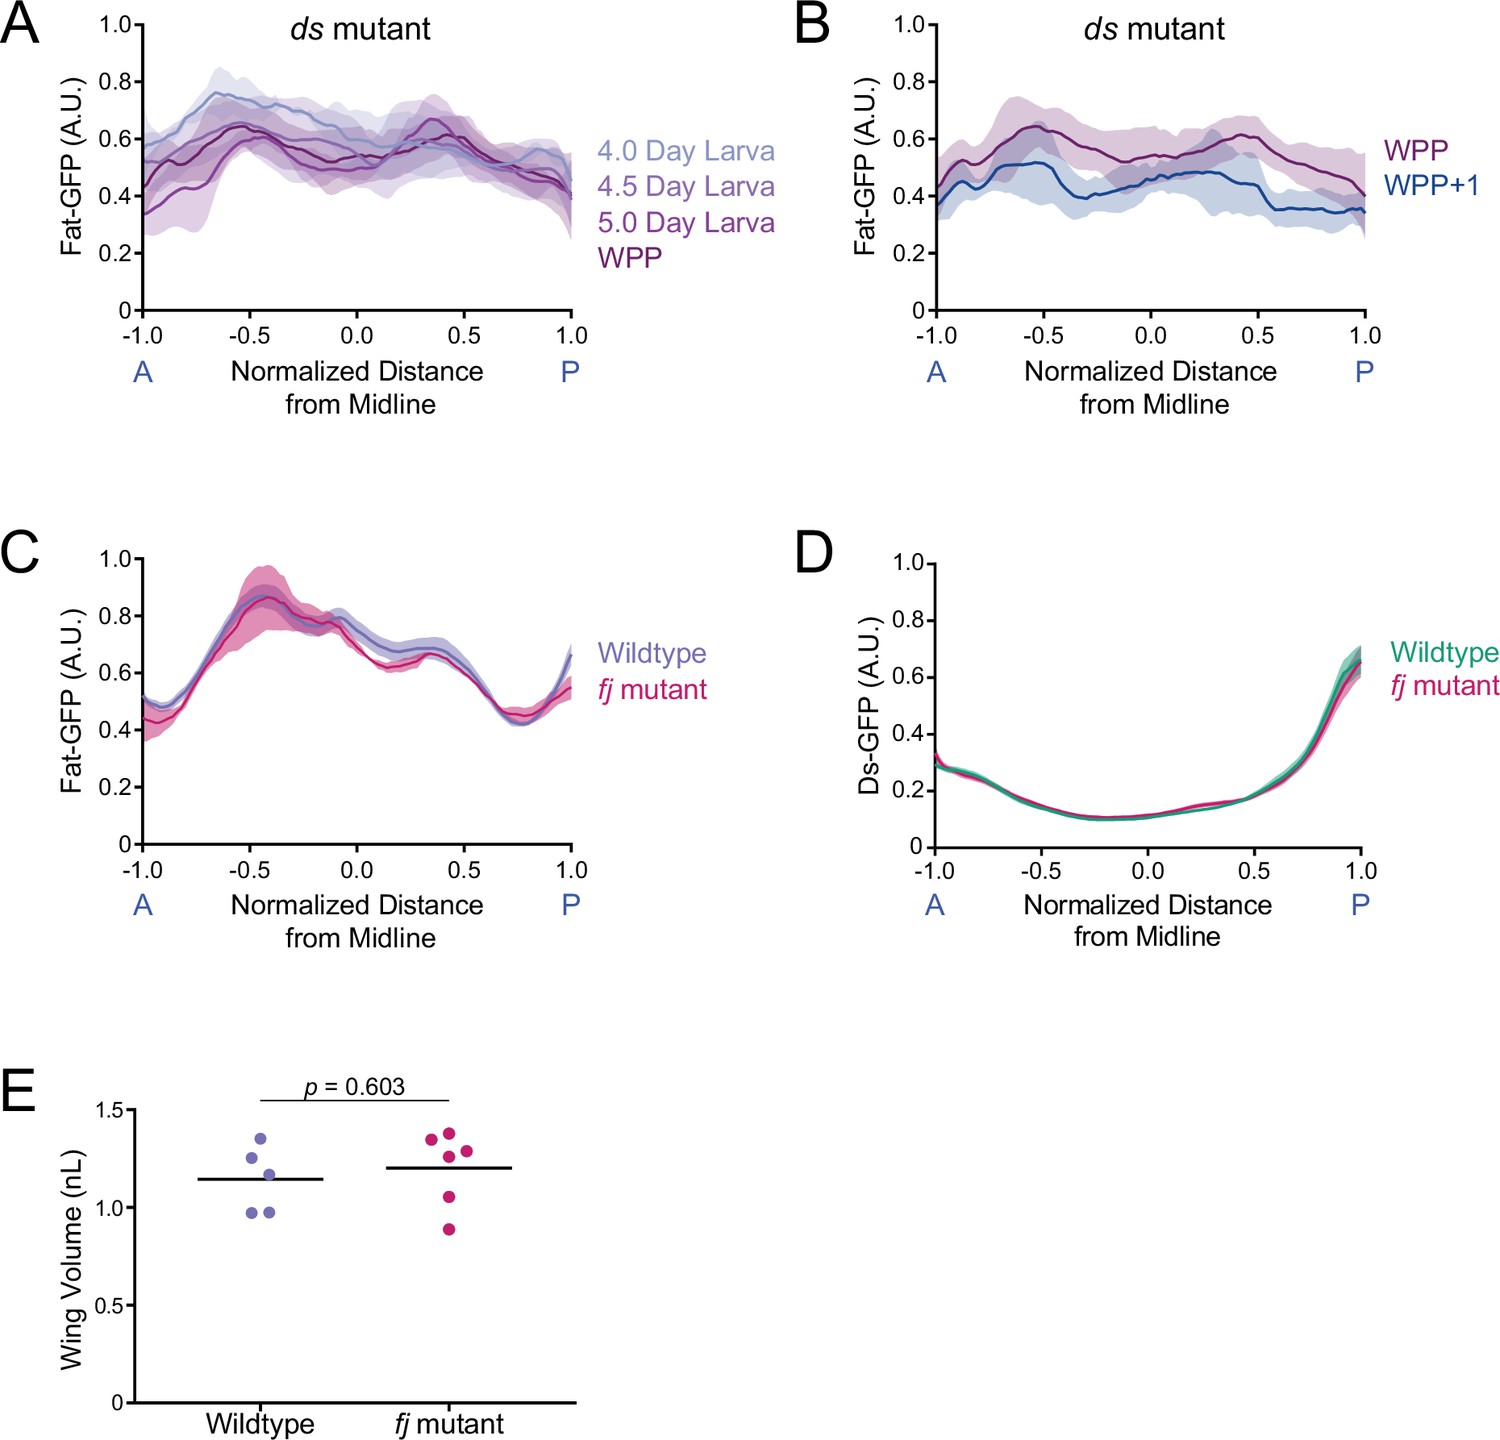
Fat expression in ds and fj mutants and Ds expression in fj mutants.
(A) Moving line average of Fat-GFP fluorescence along the normalized AP axis. Shown are profiles from different ages (as indicated) of ds33k/UAO71 mutants. Shaded regions for each profile represent the standard error of the mean. (B) Moving line average of Fat-GFP fluorescence along the normalized AP axis of ds33k/UAO71 mutant wing pouches from WPP and WPP + 1 animals. Shaded regions for each profile represent the standard error of the mean. (C) Moving line average of Fat-GFP fluorescence along the normalized AP axis of wildtype and fj d1/p1 mutant wing pouches from 4-day-old larvae. Shaded regions for each profile represent the standard error of the mean. (D) Moving line average of Ds-GFP fluorescence along the normalized AP axis of wildtype and fj d1/p1 mutant wing pouches from 4-day-old larvae. Shaded regions for each profile represent the standard error of the mean. (E) Wing pouch volume of wildtype control and fj d1/p1 mutant discs from the WPP stage. Shown are replicates and the mean.
Figure 3
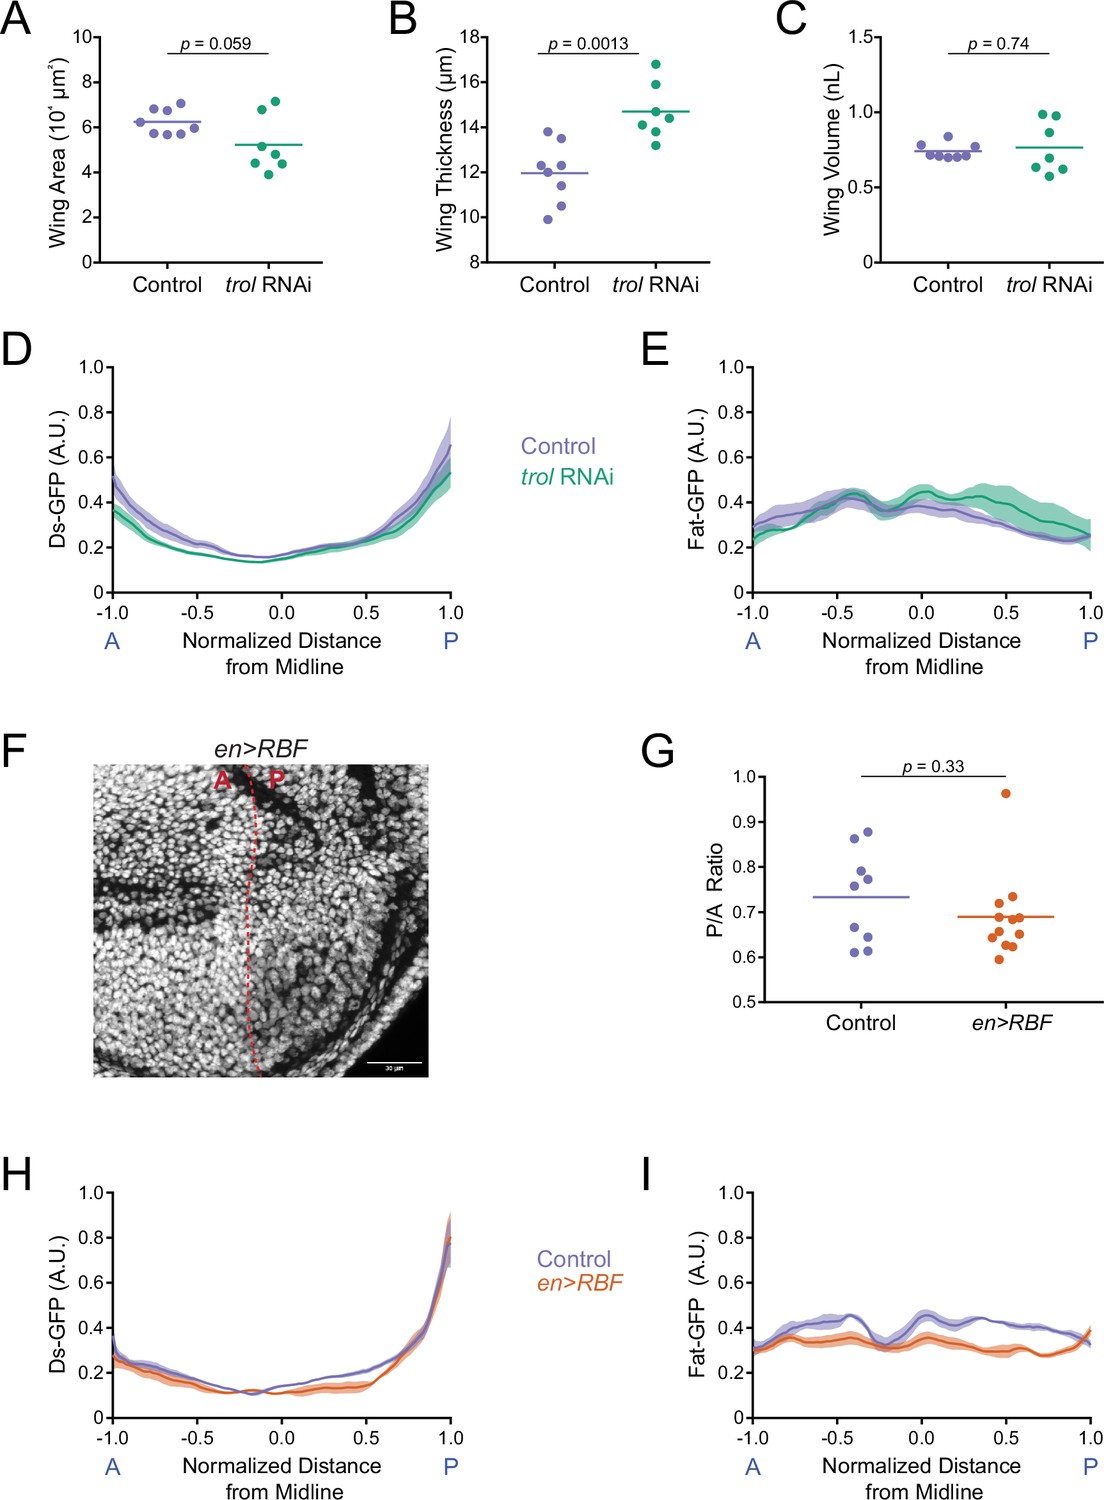
Ds and Fat expression dynamics correlate with wing pouch volume during third instar.
(A) Wing pouch area of nub-Gal4 control and nub >trol(RNAi) discs from the WPP stage. Shown are replicates and the mean. (B) Wing pouch thickness of nub-Gal4 control and nub >trol(RNAi) discs from the WPP stage. Shown are replicates and the mean. (C) Wing pouch volume of nub-Gal4 control and nub >trol(RNAi) discs from the WPP stage. Shown are replicates and the mean. (D) Moving line average of Ds-GFP fluorescence as a function of position along the AP axis normalized to the total distance of the axis in nub-Gal4 control and nub >trol(RNAi) WPP wing pouches. Shaded regions for each profile represent the standard error of the mean. (E) Moving line average of Fat-GFP fluorescence as a function of position along the AP axis normalized to the total distance of the axis in nub-Gal4 control and nub >trol(RNAi) WPP wing pouches. Shaded regions for each profile represent the standard error of the mean. (F) Confocal image of DAPI-stained nuclei in an en >RBF wing pouch. Note the lower density of nuclei in the P compartment (to the right of the dashed red line). This is due to the enlarged size of cells in this compartment. Scale bar is 30 µm. (G) The area ratio of P compartment to A compartment in en-Gal4 control and en >RBF wing pouches from WPP animals. Shown are replicates and the mean. (H) Moving line average of Ds-GFP fluorescence as a function of position along the AP axis normalized to the total distance of the axis in en-Gal4 control and en >RBF WPP wing pouches. Shaded regions for each profile represent the standard error of the mean. (I) Moving line average of Fat-GFP fluorescence as a function of position along the AP axis normalized to the total distance of the axis in en-Gal4 control and en >RBF WPP wing pouches. Shaded regions for each profile represent the standard error of the mean.
Figure 4 with 1 supplement

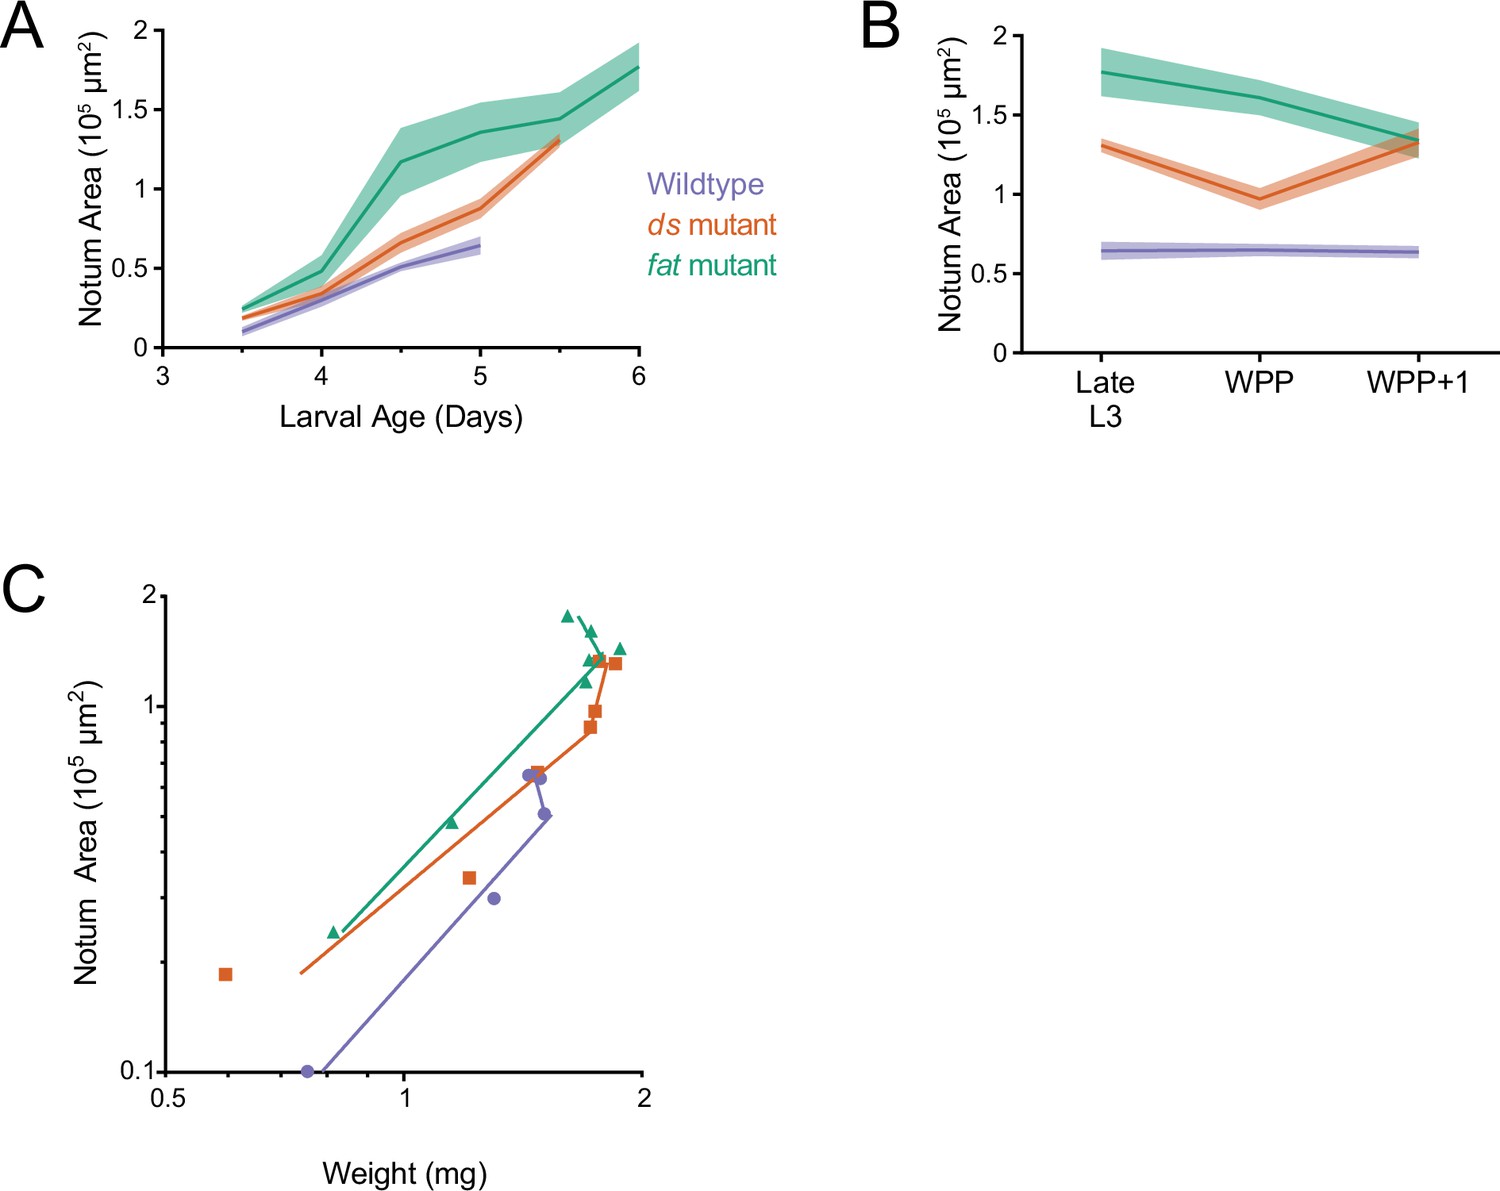
Allometric growth of the wing pouch during third instar is altered in ds and fat mutants.
(A) Wet-weight of wildtype, ds33k/UAO71, and fatG-rv/8 mutant third instar larvae as a function of age. Shaded regions represent standard error of the mean in this and the other panels. (B) Wet-weight of wildtype and mutant animals during early pupariation. Late L3 corresponds to the last day of the larval stage, that is, 5.0 days for wildtype, 5.5 days for ds33k/UAO71 mutants, and 6.0 days for fatG-rv/8 mutants. (C) Volume of wildtype and mutant wing pouches as a function of larval age. (D) Volume of wildtype and mutant wing pouches during early pupariation. Late L3 corresponds to the last day of the larval stage, i.e., 5.0 days for wildtype, 5.5 days for ds33k/UAO71 mutants, and 6.0 days for fatG-rv/8 mutants. (E) Allometric growth relationship of the third instar wing pouch versus body weight in wildtype and mutants.
Figure 4—figure supplement 1
Allometric growth of the notum-hinge is altered in ds and fat mutants.
(A) Area of the wildtype, ds33k/UAO71, and fatG-rv/8 mutant notum-hinge as a function of larval age. Shaded regions represent standard error of the mean in this and the other panels. (B) Area of the wildtype and mutant notum-hinge during early pupariation. Late L3 corresponds to the last day of the larval stage. (C) Allometric growth relationship of the notum-hinge versus body weight in wildtype and mutants.
Figure 5 with 3 supplements
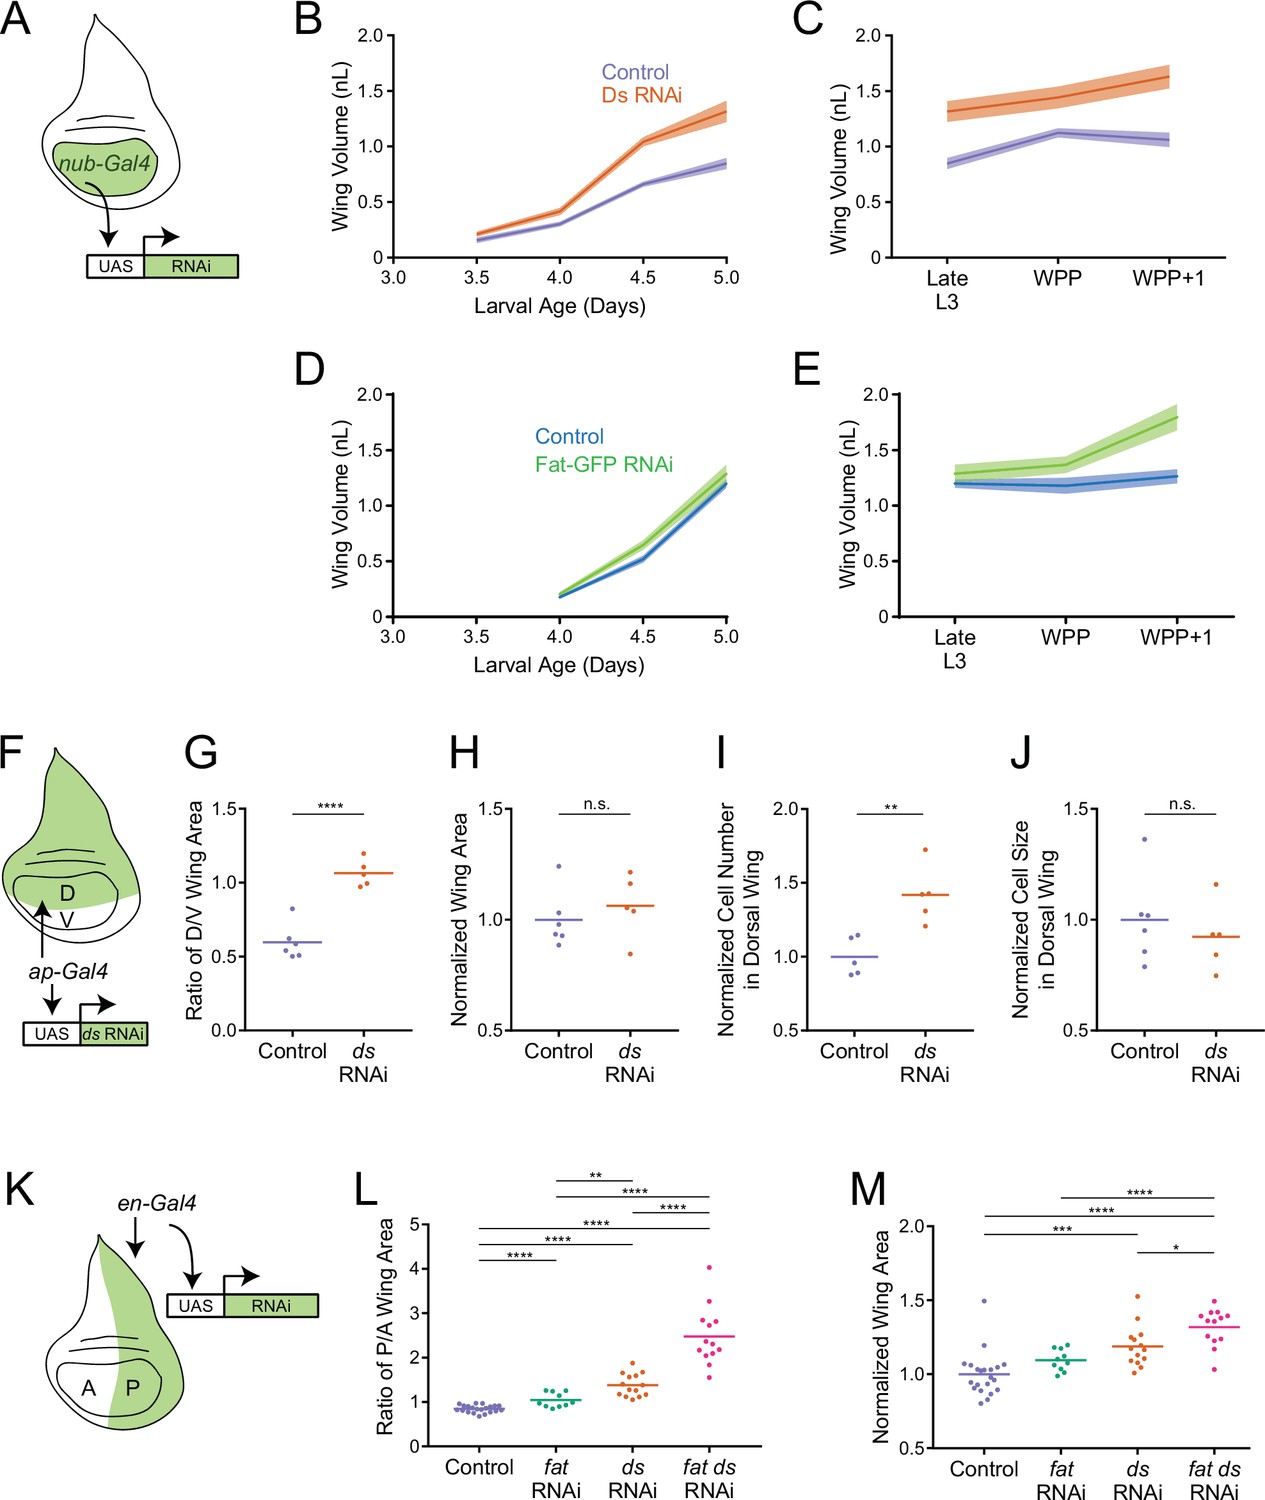
Fat and Ds regulate growth autonomously in the third instar wing pouch.
(A) Schematic of the nub-Gal4 driver inducing RNAi of fat or ds in the wing pouch. (B) Volume of nub-Gal4 control and nub >ds(RNAi) third instar wing pouches as a function of age. Shaded regions represent standard error of the mean. (C) Volume of nub-Gal4 control and nub >ds(RNAi) wing pouches during early pupariation. Shaded regions represent standard error of the mean. (D) Volume of nub-Gal4 control and nub >fat-GFP(RNAi) third instar wing pouches as a function of age. Shaded regions represent standard error of the mean. (E) Volume of nub-Gal4 control and nub >fat-GFP(RNAi) wing pouches during early pupariation. Shaded regions represent standard error of the mean. (F) Schematic of the ap-Gal4 driver inducing RNAi of ds in the D compartment by shRNA expression. (G) Ratio of D compartment area to V compartment area in ap-Gal4 control and ap >ds(RNAi) wing pouches from WPP animals. Shown are replicate measurements and their mean. (H) Wing pouch area of ap-Gal4 control and ap >ds(RNAi) WPP animals. Shown are replicate measurements and their mean. The area is normalized to the average of ap-Gal4 controls. (I) Cell number in the D compartment of the wing pouch of ap-Gal4 control and ap >ds(RNAi) WPP animals. Shown are replicate measurements and their mean. The cell number is normalized to the average of ap-Gal4 controls. (J) Average cell size (apical area) in the D compartment of the wing pouch of ap-Gal4 control and ap >ds(RNAi) WPP animals. Shown are replicate measurements and their mean. The cell size is normalized to the average of ap-Gal4 controls. (K) Schematic of the en-Gal4 driver inducing RNAi of ds and fat in the P compartment by shRNA expression. (L) Ratio of P compartment area to A compartment area in en-Gal4 control, en >fat(RNAi), en >ds(RNAi), and en >fat ds(RNAi) wing pouches from WPP animals. Shown are replicate measurements and their mean. (M) Wing pouch area of en-Gal4 control and RNAi knockdown WPP animals. Shown are replicate measurements and their mean. The area is normalized to the average of en-Gal4 controls. Samples that were significantly different are marked with asterisks (*, p<0.05; **, p<0.01; ***, p<0.001; ****, p<0.0001).
Figure 5—figure supplement 1
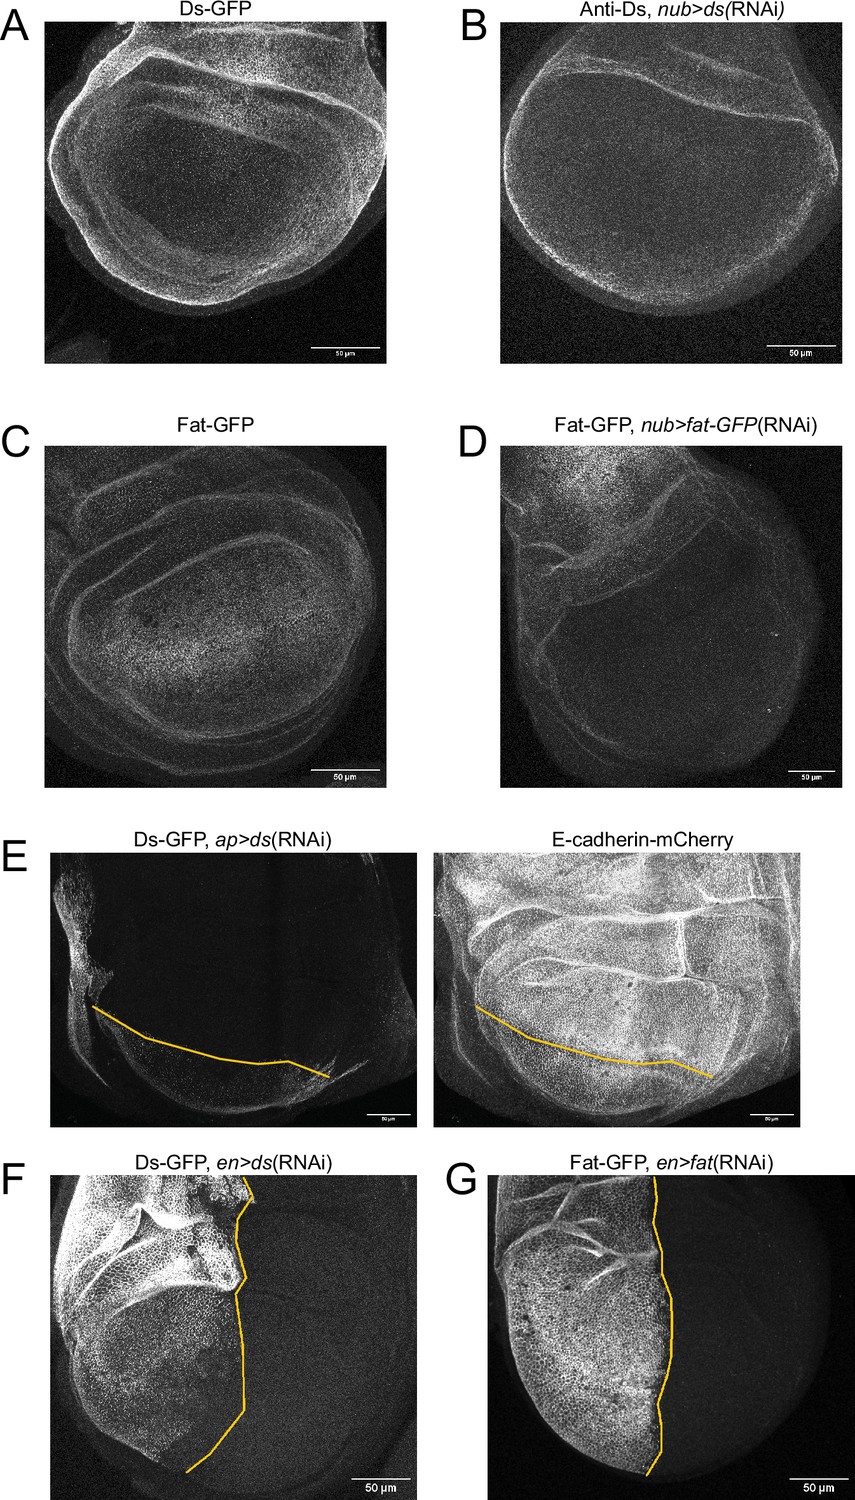
RNAi knocks down fat and ds expression.
All panels show confocal images of third instar larval wing discs. Scale bars are 50 µm. (A) Endogenously expressed Ds-GFP. (B) Anti-Ds staining of nub >ds(RNAi) disc. Ds expression in the peripodial membrane and notum remains unchanged. (C) Endogenously expressed Fat-GFP. (D) Fat-GFP expression in a nub >fat-GFP(RNAi) disc. Fat expression in the peripodial membrane and notum remains unchanged. (E) Ds-GFP expression in an ap >ds(RNAi) disc (left). Ds expression in the ventral compartment remains unchanged. E-cadherin-mCherry is used for cell segmentation (right). The compartment boundary is shown in yellow. (F) Ds-GFP expression in an en >ds(RNAi) disc. Ds expression in the anterior compartment remains unchanged. The compartment boundary is shown in yellow. (G) Fat-GFP expression in an en >fat-GFP(RNAi) disc. Fat expression in the anterior compartment remains unchanged. The compartment boundary is shown in yellow.
Figure 5—figure supplement 2
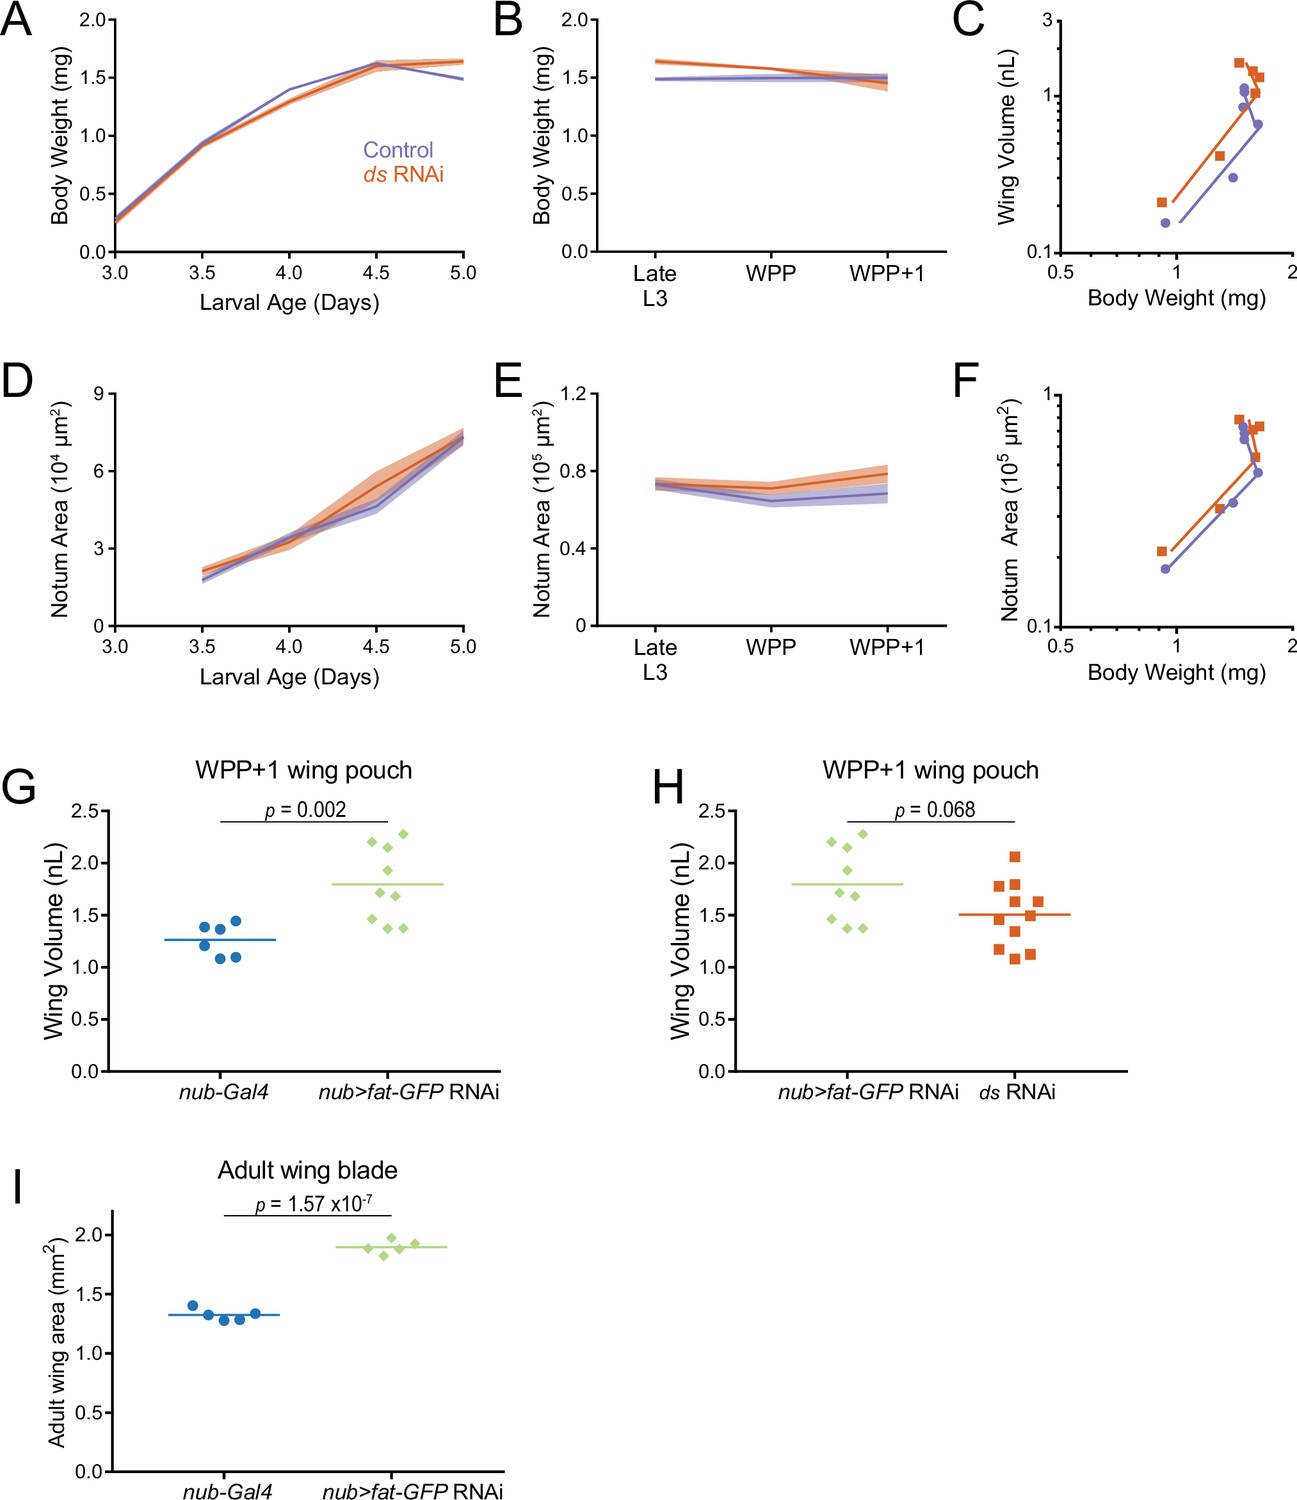
Growth of the notum-hinge when fat and ds are knocked down in the third instar wing pouch.
(A) Wet-weight of nub-Gal4 control and nub >ds(RNAi) third instar larvae as a function of larval age. Shaded regions represent standard error of the mean in this and the other panels. (B) Wet-weight of control and ds RNAi-treated animals during early pupariation. Shaded regions represent standard error of the mean. (C) Allometric growth relationship of the third instar wing pouch versus body weight in control and ds RNAi-treated animals. (D) Notum-hinge area in control and ds RNAi-treated animals as a function of larval age. Shaded regions represent standard error of the mean in this and the other panels. (E) Notum-hinge area in control and ds RNAi-treated animals during early pupariation. (F) Allometric growth relationship of the notum-hinge versus body weight in control and ds RNAi-treated animals. (G) Wing pouch volume of nub-Gal4 control and nub >fat-GFP(RNAi) wing discs from the WPP + 1 stage. Shown are replicates and the mean. (H) Wing pouch volume measurements comparing nub >fat-GFP(RNAi) and nub >ds(RNAi) from the WPP + 1 stage. Shown are replicates and the mean. (I) Adult wing blade area from nub-Gal4 control and nub >fat-GFP(RNAi) animals. Shown are replicates and the mean.
Figure 5—figure supplement 3
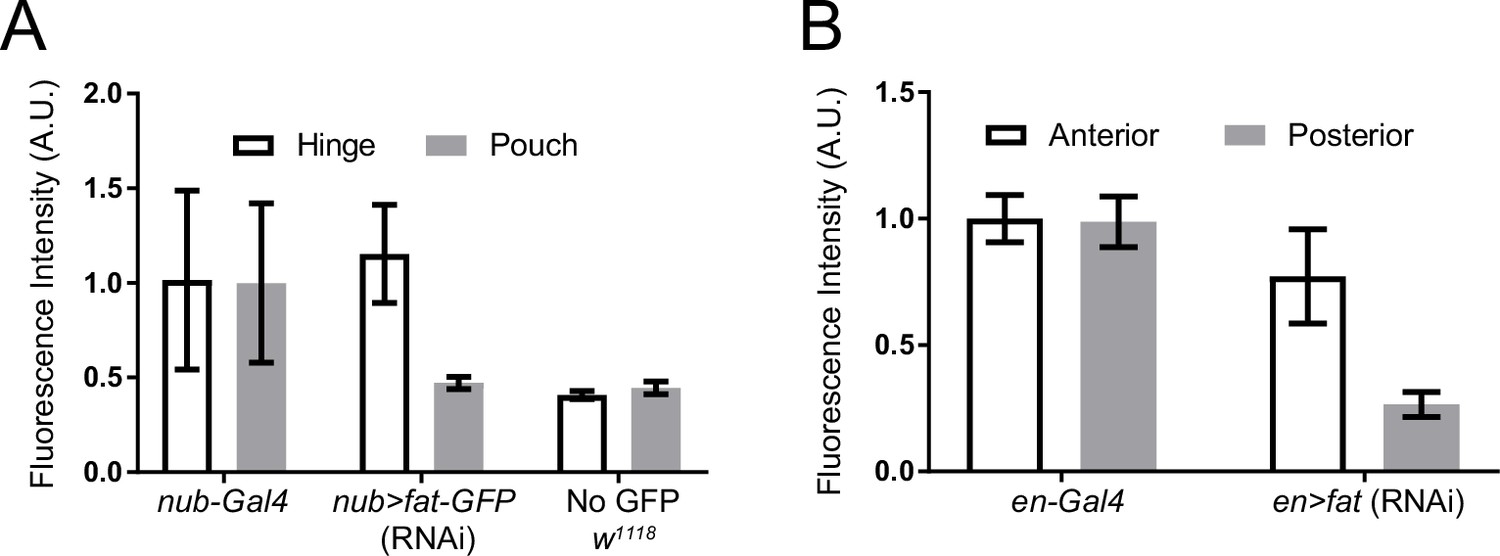
Knockdown efficacy of Fat-GFP as quantitatively measured by GFP fluorescence intensity.
(A) Green fluorescence intensity measurements were made in the wing pouch and hinge regions of w1118, fat-GFP; nub-Gal4, and nub >fat-GFP(RNAi) third instar wing discs. All measurements were normalized to the average intensity in the fat-GFP; nub-Gal4 hinge region. Error bars are standard deviations. Green fluorescence from w1118 wing discs is due to background tissue autofluorescence since these animals do not carry a GFP gene. When comparing the average pouch fluorescence between w1118 and nub >fat-GFP(RNAi), the fluorescence in nub >fat-GFP(RNAi) was only 5% higher than in the w1118 pouch, indicating that 95% of Fat-GFP expression was knocked down by RNAi treatment. (B) Average of GFP fluorescence intensity of the anterior and posterior wing pouch regions in en-Gal4 control and en >fat-GFP(RNAi) animals, normalized to the average intensity in control anterior pouch region.
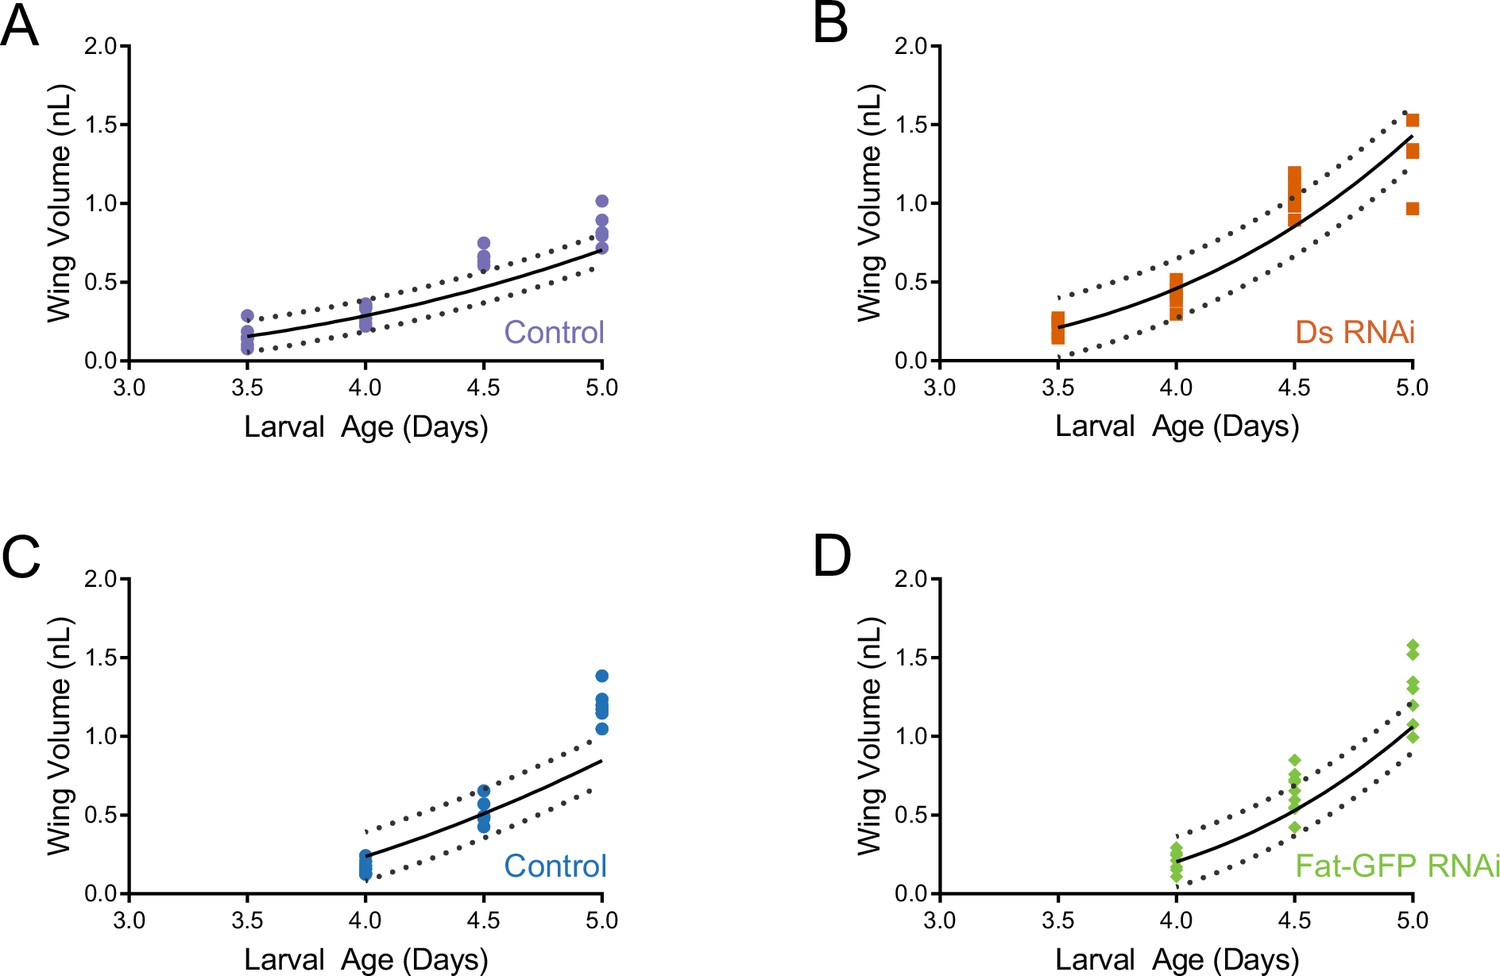
Figure 6 with 2 supplements
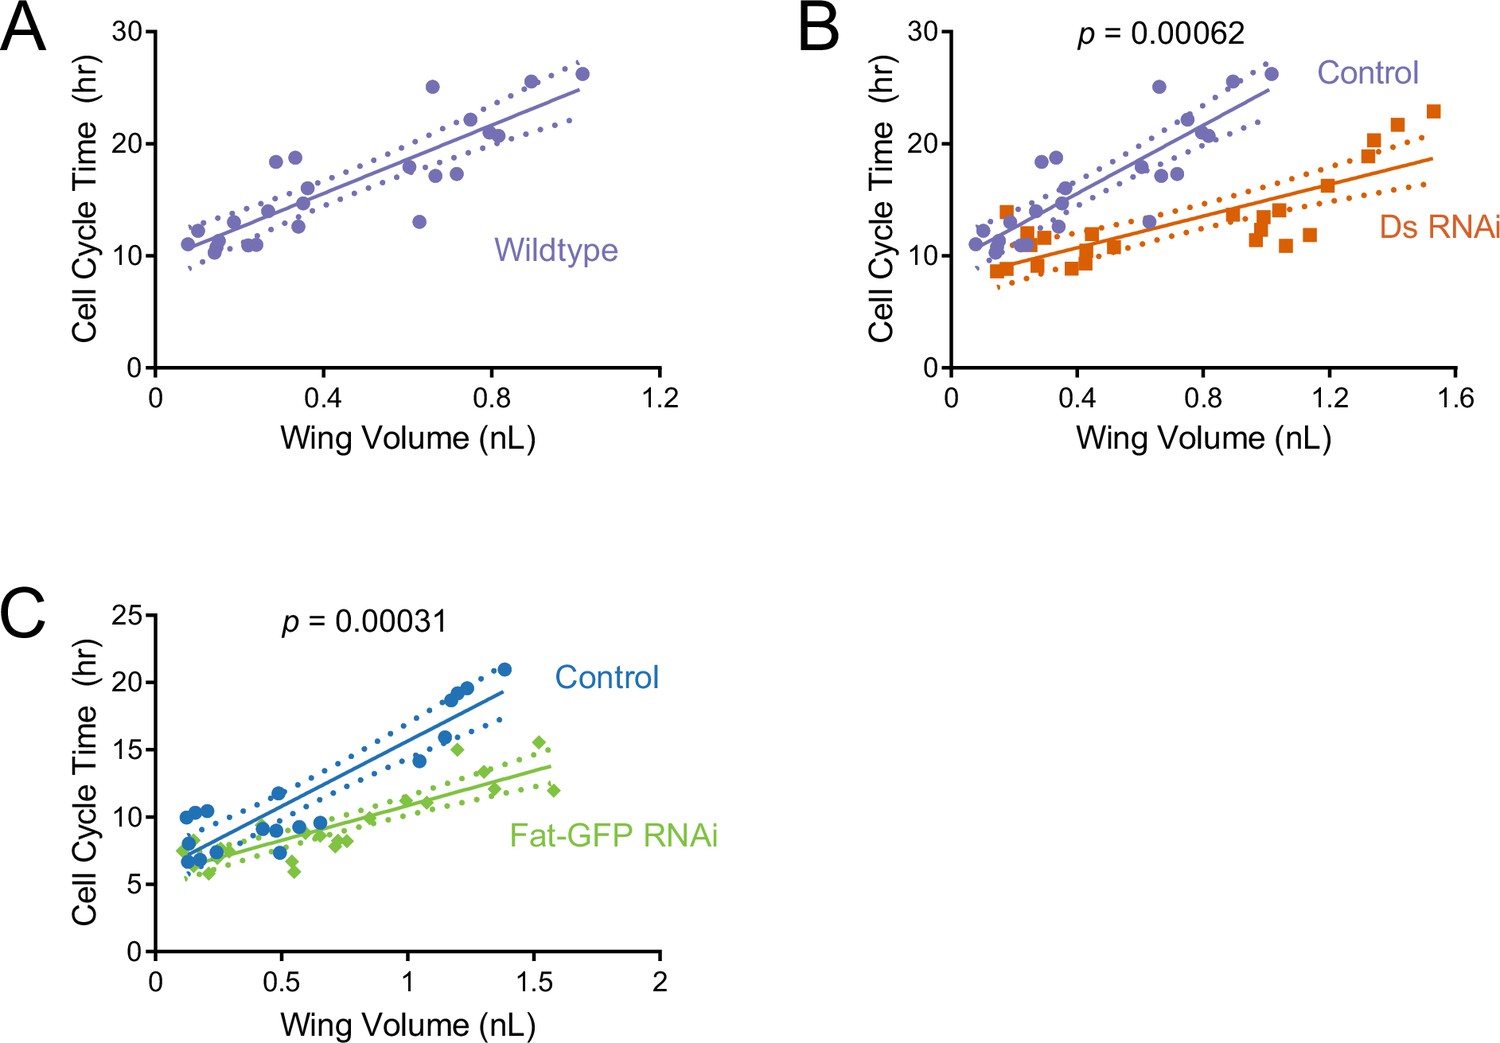
Cell cycle duration scaling with wing size is regulated by Ds and Fat during the third instar.
The average cell cycle time for third instar wing pouch cells is plotted against wing pouch volume for wing discs sampled over 1.5 days of third instar larval growth. Solid lines show the linear regression models, and dotted lines show the 95% confidence intervals of the fits. p Values denote the significance tests comparing the slopes (scaling coefficients) between RNAi-treated and control regression models. (A) nub-Gal4 control. (B) nub >ds(RNAi) and nub-Gal4 control. (C) nub >fat-GFP(RNAi) and nub-Gal4 control.
-
Figure 6—source data 1
Summary statistics of linear regression analysis of average cell cycle time versus wing pouch volume.
- https://cdn.elifesciences.org/articles/91572/elife-91572-fig6-data1-v1.docx
-
Figure 6—source data 2
Summary statistics of linear regression analysis of average cell cycle time versus larval age (hours).
- https://cdn.elifesciences.org/articles/91572/elife-91572-fig6-data2-v1.docx
Figure 6—figure supplement 1
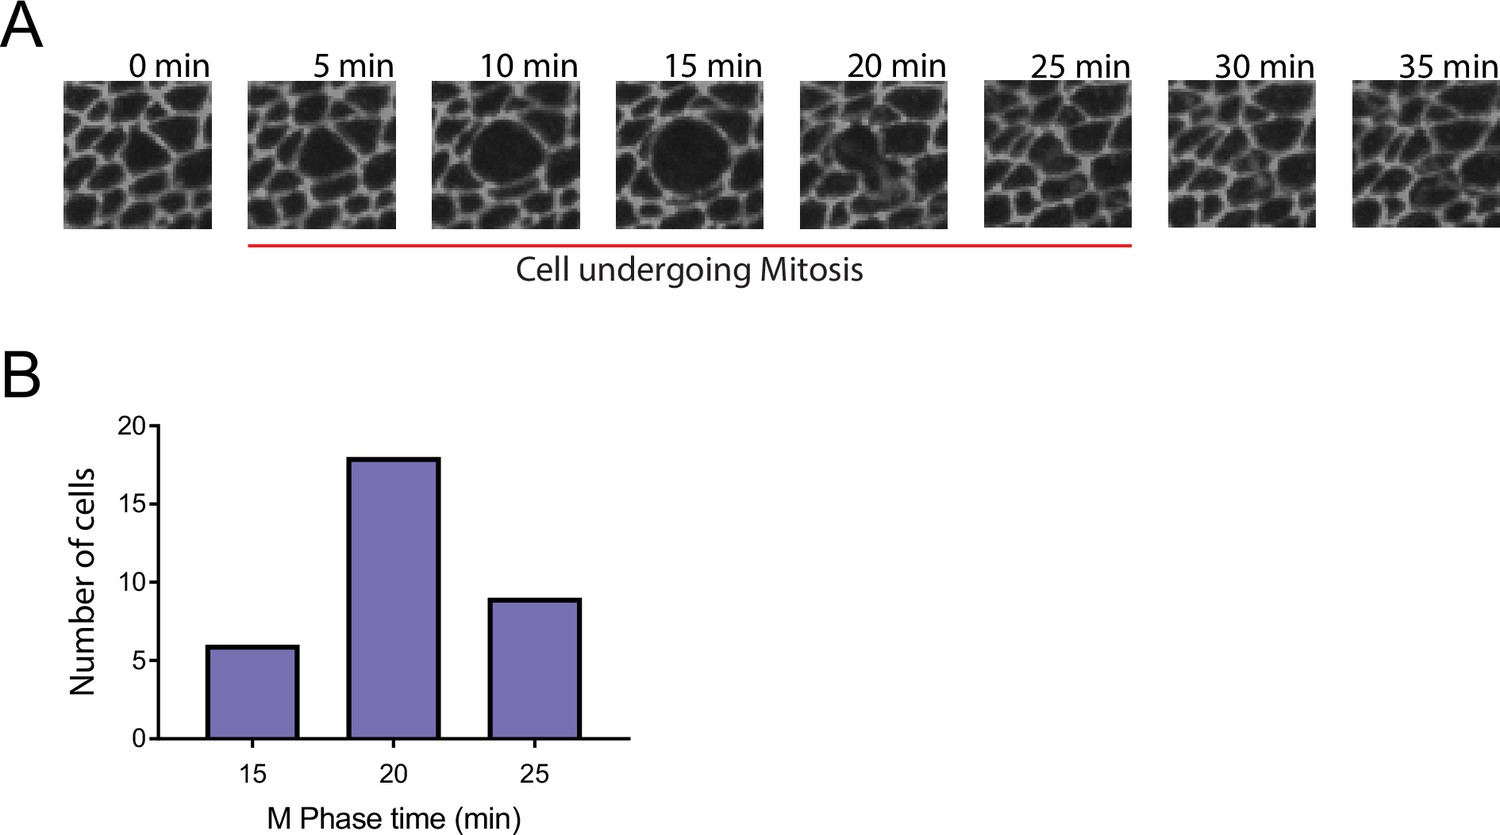
Measurement of length of M phase in wing pouch cells.
Third instar wing discs expressing E-cadherin-GFP were dissected and cultured ex vivo as described by Gallagher et al., 2022. Each disc was successively imaged by microscopy over a 2 hr period, with an image frame time interval of 5 min. (A) A cell undergoing mitosis starting at t=5 min. Cytokinesis is completed at t=25 min. The beginning of mitosis is marked by the first detectable increase in a cell’s apical area. The cell expands and becomes circular, after which mitosis completes and the cell contracts in area as it divides. The end of cytokinesis is marked by the last detectable decrease in daughter cell apical area. (B) Histogram of M phase times for 33 wing pouch cells. The mean time is 20.5 min.
Figure 6—figure supplement 2
Model simulations of wing pouch volume growth based on measured cell cycle times, compared to measured wing pouch volumes.
A linear fit between measured average cell cycle time and larval age was used to calculate the instantaneous cell growth rate as a function of larval age, assuming exponential cell growth. The instantaneous cell growth function was then used to simulate the growth curve of the entire wing pouch (solid black lines). Dotted lines show the 95% confidence intervals. The actual wing pouch volume measurements are plotted as colored dots. Note the congruity of model-predicted growth with measured growth. This indicates that cell cycle regulation during this larval stage is sufficient to explain most if not all observed tissue growth. (A,B) Control nub-Gal4 (A) and nub >ds(RNAi) (B). (C,D) Control nub-Gal4 (C) and nub >fat-GFP(RNAi) (D).
Figure 7 with 3 supplements
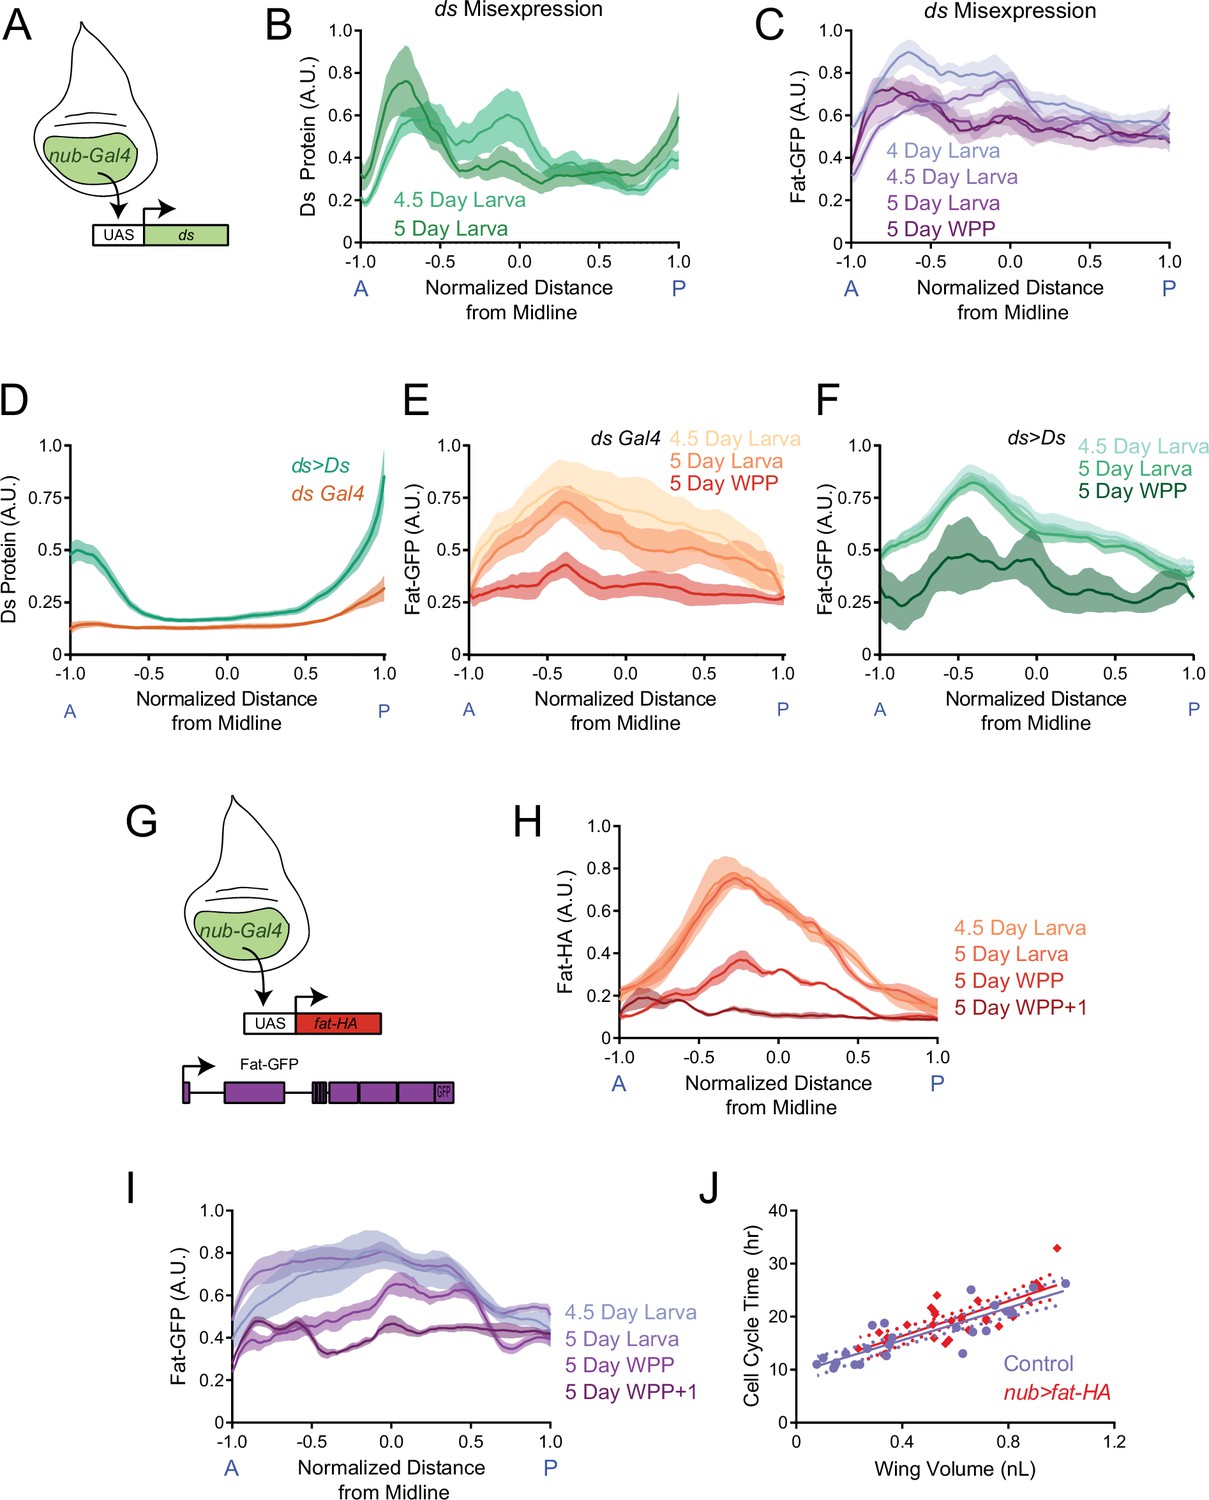
The endogenous graded distributions of Fat and Ds are not essential for controlling growth rate of the third instar wing pouch.
(A) Schematic of the nub-Gal4 driver expressing ds under the UAS promoter. (B) Moving line average of Ds protein stained with anti-Ds as a function of position along the AP axis and normalized to the total distance of the axis. Shown are staged larval wing pouches from nub >ds animals. This measurement also detects expression from the endogenous ds gene. Shaded regions for each profile represent the standard error of the mean. (C) Moving line average of Fat-GFP fluorescence as a function of position along the AP axis and normalized to the total distance of the axis. Shown are staged larval and pupal wing pouches from nub >ds animals. Shaded regions for each profile represent the standard error of the mean. (D) Moving line average of Ds protein stained with anti-Ds as a function of position along the AP axis and normalized to the total distance of the axis. Shown are 4.5-day-old larval wing pouches from ds-Gal4 and ds >Ds animals. ds >Ds overexpression of Ds protein is generated using a Trojan-Gal4 insertion that disrupts the endogenous ds gene and drives ds under a UAS promoter. Since all fluorescence intensities are normalized to the maximum level detected in ds >Ds, the endogenous ds gradient (brown) appears artificially flattened. This shows the scale of overexpression. Shaded regions for each profile represent the standard error of the mean. (E) Moving line average of Fat-GFP fluorescence as a function of position along the AP axis and normalized to the total distance of the axis. Shown are staged larval and pupal wing pouches from fat-GFP; ds-Gal4 animals. Shaded regions for each profile represent the standard error of the mean. (F) Moving line average of Fat-GFP fluorescence as a function of position along the AP axis and normalized to the total distance of the axis. Shown are staged larval and WPP wing pouches from ds >Ds animals. Shaded regions for each profile represent the standard error of the mean. (G) Schematic of the nub-Gal4 driver expressing fat-HA under the UAS promoter. (H) Moving line average of transgenic Fat-HA protein stained with anti-HA as a function of position along the AP axis and normalized to the total distance of the axis. Shown are staged larval and pupal wing pouches from nub >fat HA; fat-GFP animals. This measurement does not detect expression from the endogenous fat-GFP gene. Shaded regions for each profile represent the standard error of the mean. (I) Moving line average of endogenous Fat-GFP fluorescence as a function of position along the AP axis and normalized to the total distance of the axis. Shown are staged larval and pupal wing pouches from nub >fat HA; fat-GFP animals. Shaded regions for each profile represent the standard error of the mean. (J) The average cell cycle time for wing pouch cells plotted against wing pouch volume for wing discs from nub-Gal4 control animals and nub >fat HA; fat-GFP animals. Solid lines show the linear regression model, and dotted lines show the 95% confidence intervals for the fit. There is no significant difference between the slopes (p=0.65).
-
Figure 7—source data 1
Summary statistics of linear regression analysis of average cell cycle time as a function of wing pouch volume when Fat is misexpressed under nub-Gal4 control and when the Ds gradient is amplified under Trojan-Gal4 control.
- https://cdn.elifesciences.org/articles/91572/elife-91572-fig7-data1-v1.docx
Figure 7—figure supplement 1
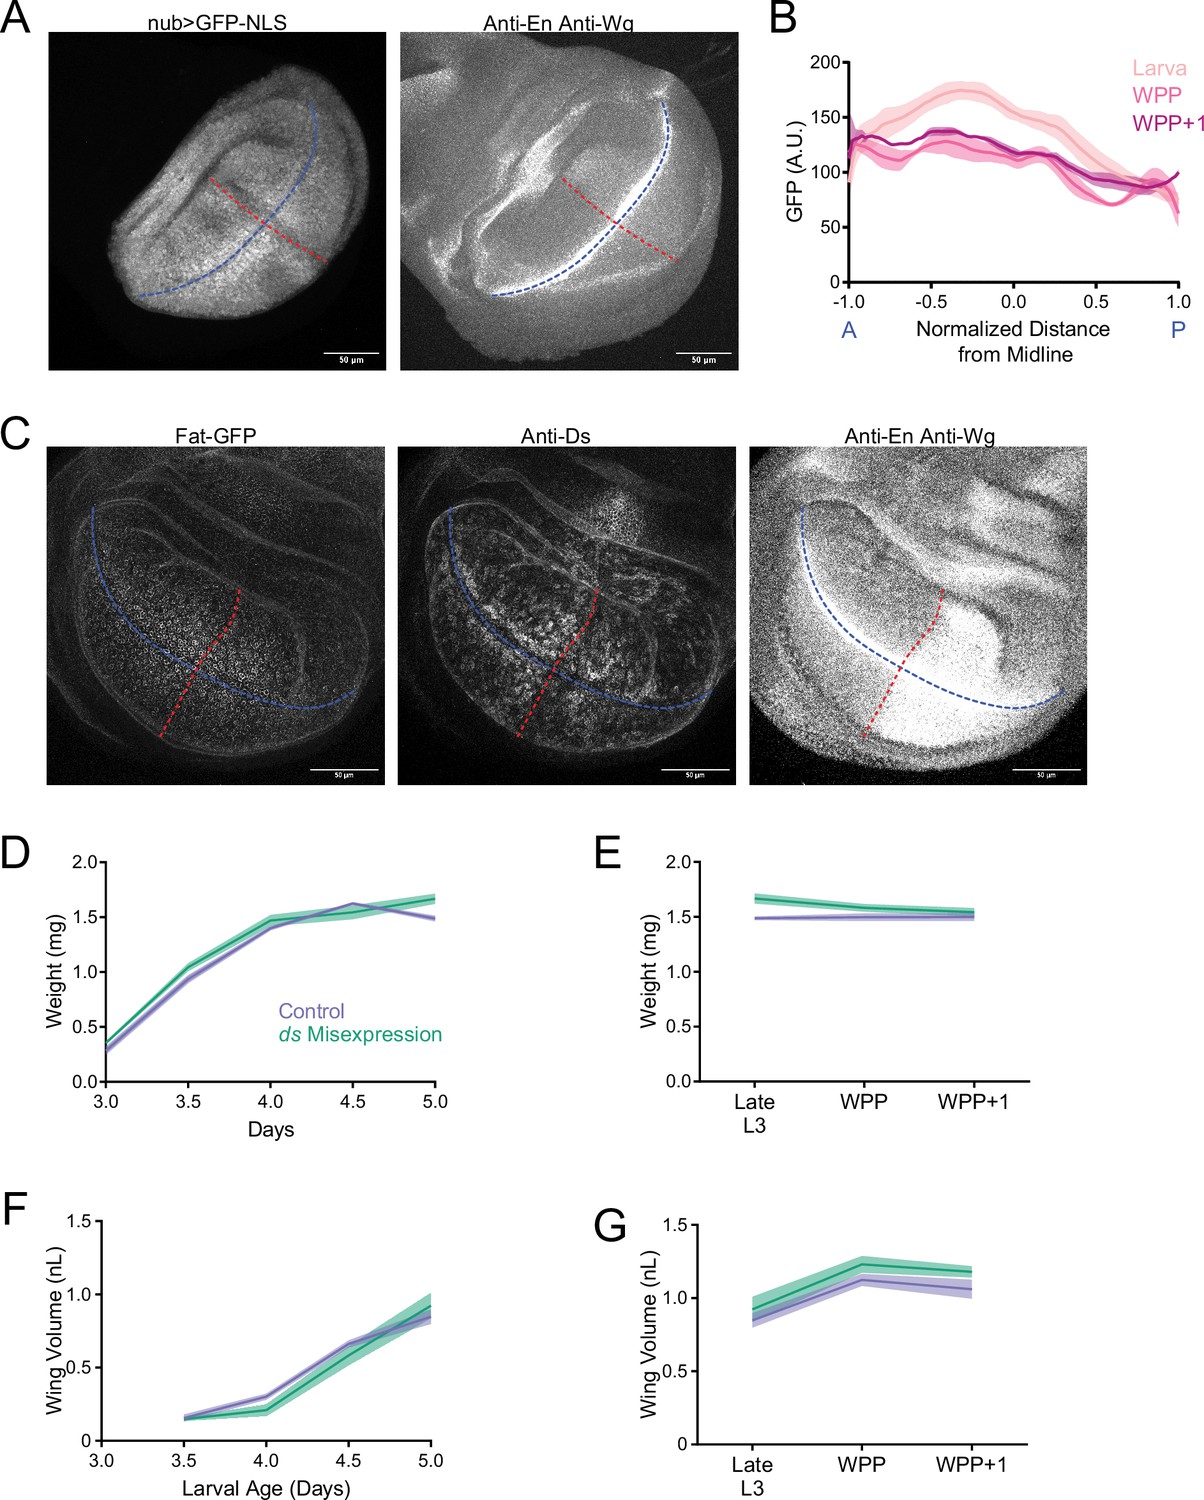
Alteration of the Ds expression gradient does not affect growth.
(A) Confocal images of a nub >GFP NLS third instar larval wing disc showing GFP fluorescence (left) and anti-Wg / anti-En fluorescence (right). The AP (blue) and DV (red) axes are shown. Scale bar is 50 µm. (B) nub-Gal4 driving expression of UAS-GFP-NLS along the AP axis of symmetry in the wing pouch. This demonstrates the graded expression of genes transcribed by nub-Gal4. Shown are moving line averages for larval and pupal wing pouches. Shaded regions represent standard error of the mean. (C) Confocal images of a nub >ds; fat-GFP third instar larval wing disc showing Fat-GFP fluorescence (left), anti-Ds fluorescence (center), and anti-Wg / anti-En fluorescence (right). The AP (blue) and DV (red) axes are shown. Scale bar is 50 µm. (D) Wet-weight of nub-Gal4 control and nub >ds third instar larvae as a function of age. Shaded regions represent standard error of the mean. (E) Wet-weight of nub-Gal4 control and nub >ds animals during early pupariation. Shaded regions represent standard error of the mean. (F) Volume of nub-Gal4 control and nub >ds larval wing pouches as a function of age. Shaded regions represent standard error of the mean.(G) Volume of nub-Gal4 control and nub >ds wing pouches during early pupariation. Shaded regions represent standard error of the mean.
Figure 7—figure supplement 2
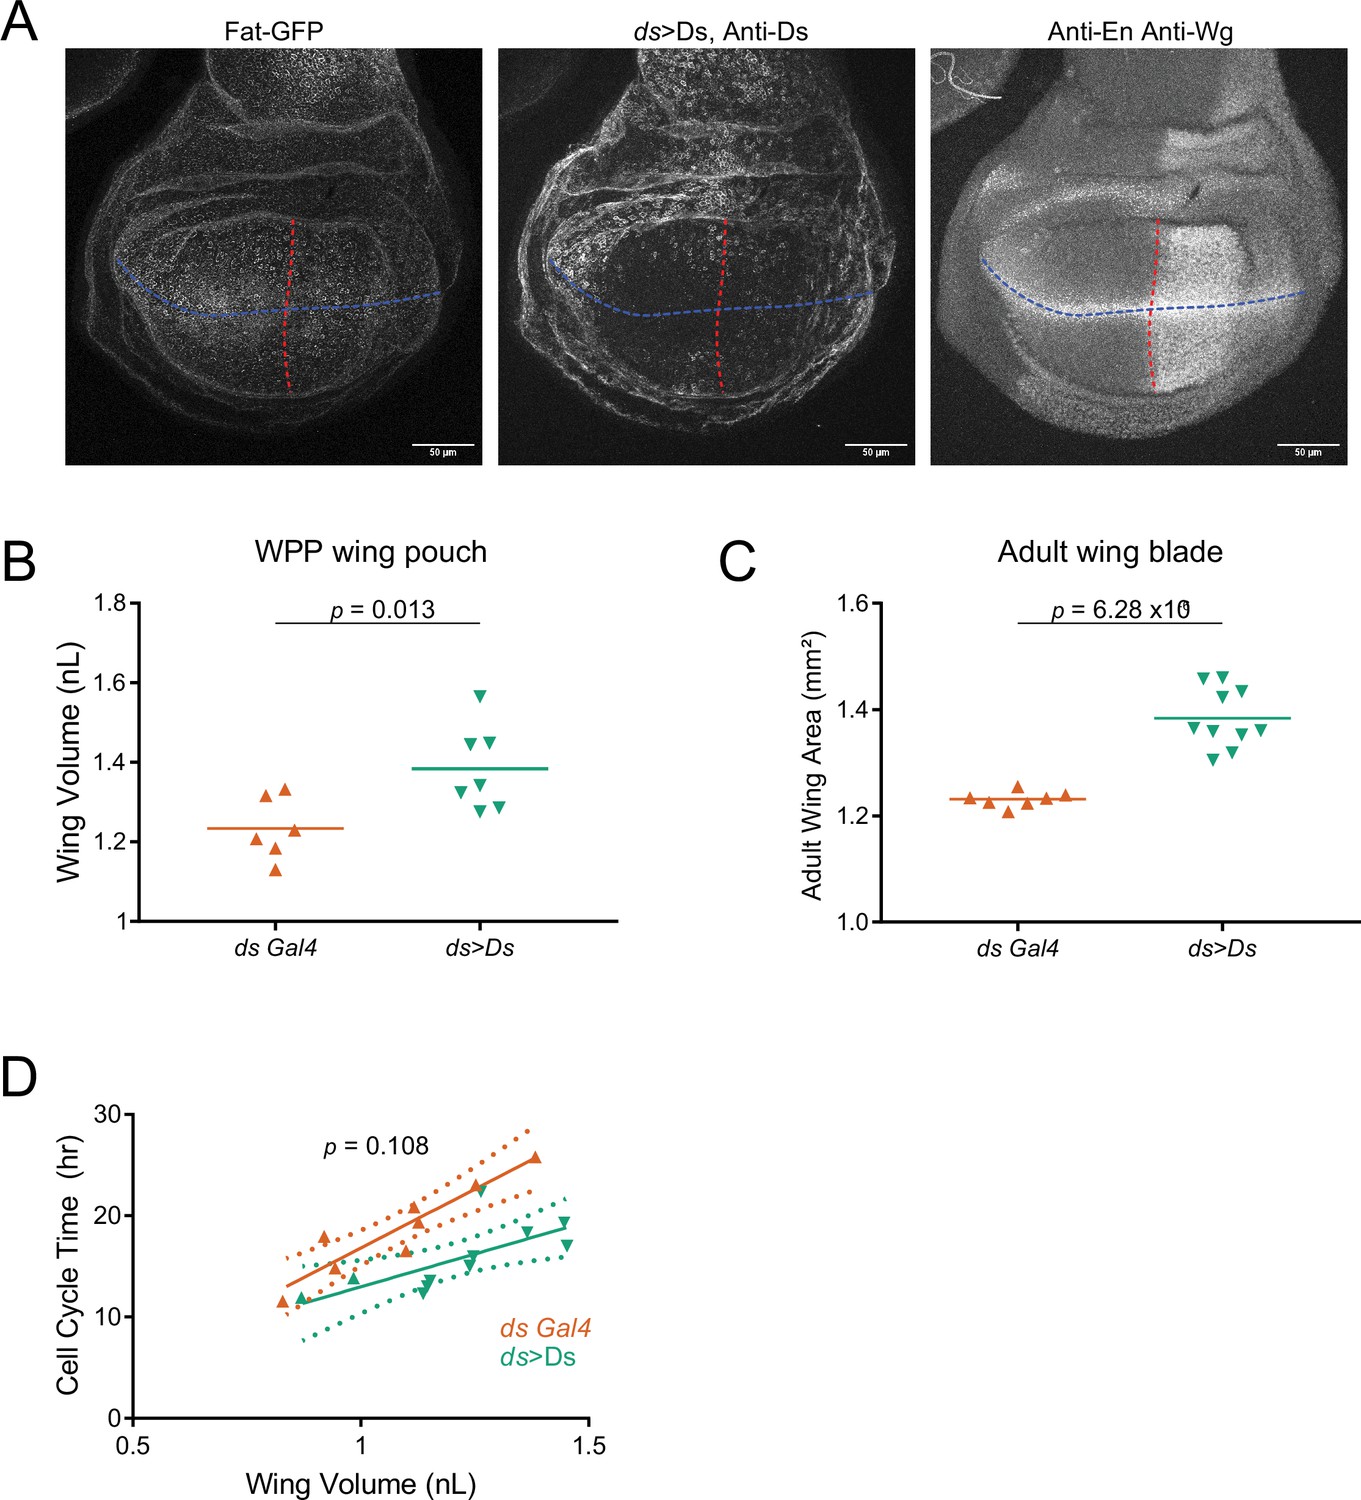
Amplifying of Ds gradient has weak effect on wing pouch growth.
(A) Confocal images of a ds >Ds; fat-GFP third instar larval wing disc showing Fat-GFP fluorescence (left), anti-Ds fluorescence (center), and anti-Wg / anti-En fluorescence (right). The AP (blue) and DV (red) axes are shown. Scale bar is 50 µm. (B) Volume of WPP wing pouches from ds-Trojan-Gal4 control and ds >Ds animals. Shown are replicates and the mean, with results of a t test. (C) Adult wing blade area from ds-Trojan-Gal4 control and ds >Ds animals. Shown are replicates and the mean, with results of a t test. (D) The average cell cycle time for wing pouch cells plotted against wing pouch volume for wing discs from ds-Gal4 control animals and ds >Ds animals. Solid lines show the linear regression model, and dotted lines show the 95% confidence intervals for the fit. The p value is from a significance test comparing the slopes (scaling coefficients) of the linear models.
Figure 7—figure supplement 3
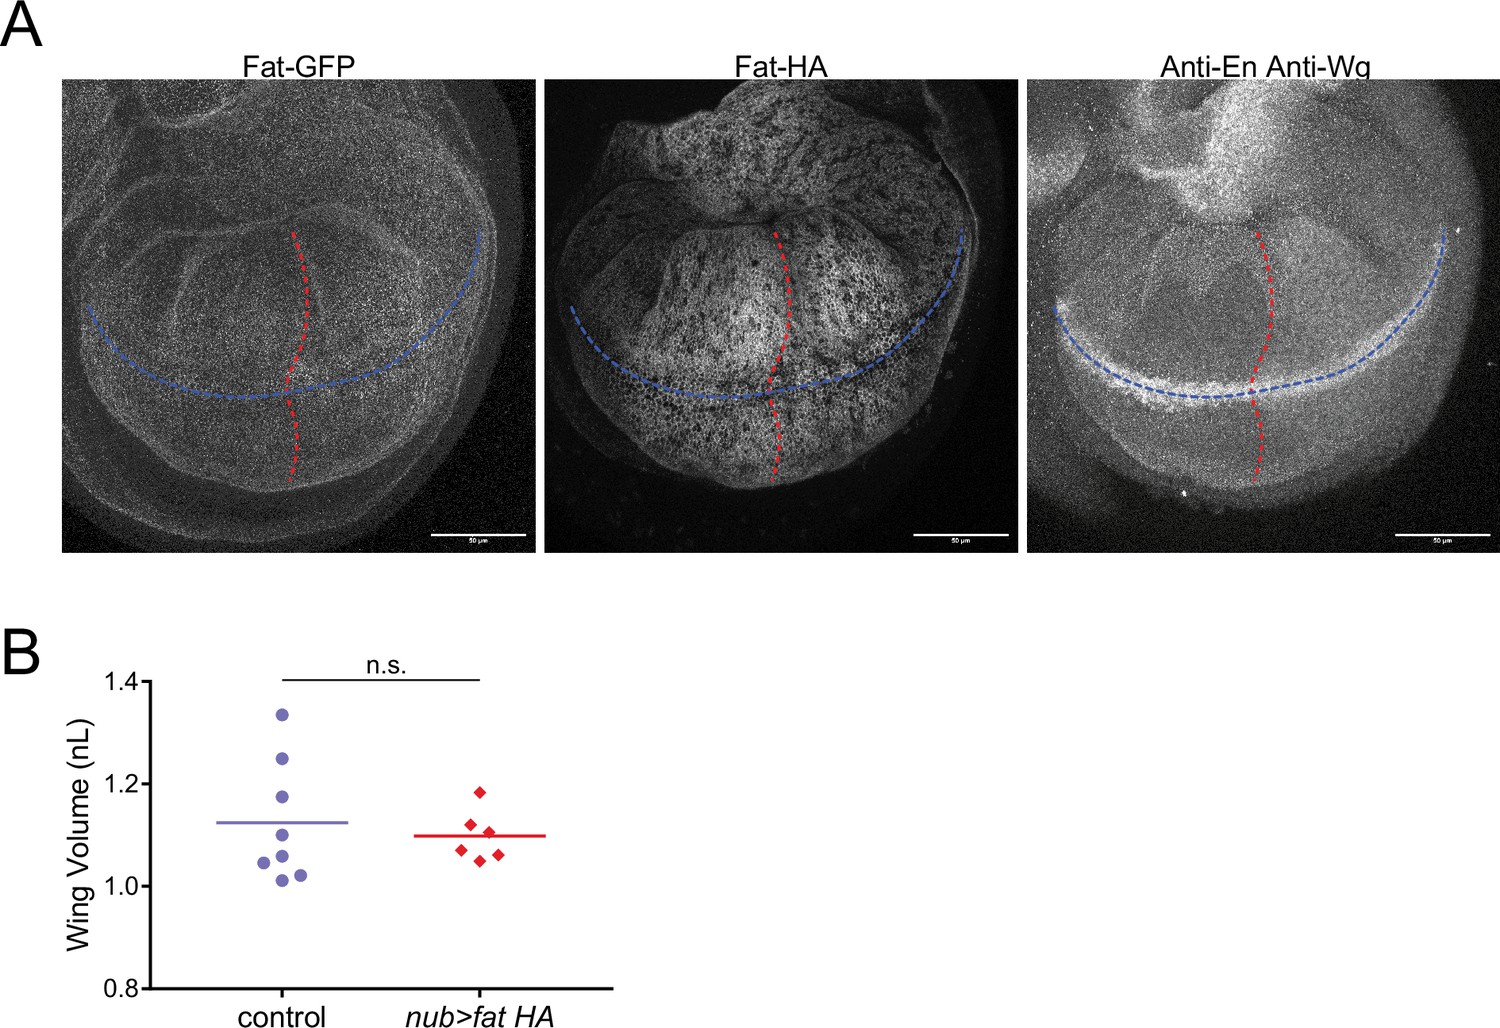
Disruption of the Fat gradient has no detectable effect on wing pouch growth.
(A) Confocal images of a nub >fat HA; fat-GFP third instar larval wing disc showing Fat-GFP fluorescence (left), anti-Fat-HA immunofluorescence (center), and anti-Wg / anti-En fluorescence (right). The AP (blue) and DV (red) axes are shown. Scale bar is 50 µm. (B) Volume of WPP wing pouches from nub-Gal4 control and nub >fat HA; fat-GFP animals. Shown are replicates and the mean. There is no significant difference between the two groups as determined by a t-test.
Author response image 1

Tables
Key resources table
| Reagent type (species) or resource | Designation | Source or reference | Identifiers | Additional information |
|---|---|---|---|---|
| Gene (Drosophila melanogaster) | w1118 | Bloomington Drosophila Stock Center | BDSC: 3605 Flybase: FBst0003605 | |
| Gene (Drosophila melanogaster) | E-cadherin-GFP | Bloomington Drosophila Stock Center | BDSC: 60584 Flybase: FBal0247908 | |
| Gene (Drosophila melanogaster) | E-cadherin-mCherry | Bloomington Drosophila Stock Center | BDSC: 59014 Flybase: Fbti0168567 | |
| Gene (Drosophila melanogaster) | fatG-rv | Bloomington Drosophila Stock Center | BDSC: 1894 Flybase: Fbal0004805 | |
| Gene (Drosophila melanogaster) | fat8 | Bloomington Drosophila Stock Center | BDSC: 44257 Flybase: Fbal0004794 | |
| Gene (Drosophila melanogaster) | fjd1 | Bloomington Drosophila Stock Center | BDSC: 6373 Flybase: Fbal0049500 | |
| Gene (Drosophila melanogaster) | fjp1 | Bloomington Drosophila Stock Center | BDSC: 44253 Flybase: Fbal0049503 | |
| Gene (Drosophila melanogaster) | dsUAO71 | Bloomington Drosophila Stock Center | BDSC: 41784 Flybase: Fbal0089339 | |
| Gene (Drosophila melanogaster) | ds33k | Bloomington Drosophila Stock Center | BDSC: 1580 Flybase: Fbal0028155 | |
| Gene (Drosophila melanogaster) | ds-GFP | Brittle et al., 2012 | Flybase: Fbal0344517 | Gift from Ken Irvine |
| Gene (Drosophila melanogaster) | fat-GFP | Hale et al., 2015 | Flybase: Fbal0385338 | Gift from Helen McNeill |
| Gene (Drosophila melanogaster) | UAS-fat-HA | Sopko et al., 2009 | Flybase: Fbal0239166 | Gift from H. McNeill |
| Gene (Drosophila melanogaster) | UAS-ds | Matakatsu and Blair, 2004 | Flybase: Fbal0180099 | Gift from Ken Irvine |
| Gene (Drosophila melanogaster) | UAS-bazooka-mCherry | Bloomington Drosophila Stock Center | BDSC: 65844 Flybase: Fbti0183177 | |
| Gene (Drosophila melanogaster) | UAS-fat(RNAi) | Bloomington Drosophila Stock Center | BDSC: 34970 Flybase: Fbti0144840 | |
| Gene (Drosophila melanogaster) | UAS-ds(RNAi) | Bloomington Drosophila Stock Center | BDSC: 32964 Flybase: Fbti0140473 | |
| Gene (Drosophila melanogaster) | UAS-trol(RNAi) | Bloomington Drosophila Stock Center | BDSC: 29440 Flybase: Fbti0129068 | |
| Gene (Drosophila melanogaster) | UAS-GFP(RNAi) | Bloomington Drosophila Stock Center | BDSC: 9330 Flybase: Fbti0074363 | |
| Gene (Drosophila melanogaster) | UAS-RBF | Bloomington Drosophila Stock Center | BDSC: 50747 Flybase: Fbti0016888 | |
| Gene (Drosophila melanogaster) | ap-Gal4 | Bloomington Drosophila Stock Center | BDSC: 3041 Flybase: Fbti0002785 | |
| Gene (Drosophila melanogaster) | nub-Gal4 | Bloomington Drosophila Stock Center | BDSC: 42699 Flybase: Fbal0277528 | |
| Gene (Drosophila melanogaster) | en-Gal4 | Bloomington Drosophila Stock Center | BDSC: 30564 Flybase: Fbti0003572 | |
| Gene (Drosophila melanogaster) | da-Gal4 | Bloomington Drosophila Stock Center | BDSC: 55850 Flybase: Fbti0013991 | |
| Gene (Drosophila melanogaster) | actin5c-Gal4 | Bloomington Drosophila Stock Center | BDSC: 3954 Flybase: Fbti0012292 | |
| Gene (Drosophila melanogaster) | ds-Trojan-GAL4 | Bloomington Drosophila Stock Center | BDSC: 67432 Flybase: Fbti0186258 | |
| Gene (Drosophila melanogaster) | UAS-GFP-NLS | Bloomington Drosophila Stock Center | BDSC: 4776 Flybase: Fbti0012493 | |
| Gene (Drosophila melanogaster) | 5xQE-dsRed | Zecca and Struhl, 2007 | Flybase: Fbal0219107 | Gift from Gary Struhl |
| Antibody | Mouse monoclonal anti-Wg | Developmental Studies Hybridoma Bank | 4D4 | IF (1:1000) |
| Antibody | Mouse monoclonal anti-En | Developmental Studies Hybridoma Bank | 4D9 | IF (1:15) |
| Antibody | Rat monoclonal anti-E-cadherin | Developmental Studies Hybridoma Bank | Dcad2 | IF (1:10) |
| Antibody | Rat polyclonal anti-Ds | IF (1:1000), Gift from Helen McNeill | ||
| Antibody | Rat monoclonal anti-HA | Roche | IF (1:1000) | |
| Antibody | Rabbit polyclonal anti-PHH3 | Sigma | H0412 | IF (1:400) |
| Antibody | Goat polyclonal anti-Rabbit Alexa Fluor 546 | Invitrogen | A11035 | IF (1:200) |
| Antibody | Goat polyclonal anti-Mouse Alexa Fluor 405 | Invitrogen | A48255 | IF (1:200) |
| Antibody | Goat polyclonal anti-Rat Alexa Fluor 647 | Invitrogen | A48265 | IF (1:200) |
| Other | 18x18 mm number 1.5 coverslip | Zeiss | 474030-9000-000 | Coverslip used in all microscopy experiments, see Methods Immunohistochemstry section |
| Other | 24x60 mm number 1.5 coverslip | VWR | 48393–251 | Coverslip used in all microscopy experiments, see Methods Immunohistochemstry section |
| Chemical compound, drug | Vectashield Plus | Vector Labs | H-1900 | |
| Chemical compound, drug | 4′,6-diamidino-2-phenylindole (DAPI) | Life Technologies | D1306 | |
| Chemical compound, drug | Triton X-100 | Sigma Aldrich | T9284-500ML | |
| Chemical compound, drug | Paraformaldehyde (powder) | Polysciences | 00380–1 | |
| Software, algorithm | ImSAnE 1.0 MATLAB software | Heemskerk and Streichan, 2015; Heemskerk, 2021 | https://github.com/idse/imsane | |
| Software, algorithm | Trained CNN model for pixel classification of epithelial fluorescence confocal data | Gallagher et al., 2022 | https://drive.google.com/drive/folders/1I-nRpn1esRzs5t4ztgbNvkBQuTN2vT7L?usp=sharing | |
| Software, algorithm | MATLAB pipeline to estimate larval volume | This paper; copy archived at Liu, 2023b | https://github.com/andrewliu321/LarvaSeg | |
| Software, algorithm | MATLAB pipeline to measure protein fluorescent intensity in the wing pouch | This paper; copy archived at Liu, 2023a | https://github.com/andrewliu321/ProteinIntensity |
Table 1
Summary statistics of linear regressions.
| Total Cell Number = β0 + β1Pouch Volume | ||||
|---|---|---|---|---|
| Genotype | β0 | β1 | R2 | p |
| nub-Gal4 | 352.0±187.7 | 7261.3±355.2 | 0.95 | 8.43E-16 |
| nub >ds(RNAi) | 653.9±191.0 | 4533.5±221.5 | 0.95 | 8.19E-16 |
| nub-Gal4 | 637.3±200.9 | 4793.3±269.5 | 0.96 | 5.24E-11 |
| fat-GFP; nub >fat(RNAi) | 648.3±319.9 | 4359.0±364.3 | 0.91 | 4.50E-9 |
| nub >fat HA | 2321.5±324.4 | 5212.9±516.4 | 0.80 | 2.65E-10 |
| ds-Gal4 | –1875±3,293 | 7726±2970 | 0.63 | 0.059 |
| ds >ds | 725.9±1688.4 | 4839.7±1382.3 | 0.58 | 0.0067 |
Additional files
Download links
A two-part list of links to download the article, or parts of the article, in various formats.
Downloads (link to download the article as PDF)
Open citations (links to open the citations from this article in various online reference manager services)
Cite this article (links to download the citations from this article in formats compatible with various reference manager tools)
Scaling between cell cycle duration and wing growth is regulated by Fat-Dachsous signaling in Drosophila
eLife 12:RP91572.
https://doi.org/10.7554/eLife.91572.3


