The role of Imp and Syp RNA-binding proteins in precise neuronal elimination by apoptosis through the regulation of transcription factors
- Institut de Génomique Fonctionnelle de Lyon, ENS de Lyon, CNRS, Univ Lyon 1, France
- Laboratoire Reproduction et Développement des Plantes, ENS de Lyon, France
Figures
Figure 1
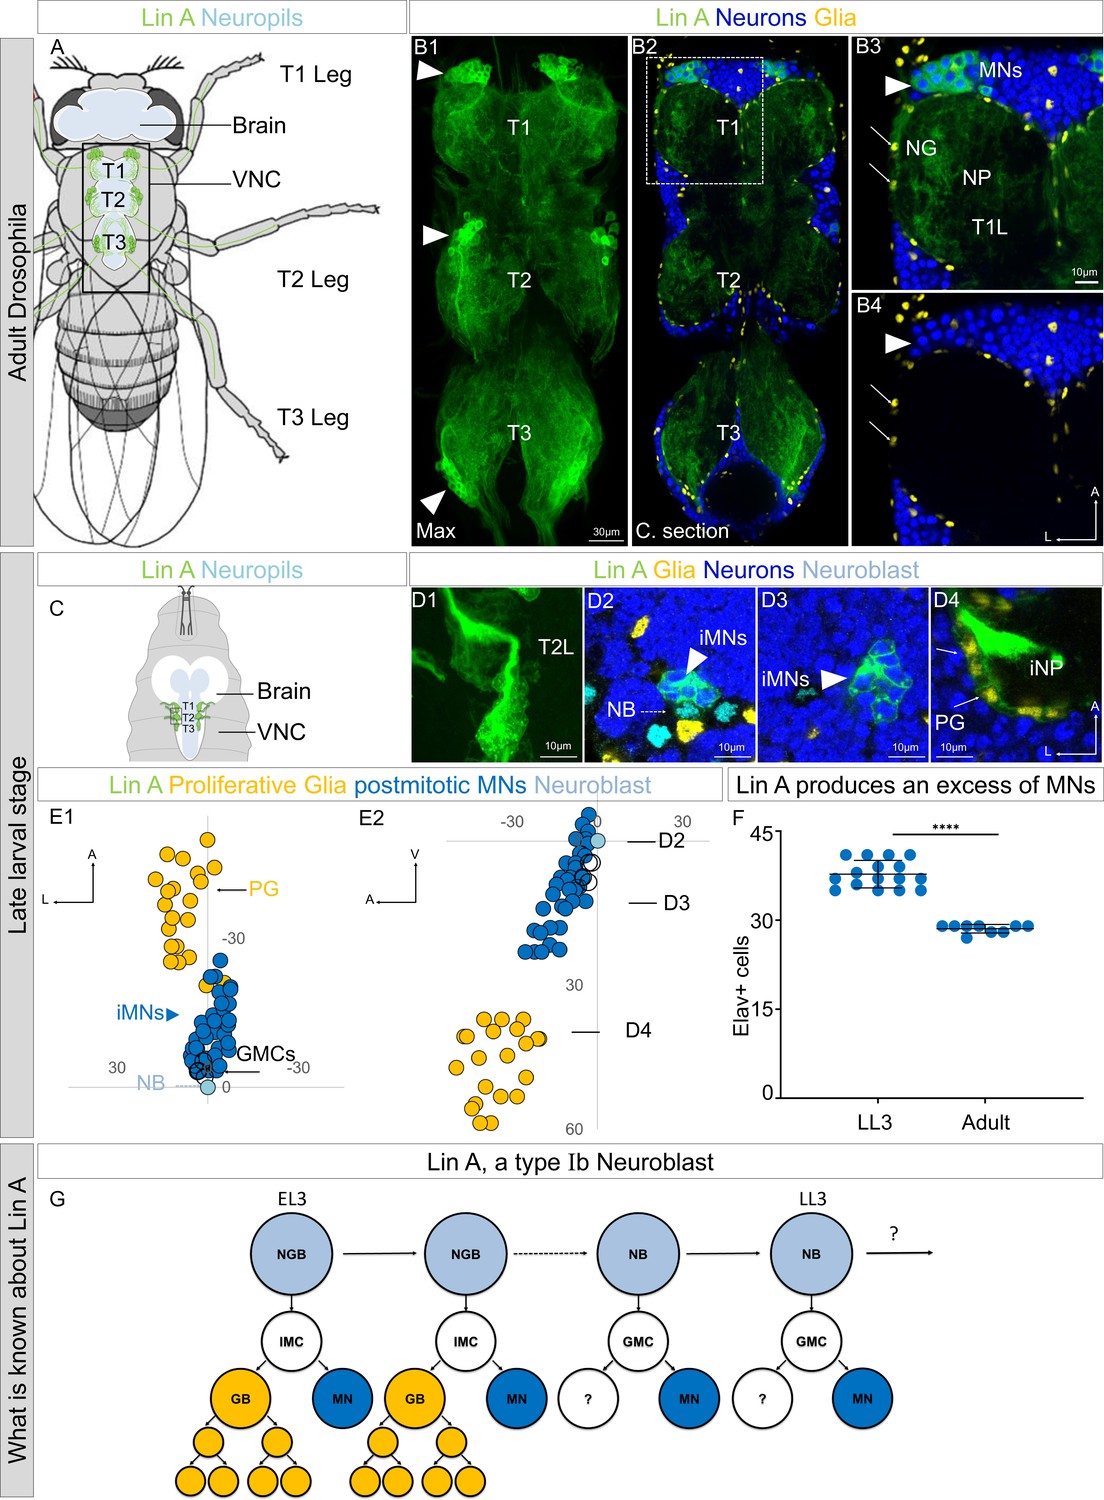
Lin A/15 as model to study how a stereotyped number of neurons is produced by an NB.
(A) Drawing of an adult fly showing the position of the central nervous system (CNS) (white (cortex), blue (neuropiles)) and Lin A/15 leg MNs (green cell bodies and dendrites in the VNC and axons in the legs). Black box indicates the VNC imaged in (B). VNC: ventral nerve cord. (B1) Maximum projection of confocal sections of an adult VNC where the six Lin A/15s are genetically labeled with mCD8::GFP (green). (B2) Confocal section of the VNC in (B1) immunostained with anti-Elav (neuronal marker, blue) and anti-Repo (glia marker, yellow). T1, T2, and T3 indicate the Prothoracic, Mesothoracic, and Metathoracic neuromere, respectively. (B3, B4) Confocal section of first left prothoracic neuromere (T1L) (the boxed region in B2), arrowheads and arrows indicate Lin A/15 MN and glia cell bodies, respectively. NG: neuropile glia; NP: neuropile; MN: motor neuron. (C) Drawing of the anterior region of a third instar larva showing the position of the CNS (white (cortex) blue (neuropiles)) and immature Lin A/15 leg MNs (green). (D1) Maximum projection of confocal sections of the second left thoracic hemisegment (T2L) where Lin A/15 is genetically labeled with mCD8::GFP (green). (D2–D4) Confocal section of the second left thoracic hemisegment (T2L) in (D1) immunostained with anti-Elav (neuronal marker, blue), anti-Dpn (NB marker, cyan), and anti-Repo (glia marker, yellow). Arrowheads, doted arrows and arrows indicate immature Lin A/15 MNs (iMNs), Lin NB and Lin A/15 proliferative glia (PG), respectively. iNP: immature neuropile. (E1, E2) Plots of the relative position of each Lin A/15 cell from two perspectives: E1 ventral view, E2 lateral view. Axes: Anterior (A), Lateral (L), Ventral (V). Lin A proliferative glia (PG) are in yellow, Lin A/15 iMNs are in blue, Lin A/15 GMCs are in white and Lin A/15 NB is in cyan. Arrows indicate the positions of the confocal sections in (D2–D4). (F) Graph of the number of Elav+ MNs in a late third instar larva (LL3) versus that in an adult fly. Error bars represent standard deviations. Student’s t test was performed to compare the difference between indicated groups. ****, P ≤ 0.0001. (G) Schematic of the Lin A/15 type Ib division. NGB: neuroglioblast, NB: neuroblast, IMC: intermediate mother cell, GMC: ganglion mother cell, GB: glioblast, MN: motoneuron. Note 1: The destiny of the MN sister cell during the second phase of division is unknown. Note 2: Lin A/15 development has not been studied during pupal stages.
Figure 2
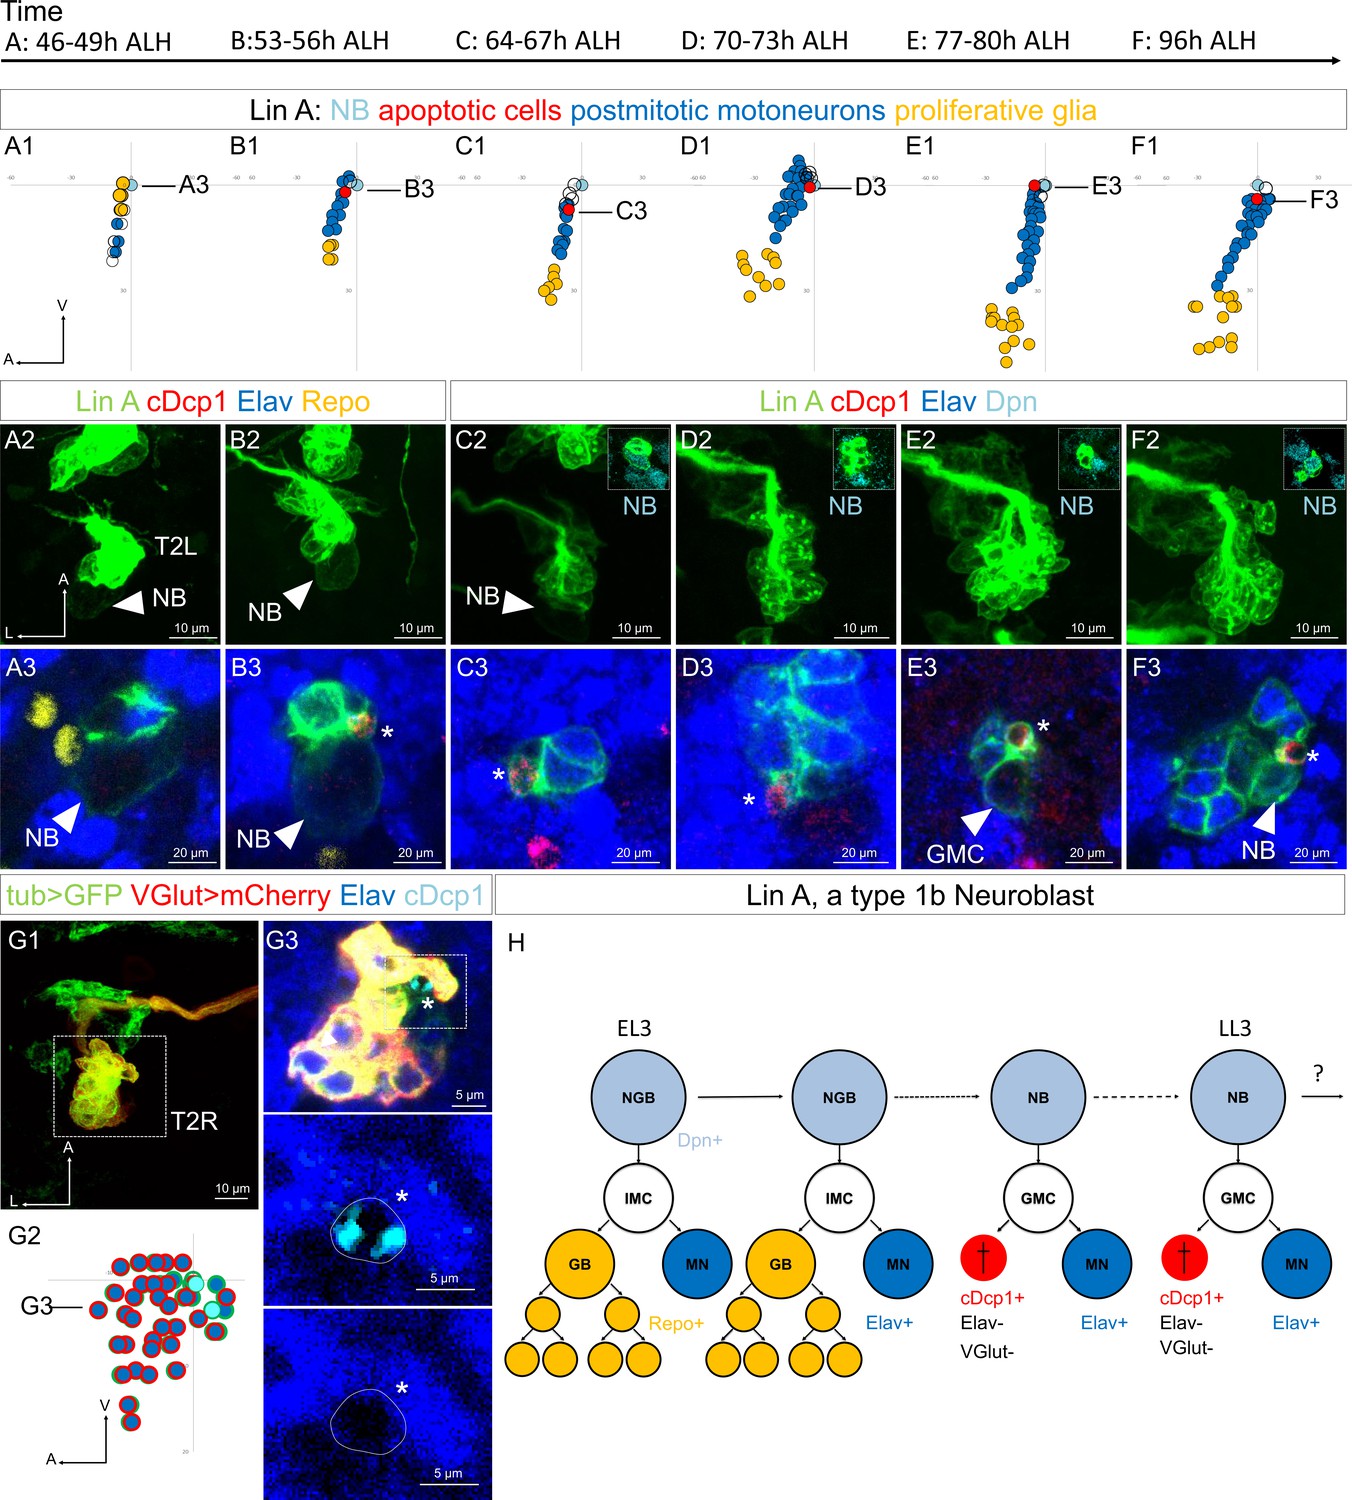
The MN sibling cells die through programmed cell death (PCD) during the second phase of Lin A/15 NB division.
(A1–F3) Graphs and confocal images showing the development of Lin A/15 during larval stages, the developmental time points are indicated on top. (A1, B1, C1, D1, E1, F1): Graphs of the relative position of each Lin A/15 cell in (A3, B3, C3, D3, E3, F3) from a lateral perspective. Axes: Anterior (A), Ventral (V). Lin A/15 proliferative glia are in yellow, Lin A/15 immature MNs are in blue, Lin A/15 GMCs are in white, Lin A/15 NB is in cyan, Lin A/15 cDcp1+ cells are in red. The black lines indicate the positions of the confocal section in (A3–F3). (A2, B2, C2, D2, E2, F2): Maximum projection of confocal sections of the second left thoracic hemisegment (T2L) where Lin A/15 is genetically labeled with mCD8::GFP (green). The boxes in (C2–F2) are confocal sections showing Lin A/15 NB immunostained with anti-Dpn (cyan). Note: In A2–B2, the NB is easily recognizable by its size (arrowheads). (A3, B3, C3, D3, E3, F3): are magnified confocal sections of samples in (A2, B2, C2, D2, E2, F2) immunostained with anti-cDcp1(red), anti-Elav (neuronal marker, blue) and anti-Repo (glia marker, yellow) (A2, B2) or with anti-Dpn (NB marker, cyan) (C2, D2, E2, F2). Asterisk in (B3, C3, D3, E3, F3) indicate of the cDcp1+ Elav− apoptotic cell. (G1) Maximum projection of confocal sections of a second right thoracic hemisegment (T2R) with a Lin A/15 MARCM clone genetically labeled with mCD8::GFP (green) under the control of tub-Gal4 and mCherry (red) under the control of VGlut-LexA::GAD. (G3) Confocal section of the second right thoracic hemisegment (T2R) (boxed region in G1) immunostained with anti-Elav (blue) and anti-cDcp1 (cyan). The arrowheads indicate the cDcp1+ Elav− VGlut− apoptotic cell. (G2) Graph of the relative position of each Lin A/15 cell (excluding the proliferative glia) in (G1) from a lateral perspective. Axes: Anterior (A), Lateral (L), Ventral (V). Lin A/15 immature MNs are in blue (Elav+), the blue cells surrounded in red are the GFP+ Elav+ VGlut+ immature MNs, the blue cells surrounded in green are the GFP+ Elav+ VGlut− immature MNs (last-born MNs) and the cyan cells surrounded in green are the cDcp1+ GFP+ VGlut− Elav− apoptotic cell. Note: The NB (white cell surrounded in green) has been identified by its size. The black line indicates the position of the confocal section in (G2). (G3) Confocal section of the second right thoracic hemisegment (T2R) (boxed region in G1) immunostained with anti-Elav (blue) and anti-cDcp1 (cyan). The arrowheads indicate the cDcp1+ Elav− VGlut− apoptotic cell. (H) Schematic of the Lin A/15 type Ib division. NGB: neuroglioblast, NB: neuroblast, IMC: intermediate mother cell, GMC: ganglion mother cell, GB: glioblast, MN: motoneuron. The markers used to label each type of Lin A cells are indicated.
Figure 3 with 3 supplements
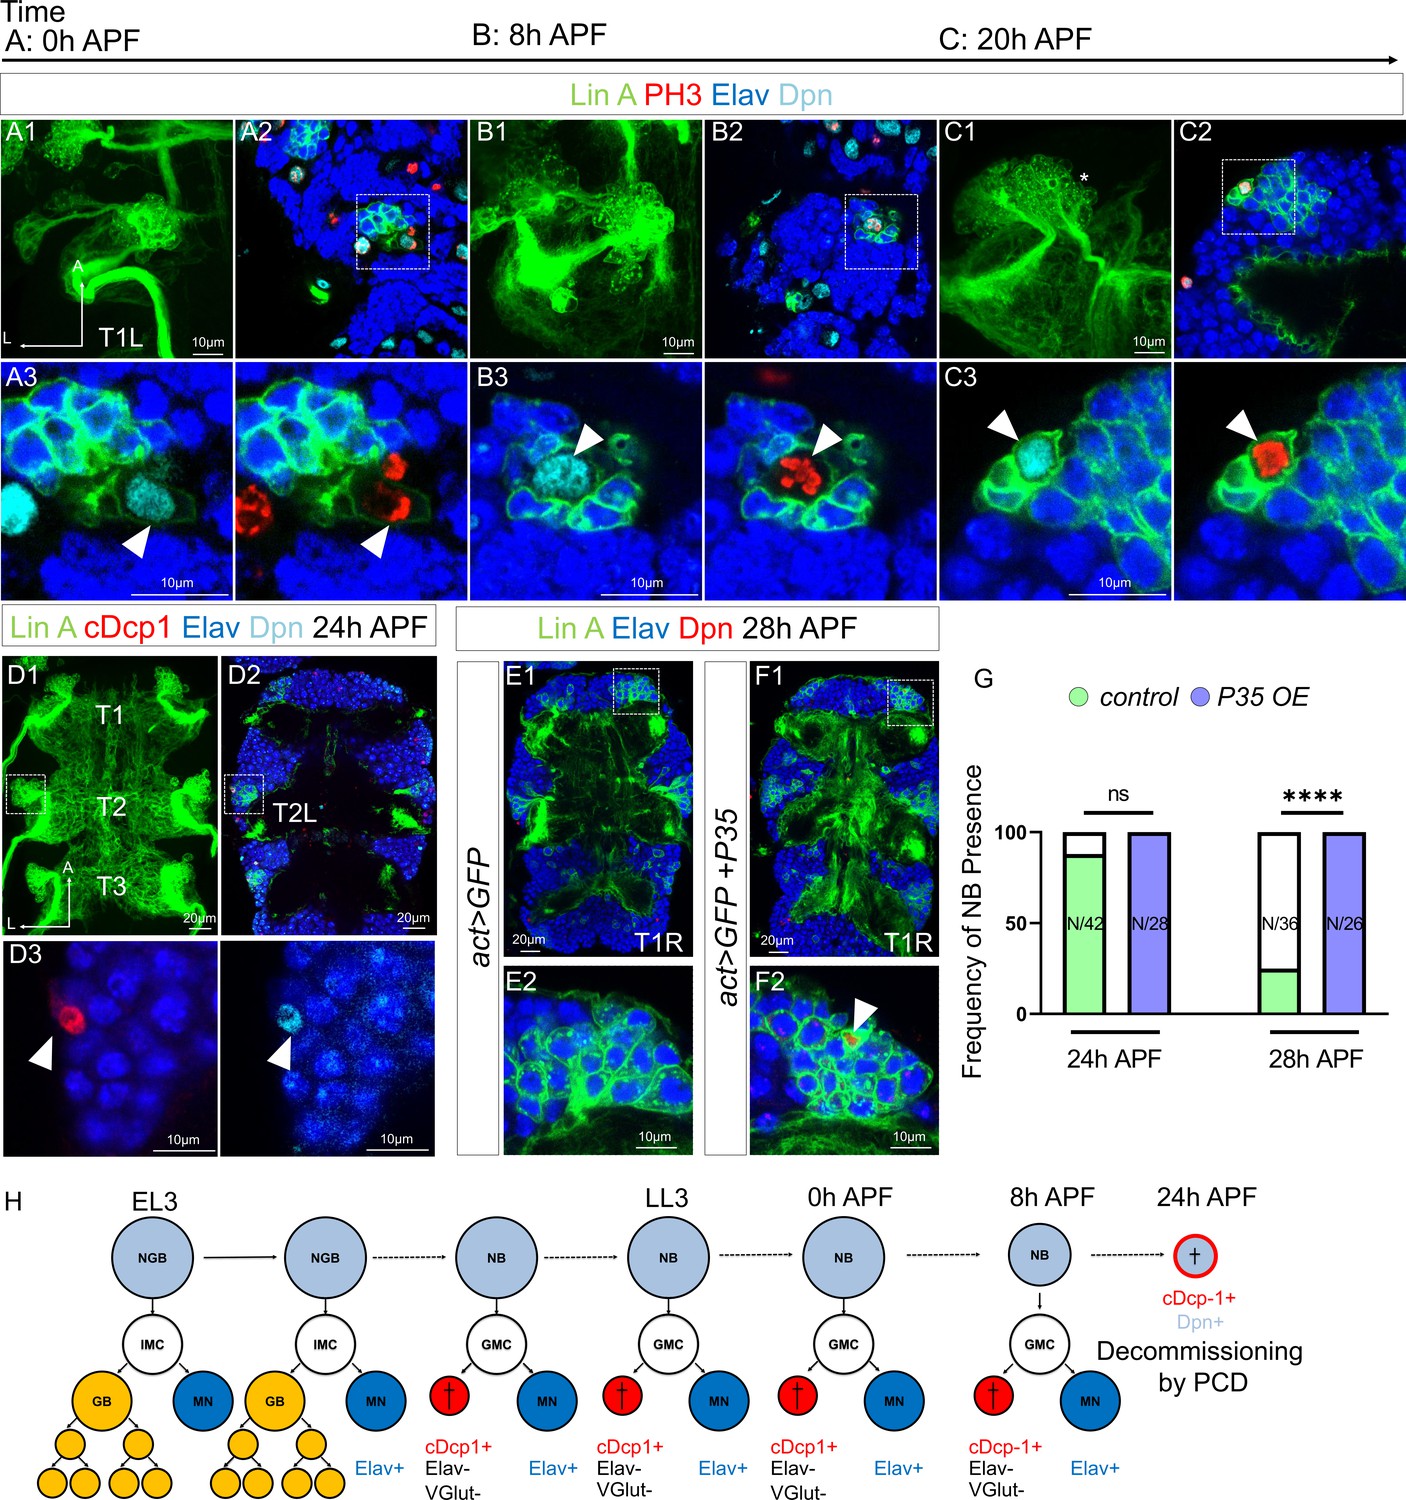
Lin A/15 NB decommissions at 24 hr APF through programmed cell death (PCD).
(A1–C3) Confocal images showing the development of Lin A/15 during pupal stages, the developmental time points are indicated on top. APF: after pupa formation. (A1, B1, C1) Maximum projection of confocal sections of the first left thoracic hemisegment (T1L) where Lin A/15 is genetically labeled with mCD8::GFP (green). (A2, B2, C2) Confocal sections showing Lin A/15 immunostained with anti-Elav (blue), anti-Dpn (cyan), and anti-pH3 (red, phospho-Histone3), mitosis-specific marker (A3, B3, C3) magnifications of the boxed region in (A2, B2, C2). Arrowheads indicate the proliferative Lin A/15 NBs (Dpn+ pH3+). (D1) Maximum projection of confocal sections of three thoracic ganglions (T1, T2, T3) at 24 hr APF where all six Lin A/15s are genetically labeled with mCD8::GFP (green). (D2) Confocal section of thoracic ganglions in (D1) immunostained with anti-Elav (blue), anti-Dpn (cyan), and anti-cDcp1 (red). (D2) Magnifications of the boxed region in (D2) (left Mesothoracic neuromere, T2L). Arrowheads indicates the apoptotic Lin A/15 NB (Dpn+ cDcp1+). (E1–F1) Confocal images showing the absence vs presence of Lin A/15 NB at 28 hr APF in Control vs P35 overexpression (OE) conditions. Six Lin A/15s are genetically labeled with mCD8::GFP (green), Lin A/15 NB and MNs are visualized with anti-Dpn (red) and anti-Elav (blue), respectively. (E2–F2) Magnifications of the boxed region in (E1–F1) (first right thoracic hemisegment, T1R) indicate the presence of NB (Dpn+, arrowhead) in P35 OE condition. (G) Graph of the frequency of NB presence (number of Lin A/15 samples analyzed is indicated within each bar) at different developmental time points under different genetic conditions: absence of NB (white), NB presence in Control (green), NB presence in P35 OE (purple). Student’s t test was performed to compare the difference between indicated groups. ns, P > 0.05, considered not significant; ****, P ≤ 0.0001. (H) Schematic of the Lin A/15 type Ib division during larval and pupal stages. NGB: neuroglioblast, NB: neuroblast, IMC: intermediate mother cell, GMC: ganglion mother cell, GB: glioblast, MN: motoneuron. The markers used to label each type of Lin A/15 cells are indicated.
Figure 3—figure supplement 1
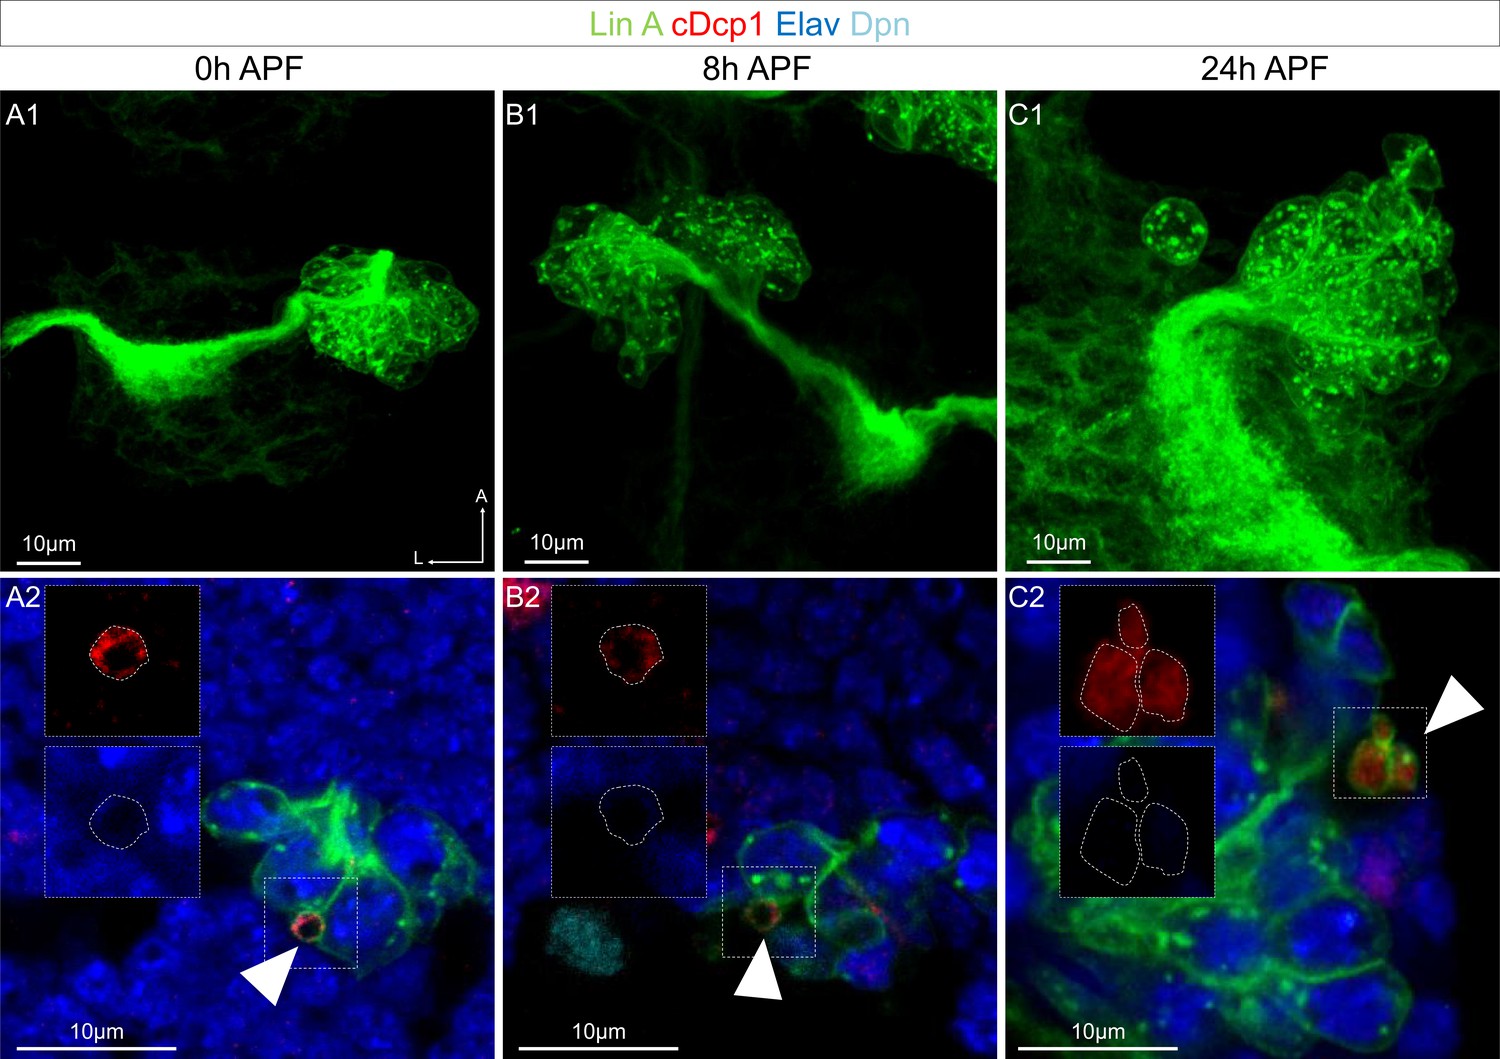
The motoneuron (MN) sibling cells die through programmed cell death (PCD) during the second phase of Lin A/15 neuroblast (NB) division.
(A1–C2) Lin A/15 during pupal stages: 0 hr APF (A1, A2), 8 hr APF (B1, B2), and 24 hr APF (C1, C2). (A2, B2, C2) Maximum projection of confocal sections of the third left (T3L) (A1), first right (T1R) (B1), and second right (T2R) (C1) thoracic hemisegments where Lin A/15 is genetically labeled with mCD8::GFP (green). (A2, B2, C2) Confocal sections of the corresponding Lin A/15 in (A1, B1, C1) immunostained with anti-cDcp1 (red), anti-Elav (neuronal marker, blue), and anti-Dpn (NB marker, cyan), boxed region showing the dying sibling cells (Elav−, cDcp1+), indicated with arrowheads.
Figure 3—figure supplement 2

The volume of the Lin A/15 neuroblast (NB) continuously decrease during development.
Graph of the volume of the Lin A/15 NB at different time point. x axis: different time points during. larval and pupal stages, y axis: volume of the NB in nm3. Error bars represent standard deviations. Each data point represents an individual neuroblast.
Figure 3—figure supplement 3
Lin A/15 neuroblast (NB) does not enter into autophagy.
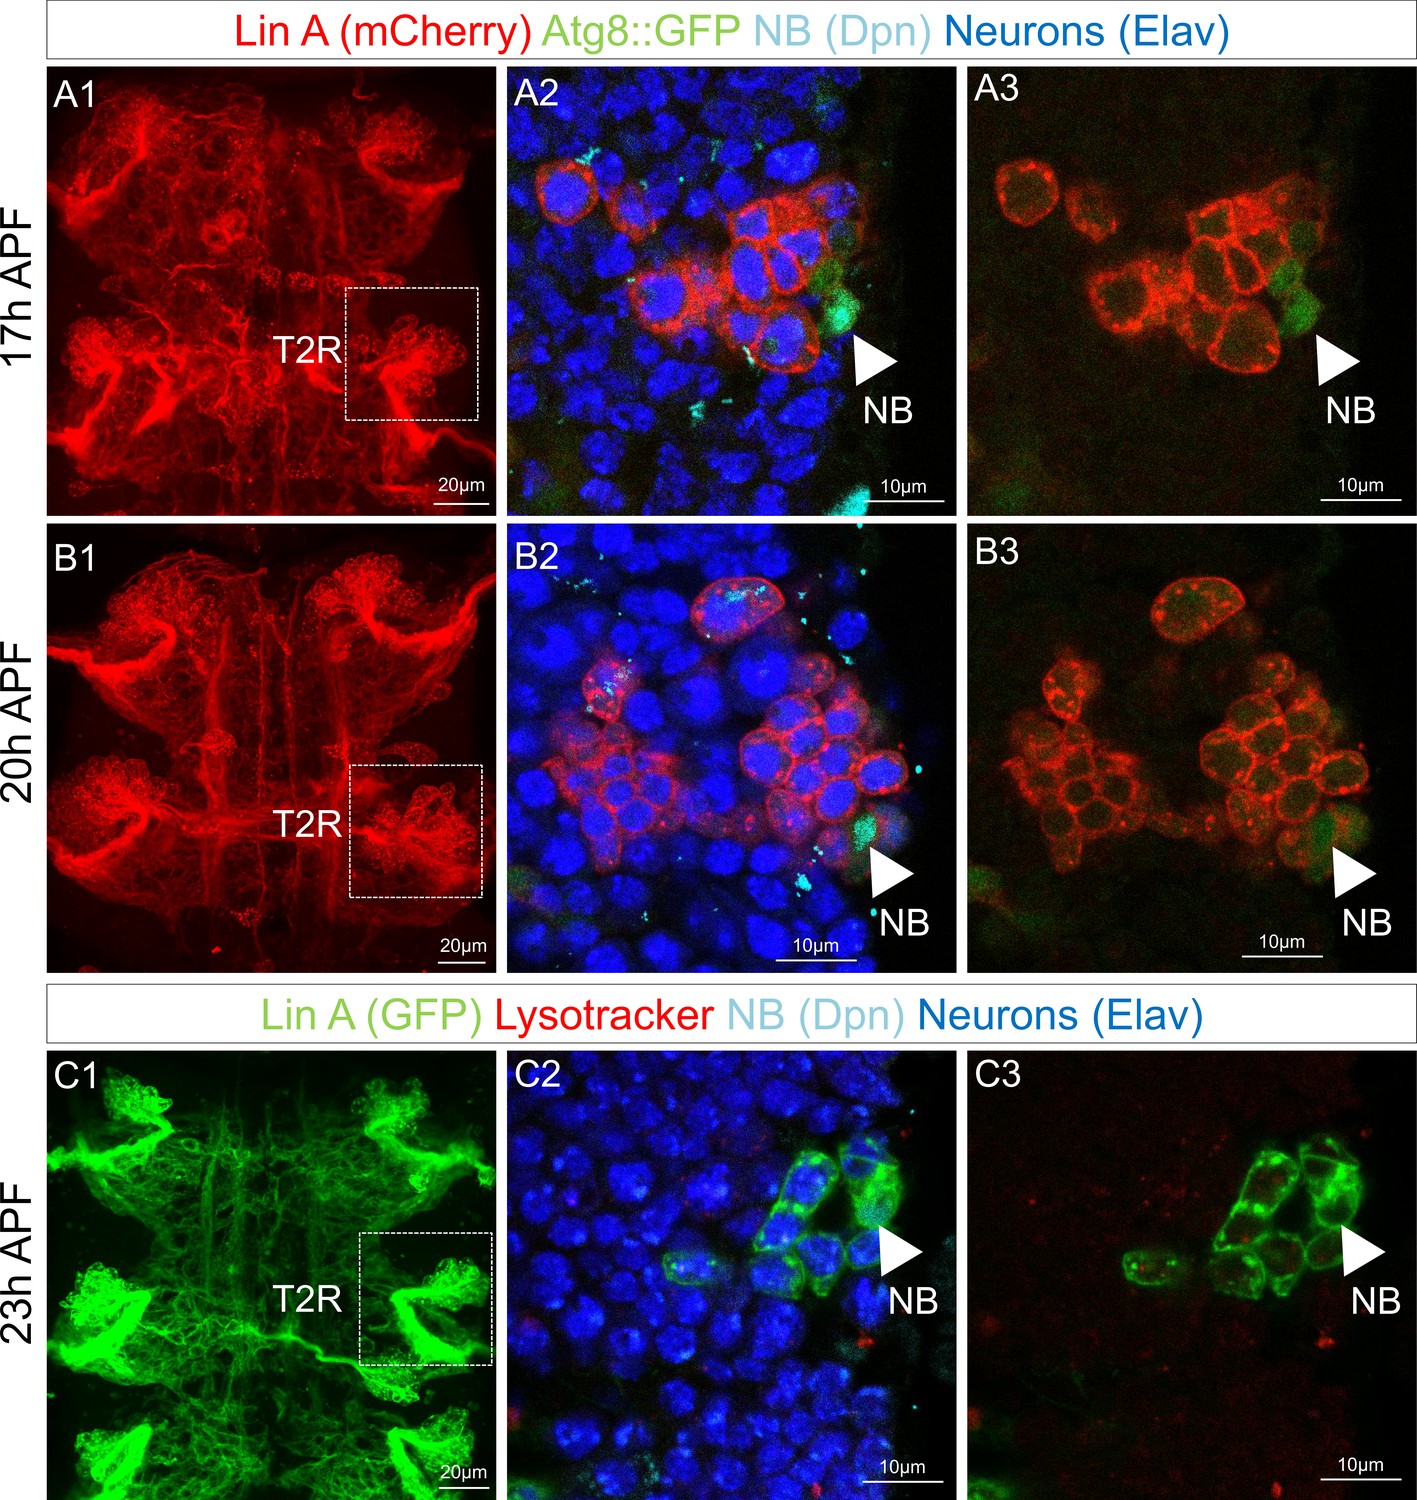
(A1–B3) Lin A/15 during pupal stages: 17 hr APF (A1–A3) and 20 hr APF (B1–B3). (A1, B1) Maximum projection of confocal sections of the first two thoracic hemisegments where Lin A/15 is genetically labeled with mCherry (red). (A2, A3, B2, B3): Confocal sections of the boxed regions in (A1, B1) corresponding to the second right thoracic hemisegment (T2R). Lin A/15 is inmunostained with anti-Elav (neuronal marker, blue) and anti-Dpn (NB marker, cyan) and genetically labeled with Atg8::GFP. Arrowheads indicate the NBs. (C1–C3) Lin A/15 at 23 hr APF. (C1) Maximum projection of confocal sections of the first two thoracic hemisegments where Lin A/15 is genetically labeled with GFP (green). (C1–C3): Confocal sections of the boxed regions in (C1) corresponding to the second right thoracic hemisegment (T2R). Lin A/15 is immunostained with anti-Elav (neuronal marker, blue) and anti-Dpn (NB marker, cyan) and labeled with Lysotracker. Arrowheads indicate the NBs.
Figure 4
Opposite temporal expression of Imp and Syp in Lin A/15 neuroblast (NB).
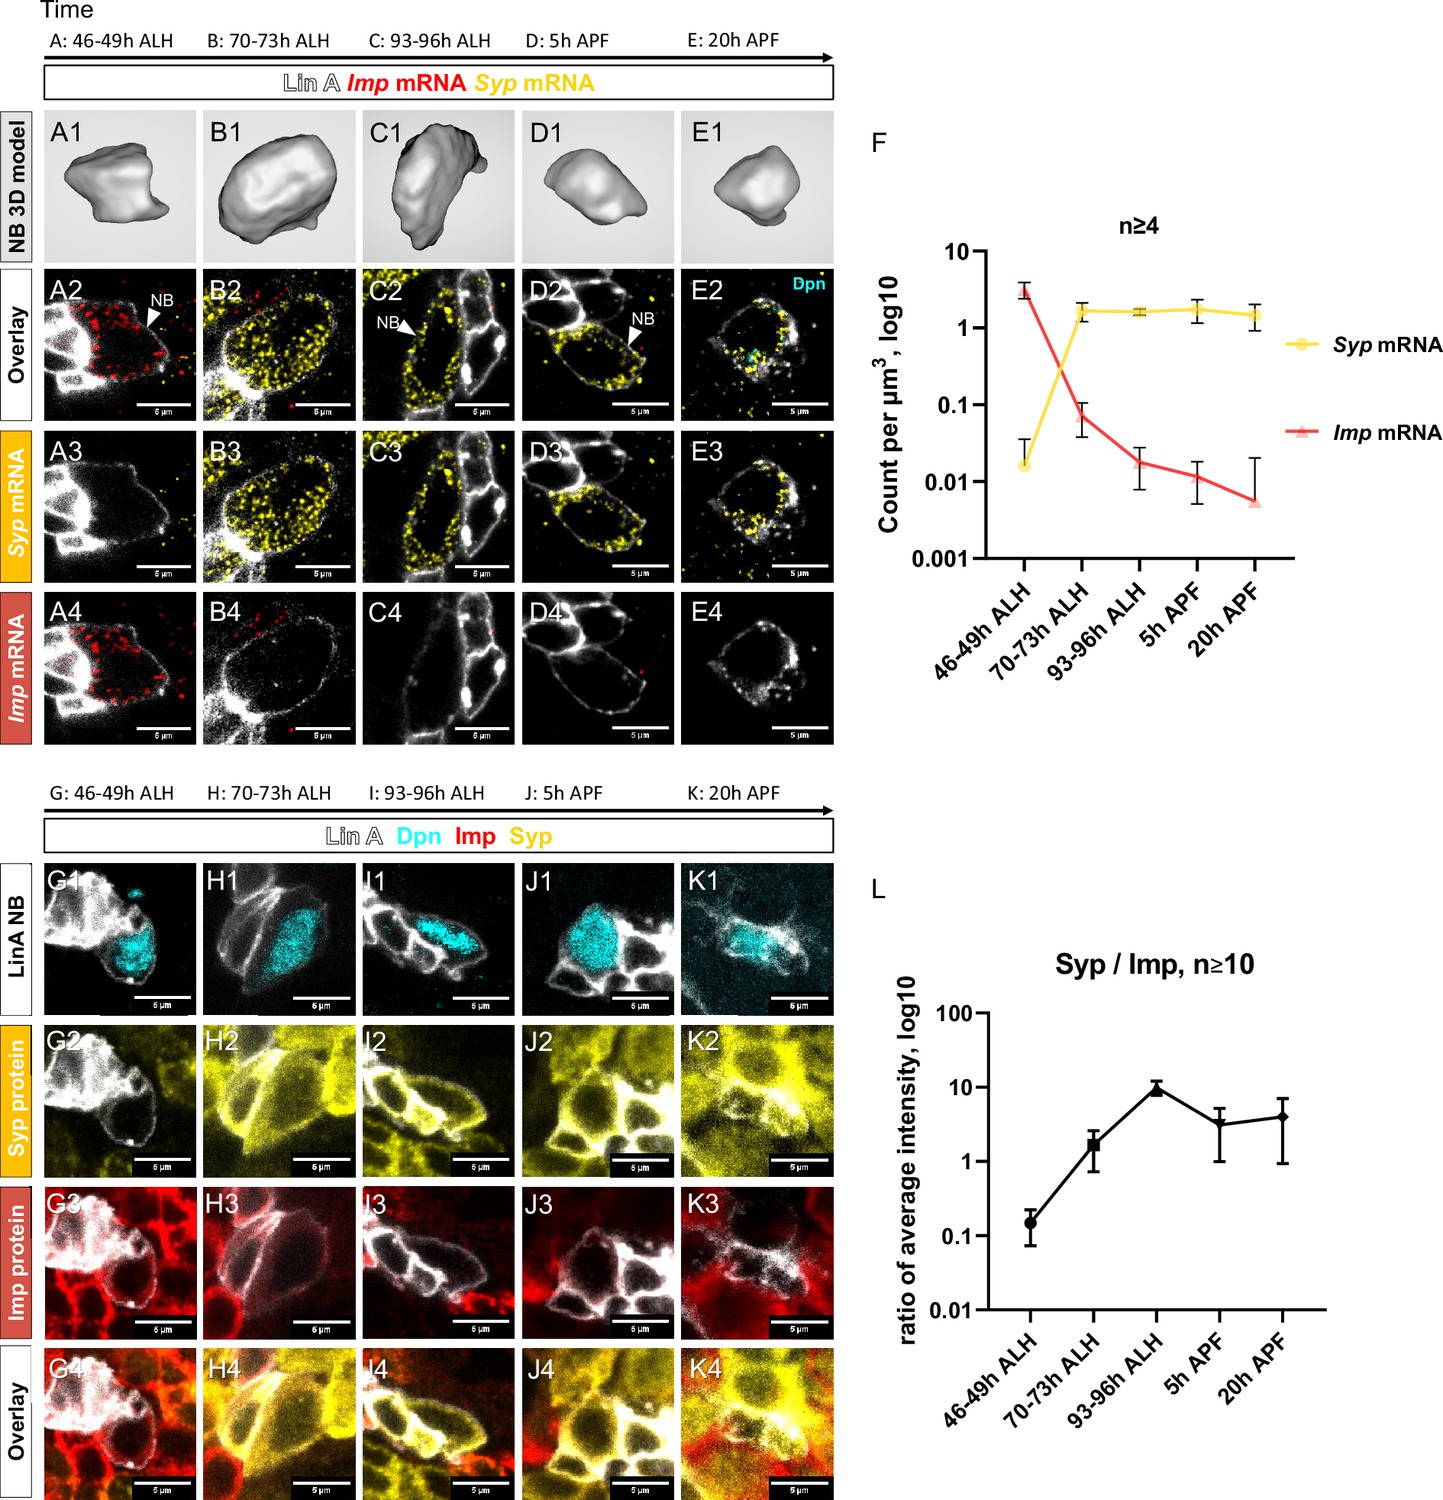
(A1–F) smFISH of Imp (red) and Syp (yellow) mRNA in Lin A/15 NB labeled with GFP (white) at different time points during development. (A1, B1, C1, D1, E1) 3D renderings of Lin A/15 NB segmentations used to quantify total numbers of Imp (red) and Syp (yellow) mRNA. (A2–A4, B2–B4, C2–C4, D2–D4, E2–E4) confocal sections. (F) Graph of Imp and Syp mRNA concentrations in Lin A/15 NB at different time points (n ≥ 4 for each time point). Error bars represent standard deviations. Note: The Lin A/15 GFP+ NB is recognized based on its large size. Because the NB size decreases drastically in the pupal stage, smFISH against dpn (cyan) was performed at 20 hr APF to recognize Lin A/15 NB (E2–E4). (G1–L) Co-immunostaining of Imp (red), Syp (yellow), and Dpn (NB marker, cyan) protein in Lin A/15 NB labeled with GFP (white) at different time points during development. (G1–K4) Confocal sections. (L) Graph of relative expression levels of Imp and Syp protein in Lin A/15 NB at different time points, represented by relative ratios of staining intensity values measured in ImageJ (n ≥ 10 for each time point). Error bars represent standard deviations. The developmental time points are indicated on the top of each panel. All scale bars are 5 µm.
-
Figure 4—source data 1
(4F) smFISH quantification: Imp and Syp RNA counts and neuroblast volumes.
- https://cdn.elifesciences.org/articles/91634/elife-91634-fig4-data1-v1.xlsx
-
Figure 4—source data 2
(4L) Immunostaining quantification: Imp and Syp staining signals in neuroblasts.
- https://cdn.elifesciences.org/articles/91634/elife-91634-fig4-data2-v1.xlsx
Figure 5
Opposite temporal expressions of Imp/Syp control the timing of Lin A/15 neuroblast (NB) decommissioning.
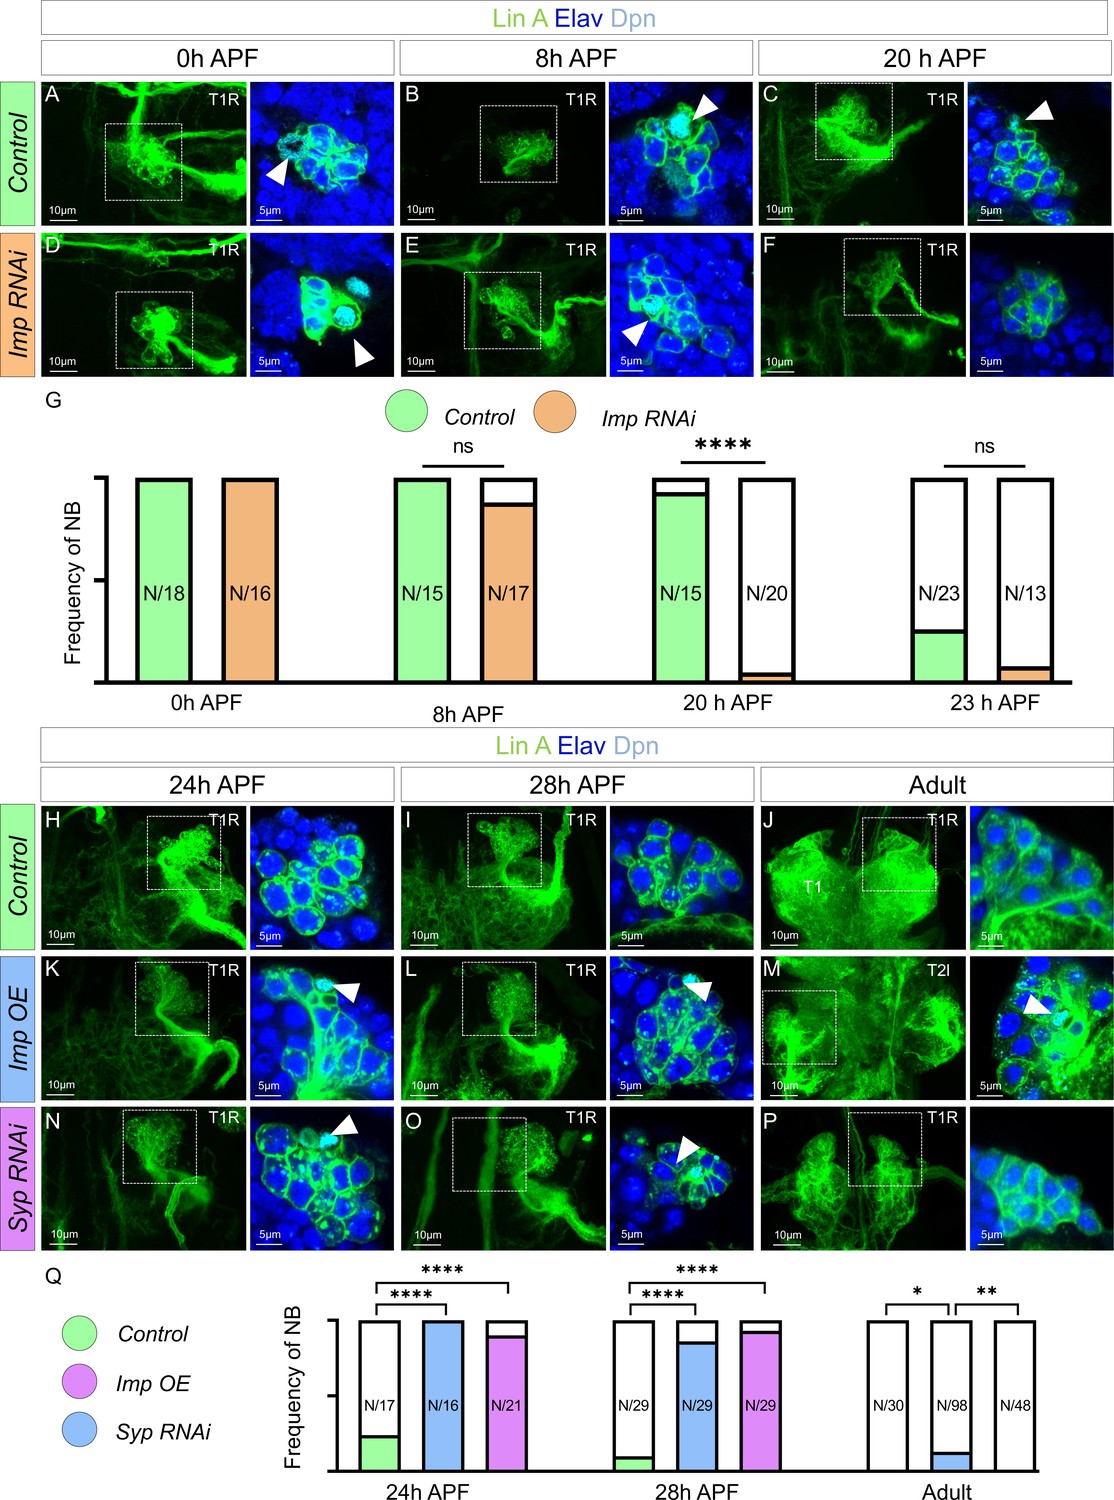
Confocal images showing the development of WT (A–C), Imp RNAi (D–F), from pupal stages until the adult stage. Left: Maximum projection of confocal sections of Lin A/15 genetically labeled with mCD8::GFP (green); right: Confocal sections of the boxed regions immunostained with anti-Elav (neuronal marker, blue) and anti-Dpn (NB marker, cyan). The developmental time points are indicated on the top of each panel. Arrowheads indicate the presence of NB (Dpn+). (G) Graph of the frequency of NB presence (number of Lin A/15 samples analyzed is indicated on each bar) at different developmental time points under different genetic conditions: absence of NB (white), NB presence in Control (green), and NB presence in Imp RNAi (orange). Student’s t test was performed to compare the difference between indicated groups. ns, P > 0.05, considered not significant. ****, P ≤ 0.0001. Confocal images showing the development of WT (H–J), Imp OE (K–M), and Syp RNAi Lin A/15 (N–P) from pupal stages until the adult stage. Left: Maximum projection of confocal sections of Lin A/15 genetically labeled with mCD8::GFP (green); right: Confocal sections of the boxed regions immunostained with anti-Elav (neuronal marker, blue) and anti-Dpn (NB marker, cyan). The developmental time points are indicated on the top of each panel. Arrowheads indicate the presence of NB (Dpn+). (Q) Graph of the frequency of NB presence (number of Lin A/15 samples analyzed is indicated on each bar) at different developmental time points under different genetic conditions: absence of NB (white), NB presence in Control (green), NB presence in Imp RNAi (orange), NB presence in Imp OE (blue), and NB presence in Syp RNAi (purple). Student’s t test was performed to compare the difference between indicated groups. *, P ≤ 0.05; **, P ≤ 0.01; ****, P ≤ 0.0001.
Figure 6
The last-born Lin A/15 MNs are eliminated by programmed cell death (PCD) during early pupal stages.
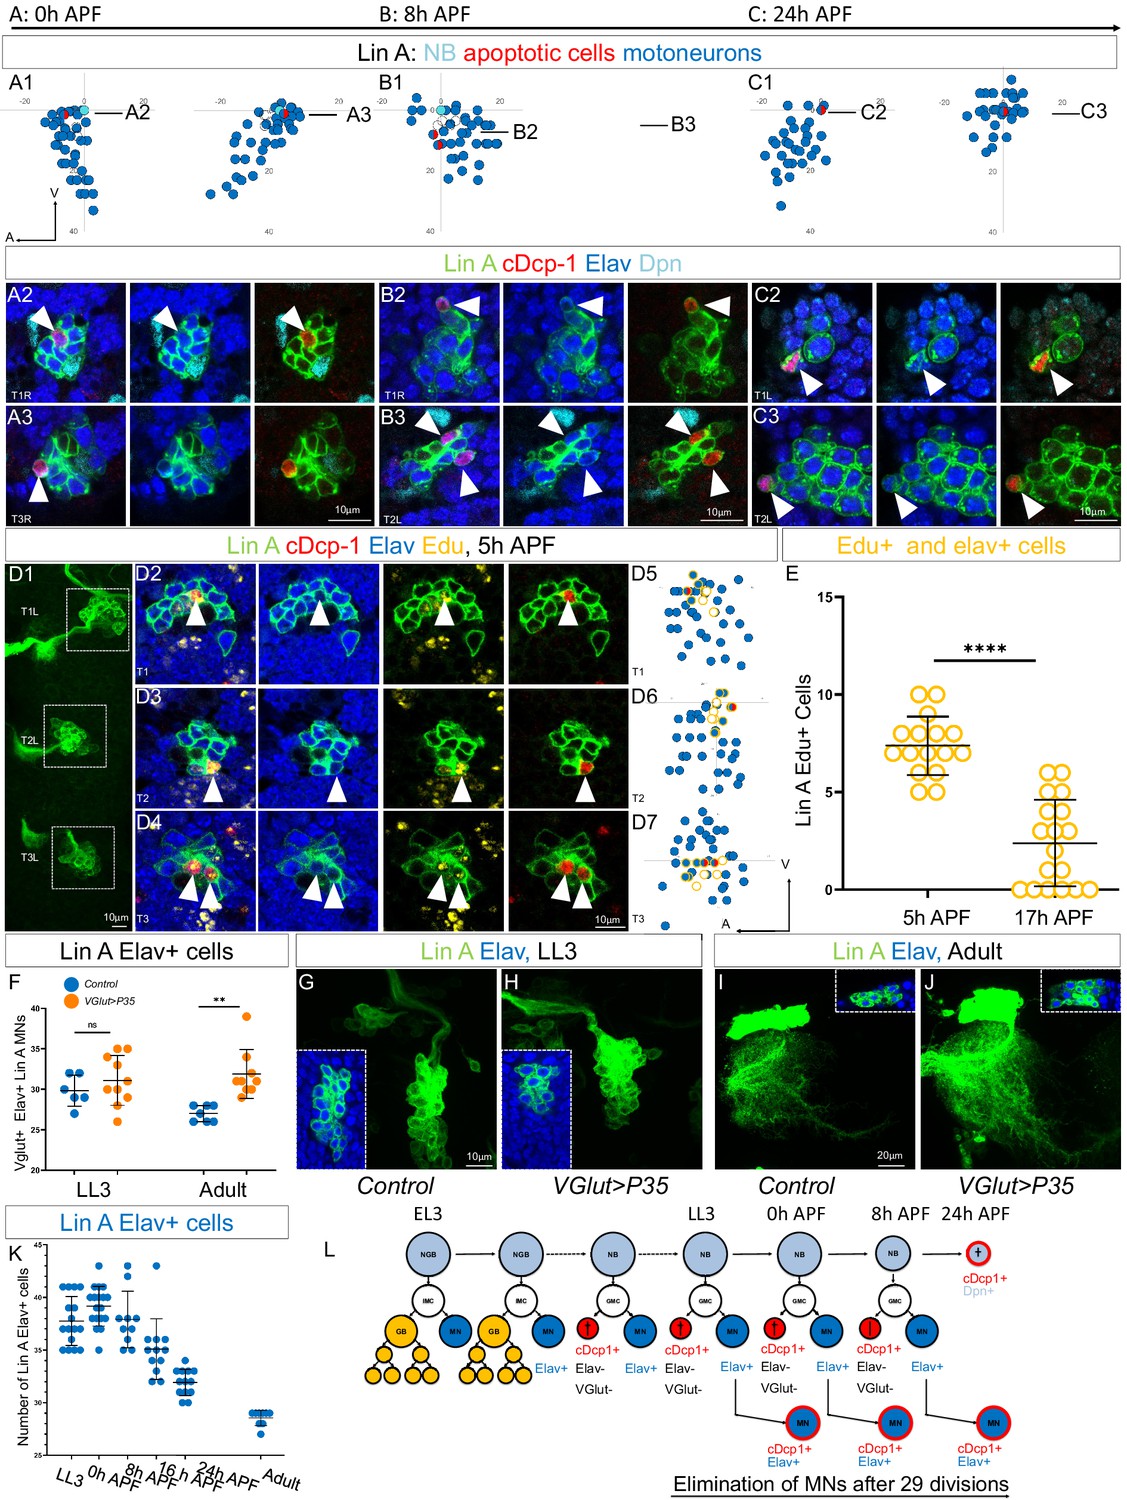
(A1–C3) Graphs and confocal images showing the PCD pattern in Lin A/15 MNs during pupal stages, the developmental time points are indicated on top. (A1, B1, C1) Graphs of the relative position of each Lin A/15 cell of the boxed regions in (A2, B2, C2) from a lateral perspective. Axes: Anterior (A), Ventral (V). Lin A/15 immature MNs are in blue, Lin A/15 GMCs are in white, Lin A/15 NB is in cyan, and cDcp1+ MNs are in red and blue. The black lines indicate the positions of the confocal sections in (A3, A4, B3, B4, C3, C4). (A2–C3) Confocal sections of Lin A/15 genetically labeled with mCD8::GFP (green). The confocal sections showing the Elav+, cDcp1+ cells immunostained with anti-Dpn (cyan), anti-Elav (blue), and anti-cDcp1 (red) are indicated in (A1, B1, C1). Arrowheads indicate the apoptotic MNs (Elav+, cDcp1+). (D1) Maximum projection of confocal sections of three left thoracic hemisegments at 5 hr APF where Lin A/15 is genetically labeled with mCD8::GFP (green). (D2, D3, D4) Confocal sections of the three left thoracic hemisegments (boxed regions in (E1)) immunostained with anti-cDcp1(red), anti-Elav (neuronal marker, blue), and 5-ethynyl-2′deoxyuridine (Edu) (yellow). Arrowheads indicate the Elav+, cDcp1+ Edu+ cells. Note: the larvae were fed with Edu from 74 to 96 hr after larval hatching (ALH) to label only the last-born motoneurons with Edu (close to the NB). The cDcp1+ Elav+ cells are always Edu+. (D5, D6, D7) Graphs of the relative position of each Lin A/15 cell of the boxed regions in (D1) from a lateral perspective. Axes: Anterior (A), Ventral (V). Lin A/15 immature MNs are in blue, Lin A/15 GMCs are in white, Lin A/15 NB is in cyan, and Elav+, cDcp1+ cells are in red and blue, Edu+ cells are circled in yellow. Note: The last-born MNs and the GMCs as well as NB are all Edu+ (circled yellow) and the apoptotic Elav+ cDcp1+ cells are always part of this population of Edu+ cells demonstrating that the last-born MNs are dying. (E) Graph of the number of Edu+ Lin A/15 MNs at 5 and 17 hr APF, of which larvae are fed with Edu from 74 to 96 hr ALH. Note: The number of Edu+ cells neurons decrease significantly between 5 and 17 hr APF demonstrating that the last-born MNs are eliminated. n = 16. (F) Graph of the number of Elav+ VGlut+ Lin A/15 cells in third instar larvae (LL3) and adults (Adult) of WT versus VGlut>P35 Lin A/15 MARCM clones. n ≥ 6. (E,F) Error bars represent standard deviations. Student’s t test was performed to compare the difference between indicated groups. ns, P > 0.05, considered not significant; **, P ≤ 0.01; ****, P ≤ 0.0001.Maximum projection of confocal sections of the left T1 segment (T1L) of third instar larva (G, H) and the left prothoracic neuromere (T1L) in adult fly (I, J) containing a WT (G, I) or a VGlut>P35 (H,J) Lin A/15 MARCM clone. Insets in (G–J) indicate the Elav+ GFP+ cells. (K) Graph of the number of Elav+ Lin A/15 neurons at different developmental time points. Error bars represent standard deviations. n ≥ 9. (L) Schematic of the Lin A/15 type Ib division during larval and pupal stages. NGB: neuroglioblast, NB: neuroblast, IMC: intermediate mother cell, GMC: ganglion mother cell, GB: glioblast, MN: motoneuron.
Figure 7
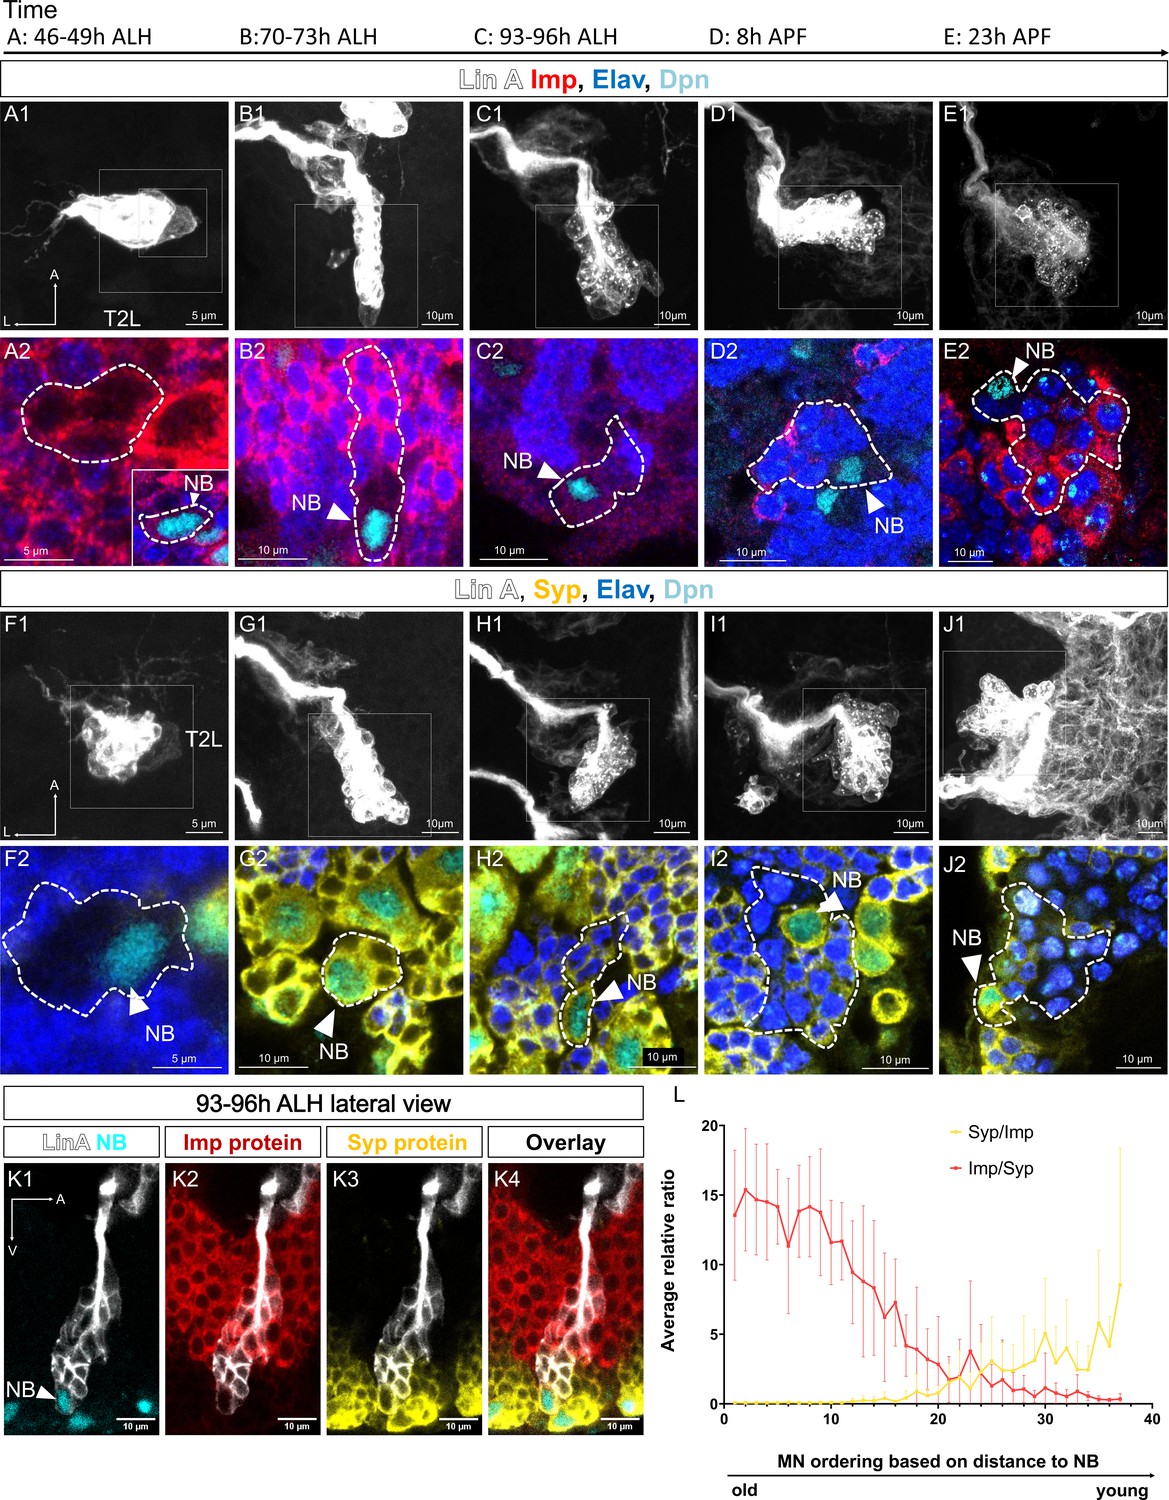
Spatiotemporal expression of Imp/Syp in Lin A/15.
(A1–J2) Confocal images showing the development of Lin A/15 during larval and pupal stages, the developmental time points are indicated on top. ALH: after larva hatching; APF: after pupa formation. (A1, B1, C1, D1, E1, F1, G1, H1, I1, J1) Maximum projection of confocal sections of the second left thoracic hemisegment (T2L) where Lin A/15 is genetically labeled with mCD8::GFP (white). (A2, B2, C2, D2, E2, F2, G2, H2, I2, J2) Magnified views of boxed regions in (A1, B1, C1, D1, E1, F1, G1, H1, I1, J1) showing Lin A/15 neuroblast (NB) and newborn motoneurons (MNs) immunostained with anti-Elav (neuronal marker, blue), anti-Dpn (NB marker, cyan), and anti-Imp (red) (A2, B2, C2, D2, E2) or anti-Syp (yellow) (F2 G2, H2, I2, J2). (A2) Inset: magnified view of the smaller boxed region in (A1) showing Lin A/15 NB. The dashed lines indicate GFP-labeled cells including NB and newborn MNs. White arrowheads indicate Lin A/15 NB. (K1–K4) Confocal section from the lateral view of a GFP Lin A/15 (white) at 93–96 hr ALH, immunostained with anti-Dpn (NB marker, cyan), anti-Imp (red), and anti-Syp (yellow). (L) Graph of relative expression levels of Imp and Syp protein in Lin A/15 post-mitotic MNs. The x axis represents MN ordering based on the distance to the NB. Note: Young MNs are closer to the NB while older MNs are further to the NB. Syp/Imp and Imp/Syp refer to the ratios of staining intensity values measured in ImageJ (N = 9). Error bars represent standard deviations.
-
Figure 7—source data 1
(7L) Immunostaining quantification: Imp and Syp staining signals in post-mitotic neurons.
- https://cdn.elifesciences.org/articles/91634/elife-91634-fig7-data1-v1.zip
Figure 8 with 2 supplements
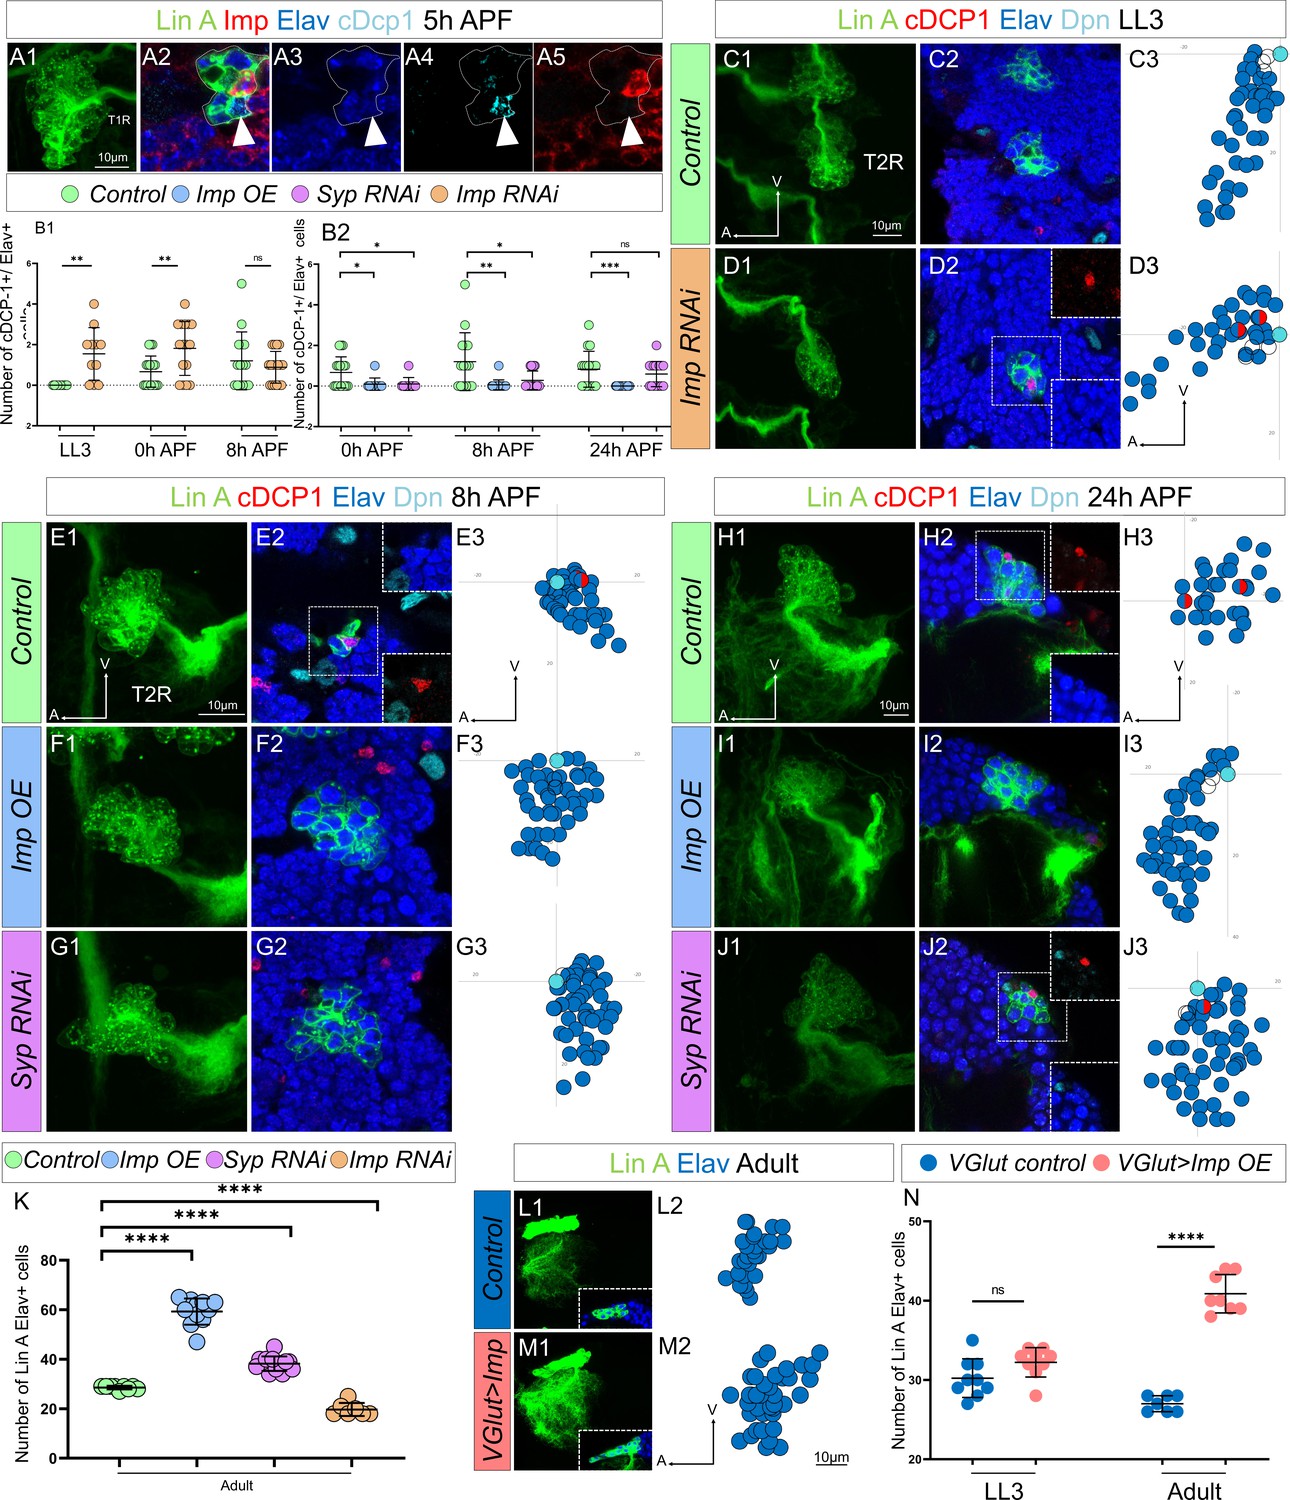
The opposite expression pattern in immature neurons of Imp/Syp instructs the number of surviving motoneurons (MNs).
(A1) Maximum projection of confocal sections of the T1R hemisegment where Lin A/15 is genetically labeled with mCD8::GFP (green) at 5 hr APF. (A2, A3, A4, A5) are confocal sections of the Lin A/15 in (A1) showing the apoptotic MN immunostained with anti-Imp (red), anti-Elav (blue), and anti-cDcp1 (cyan) of (A1). Arrowheads indicate the apoptotic MN (Elav+, cDcp1+) is absent of Imp (Imp−). (B1, B2) Graph of the number of apoptotic MNs (Elav+, cDcp1+) observed in Lin A/15 at different developmental time points under different genetic conditions: Control (green), Imp RNAi (orange), Imp OE (blue), and Syp RNAi (purple). (C1, D1, E1, F1, G1, H1, I1, J1) Maximum projection of confocal sections of the second right thoracic hemi-segments (T2R) where Lin A/15 is genetically labeled with mCD8::GFP (green) under different genetic conditions control (C1, E1, H1), Imp RNAi (D1), Imp OE (F1, I1), and Syp RNAi (G1, J1). (C2, D2, E2, F2, G2, H2, I2, J2) Confocal sections of the second right thoracic hemisegment (T2R) in (C1, D1, E1, F1, G1, H1, I1, J1) immunostained with anti-cDcp1(red), anti-Elav neuronal marker (blue), and anti-Dpn (neuroblast [NB] marker, cyan). The boxed region in (D2, E2, H2, J2) indicated the presence of Elav+ cDcp1+ cells. (C3, D3, E3, F3, G3, H3, I3, J3) Graphs of the relative position of each Lin A/15 cell in (C1, D1, E1, F1, G1, H1, I1, J1) from a lateral perspective. Axes: Anterior (A), Ventral (V). Lin A/15 immature MNs are in blue, Lin A/15 ganglion mother cells (GMCs) are in white, Lin A/15 NB is in cyan, and cDcp1+ Elav+ neurons are in red and blue. (K) Graph of the number of Elav+ Lin A/15 neurons observed in adult flies under different genetic conditions: control (green), Imp RNAi (orange), Imp OE (blue), and Syp RNAi (purple). n ≥ 7. (L1, M1) Maximum projection of confocal sections of the left prothoracic neuromere (T1L) containing a control (L1) or a VGlut >Imp (M1) Lin A/15 MARCM clone. The boxed regions in (L1–M1) are confocal sections showing the Lin A/15 Elav+ (anti-Elav, Blue) GFP+ cells. (L2, M2) Graphs of the relative position of each Lin A/15 cell in (L1, M1) from a lateral perspective. Axes: Anterior (A), Ventral (V). Lin A/15 immature MNs are in blue. (N) Graph of the number of Elav+ VGlut+ Lin A/15 cells of control and VGlut>Imp Lin A/15 MARCM clones in third instar larvae (LL3) and adult flies. n ≥ 7. (B, K, N) Error bars represent standard deviations. Student’s t test was performed to compare the difference between indicated groups. ns, P > 0.05, considered not significant; *, P ≤ 0.05; **, P ≤ 0.01; ***, P ≤ 0.001; ****, P ≤ 0.0001.
Figure 8—figure supplement 1
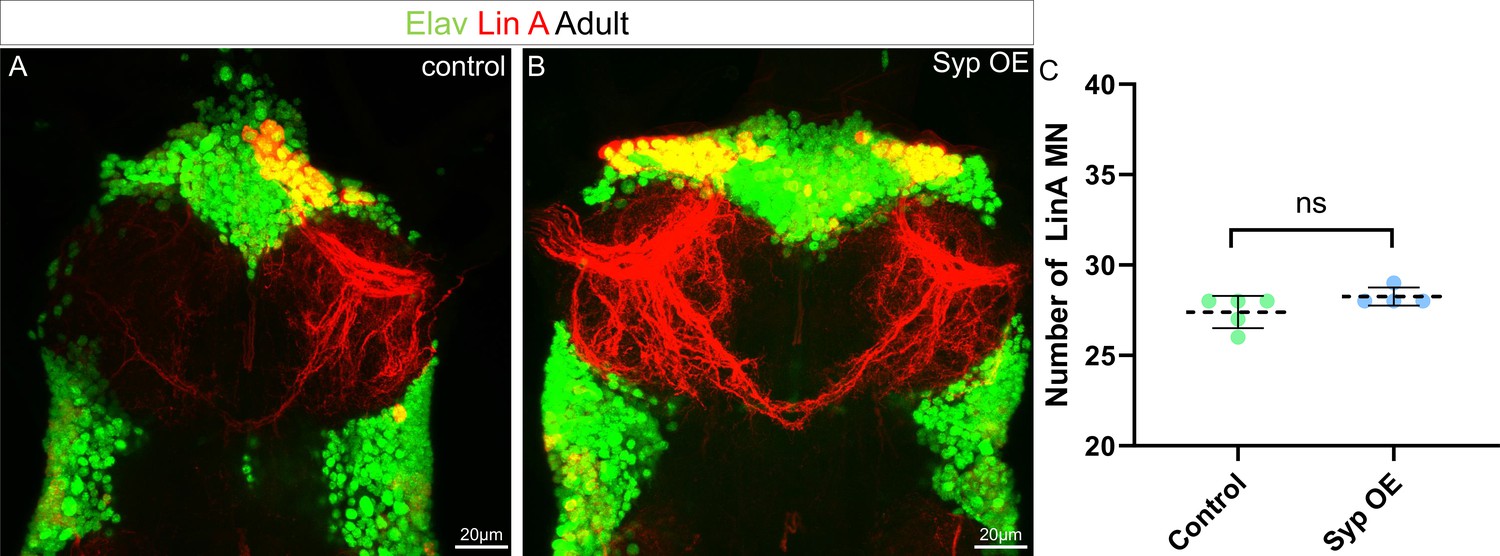
Syp overexpression (OE) does not change the number of motoneurons (MNs) produced by Lin A.
Maximum projection of confocal sections of the prothoracic segments with one (A) wt or two Syp OE (B) Lin A/15 MARCM clones (mCherry, red) labeled with Elav (green). (C) Graph of the number of Elav+ VGlut+ Lin A MNs in control and Syp OE MARCM clones. Error bars represent standard deviations. Student’s t test was performed to compare the difference between indicated groups. ns, P > 0.05, considered not significant.
Figure 8—figure supplement 2
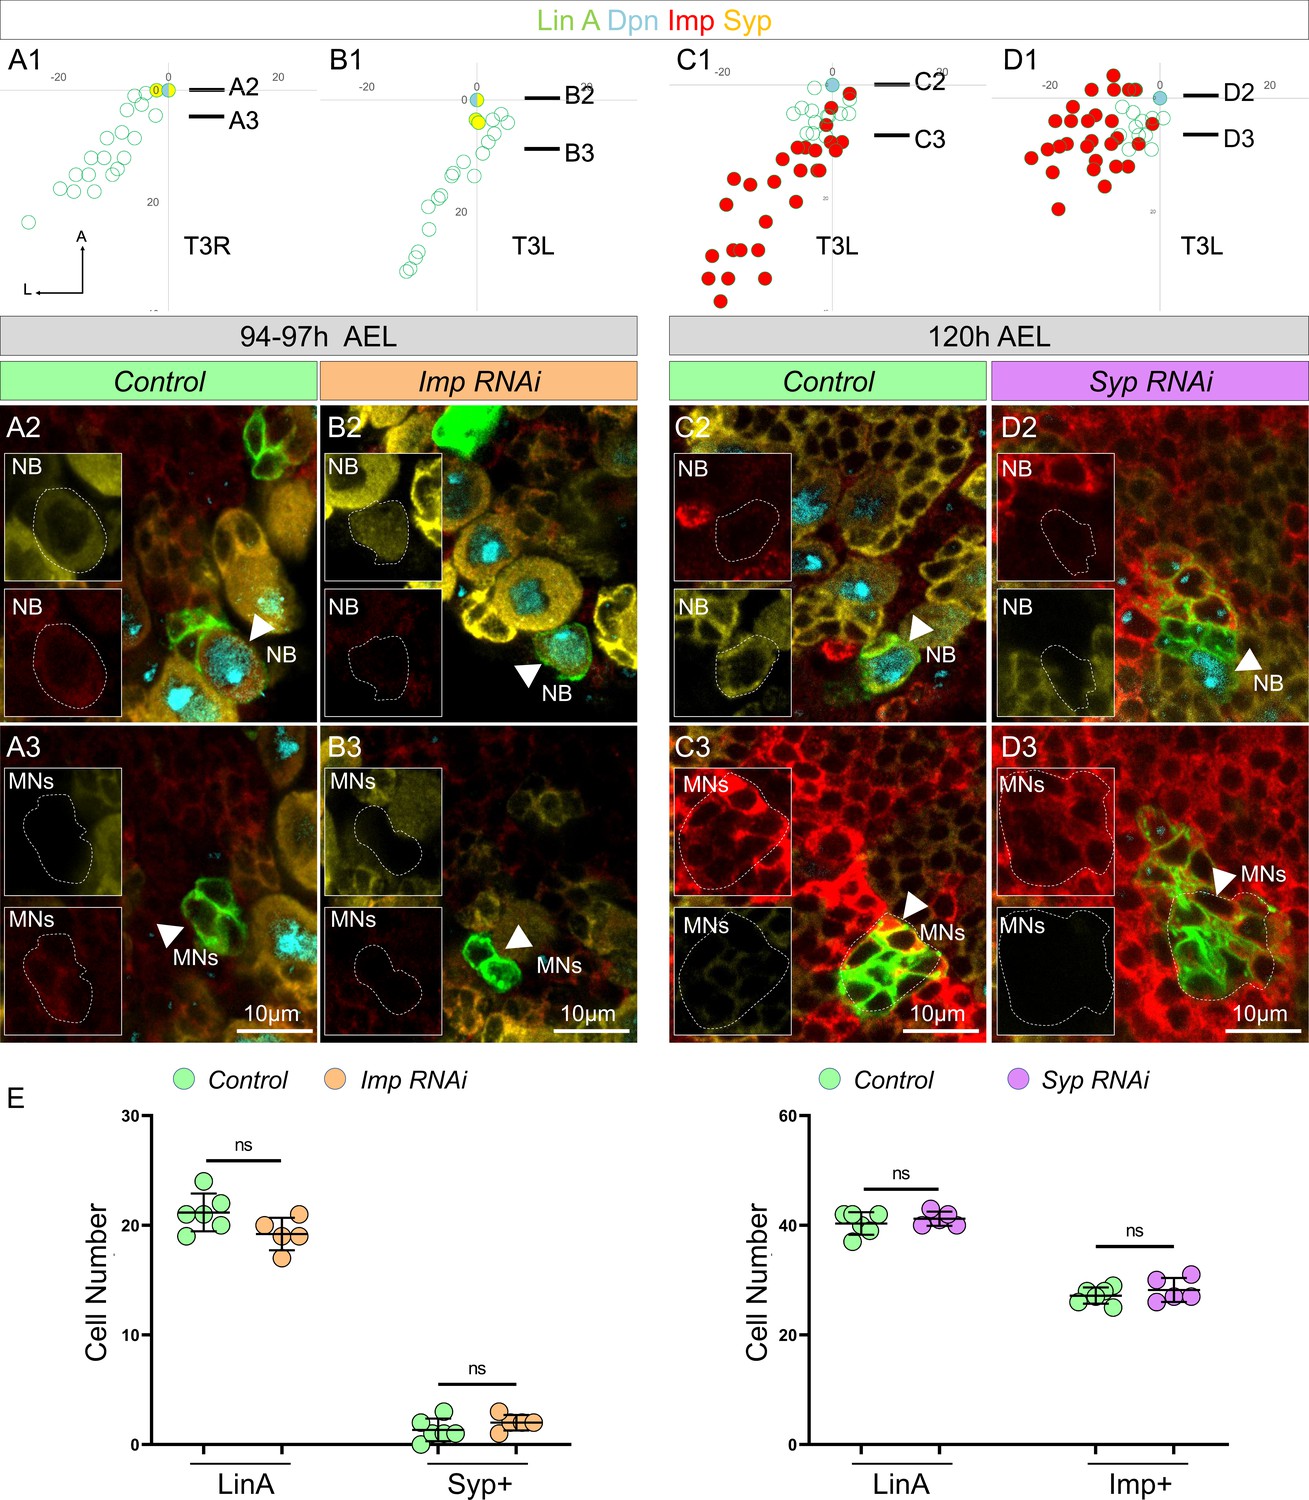
No mutual inhibition between Imp and Syp in Lin A/15.
(A1–D3) Graphs and confocal images showing Syp level at 94–97 AEL in Imp RNAi (A1–B3) and Imp level at 120 AEL in Syp RNAi (C1–D3), AEL: after egg laying. (A1, B1, C1, D1) Graphs of the relative position of each Lin A/15 cell of samples in (A2–D2) from a lateral perspective. Axes: Anterior (A), Ventral (V). The black lines indicate the positions of the confocal section in (A3–D3). (A2, B2, C2, D2) Confocal sections comparing Syp expression in Lin A/15 neuroblast (NB) between control (A2) and Imp RNAi (B2); Imp expression in Lin A/15 NB between control (C2) and Syp RNAi (D2). Stainings: anti-Dpn (NB marker, cyan), anti-Imp (red), and anti-Syp (yellow). Boxed regions highlight Imp expression in NB, arrowheads indicated Lin A/15 NB, dashed lines indicate GFP-labeled NB. (A3, B3, C3, D3) Confocal sections comparing Syp expression in Lin A/15 progenies between control (A3) and Imp RNAi (B3); Imp expression in Lin A/15 progenies between control (C3) and Syp RNAi (D3). Boxed regions highlight Syp expression in motoneuron (MN), arrowheads indicated Lin A/15 progenies, dashed lines indicate GFP-labeled cells. (E) Graph showing the number of Lin A/15 cells (left panels in each graph) and number of Syp/Imp-expressing Lin A/15 progenies (right panel in each graph) in indicated genetic backgrounds. Error bars represent standard deviations. Student’s t test was performed to compare the difference between indicated groups. ns, P > 0.05, considered not significant.
Figure 9
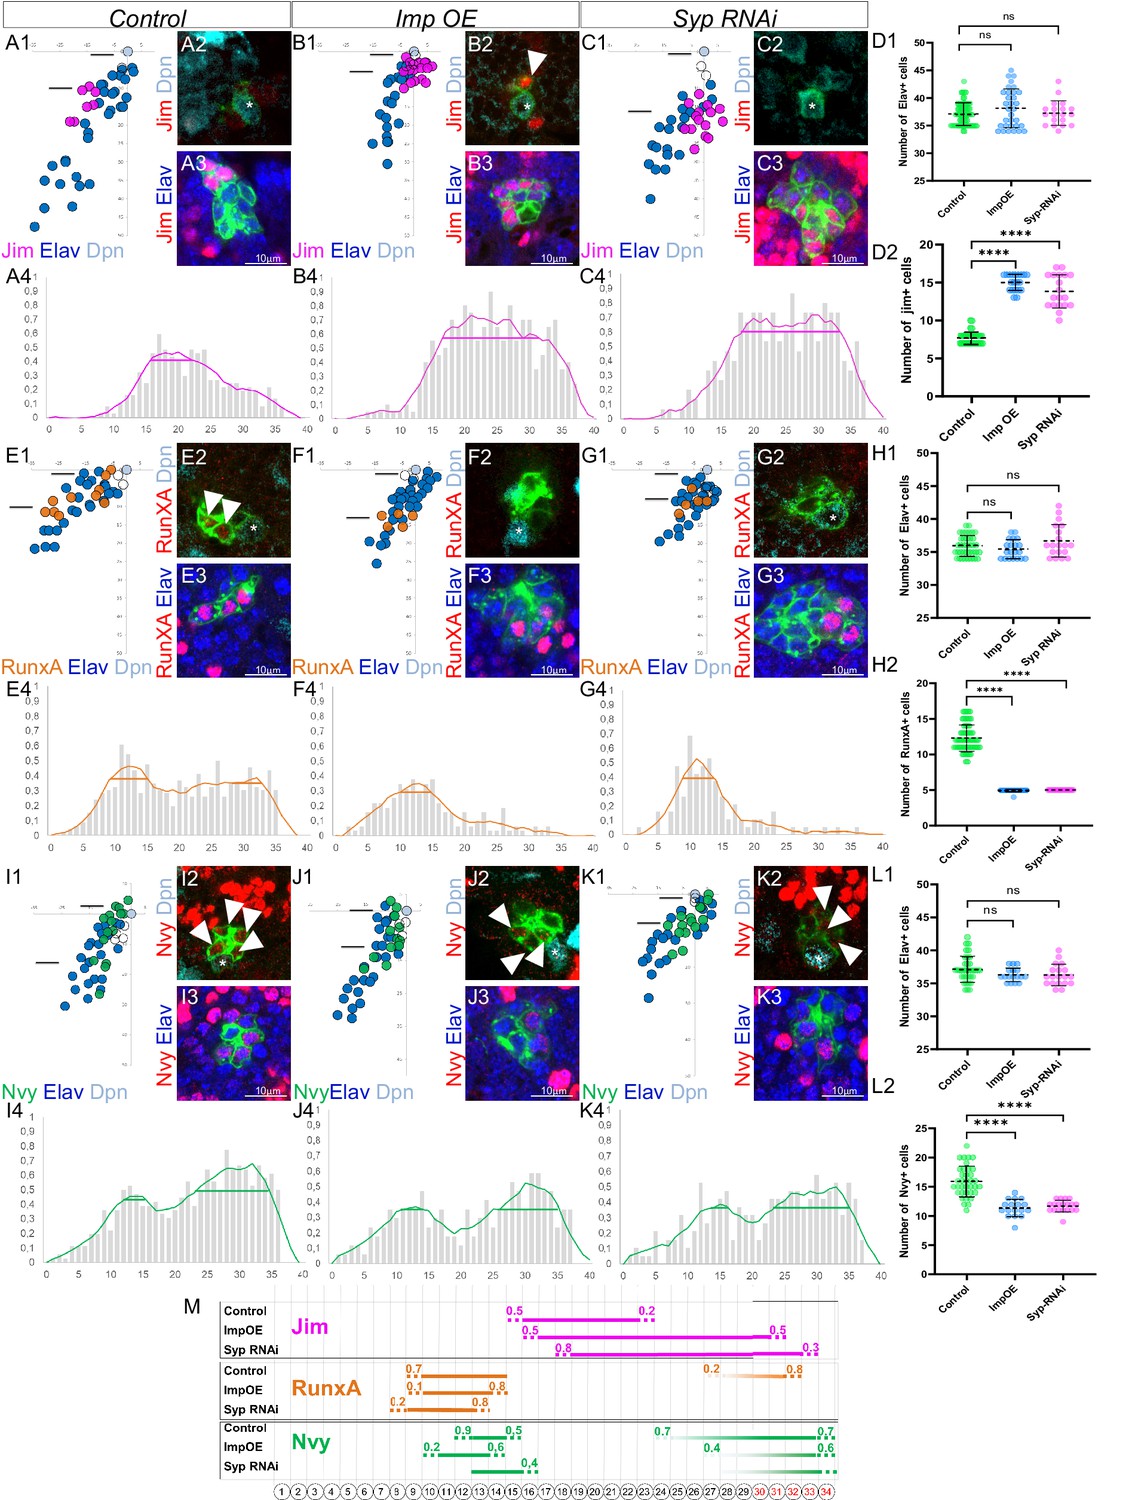
The last-born motoneurons (MNs) eliminated by PCD are primed with a specific combination of transcription factors (TFs) under control of Imp and Syp.
(A1, B1, C1, E1, F1, G1, I1, J1, K1) Plots of the relative position of each Lin A/15 cell from a lateral perspectives showing the expression of Jim (A1, B1, C1), RunxA (E1, F1, G1), and Nvy (I1, J1, K1) in purple, orange, and green, respectively, the Elav+ MNs (blue), the neuroblast (NB) (cyan), and the ganglion mother cell (GMC) in control (A1, E1, I1), Imp overexpression (OE) (B1, F1, J1), and Syp RNAi (C1, G1, K1). (A2–A3, B2–B3, C2–C3, E2–E3, F2–F3, G2–G3, I2–I3, J2–J3, K2–K3) confocal sections showing the expression of Jim (A2–A3, B2–B3, C2–C3), RunxA (E2–E3, F2–F3, G2–G3), and Nvy (I2–I3, J2–J3, K2–K3) in red, the Elav+ MNs (blue), the Dpn+ NB (cyan). The position of the sections are shown in (A1, B1, C1, E1, F1, G1, I1, J1, K1). The asterisk indicate the NBs. Note 1: The arrowhead in B2 indicates a jim+ neuron close to NB, this is never seen in the control Lin A/15. Note 2: The arrowheads in E2 indicate RunxA+ neurons close to NB, this is never seen in Imp OE and Syp RNAi Lin A/15. Note 3: The arrowheads in I2, J2, and K2 indicate NVy+ neurons close to the NB, the expression of Nvy is barely detectable in Imp OE and Syp RNAi Lin A/15. (A4, B4, C4, E4, F4, G4, I4, J4, K4) Graphs of the frequency of Jim (A4, B4, C4), RunxA (E4, F4, G4) and Nvy (I4, J4, K4) expression as a function of x’ x’: MN ordering axis according to their relative distance from the NB among >15 specimens before (gray bare) and after (colored lines) applying a Savitzky–Golay filter (see Material and methods) in control (A4, E4, I4), Imp OE (B4, F4, J4), and Syp RNAi (C4, G1, K4). The horizontal bar indicates the Jim+ cell cluster detected with the Positive Cell Cluster Detection (PCCD) method. (D1–D2, H1–H2, L1–L2) Graphs of the number of Elav+ Lin A/15 MNs (D1, H1, L1) and graphs of the number of Elav+ Lin A/15 MNs expressing Jim (D2), RunxA (H2), and Nvy (L2) in control, Imp OE, and Syp RNAi Lin A/15. n ≥ 17. Error bars represent standard deviations. Student’s t test was performed to compare the difference between indicated groups. ns, P > 0.05, considered not significant; ****, P ≤ 0.0001. (M) Schematic of the TF codes expressed in each immature MN (iMN) predicted by the PCCD method in an L3 larva in control, Imp OE, and Syp RNAi Lin A/15. Bottom: Schematic of the cell body of Lin A/15 iMNs. The numbers inside indicate their relative distances from NB. Top: The horizontal bars indicate the TF+ cell clusters detected with the PCCD method. The dotted lines indicate the coverage index at the border (see Materials and methods).
Figure 10
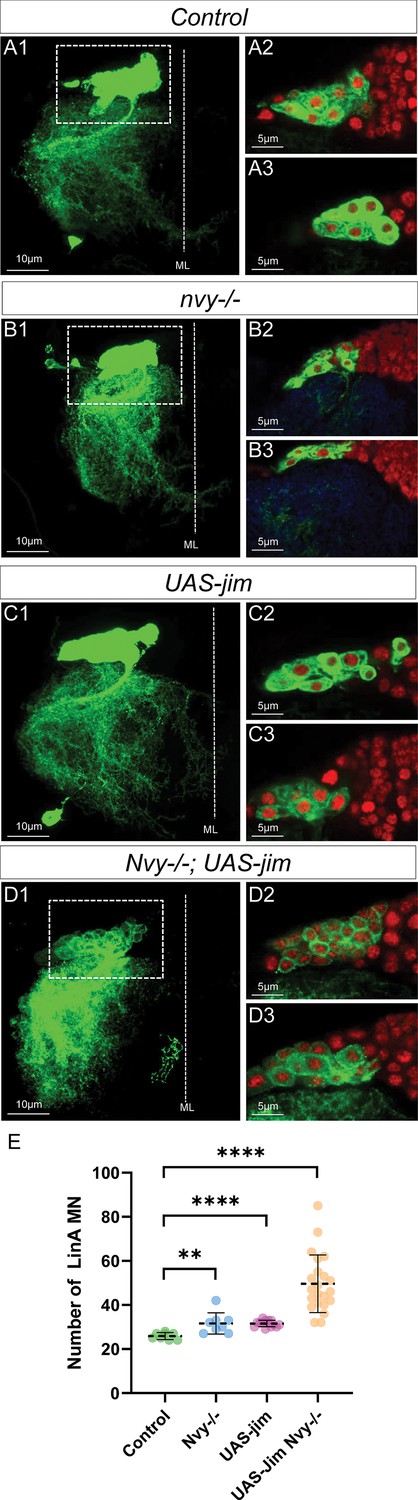
Changing the combination of transcription factor (TF) in last-born motoneurons (MNs) leads to MN survival.
(A1–D3) Maximum projection of confocal sections of a right prothoracic hemisegment (T2R) with a Lin A/15 MARCM clone genetically labeled with mCD8::GFP (green) under the control of VGlut-Gal4 (A1, B1, C1, D1) and confocal sections trough Lin A/15 (green) and labeled with Elav (red) (A2–A3, B2–B3, C2–C3, D2–D3) in different genetic conditions: control (A2–A3), nvy−/− (B2–B3), UAS-jim (C2–C3), and nvy−/−; UAS-jim (D2–D3). (E) Graphs of the number of Elav+ VGlut+ MNs in control, nvy−/− (B2–B3), UAS-Jim (C2–C3), nvy−/−; UAS-jim (D2–D3) MARCM clones. n ≥ 8. Error bars represent standard deviations. Student’s t test was performed to compare the difference between indicated groups. **, P ≤ 0.01; ****, P ≤ 0.0001.
Tables
Key resources table
| Reagent type (species) or resource | Designation | Source or reference | Identifiers | Additional information |
|---|---|---|---|---|
| Genetic reagent (D. melanogaster) | UAD-KD (attP2[68A4]) | Awasaki et al., 2014 | N/A | |
| Genetic reagent (D. melanogaster) | Dpn>KDRT-stop-KDRT>CRE (su(Hw)attP8[8E10]) | Awasaki et al., 2014 | N/A | |
| Genetic reagent (D. melanogaster) | act>loxP-stop-loxP>LexA::P65 (attP40[25C7]) | Lacin and Truman, 2016 | N/A | |
| Genetic reagent (D. melanogaster) | lexAop-myr::GFP (su(Hw)attP5[50F1]) | Awasaki et al., 2014 | N/A | |
| Genetic reagent (D. melanogaster) | R10c12-GAL4 (3rd chromosome, attp2) | Lacin and Truman, 2016 | N/A | |
| Genetic reagent (D. melanogaster) | lexAop-Imp-RNAi (attP40[25C7]) | Rueden et al., 2017 | N/A | |
| Genetic reagent (D. melanogaster) | lexAop-Imp-RM (attP40[25C7]) | Rueden et al., 2017 | N/A | |
| Genetic reagent (D. melanogaster) | lexAop-Syp-RNAi (attP40[25C7]) | Rueden et al., 2017 | N/A | |
| Genetic reagent (D. melanogaster) | tub-gal4 (3rd chromosome,79A2) | Bloomington Drosophila Stock Center | BDSC: 5138 | |
| Genetic reagent (D. melanogaster) | DVGlut-Gal4 (2nd chromosome, 22E1) | Bloomington Drosophila Stock Center | BDSC: 26160 | |
| Genetic reagent (D. melanogaster) | DVGlut-LexA::GAD (VGlutMI04979) | This study | N/A | |
| Genetic reagent (D. melanogaster) | UAS-P35 (2nd and 3rd chromosome) | Bloomington Drosophila Stock Center | BDSC: 5072; 5073 | |
| Genetic reagent (D. melanogaster) | 20XUAS-Imp-RM-Flag (3rd chromosome) | Liu et al., 2015 | N/A | |
| Genetic reagent (D. melanogaster) | actin^FRT-stop- FRT^Gal4 | Gift from Alain Garces | N/A | |
| Antibody | anti-Dcp1 (rabbit polyclonal) | Cell signaling | Cat#9578S; RRID:AB_2721060 | 1:50 |
| Antibody | anti-Elav (mouse monoclonal) | DSHB | Cat#9F8A9; RRID:AB_2314364 | 1:50 |
| Antibody | anti-Elav (rat monoclonal) | DSHB | Cat#7E8A10; RRID:AB_528218 | 1:50 |
| Antibody | anti-repo (mouse monoclonal) | DSHB | RRID:AB_528448 | 1:100 |
| Antibody | anti-PH3 (rabbit polyclonal) | Abcam | RRID:AB_2164915 | 1:50 |
| Antibody | anti-Dpn (guinea-pig, unknown clonality) | Gift from Jim Skeath | RRID:AB_2314299 | 1:250 |
| Antibody | anti-Imp (rat, unknown clonality) | Gift from Claude Desplan | N/A | 1:200 |
| Antibody | anti-Syp (rabbit, unknown clonality) | Gift from Claude Desplan | N/A | 1:400 |
| Antibody | anti-mouse Alexa 647 (goat, polyclonal) | Invitrogen | Cat#A32728; RRID:AB_2633277 | 1:250 |
| Antibody | anti-rat Alexa 647 (donkey, polyclonal) | Jackson | Cat#712-605-153; RRID:AB_2340694 | 1:250 |
| Antibody | anti-mouse Alexa 555 (goat, polyclonal) | Invitrogen | Cat#A32727; RRID:AB_2633276 | 1:250 |
| Antibody | anti-rabbit Alexa 555 (goat, polyclonal) | Invitrogen | Cat#A32732; RRID:AB_2633281 | 1:250 |
| Antibody | anti-Rat Alexa 555 (goat, polyclonal) | Abcam | Cat#ab150166 | 1:250 |
| Antibody | anti-guinea-pig DyLight405 (donkey, polyclonal) | Jackson | Cat#706-475-148; RRID:AB_2340470 | 1:250 |
| Recombinant DNA reagent | pBS-KS-attB2-SA(2)-T2A-LexA::GADfluw-Hsp70 vector | Addgene | Cat#78307 | |
| Chemical compound, drug | Formaldehyde | Thermo Fisher | Cat#28908 | |
| Chemical compound, drug | PBS | Dutscher | Cat#X0515-500 | |
| Chemical compound, drug | Triton X-100 | Sigma | Cat#T8787-100mL | |
| Chemical compound, drug | Tween 20 | Sigma | Cat#P7949-100ML | |
| Chemical compound, drug | BSA | Sigma | Cat#A7906-500 g | |
| Chemical compound, drug | Vectashield mounting medium | Vector Laboratories | Cat#H1000 | |
| Chemical compound, drug | Abberior MOUNT SOLID ANTIFADE | abberior GmbH | MM-2013-2X15ML | |
| Chemical compound, drug | Salmon sperm DNA | Thermo Fisher | Cat#15632011 | |
| Chemical compound, drug | Yeast tRNA | Thermo Fisher | Cat#AM7119 | |
| Chemical compound, drug | Murine RNase inhibitor | New England Biolabs | M0314L | |
| Software, algorithm | Amira 3D software (version 6.2) | SCR_007353 | https://www.fei.com/ | |
| Software, algorithm | ImageJ (version 1.48) | Schneider et al., 2012 | https://imagej.nih.gov/ij/ | |
| Software, algorithm | GraphPad (Prism 8) | GraphPad Software Inc | https://www.graphpad.com/scientific-software/prism/ | |
| Software, algorithm | Matlab (2021b) | MathWorks | https://www.mathworks.com/ | |
| Software, algorithm | smFISH analysis source code in Matlab | Guan et al., 2022c | https://github.com/Wenyue2022/smFish-analysis-source-code; Guan, 2022a | |
| Software, algorithm | PCCD note book | Guan et al., 2022c | https://github.com/Wenyue2022/PCCD-note-book; Guan, 2022b |
Additional files
-
Supplementary file 1
smFISH primary probe sequences for Imp, Syp, and Dpn.
Sequences of the primary probes recognizing exonal sequences of Imp, Syp, and Dpn, designed using the Biosearch Technologies stellaris RNA FISH probe designer tool (free with registration, https://biosearchtech.com).
- https://cdn.elifesciences.org/articles/91634/elife-91634-supp1-v1.xlsx
-
MDAR checklist
- https://cdn.elifesciences.org/articles/91634/elife-91634-mdarchecklist1-v1.pdf
Download links
A two-part list of links to download the article, or parts of the article, in various formats.
Downloads (link to download the article as PDF)
Open citations (links to open the citations from this article in various online reference manager services)
Cite this article (links to download the citations from this article in formats compatible with various reference manager tools)
The role of Imp and Syp RNA-binding proteins in precise neuronal elimination by apoptosis through the regulation of transcription factors
eLife 12:RP91634.
https://doi.org/10.7554/eLife.91634.3


