Language experience shapes predictive coding of rhythmic sound sequences
- Department of Fundamental Neurosciences, University of Geneva, Switzerland
- Basque Center on Cognition, Brain and Language, Spain
- Mathematical Institute, Department of Mathematics and Computer Science, Physics, Geography, Liebig-Universität Gießen, Germany
- Ikerbasque, Basque Foundation for Science, Spain
Figures
Figure 1
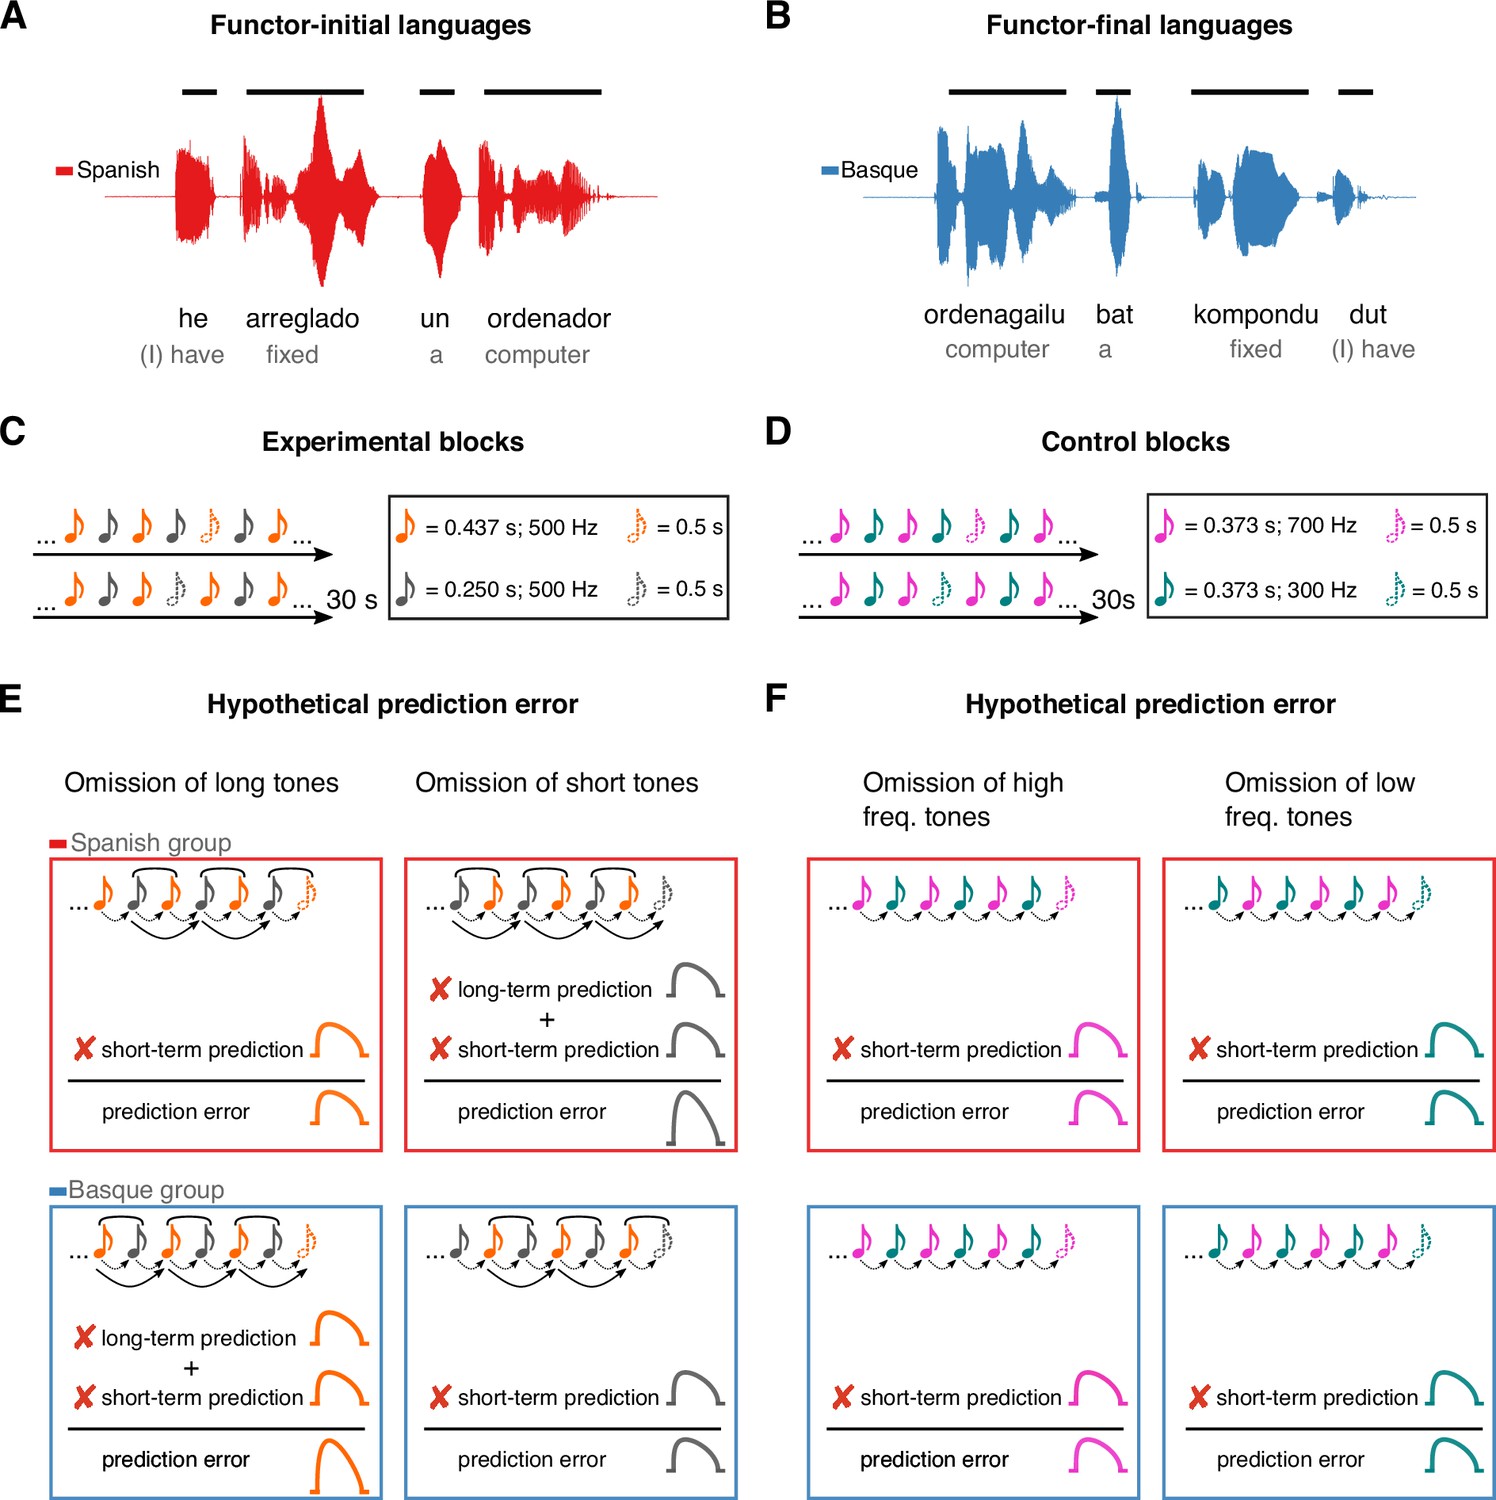
Experimental design and rationale of the study.
Panels A and B illustrate the contrast between functor-initial and functor-final word order in Spanish and Basque, as well as its consequences on their prosodic structure. Panels C and D show the design of the experimental and control conditions, respectively. Notes represent individual tones. The structure of the design is the same in both conditions (ababab), with 30 s sequences of two tones alternating at fixed inter-stimulus intervals and occasional omissions. In the experimental condition, tones alternate in duration but not frequency, whereas in the control condition tones alternate in frequency but not duration. Panels E and F depict the hypothesized error responses associated with the different types of omissions for experimental and control conditions, respectively. Round brackets above the tones reflect the grouping bias of the two languages, based on their word-order constraints. Dotted lines reflect short-term predictions based on the transition probabilities of the previous stimuli. Solid lines reflect long-term predictions based on the phrasal chunking scheme of the two languages.
Figure 2 with 2 supplements
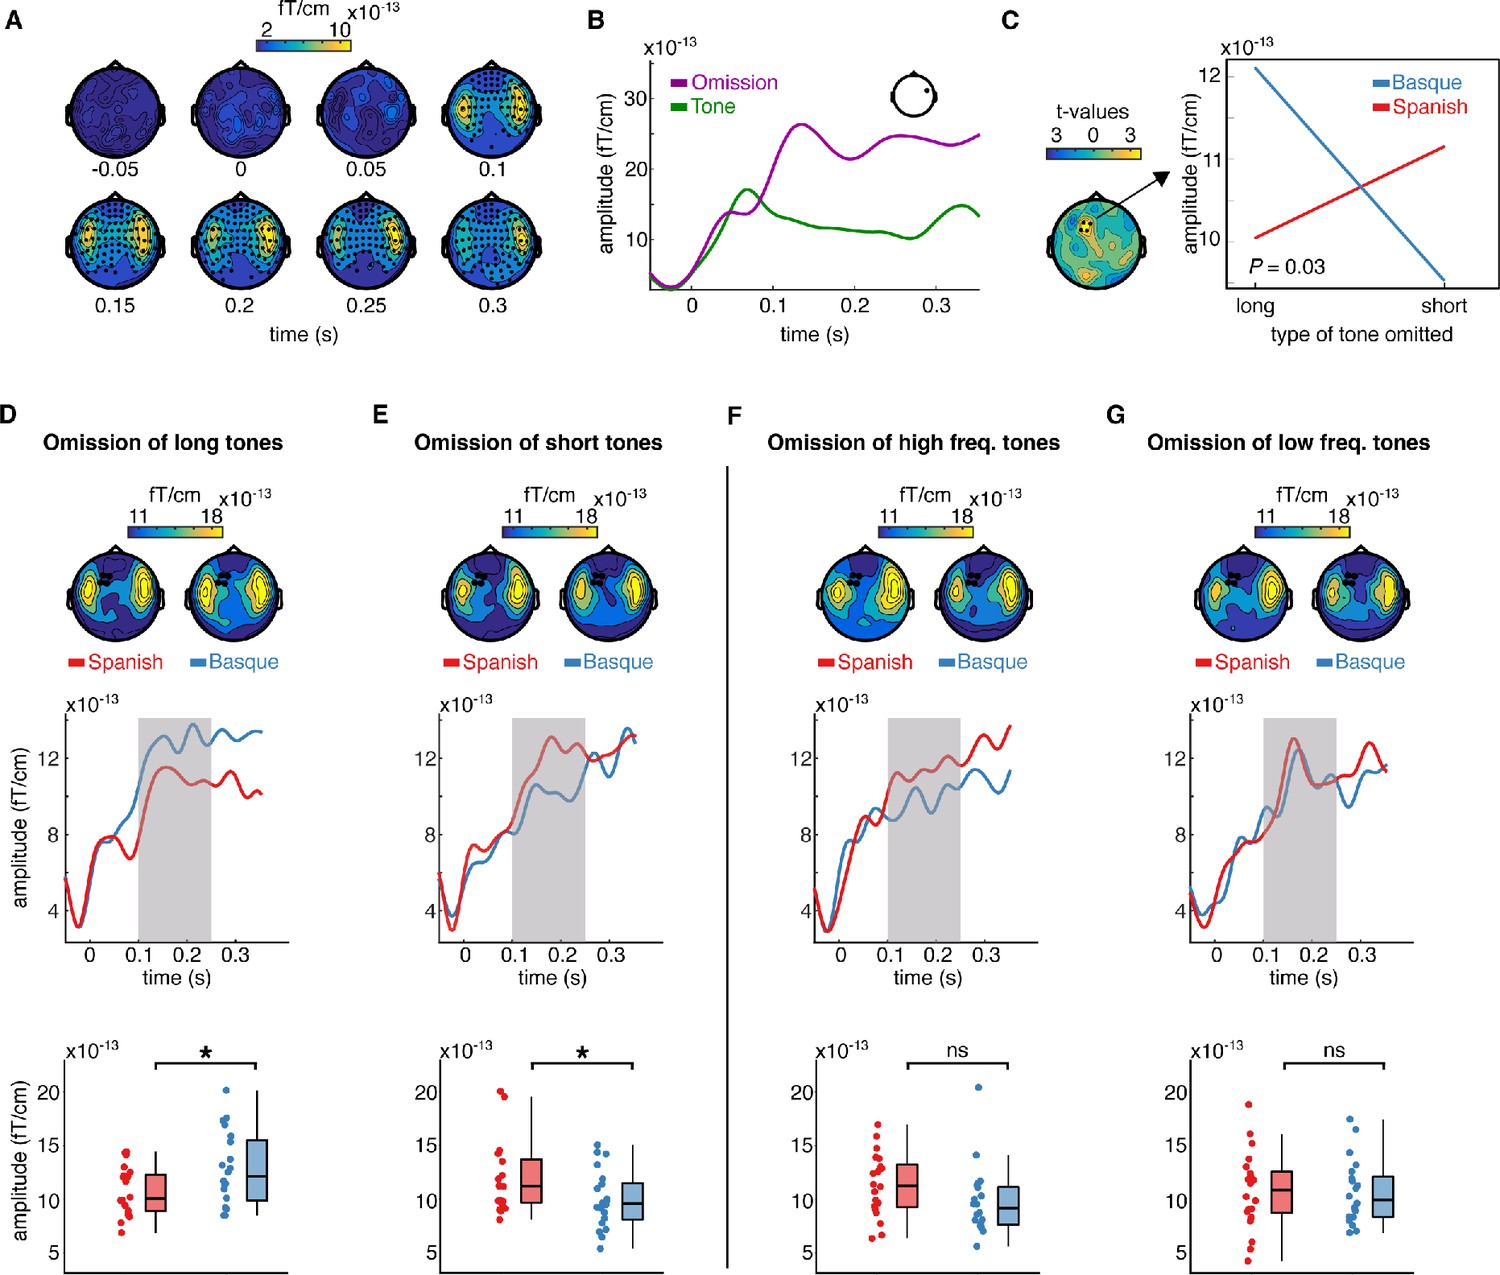
Sensor-level topography and time course of neural responses to omitted sounds across groups and conditions.
(A) shows the temporal unfolding and topographical distribution of the overall effect of omission (omissions minus tones). Channels belonging to the significant cluster are highlighted. (B) shows the event-related field (ERF) generated by omissions and tones in a representative channel. (C) (left) shows the topography of the t distribution of the interaction effect between the language background of the participants (Spanish, Basque) and the type of omission mismatch negativity (MMN) (short, long). Channels belonging to the significant interaction cluster are highlighted. The interaction effect was present only in the experimental condition. Panel C (right) shows the averaged magnetoencephalography (MEG) activity over the 0.100–0.250 s time window and channels belonging to the significant cluster for each group and condition separately. (D–G) show the effect of language experience in modulating the amplitude of the omission MMN associated with each experimental and control contrast. Topographies (top) show the scalp distribution of the averaged activity over the 0.100–0.250 s time window. Channels belonging to the significant interaction cluster are highlighted. ERFs (middle) show the temporal unfolding of brain activity averaged over the channels belonging to the significant interaction cluster for each contrast and group. The shaded area indicates the time window of interest for the statistical analysis. Boxplots (down) show the mean MEG activity for each participant over the 0.100–0.250 s time window and the channels belonging to the significant interaction cluster. The center of the boxplot indicates the median, and the limits of the box define the interquartile range (IQR = middle 50% of the data). The notches indicate the 95% confidence interval around the median. Dots reflect individual subjects (n = 20 per group). In D–G, asterisks indicate statistical significance for each contrast using a one-sided, independent sample t-test with false discovery rate (FDR) correction for multiple comparisons (statistical significance: * signifies p < 0.05, ns signifies p > 0.05).
Figure 2—figure supplement 1
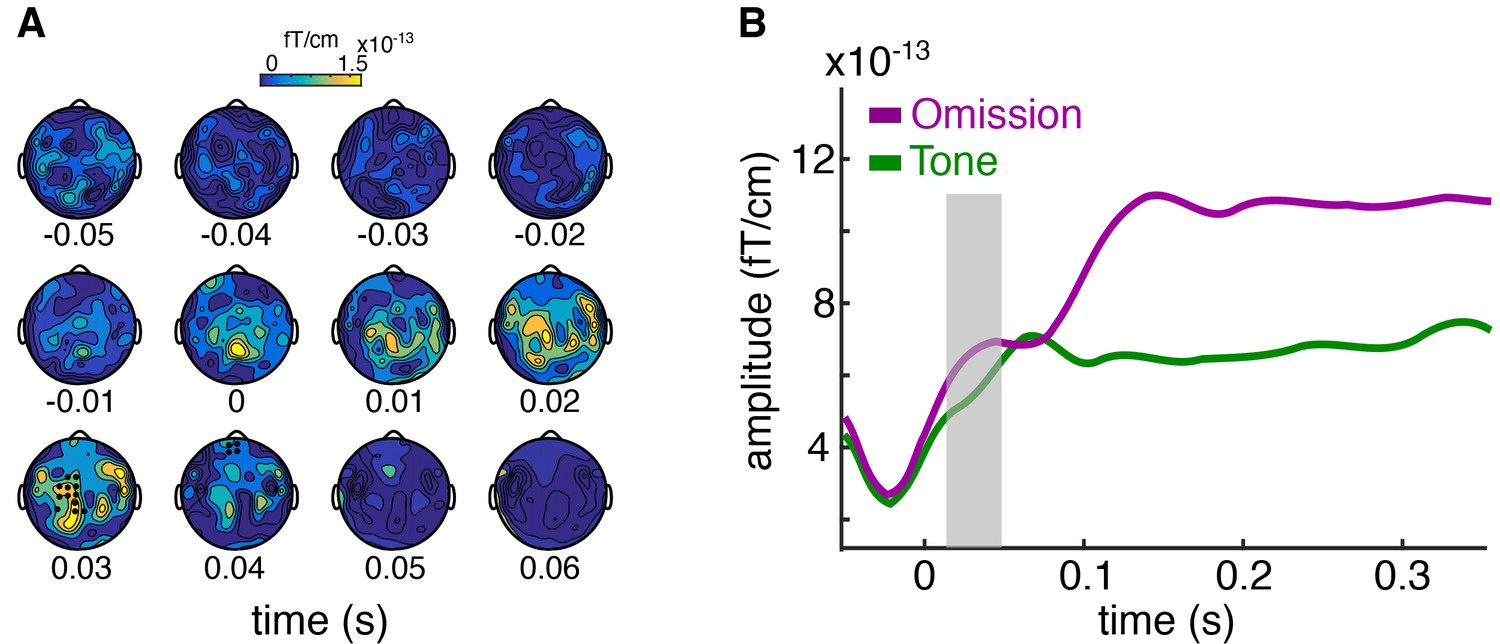
Early neural response to omitted sounds.
Panel A shows the temporal unfolding and topographical distribution of the second cluster that emerged from the comparisons between omissions vs tones. Channels belonging to the significant cluster are highlighted. Panel B shows the event-related field (ERF) generated by omissions and tones over all the channels belonging to the significant cluster. Shaded gray area indicates the latency of the cluster. The upper part of the scale has been lowered compared to Figure 2 to match the smaller amplitude of the effect. The temporal scale of the topographies has also been lowered compared to Figure 2, in order to allow the visualization of the cluster, which has a latency of around 0.020 s.
Figure 2—figure supplement 2
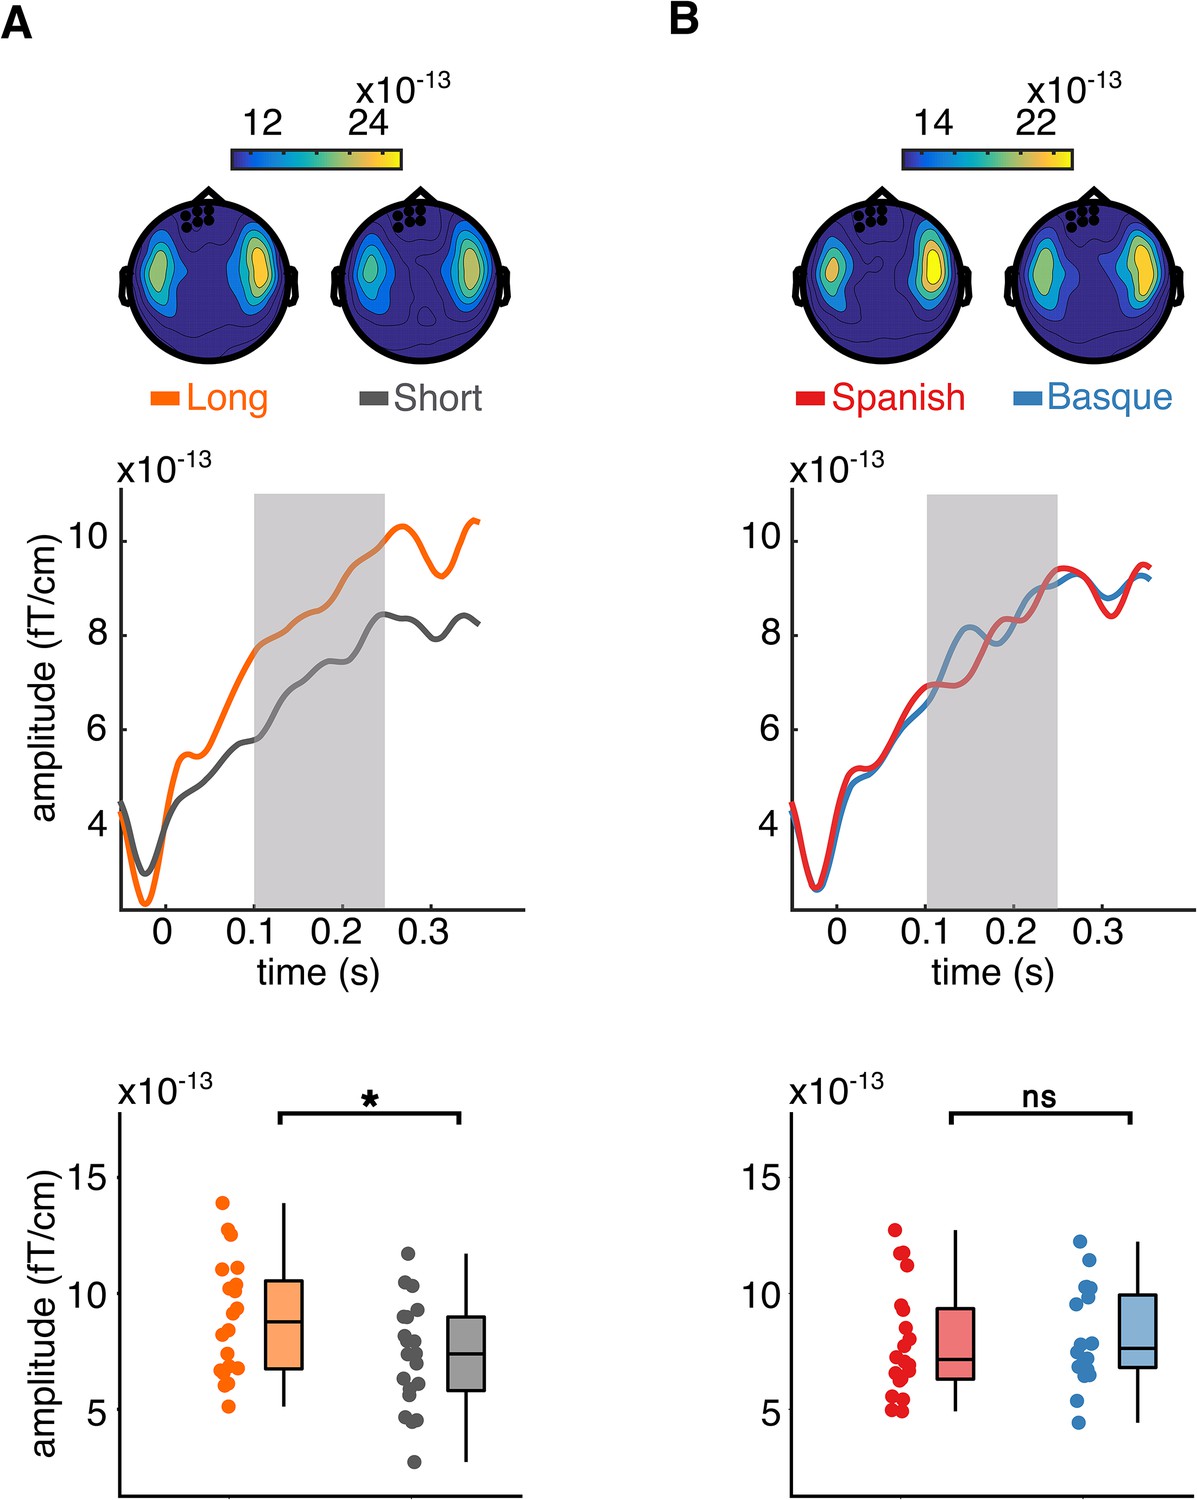
Effects of omission type and language background.
Panel A shows the event-related fields (ERFs) and topographies reflecting the main effect of omission type, with omissions of long auditory events generating larger omission mismatch negativity (MMN) than short events between groups. Panel B shows the ERFs and topographies reflecting the (lack of) main effect of language background, with overall no group differences in the amplitude of the omission MMN. Because no main effect of language background was detected. Panel B uses the same channels of Panel A as representative channels for plotting the ERF. The remaining conventions for the plot are the same as in Figure 2.
Figure 3
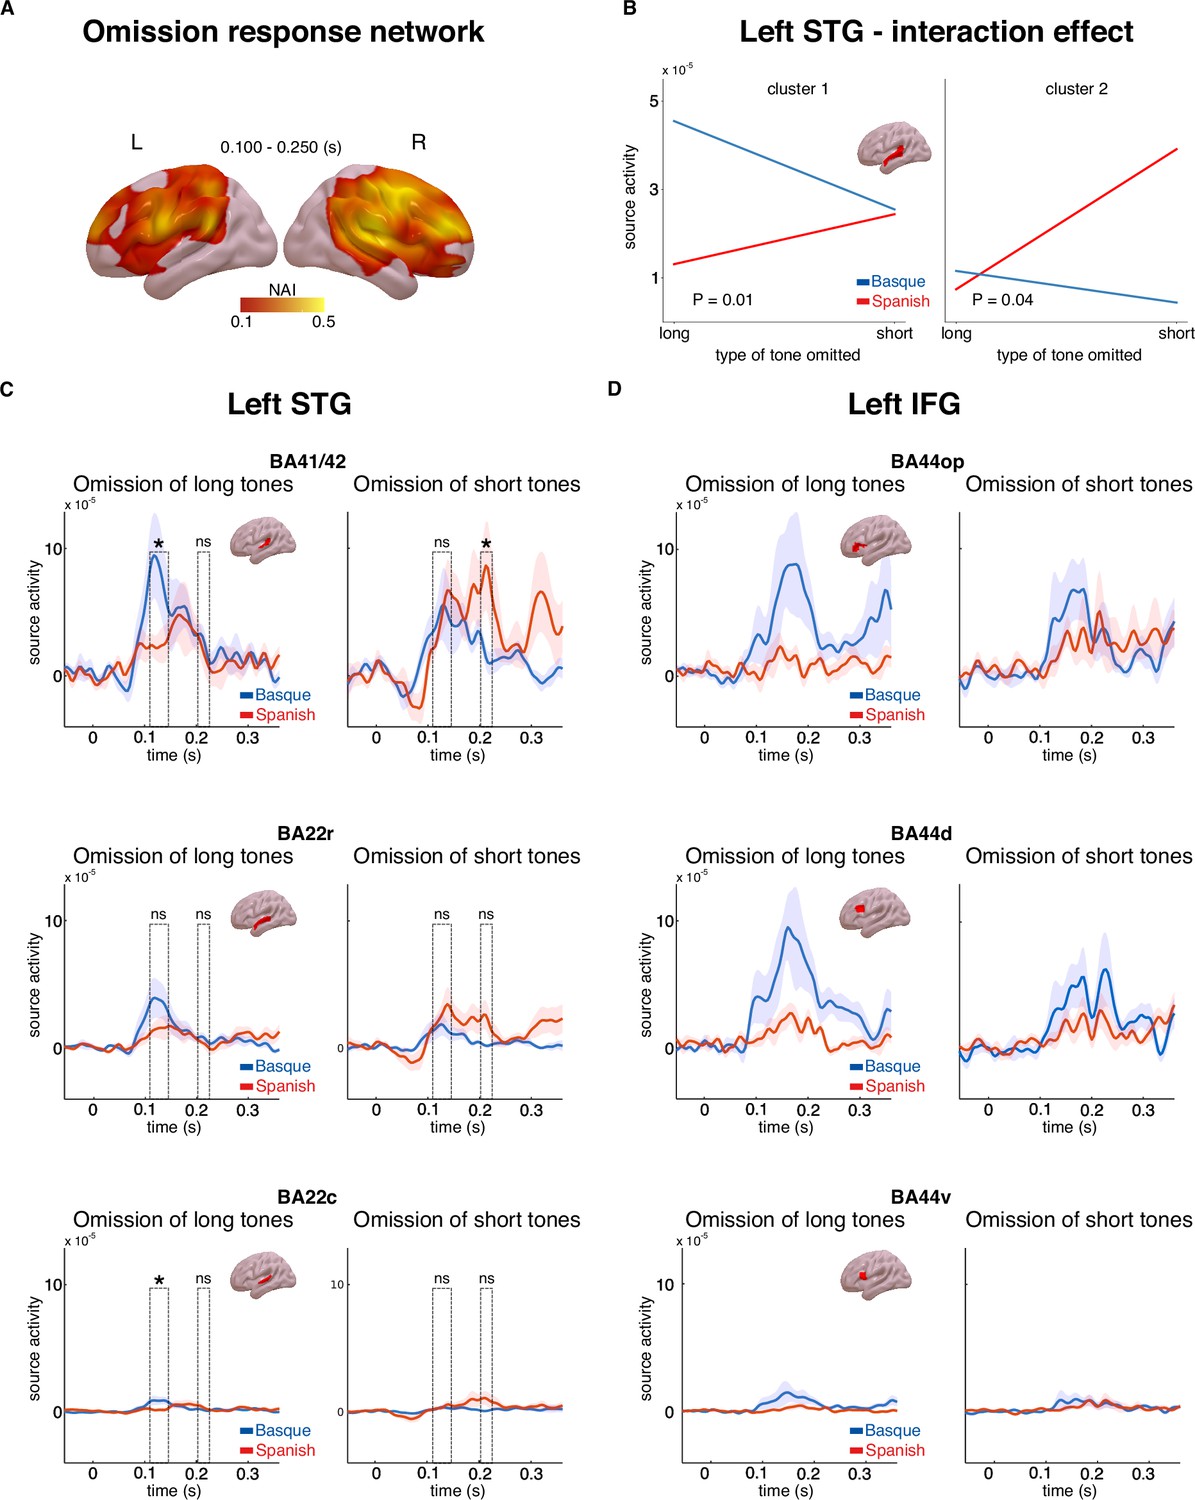
Source activity underlying the omission response network and long-term predictions.
Panel A shows brain maps representing the ratio of source activity of tone to the omission (neural activity index, NAI = SOmission/STone) over the 0.100–0.250 s time window. Panel B shows the source activity peaks from the two clusters in the left superior temporal gyrus (STG) for each group and condition separately. Panels C and D show the time course of source activity associated with the omission mismatch negativity (MMN) over distinct regions of interest (ROIs) of the left STG and inferior frontal gyrus (IFG). Dashed rectangles indicate the two temporal clusters within the 0.100–0.250 s time window. Error bars reflect standard errors (n = 20 per group). In Panels C and D, asterisks indicate statistical significance for each contrast using a one-sided, independent sample t-test (statistical significance: * signifies p < 0.05, ns signifies p > 0.05).
Author response image 1
Author response image 2
Author response image 3
Author response image 4

Additional files
Download links
A two-part list of links to download the article, or parts of the article, in various formats.
Downloads (link to download the article as PDF)
Open citations (links to open the citations from this article in various online reference manager services)
Cite this article (links to download the citations from this article in formats compatible with various reference manager tools)
Language experience shapes predictive coding of rhythmic sound sequences
eLife 12:RP91636.
https://doi.org/10.7554/eLife.91636.3


