Ferredoxin 1 is essential for embryonic development and lipid homeostasis
- Comparative Oncology Laboratory, Schools of Veterinary Medicine and Medicine, University of California, Davis, United States
- Department of Pathology, University of Texas Southwestern Medical Center, Dallas, United States
Figures
Figure 1
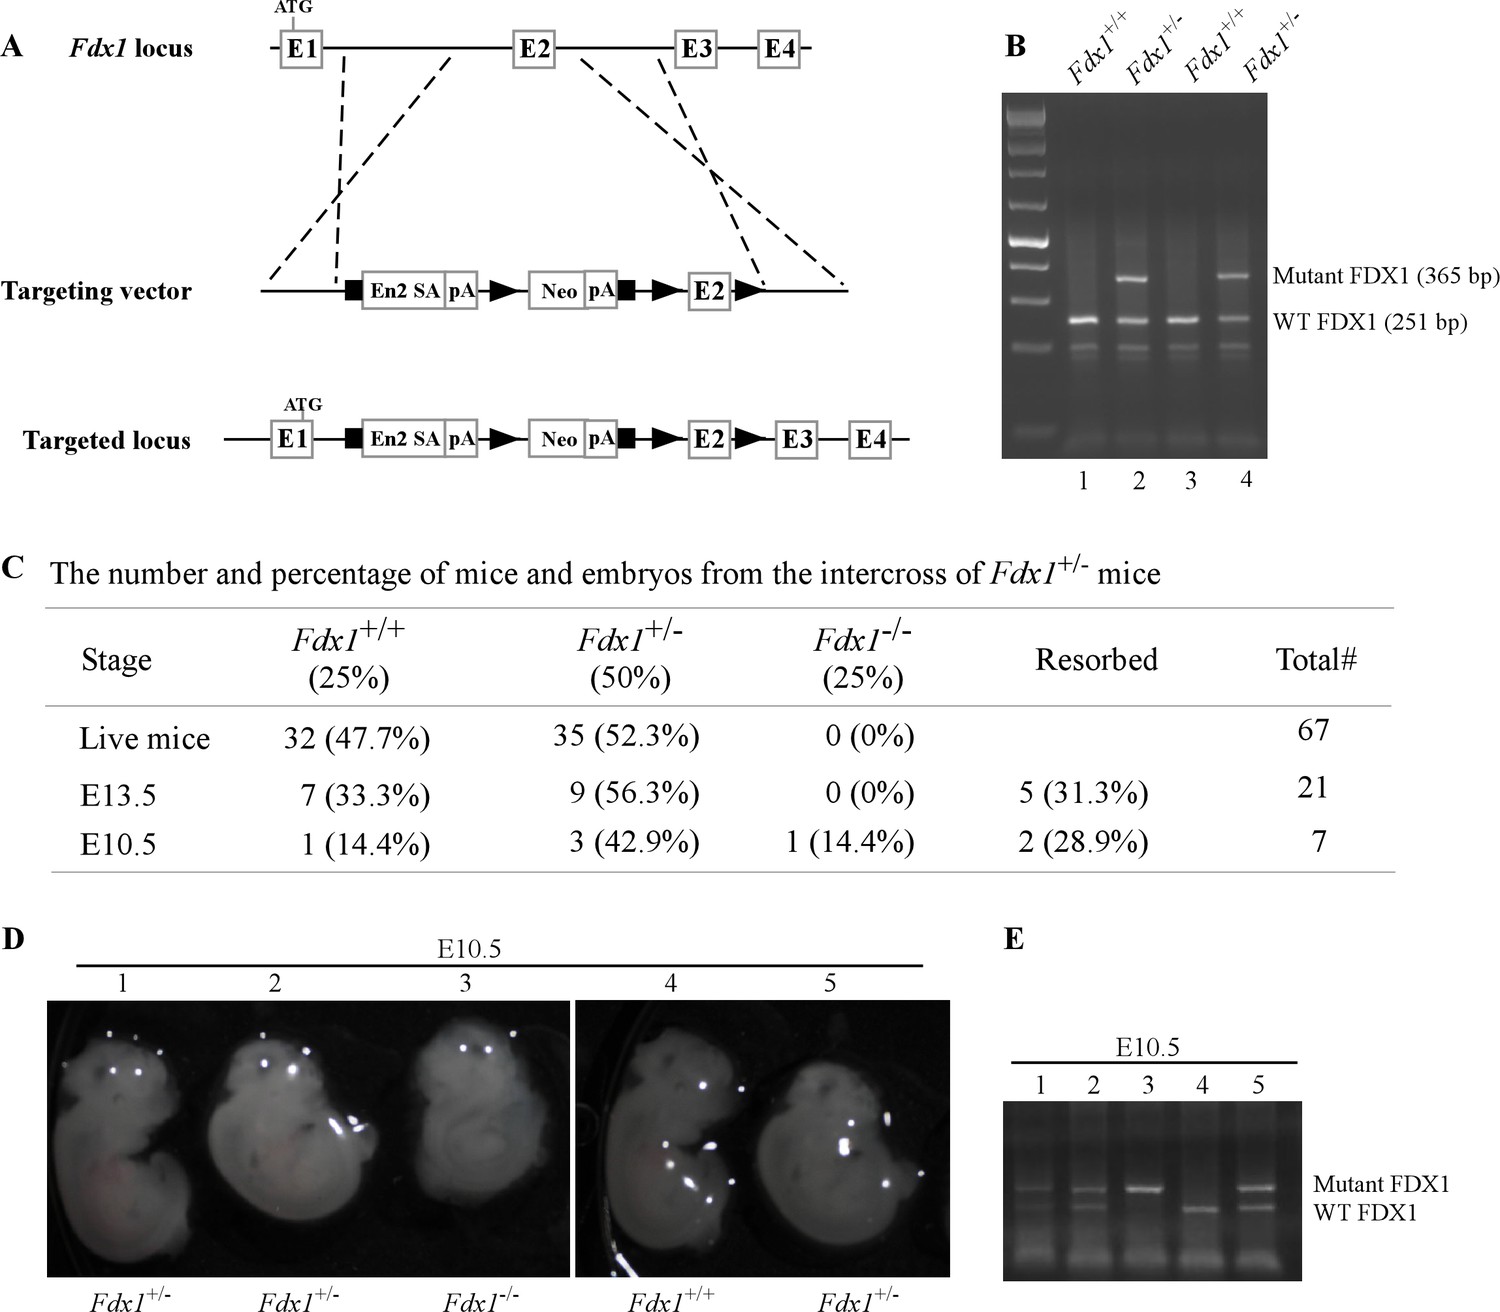
Fdx1 knock-out mouse are embryonically lethal.
(A) Schematic diagram of the targeted Fdx1 gene locus and the cassette used to target the locus using a knock-out first approach. (B) Representative image of a PCR gel used to genotype WT and Fdx1+/- +/-. (C) The number and % of embryos and live off-springs from the intercrosses of Fdx1+/- +/-. (D) Representative images of WT, Fdx1+/-, and Fdx1-/- embryos obtained at embryonic day 10.5. The white dots seen in the pictures are the result of light reflection while taking the photos. (E) Agarose gel image of a PCR used to genotype WT, Fdx1+/-, and Fdx1-/- embryos shown in (D).
-
Figure 1—source data 1
Unedited DNA gel images for Figure 1B and E.
- https://cdn.elifesciences.org/articles/91656/elife-91656-fig1-data1-v2.pdf
Figure 2
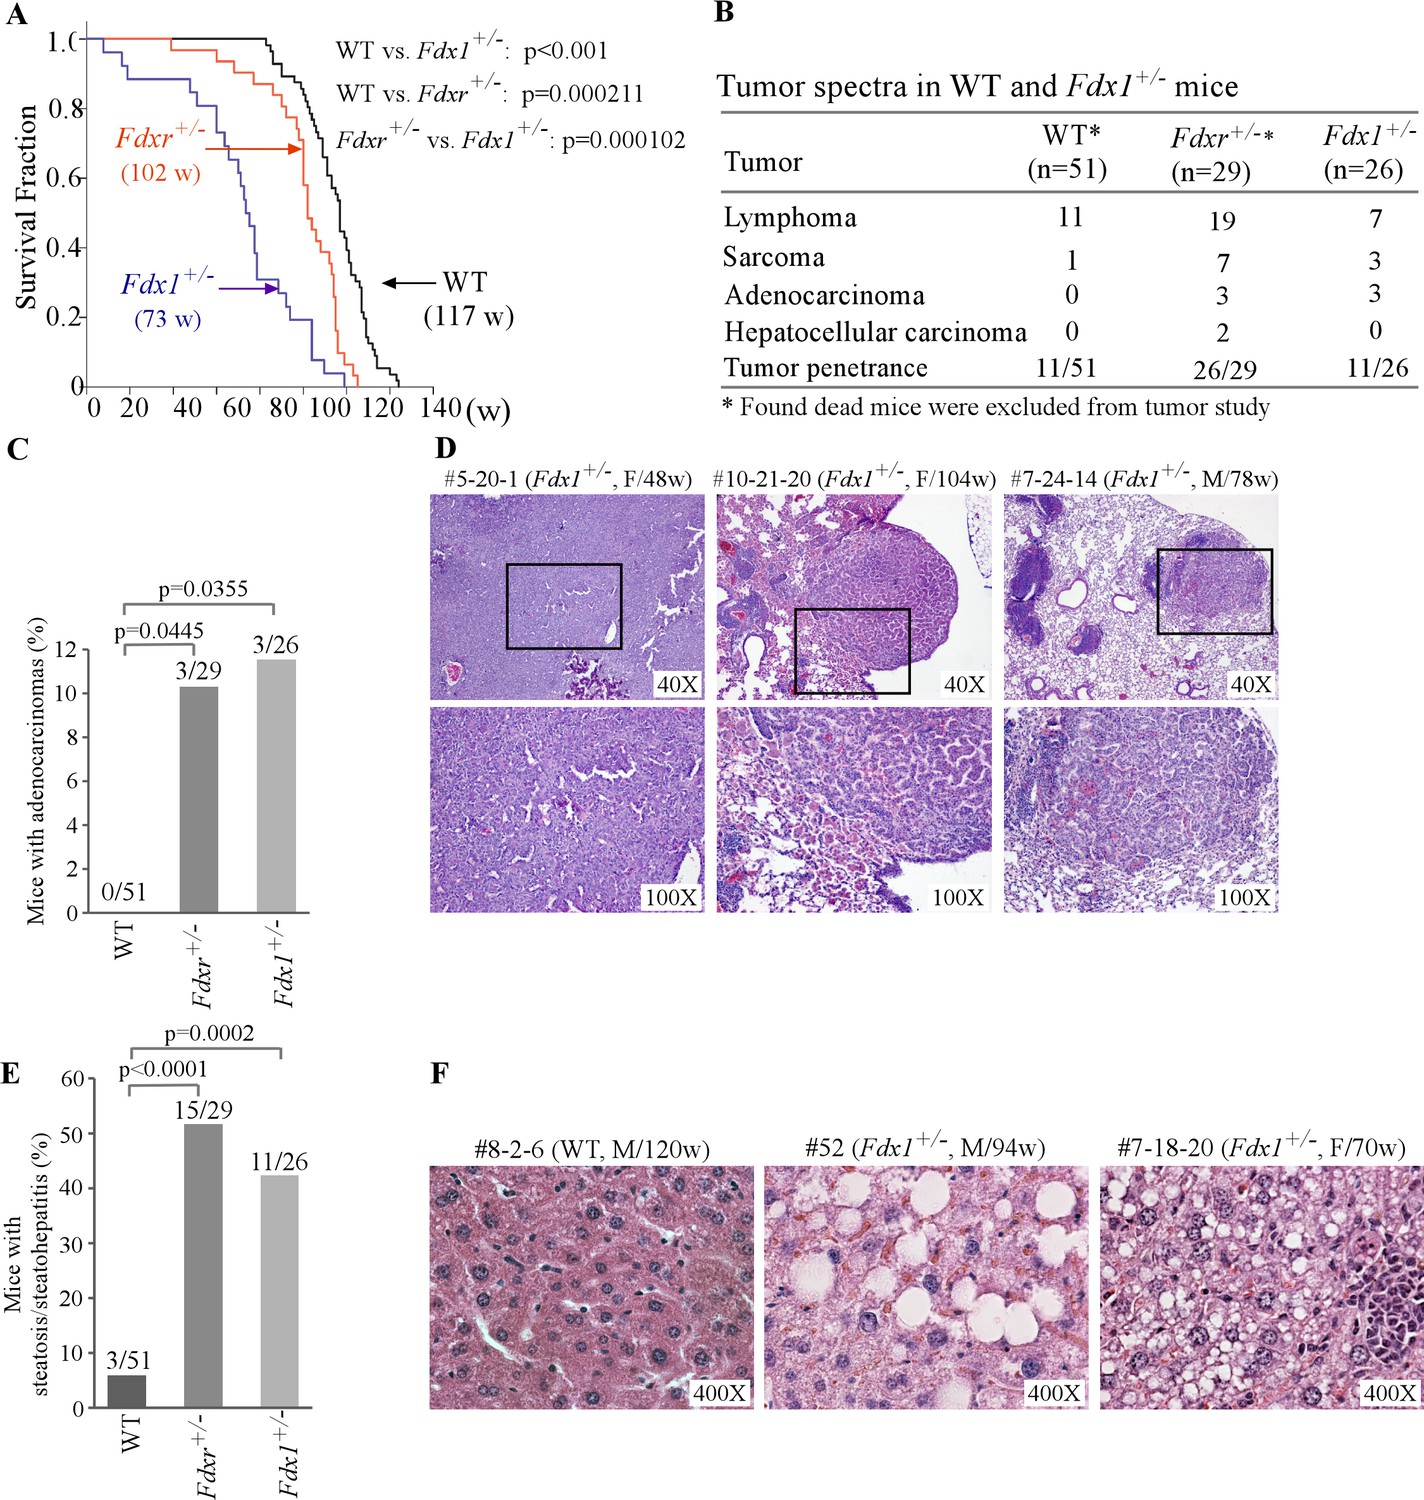
Fdx1+/- +/- have shorter life-span and increased incidence of adenocarcinoma and steatohepatitis.
(A) Kaplan-Meier survival curves of WT (n=56), Fdxr+/- (n=31), and Fdx1+/- (n=26) mice. (B) Tumor spectra and penetrance in WT, Fdxr+/-, and Fdx1+/- +/-. (C) The numbers and percentages of WT, Fdxr+/-, and Fdx1+/- +/- with adenocarcinoma. (D) Representative images of hematoxylin and eosin (H&E)-stained adenocarcinomas from Fdx1+/-mice. The images are of gastrointestinal tract-associated adenocarcinoma in mouse #5-20-1, whereas they are of lung adenocarcinoma in mice #10-21-20 and #7-24-14. (E) The numbers and percentages of WT, Fdxr+/-, and Fdx1+/- +/- with liver steatosis/steatohepatitis. (F) Representative images of hematoxylin and eosin (H&E)-stained WT and Fdx1+/- +/- showing steatosis in Fdx1-deficient mice.
-
Figure 2—source data 1
Kaplan-Meier survival analysis for various mice cohorts in Figure 2A.
- https://cdn.elifesciences.org/articles/91656/elife-91656-fig2-data1-v2.docx
-
Figure 2—source data 2
Analysis, graphs, and statistical significance for Figure 2C and E.
- https://cdn.elifesciences.org/articles/91656/elife-91656-fig2-data2-v2.xlsx
-
Figure 2—source data 3
Wild type (WT) mice (n=56) - survival time, tumor spectrum, steatosis, inflammation, and other abnormalities (A); Fdxr+/- mice (n=31) - survival time, tumor spectrum and other abnormalities (B); Fdx1+/- mice (n=26) - survival time, tumor spectrum, steatosis, inflammation, and other abnormalities (C).
- https://cdn.elifesciences.org/articles/91656/elife-91656-fig2-data3-v2.xlsx
Figure 3
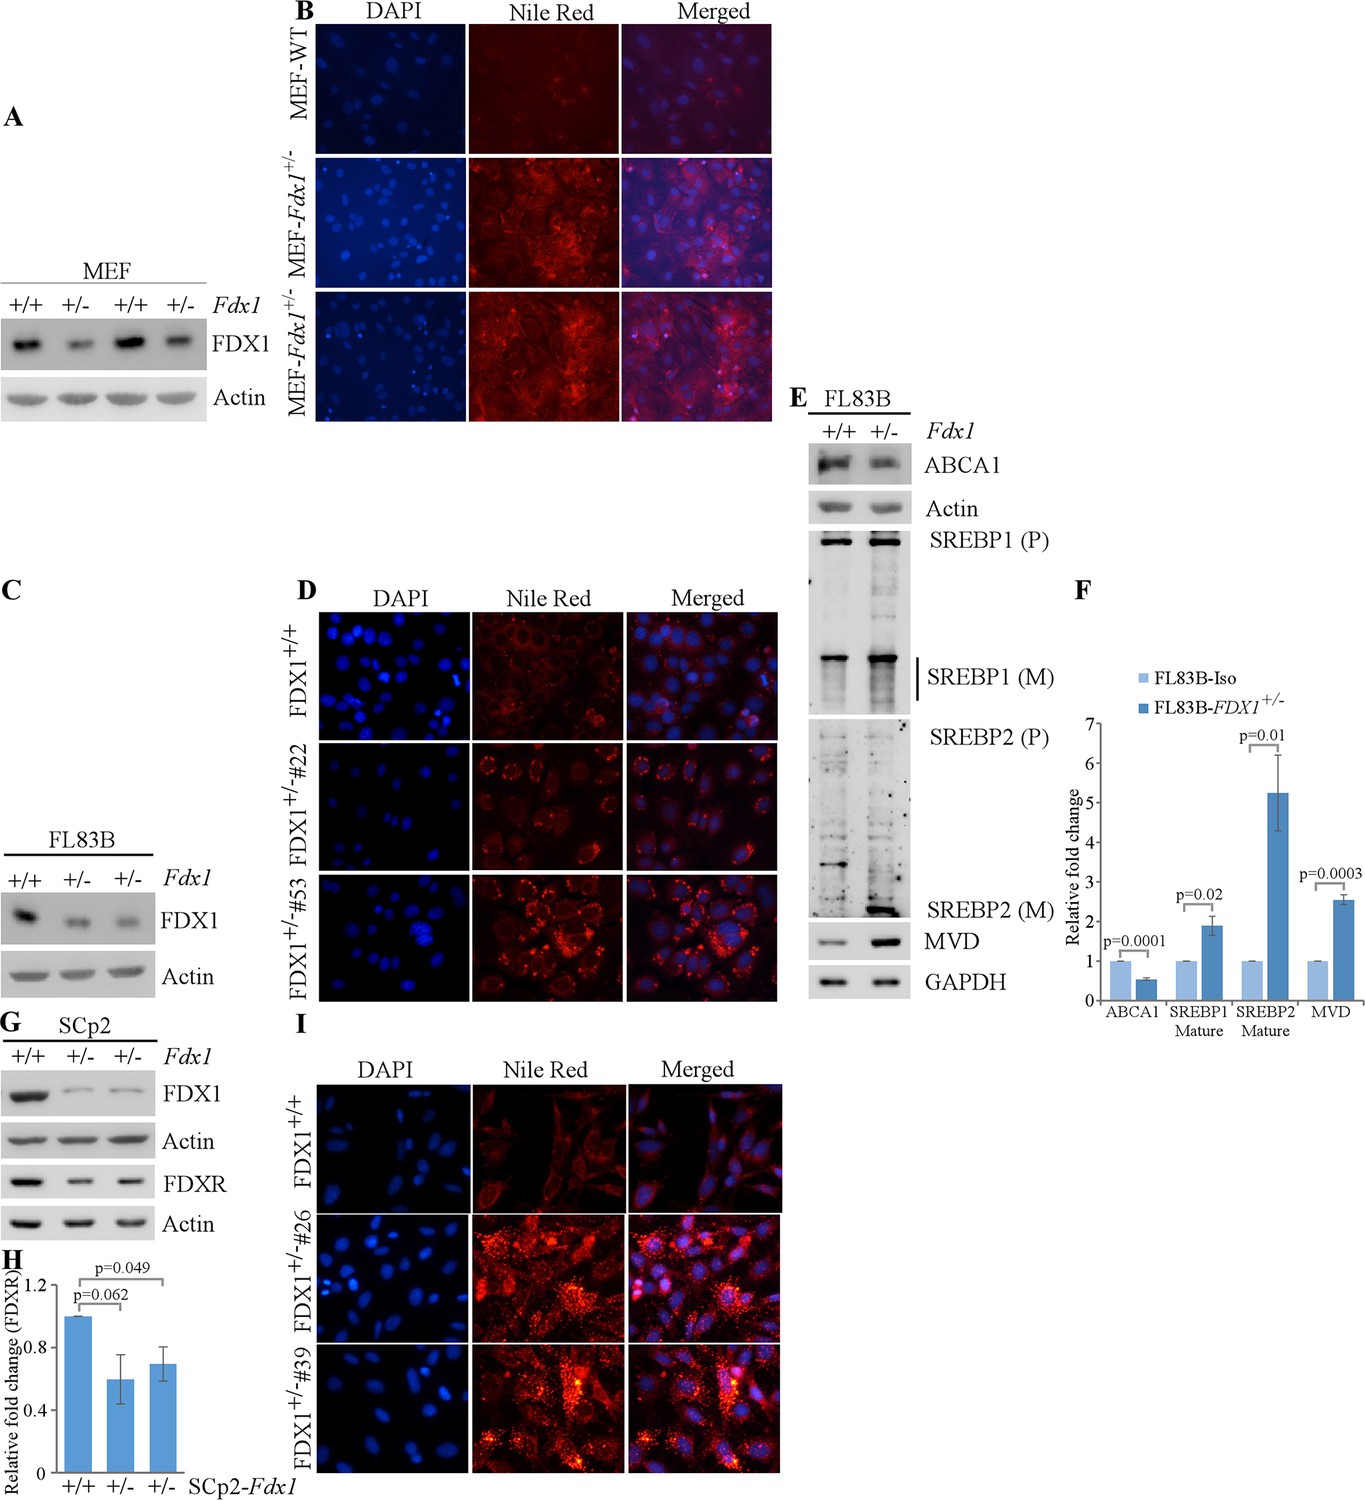
Lack of FDX1 leads to altered lipid metabolism possibly via ABCA1-SREBP1/2 pathways in murine cells.
(A) The levels of Fdx1 and Actin were measured in two sets of WT and Fdx1+/-+/-. (B) Lipid droplets were visualized with Nile Red staining (ex: 488 nm, em: 565 nm) in WT and Fdx1+/-+/- cultured in serum-free media for 4 hr. DAPI (ex: 358 nm, em: 461 nm) was used to stain nuclei. (C, G) The levels of Fdx1, Fdxr and Actin protein were measured by immunoblotting in isogenic control and two Fdx1+/-+/-83 B cells (D) or SCp2 cells (G). (D, I) Isogenic control and two Fdx1+/-+/-83B clones (clone#53 and #22) (E) or isogenic control and two Fdx1+/-+/-2 clones (clone#4 and #26) were cultured in serum-free media for 4 hr followed by Nile Red staining. DAPI was used to stain nuclei. (E) The levels of ABCA1, SREBP1/2, MVD, and Actin were measured in isogenic control and Fdx1+/-+/-83B cells cultured in serum-free media for 4 hr. (F, H) Quantification of Western blot bands from E (F) or G (H) using ImageJ. The graphs show relative fold change of the indicated proteins from at least three independent experiments. Data represent the mean ± SEM.
-
Figure 3—source data 1
Unedited western blot images for Figure 3A, C, E and G.
- https://cdn.elifesciences.org/articles/91656/elife-91656-fig3-data1-v2.pdf
-
Figure 3—source data 2
ImageJ analysis and statistical significance for Figure 3F and H.
- https://cdn.elifesciences.org/articles/91656/elife-91656-fig3-data2-v2.xlsx
Figure 4 with 1 supplement
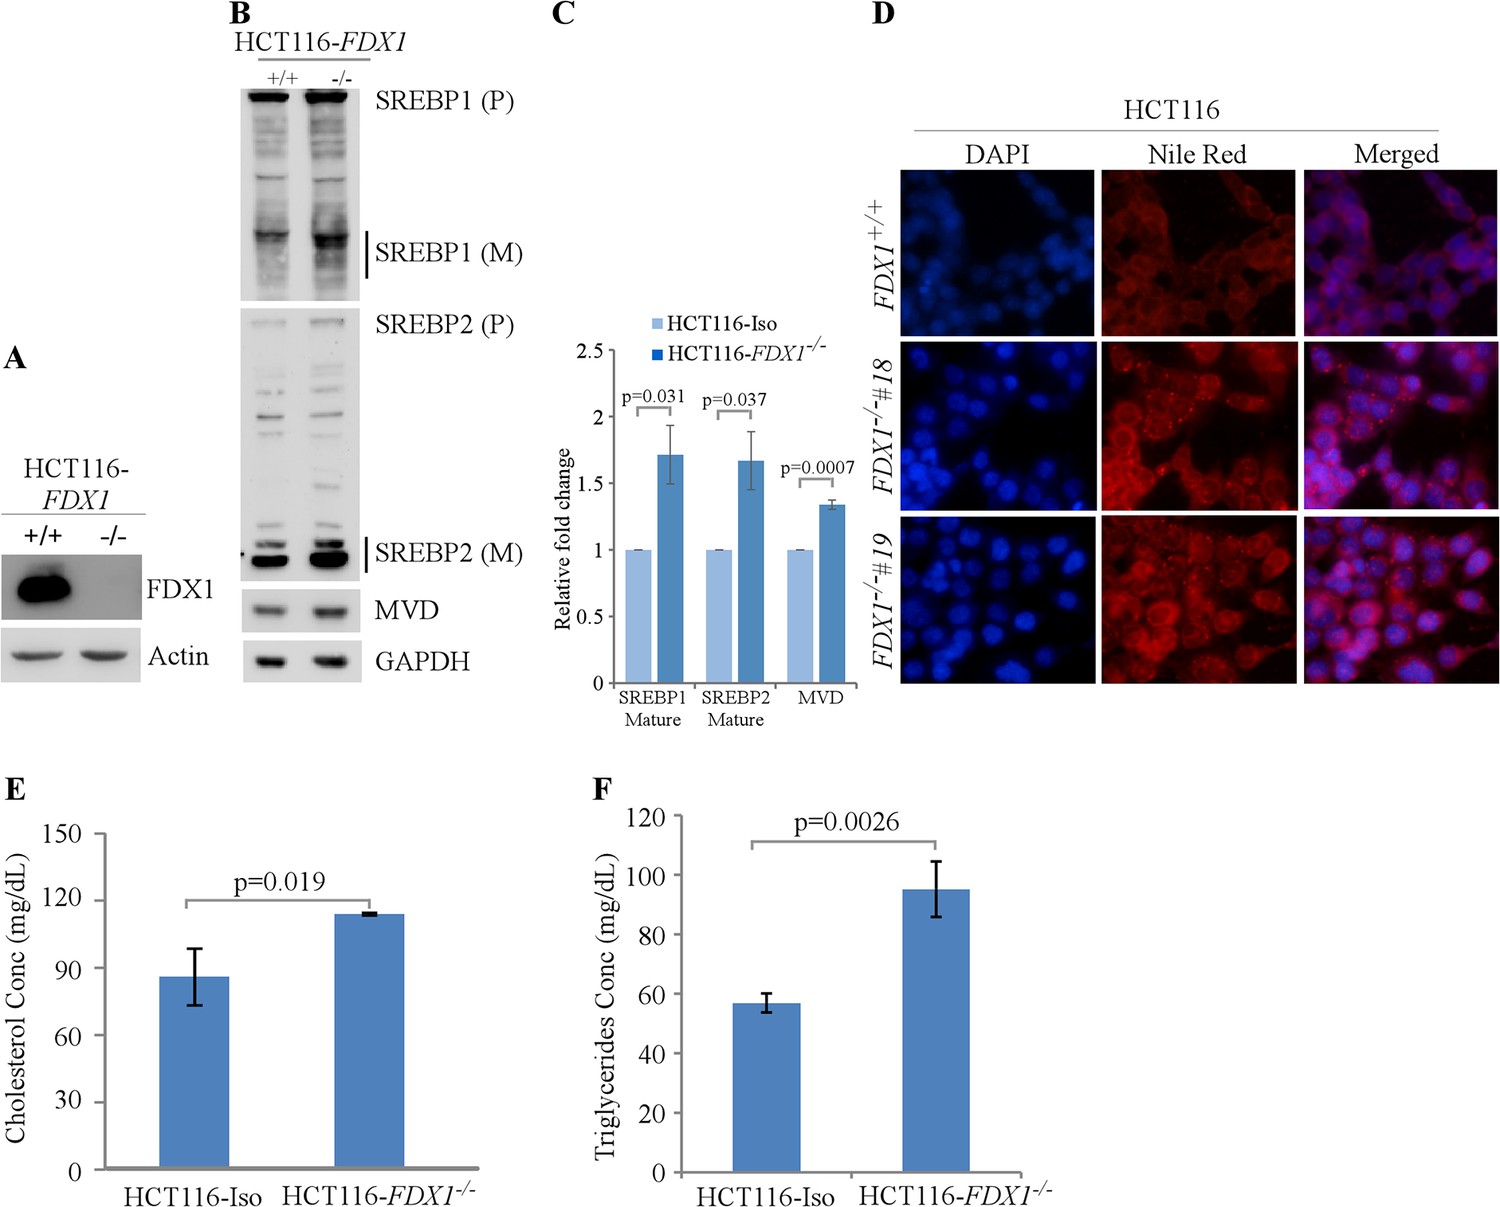
Lack of FDX1 leads to altered lipid metabolism possibly via SREBP1/2 pathways in human cells.
(A) The levels of FDX1 and Actin protein were measured by immunoblotting in isogenic control and FDX1-/- HCT116 cells. (B) The levels of SREBP1/2, MVD, and Actin were measured in isogenic control and FDX1-/- HCT116 cells cultured in serum-free media for 4 hr. (C) Quantification of Western blot bands from (B) using ImageJ. The graph shows relative fold change of the indicated proteins from at least 3 independent experiments. Data represent the mean ± SEM. (D) Lipid droplets were visualized with Nile Red staining (ex: 488 nm, em: 565 nm) in isogenic control and two FDX1-/- HCT116 clones (clone#18 and #19) cultured in serum-free media for 4 hr. DAPI (ex: 358 nm, em: 461 nm) was used to stain nuclei. (E) Quantitative measurement of intracellular cholesterol esters. Isogenic control and FDX1-/- HCT116 cells were cultured in a 96-well plate. After 4 hr of fasting, the level of total cholesterol was measured with Cholesterol/Cholesterol Ester-GloTM assay kit according to manufacturer’s instruction. Data represent the mean ± SD. (F) Quantitative measurement of intracellular triglycerides. Isogenic control and FDX1-/- HCT116 cells were cultured in a 96-well plate. After 4 hr of fasting, the level of total triglycerides was measured with Triglyceride-GloTM assay kit according to manufacturer’s instruction. Data represent the mean ± SD.
-
Figure 4—source data 1
Unedited western blot images for Figure 4A and B.
- https://cdn.elifesciences.org/articles/91656/elife-91656-fig4-data1-v2.pdf
-
Figure 4—source data 2
ImageJ analysis and statistical significance for Figure 4C.
- https://cdn.elifesciences.org/articles/91656/elife-91656-fig4-data2-v2.xlsx
-
Figure 4—source data 3
Analysis, graphs, and statistical significance for Figure 4E and F.
- https://cdn.elifesciences.org/articles/91656/elife-91656-fig4-data3-v2.xlsx
Figure 4—figure supplement 1
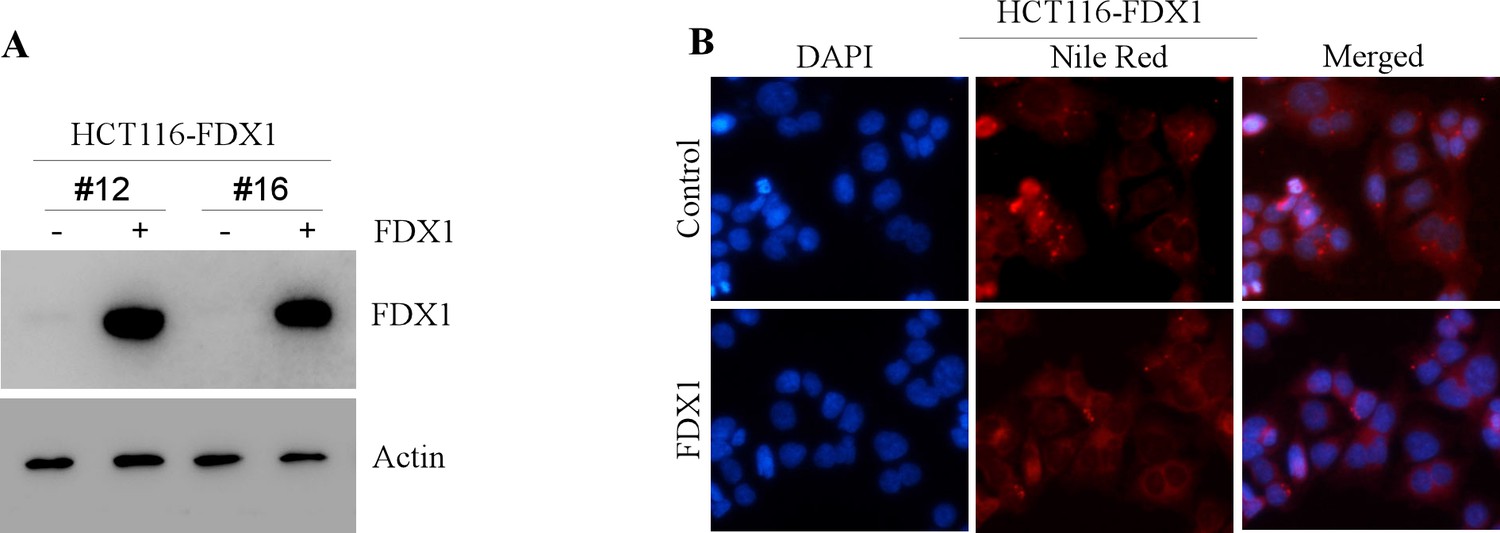
Over-expression of FDX1 leads to decrease in cytoplasmic lipid droplets in human cells.
(A) The levels of FDX1 and Actin protein were measured by immunoblotting in two different FDX1 overexpressing HCT116 clones with or without induction with Doxycycline. (B) Lipid droplets were visualized with Nile Red staining (ex: 488 nm, em: 565 nm) after FDX1 induction in HCT116 cells with doxycycline for 24 hr, followed by culturing in serum-free media for 4 hr. DAPI (ex: 358 nm, em: 461 nm) was used to stain nuclei.
-
Figure 4—figure supplement 1—source data 1
Unedited western blot images for Figure 1A.
- https://cdn.elifesciences.org/articles/91656/elife-91656-fig4-figsupp1-data1-v2.pdf
Figure 5 with 1 supplement
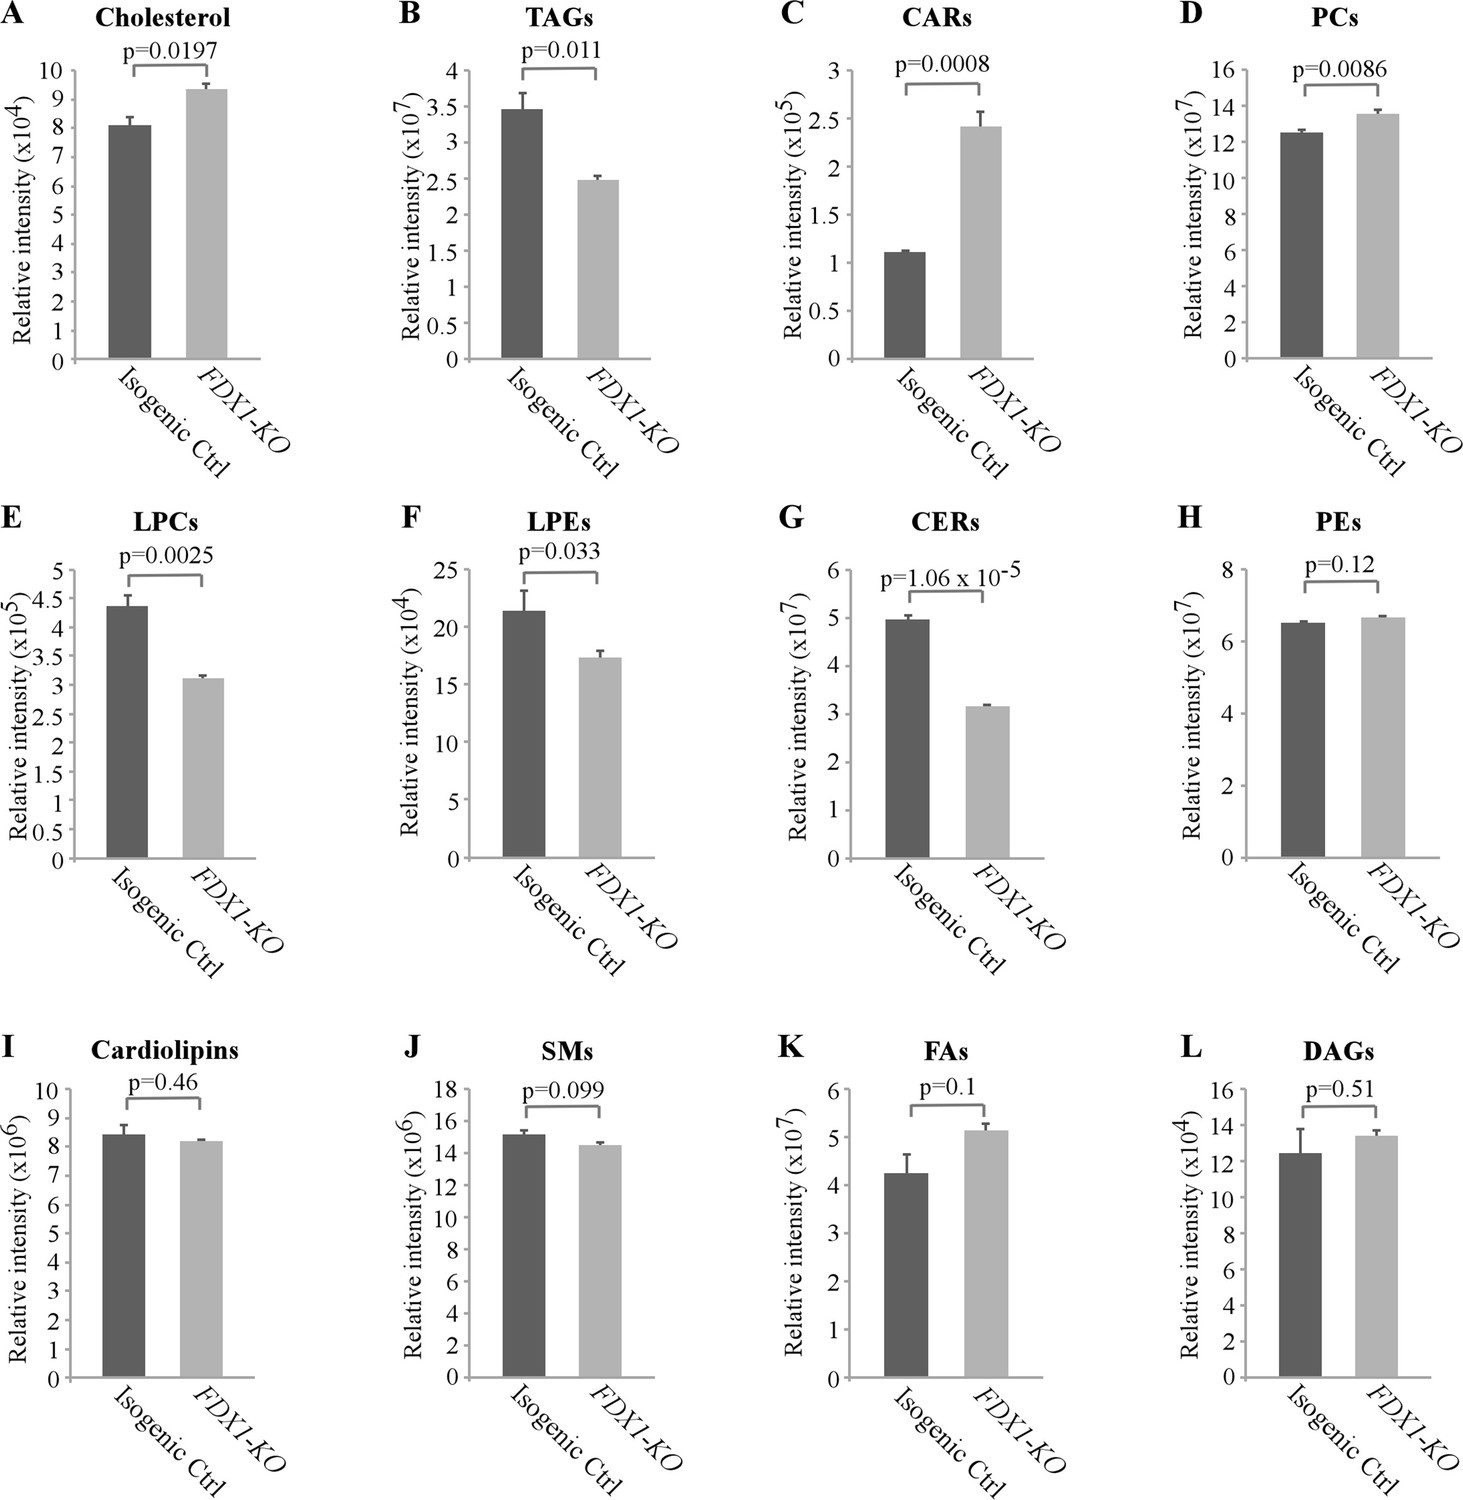
Lack of FDX1 leads to alterations in the lipid profile.
Isogenic control and FDX1-KO HCT116 cells were used for lipidomic analysis by LC-MS/MS. The relative abundance of a lipid was calculated as mean ± SEM and statistical significance was determined using Student’s t-test. (A) Cholesterol; (B) Triacylglycerides (TAGs); (C) Acylcarnitines (CARs); (D) Phosphatidylcholines (PCs); (E) Lysophosphatidylcholines (LPCs); (F) Lysophosphatidylethanolamines (LPEs); (G) Ceramides (CERs); (H) Phosphatidylethanolamines (PEs); (I) Cardiolipins; (J) Sphingomyeline (SMs); (K) Fatty acids (FAs); (L) Diacylglycerols (DAGs).
-
Figure 5—source data 1
Relative lipid classes abundance, analysis, graphs and statistical significance for Figure 5A–L.
- https://cdn.elifesciences.org/articles/91656/elife-91656-fig5-data1-v2.xlsx
Figure 5—figure supplement 1

Lack of FDX1 leads to alterations in the lipid profile.
Heatmap of the indicated classes of lipids clustered based on their intensity in isogenic control and FDX1-KO HCT116 cells. The heatmaps also indicate the relative values of different species of lipids identified from each class. Color intensity indicates z-score values of peak heights. (A) Cardiolipins and Cholesterol;; (B) Acylcarnitines (CARs); (C) Phosphatidylcholines (PCs); (D) Lysophosphatidylcholines (LPCs); (E) Lysophosphatidylethanolamines (LPEs); (F) Ceramides (CERs); (G) Triacylglycerides (TAGs).
Additional files
Download links
A two-part list of links to download the article, or parts of the article, in various formats.
Downloads (link to download the article as PDF)
Open citations (links to open the citations from this article in various online reference manager services)
Cite this article (links to download the citations from this article in formats compatible with various reference manager tools)
Ferredoxin 1 is essential for embryonic development and lipid homeostasis
eLife 13:e91656.
https://doi.org/10.7554/eLife.91656


