Sorting of secretory proteins at the trans-Golgi network by human TGN46
- ICFO-Institut de Ciencies Fotoniques, The Barcelona Institute of Science and Technology, Spain
- Institute for Research in Biomedicine (IRB Barcelona), The Barcelona Institute of Science and Technology, Spain
- School of Life Sciences, Tokyo University of Pharmacy and Life Sciences, Japan
- Centre for Genomic Regulation, The Barcelona Institute of Science and Technology, Spain
- Universitat Pompeu Fabra, Spain
- Institució Catalana de Recerca i Estudis Avançats (ICREA), Spain
Figures
Figure 1 with 1 supplement
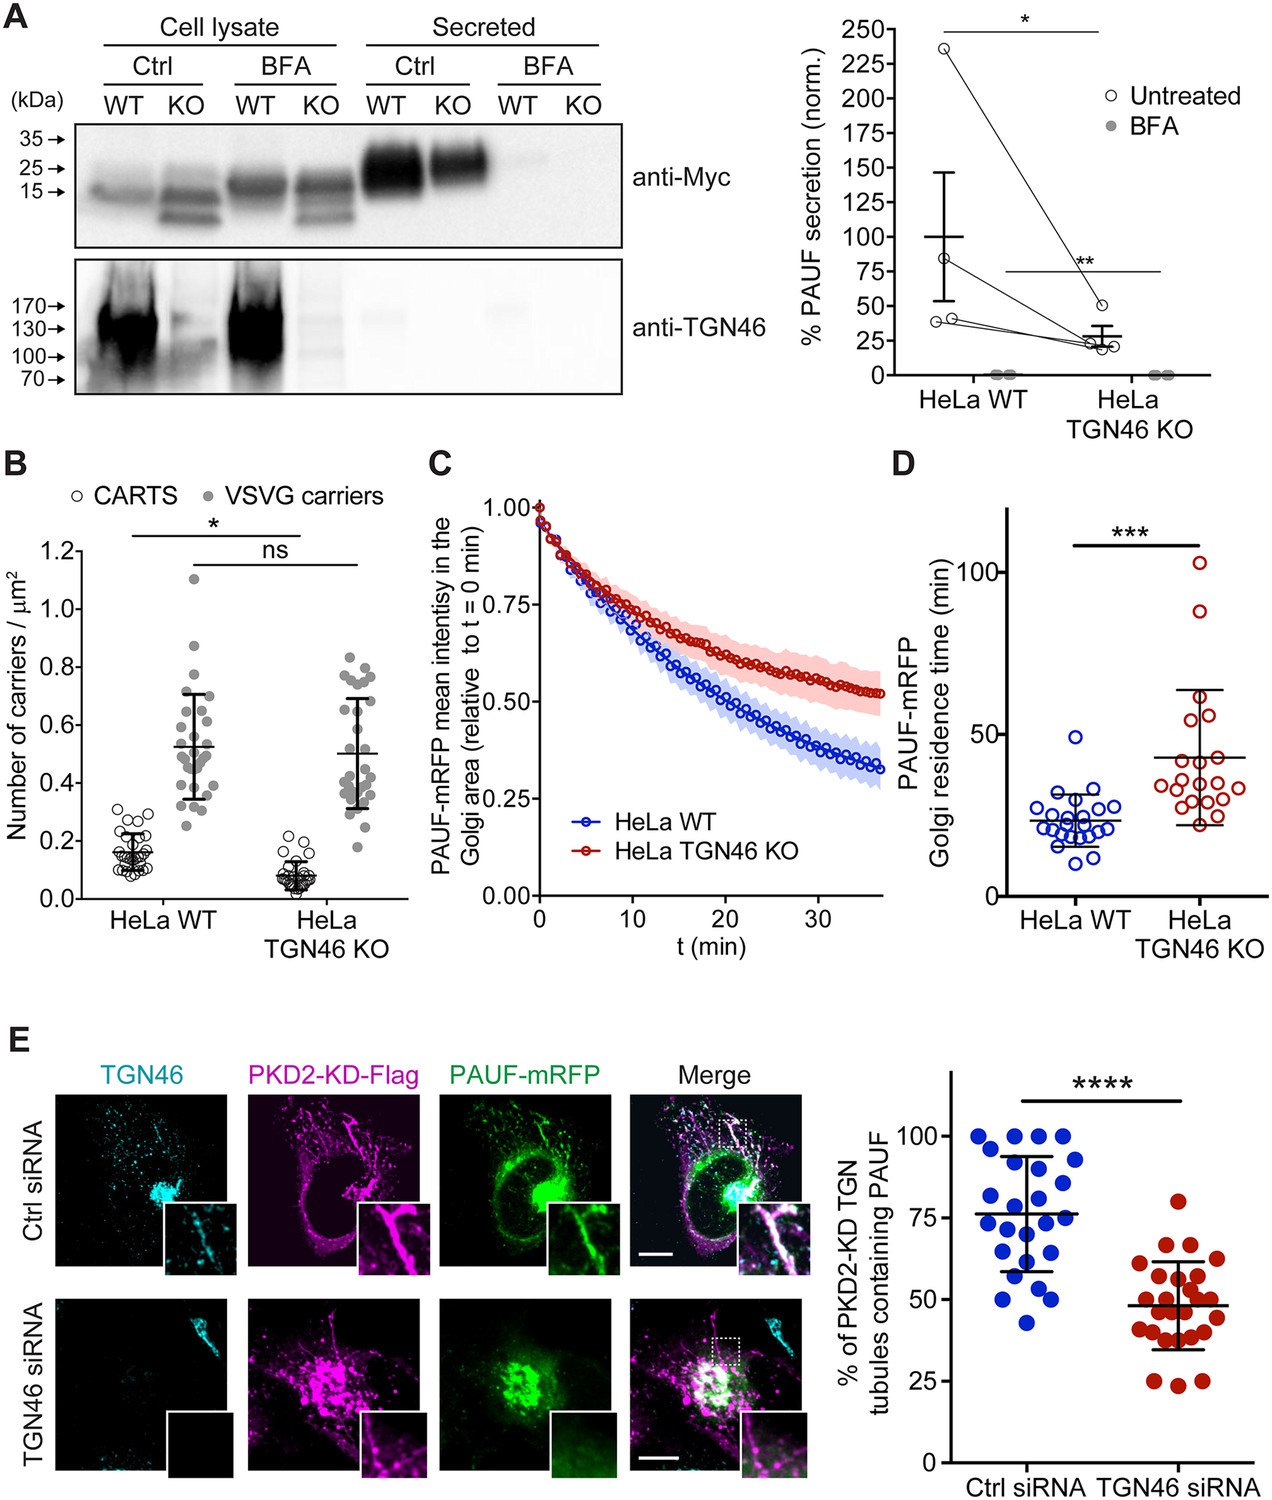
TGN46 is required for cargo sorting and loading into CARTS.
(A) Pancreatic adenocarcinoma upregulated factor (PAUF) secretion assay in parental (WT) and CRISPR/Cas9-mediated TGN46 knockout (KO) HeLa cells. Cells expressing PAUF-MycHis were incubated for 4 hr in fresh medium without serum in the absence (Ctrl) or presence of Brefeldin A (BFA), after which the cells were lysed. Equal amounts of cell lysates and their corresponding secreted fraction (medium) were analyzed by Western blotting (left) using an anti-Myc antibody (top blot) and anti-TGN46 antibody (bottom blot). BFA was included as a positive control of secretion inhibition. Quantification (right) of the ratio of secreted/internal PAUF signal normalized (norm.) as a percentage to the average value of the WT, Ctrl condition. n = 4 independent experiments. Individual values shown with connecting lines between paired datasets (shown only for untreated condition, for clarity), with mean ± stdev. Paired t test (*p ≤ 0.05; **p ≤ 0.01). (B) Number of carriers (CARTS, empty circles; VSVG carriers, gray circles) per unit area observed in WT or TGN46-KO HeLa cells expressing either PAUF-mRFP (CARTS marker) and VSVG-HA (VSVG carrier marker). At least 10 cells from each of n = 3 independent experiments were quantified. Individual values shown, with mean ± stdev. Unpaired two-tailed t test (ns, p > 0.05; *p ≤ 0.05). (C) Relative fluorescence intensity average time trace (mean ± standard error of the mean [s.e.m.]) of fluorescence loss in photobleaching (FLIP) experiments performed in WT or TGN46-KO HeLa cells expressing PAUF-mRFP. (D) Quantification of the PAUF-mRFP Golgi residence time as obtained from the FLIP experiments, as the one shown in (C). Between 7 and 12 cells from each of n = 3 independent experiments were quantified. Individual values shown, with mean ± stdev. Unpaired two-tailed t test (***p ≤ 0.001). (E) Left panels are confocal fluorescence microscopy images of HeLa cells transfected with control (Ctrl) or TGN46 siRNA, which were also transfected with PKD2-KD-Flag and PAUF-mRFP. Cells were fixed at steady state and labeled with anti-TGN46 (cyan) and anti-Flag (magenta) antibodies. PAUF-mRFP fluorescence signal is shown in green. Scale bars are 10 µm, magnifications of the boxed regions are shown. In the right panel, the quantification of the percentage of PKD2-KD-induced tubules that containing PAUF-mRFP in control (Ctrl) or TGN46 siRNA-treated cells. At least 10 cells from each of n = 3 independent experiments. Individual values shown, with mean ± stdev. Unpaired two-tailed t test (****p ≤ 0.0001).
-
Figure 1—source data 1
Uncropped images of the membranes of the Western blotting shown in Figure 1A.
- https://cdn.elifesciences.org/articles/91708/elife-91708-fig1-data1-v1.zip
Figure 1—figure supplement 1
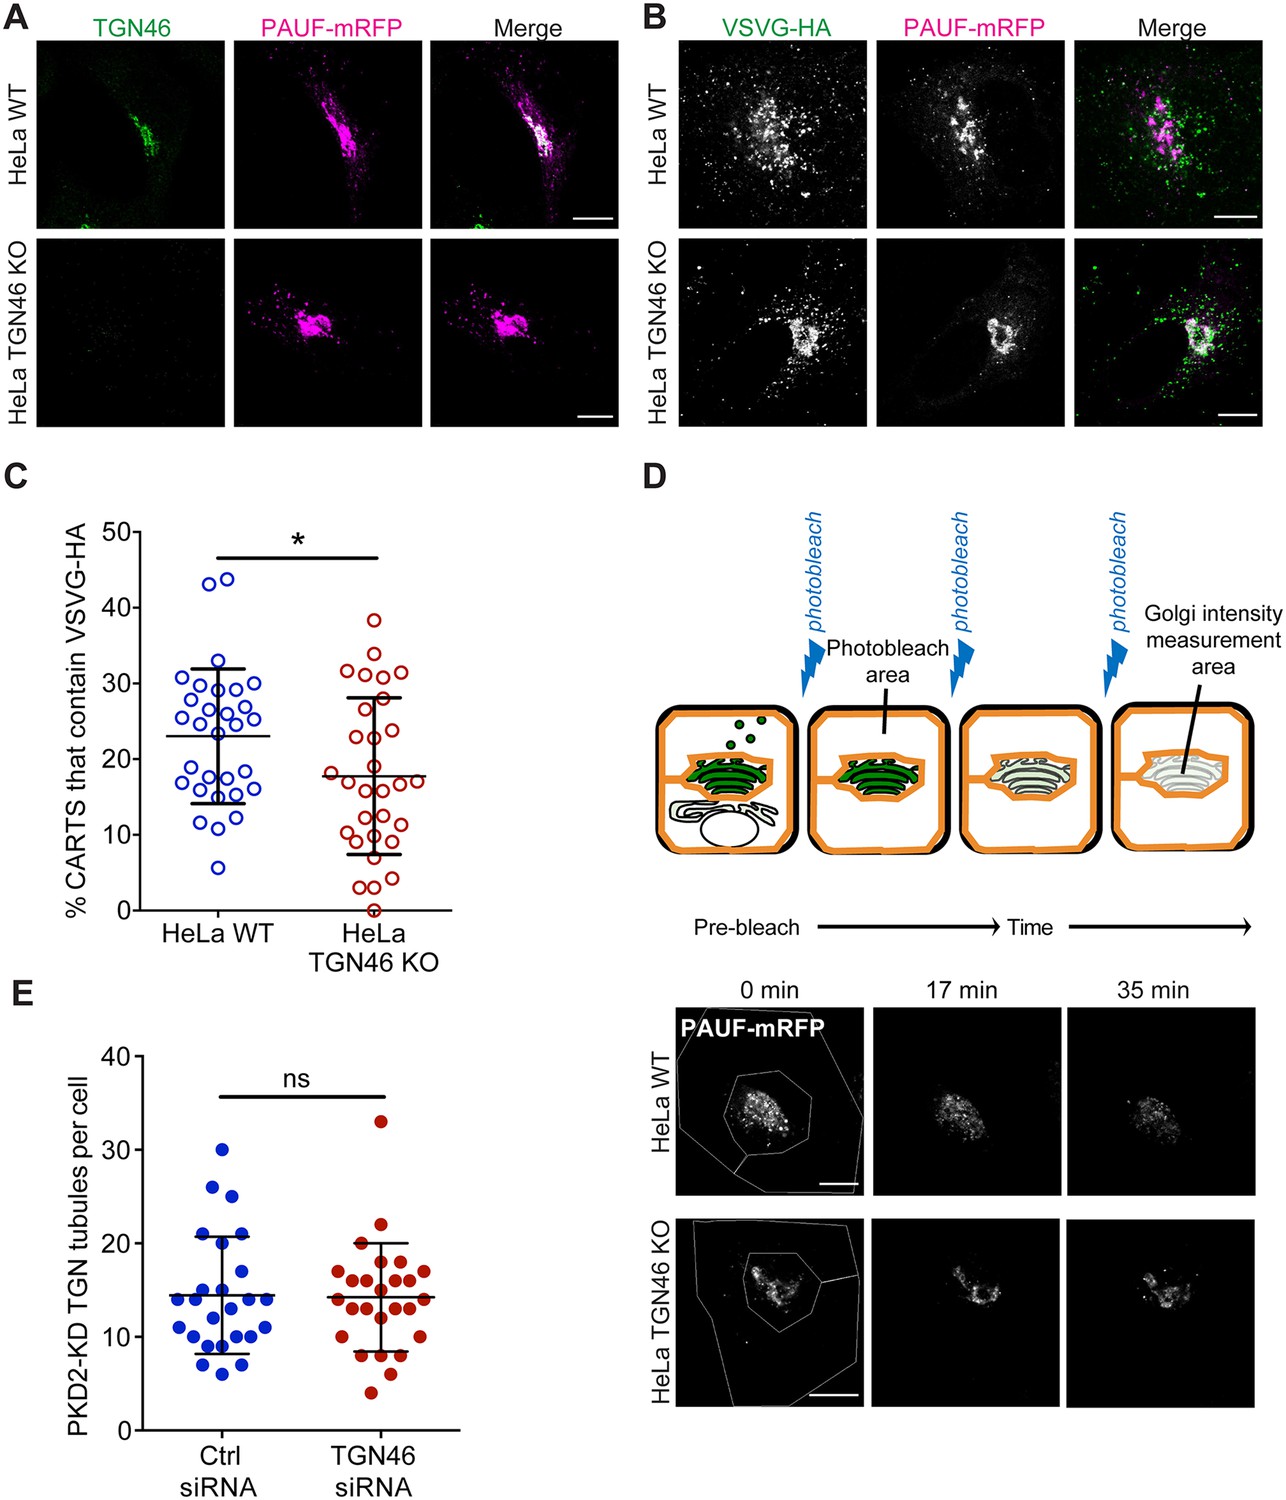
TGN46 is required for cargo sorting and loading into CARTS.
(A) HeLa WT or HeLa TGN46-KO cells expressing PAUF-mRFP were fixed, processed for immunostaining, and the localization of endogenous TGN46 and PAUF-mRFP was monitored by immunofluorescence microscopy. (B) HeLa WT or HeLa TGN46-KO cells expressing VSVG-HA and PAUF-mRFP were fixed, processed for immunostaining, and the localization of VSVG-HA and PAUF-mRFP was monitored by immunofluorescence microscopy. (C) Percentage of PAUF-mRFP-containing carriers (CARTS) that are also positive for VSVG-HA in HeLa WT or TGN46-KO cells, quantified from confocal micrographs as those shown in (B). Results are from at least 10 cells from each of n = 3 independent experiments (individual values shown, with mean ± stdev). Unpaired two-tailed t test (*p ≤ 0.05). (D) Top: Schematic representation of fluorescence loss in photobleaching (FLIP) experiments (see text and methods for details). Bottom: Fluorescence microscopy images obtained from a characteristic FLIP experiment assessing the export rate of PAUF-mRFP from the perinuclear area in either HeLa WT or HeLa TGN46-KO cells. Time from the beginning of the FLIP experiments is indicated, and the area enclosed by the white lines shown in the left images denotes the photobleached area. (E) Quantification of the number of PKD2-KD-containing tubules per cell in HeLa cells transfected with control (Ctrl) or TGN46-targeting siRNA. Results are from at least 10 cells from each of n = 3 independent experiments (individual values shown, with mean ± stdev). Unpaired two-tailed t test (ns, p > 0.05). Scale bars in (A, B, D) are 10 µm.
Figure 2
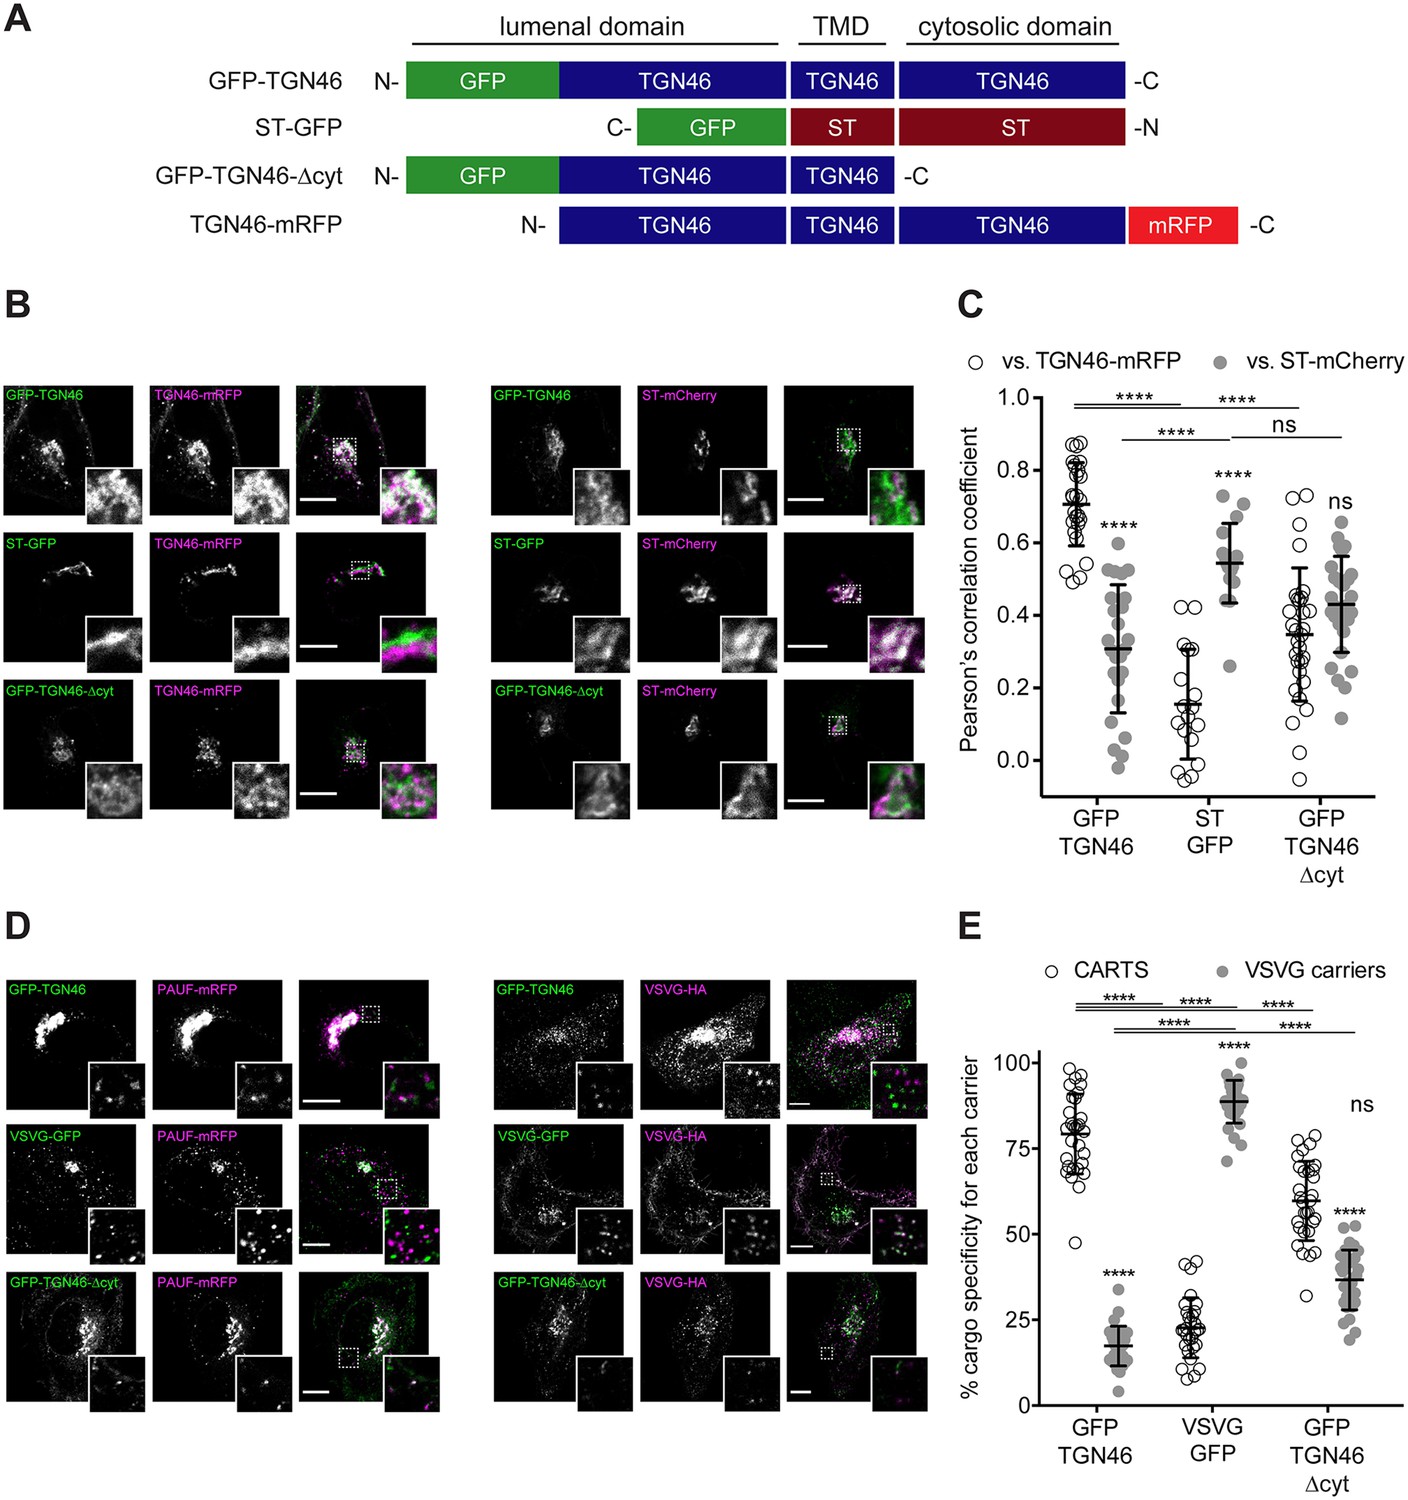
TGN46 export in CARTS is not dependent on cytosolic tail signals.
(A) Schematic representation of construct domain topology. Notice that type-I proteins (e.g., GFP-TGN46) have a lumenal N-terminal domain, whereas type-II proteins (e.g., ST-GFP) have a cytosolic N-terminal domain. TMD: transmembrane domain. (B) HeLa cells co-expressing the different indicated proteins (green and magenta channels) were fixed, and the localization of those proteins was monitored by fluorescence confocal microscopy. Insets correspond to zoom-in areas of the dashed, white boxed areas. (C) Pearson’s correlation coefficient between the perinuclear fluorescence signal of the x-axis indicated proteins with respect to TGN46-mRFP (empty circles) or ST-mCherry (gray circles), measured from confocal micrographs in (B). Results are from at least 10 cells from each of n = 3 independent experiments (individual values shown, with mean ± stdev; ns, p > 0.05; ****p ≤ 0.0001). (D) HeLa cells co-expressing the different indicated proteins (green and magenta channels) were fixed, processed for immunostaining when required, and the localization of those proteins was monitored by fluorescence confocal microscopy. Insets correspond to zoom-in areas of the dashed, white boxed areas. (E) Percentage of transport carriers containing each of the cargoes described on the x-axis that are also positive for pancreatic adenocarcinoma upregulated factor (PAUF; CARTS, empty circles) or VSVG (VSVG carriers, gray circles), as measured from confocal micrographs in (D). Results are from at least 10 cells from each of n = 3 independent experiments (individual values shown, with mean ± stdev; ns, p > 0.05; ****p ≤ 0.0001). Scale bars in (B, D) are 10 µm.
Figure 3 with 1 supplement
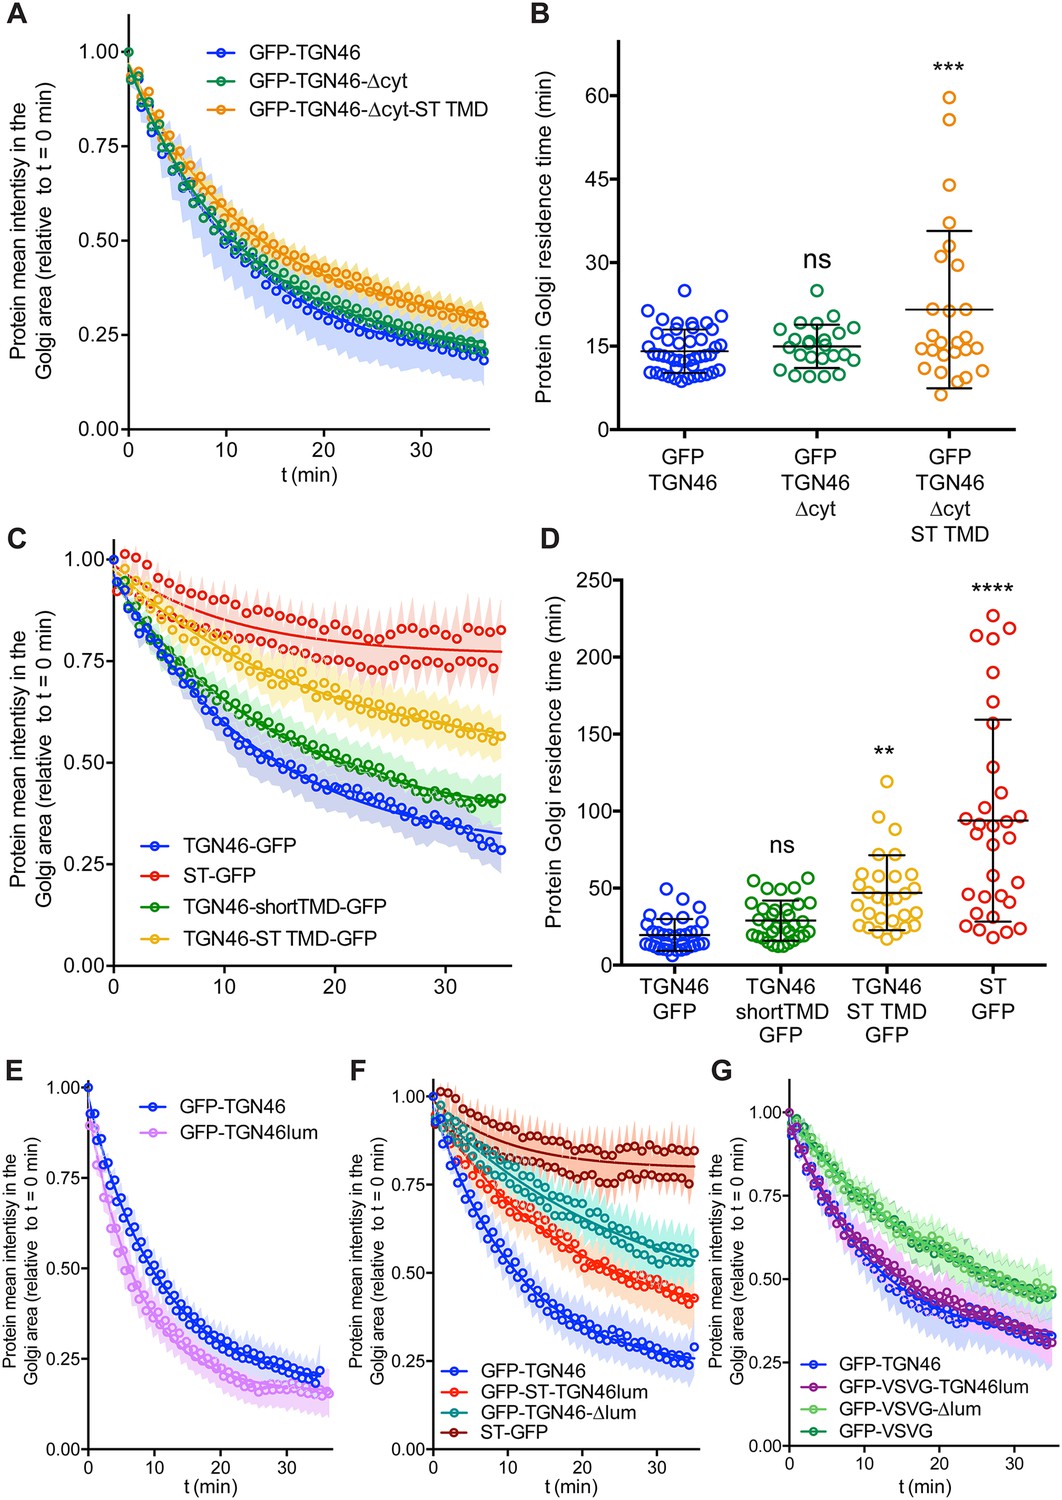
Fluorescence loss in photobleaching (FLIP) experiments monitor Golgi residence times of different proteins.
(A, C, E–G) Relative fluorescence intensity average time trace (mean ± standard error of the mean [s.e.m.]) of FLIP experiments for the indicated proteins. Symbols correspond to actual measurements, solid lines to the fitted exponential decays. (B, D) Residence time in the perinuclear area measured as the half time of the FLIP curves. Results are from 7 to 12 cells from each of n = 3 independent experiments (individual values shown, with mean ± stdev; ns, p > 0.05; **p ≤ 0.01; ***p ≤ 0.001; ****p ≤ 0.0001).
Figure 3—figure supplement 1
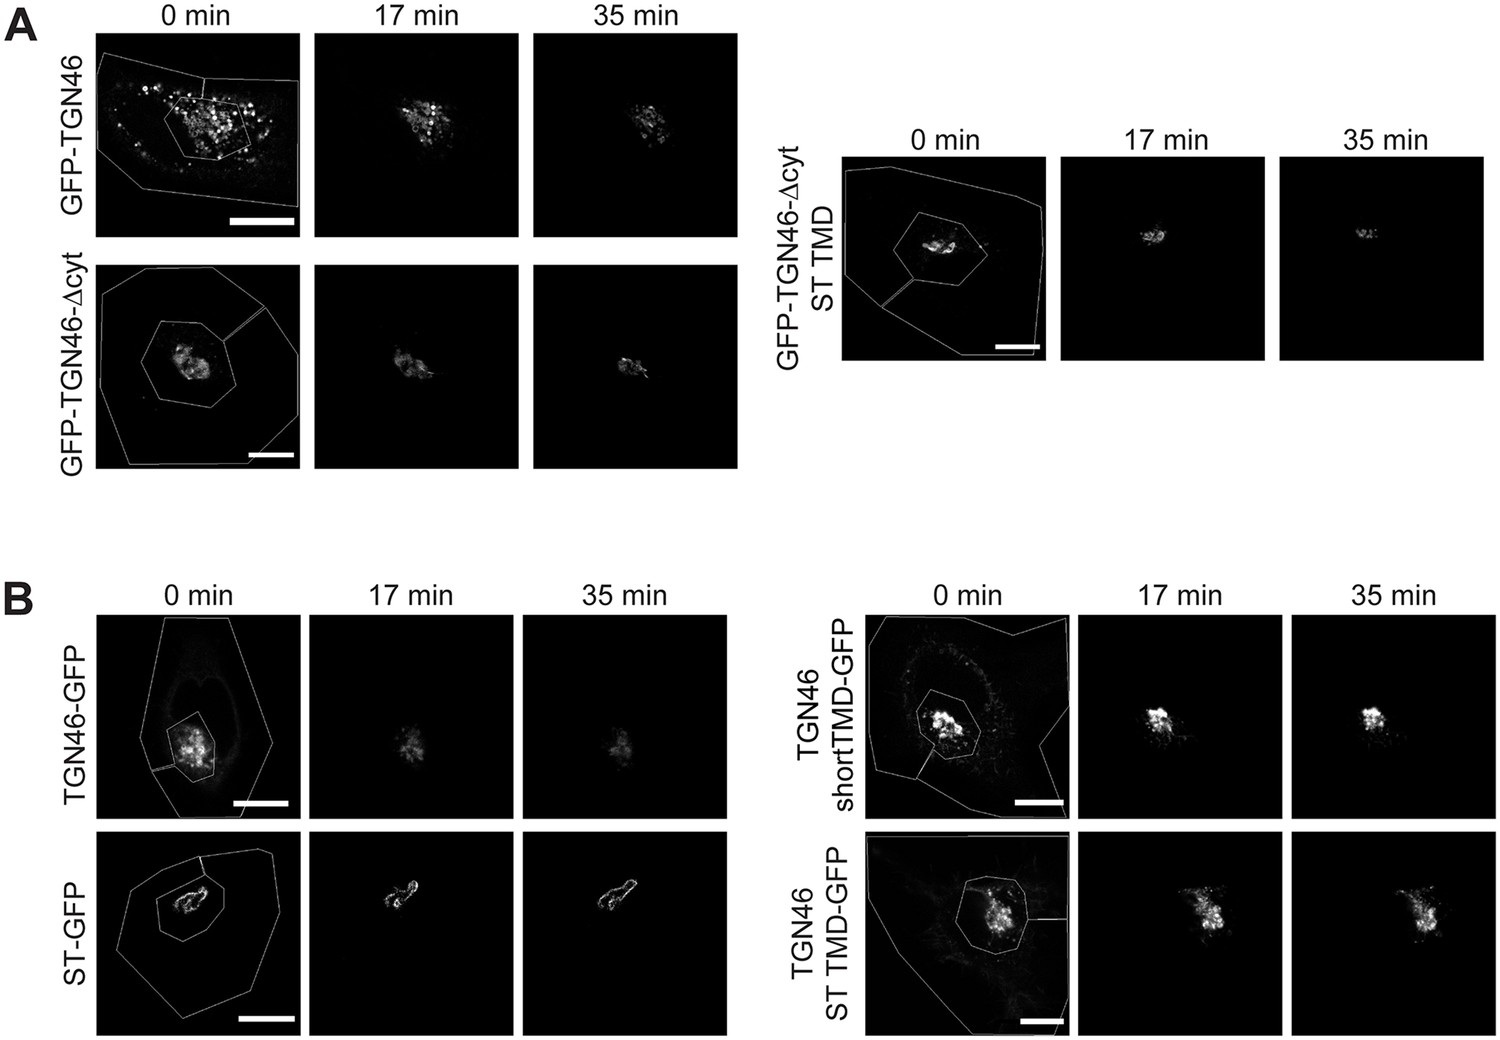
Fluorescence loss in photobleaching (FLIP) experiments monitor Golgi residence times of different proteins.
(A) Fluorescence microscopy images obtained from a characteristic FLIP experiment assessing the export rate of GFP-TGN46 (top left row), GFP-TGN46-∆cyt (bottom left row), or GFP-TGN46-∆cyt-ST TMD (right row) from the perinuclear area in HeLa cells. Time from the beginning of the FLIP experiments is indicated, and the area enclosed by the white lines shown in the left images denotes the photobleached area. (B) Fluorescence microscopy images obtained from a characteristic FLIP experiment assessing the export rate of TGN46 WT-GFP (top left row), ST-GFP (bottom left row), TGN46-shortTMD-GFP (top right row), or TGN46-ST TMD-GFP (bottom right row) from the perinuclear area in HeLa cells. Time from the beginning of the FLIP experiments is indicated, and the area enclosed by the white lines shown in the left images denotes the photobleached area. Scale bars are 10 µm.
Figure 4 with 3 supplements
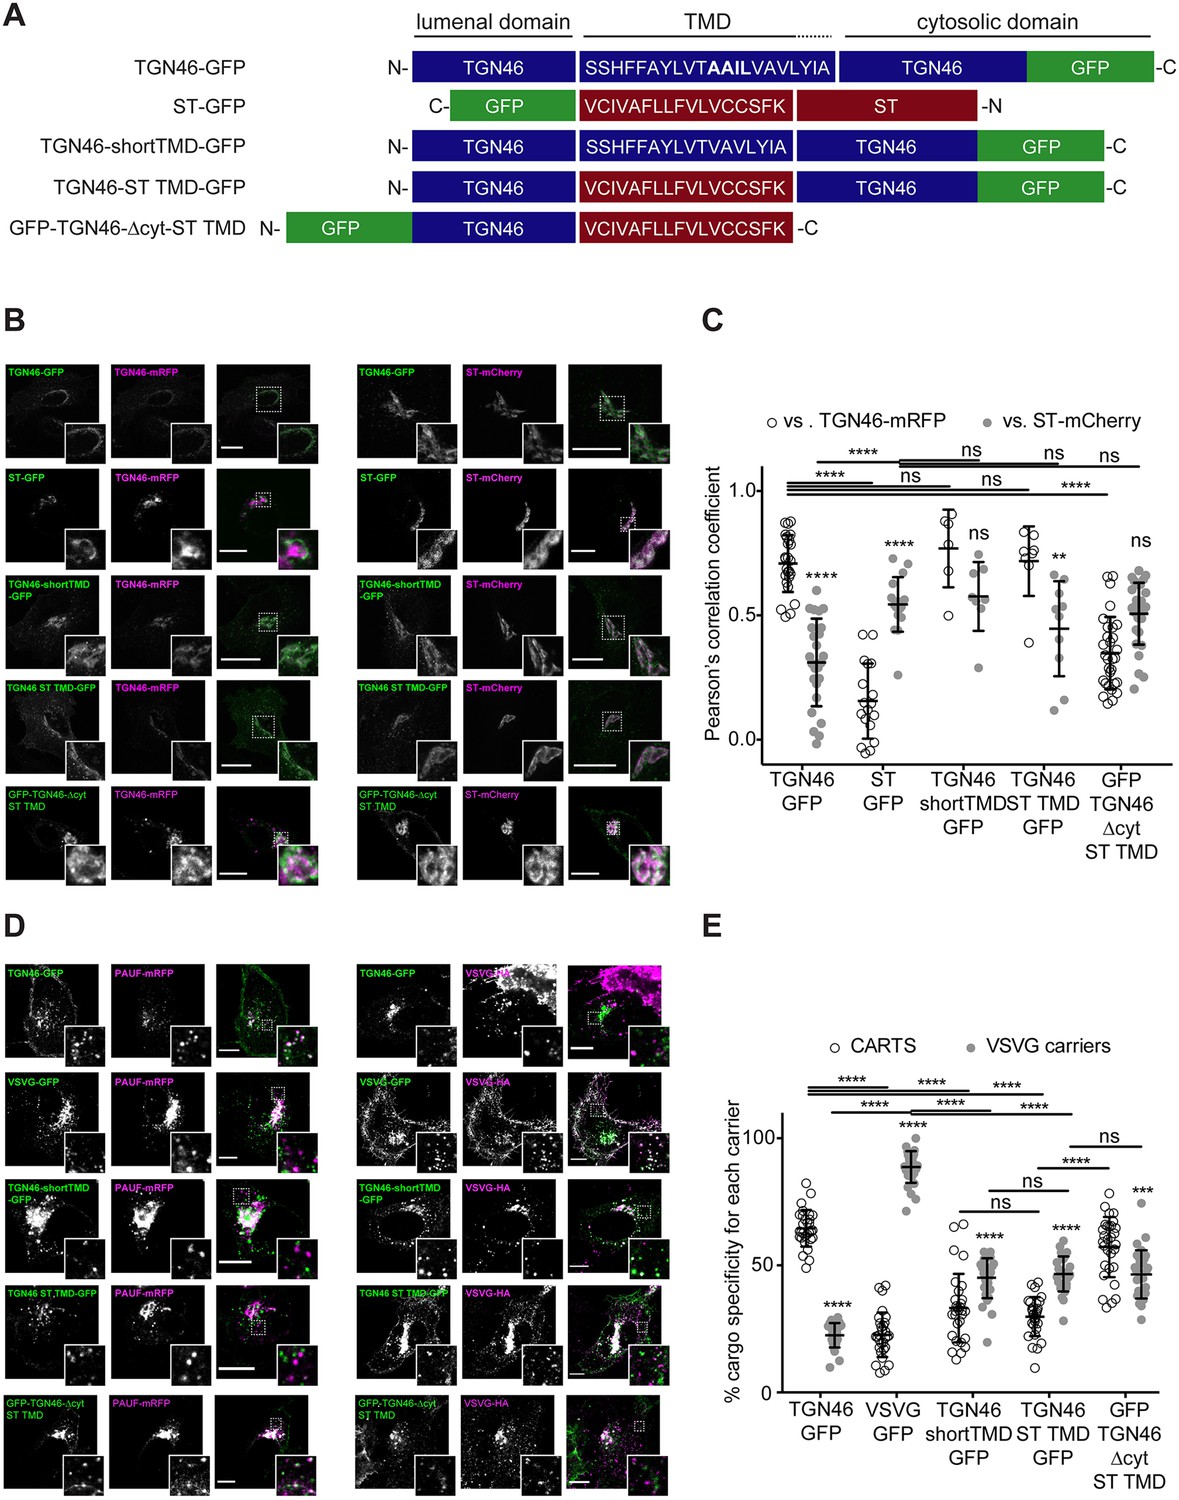
TGN46 intra-Golgi localization and CARTS specificity are insensitive to transmembrane domain (TMD) length and composition.
(A) Schematic representation of construct domain topology. The amino acid sequence (in the correct topology) of the different TMDs is indicated. (B) HeLa cells co-expressing the different indicated proteins (green and magenta channels) were fixed, and the localization of those proteins was monitored by fluorescence confocal microscopy. Insets correspond to zoom-in areas of the dashed, white boxed areas. (C) Pearson’s correlation coefficient between the perinuclear fluorescence signal of the x-axis indicated proteins with respect to TGN46-mRFP (empty circles) or ST-mCherry (gray circles), measured from confocal micrographs in (B). Results are at least three cells from each of n = 3 independent experiments (individual values shown, with mean ± stdev; ns, p > 0.05; **p ≤ 0.01; ****p ≤ 0.0001). (D) HeLa cells co-expressing the different indicated proteins (green and magenta channels) were fixed, processed for immunostaining when required, and the localization of those proteins was monitored by fluorescence confocal microscopy. Insets correspond to zoom-in areas of the dashed, white boxed areas. (E) Percentage of transport carriers containing each of the cargoes described on the x-axis that are also positive for pancreatic adenocarcinoma upregulated factor (PAUF; CARTS, empty circles) or VSVG (VSVG carriers, gray circles), as measured from confocal micrographs in (D). Results are from at least 10 cells from each of n = 3 independent experiments (individual values shown, with mean ± stdev; ns, p > 0.05; ***p ≤ 0.001; ****p ≤ 0.0001). Scale bars in (B, D) are 10 µm.
Figure 4—figure supplement 1
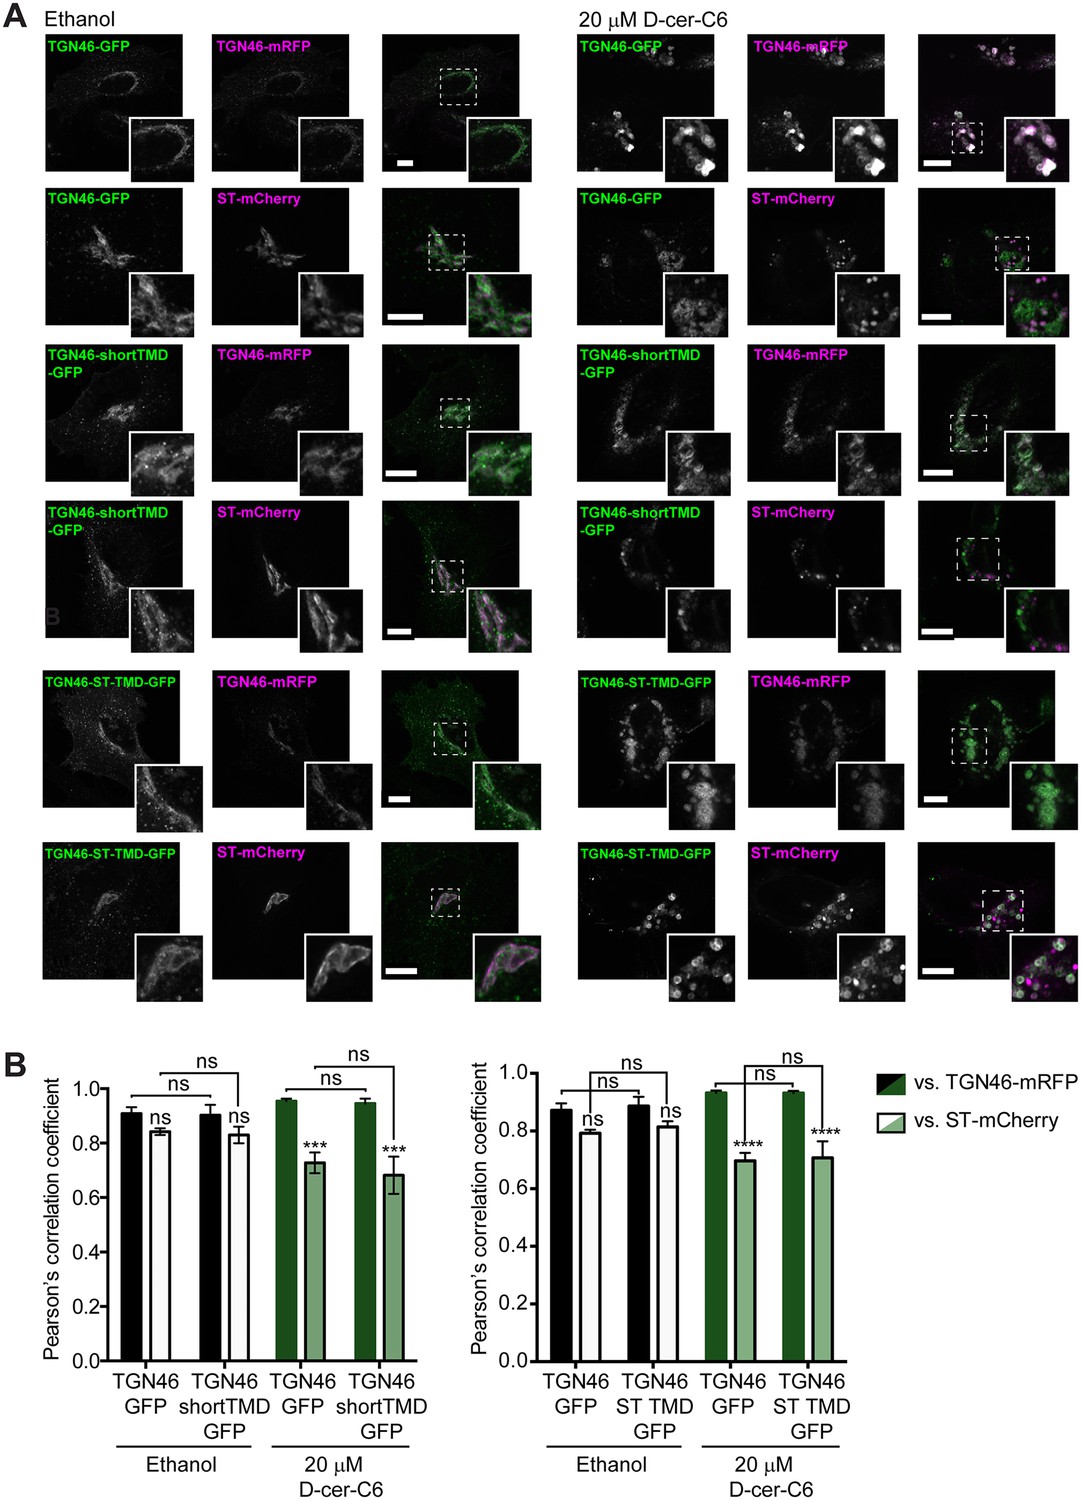
Effect of sphingolipid metabolism on the intra-Golgi localization of TGN46 mutants.
(A) HeLa cells expressing TGN46-GFP, TGN46-shortTMD-GFP, or TGN46-ST TMD-GFP together with TGN46-mRFP or ST-mCherry were treated with ethanol or with 20 μM D-cer-C6 for 4 hr. The localization of these proteins was monitored by fluorescence microscopy. Insets correspond to zoom-in areas of the dashed, white boxed areas. Scale bar, 10 μm. (B) Quantitation of the relative colocalization of the different proteins in the experiments shown in (A), as measured by the Pearson’s correlation coefficient between the green and red channels. Bars show the mean values ± standard error of the mean (s.e.m.) of ≥10 cells counted from three independent experiments; ns, p > 0.05; ***p ≤ 0.001; ****p ≤ 0.0001.
Figure 4—figure supplement 2
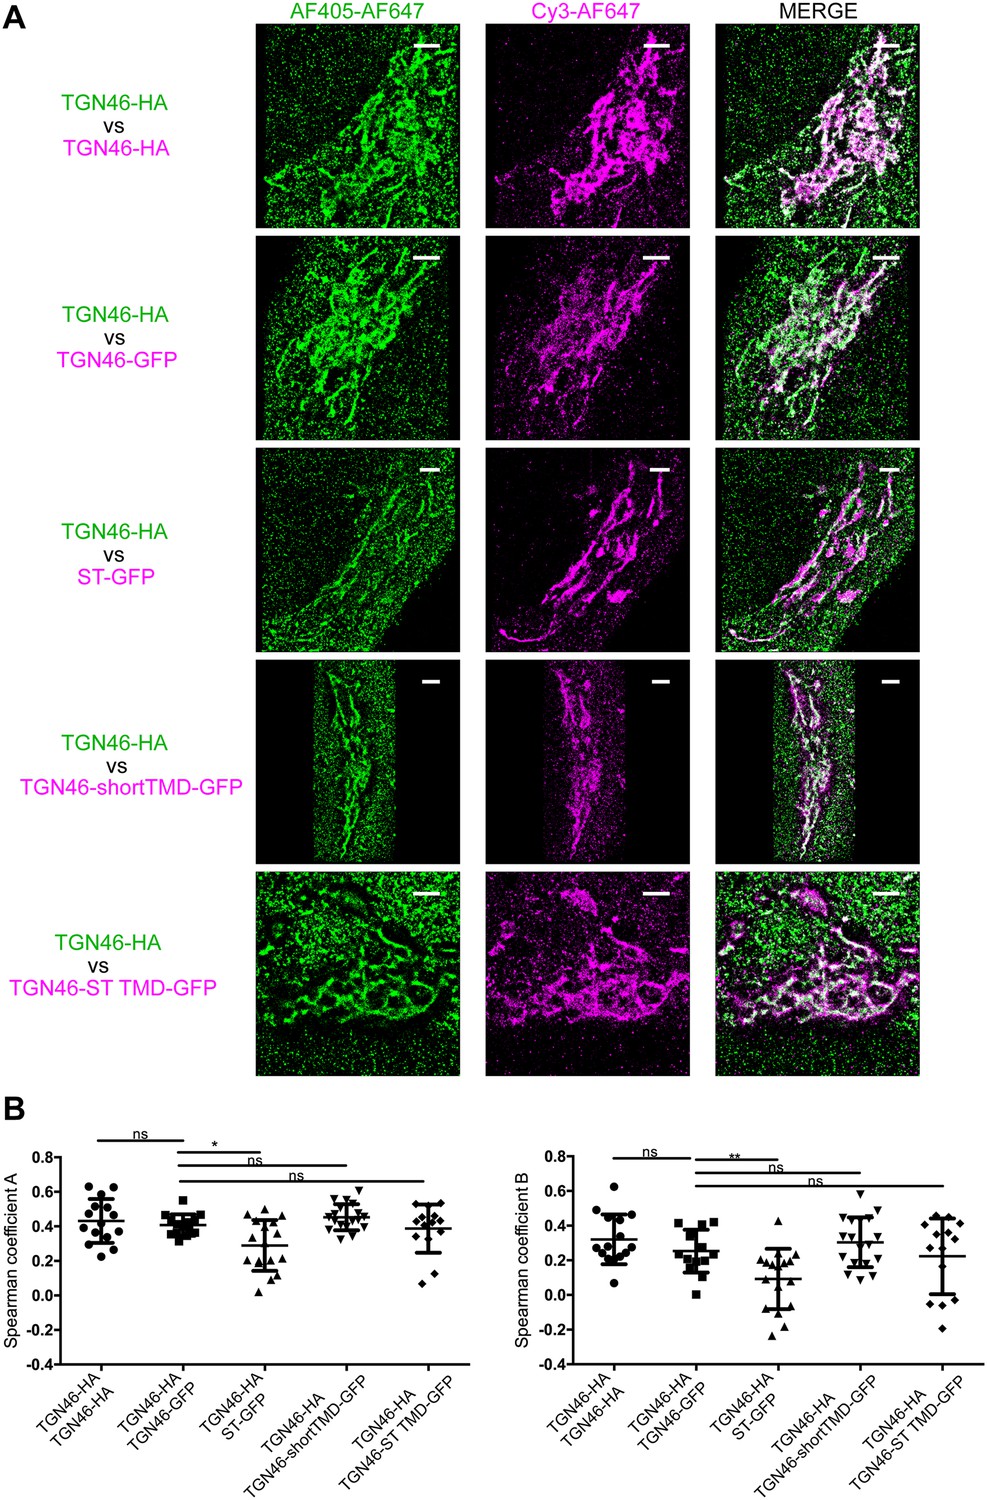
STORM analysis of intra-Golgi localization of different TGN46 mutants.
(A) Representative dual-color STORM images of TGN46-HA, labeled using AlexaFluor 405-AlexaFluor 647 (AF405-AF647) conjugated secondary antibodies (green channel), together with TGN46-HA, TGN46-GFP, ST-GFP, TGN46-shortTMD-GFP, or TGN46-ST TMD-GFP, labeled using Cy3-AlexaFluor 647 (Cy3-AF647) conjugated secondary antibodies (magenta channel). Images were rendered using Insight3. Scale bars are 2 µm. (B) Plots of the Spearman coefficient A (between green:magenta channels) and B (between magenta:green channels). Distributions contain information from >5 cells from each of n = 3 independent experiments; individual values are shown, with mean ± stdev; ns, p > 0.05; *p ≤ 0.05; **p ≤ 0.01.
Figure 4—figure supplement 3
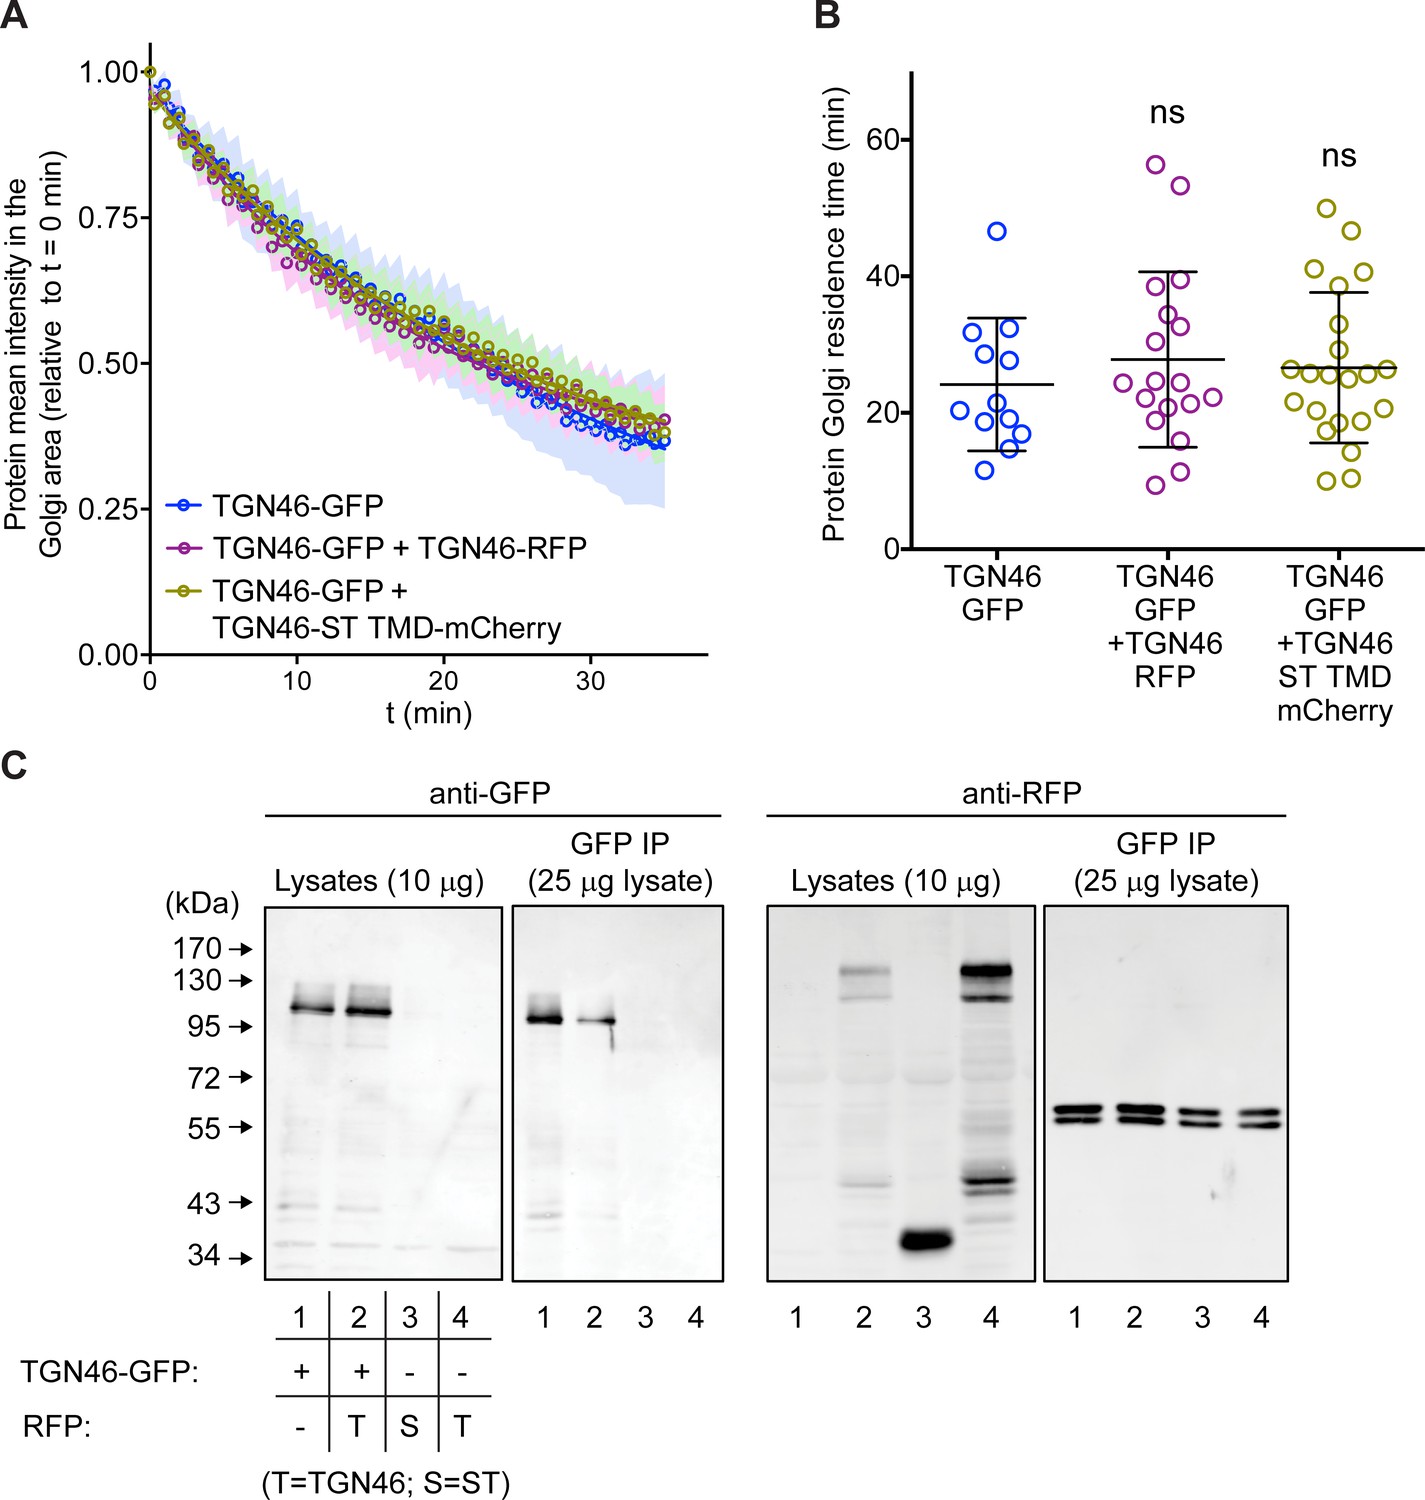
Co-expression of different TGN46 proteins does not affect CARTS biogenesis or cargo export rate.
(A) Relative fluorescence intensity average time trace (mean ± standard error of the mean [s.e.m.]) of fluorescence loss in photobleaching (FLIP) experiments for TGN46-GFP obtained in cells expressing the different indicated proteins. Symbols correspond to actual measurements, solid lines to the fitted exponential decays. (B) Residence time in the perinuclear area measured as the half time of the FLIP curves shown in (A). Results are from 4 to 10 cells from each of n = 3 independent experiments (individual values shown, with mean ± stdev). (C) TGN46-GFP and TGN46-mRFP do not co-immunoprecipitate. HeLa cells expressing TGN46-GFP (lane 1), TGN46-GFP and TGN46-mRFP (lane 2), ST-mCherry (lane 3), or TGN46-mRFP (lane 4), were lysed and part of the lysate was immunoprecipitated with an anti-GFP antibody. Both the lysate and immunoprecipitated fraction were analyzed by sodium dodecyl sulfate–polyacrylamide gel electrophoresis (SDS–PAGE) and Western blotting with anti-GFP and anti-RFP antibodies.
-
Figure 4—figure supplement 3—source data 1
Uncropped images of the membranes of the Western blotting shown in Figure 4—figure supplement 3C.
- https://cdn.elifesciences.org/articles/91708/elife-91708-fig4-figsupp3-data1-v1.zip
Figure 5
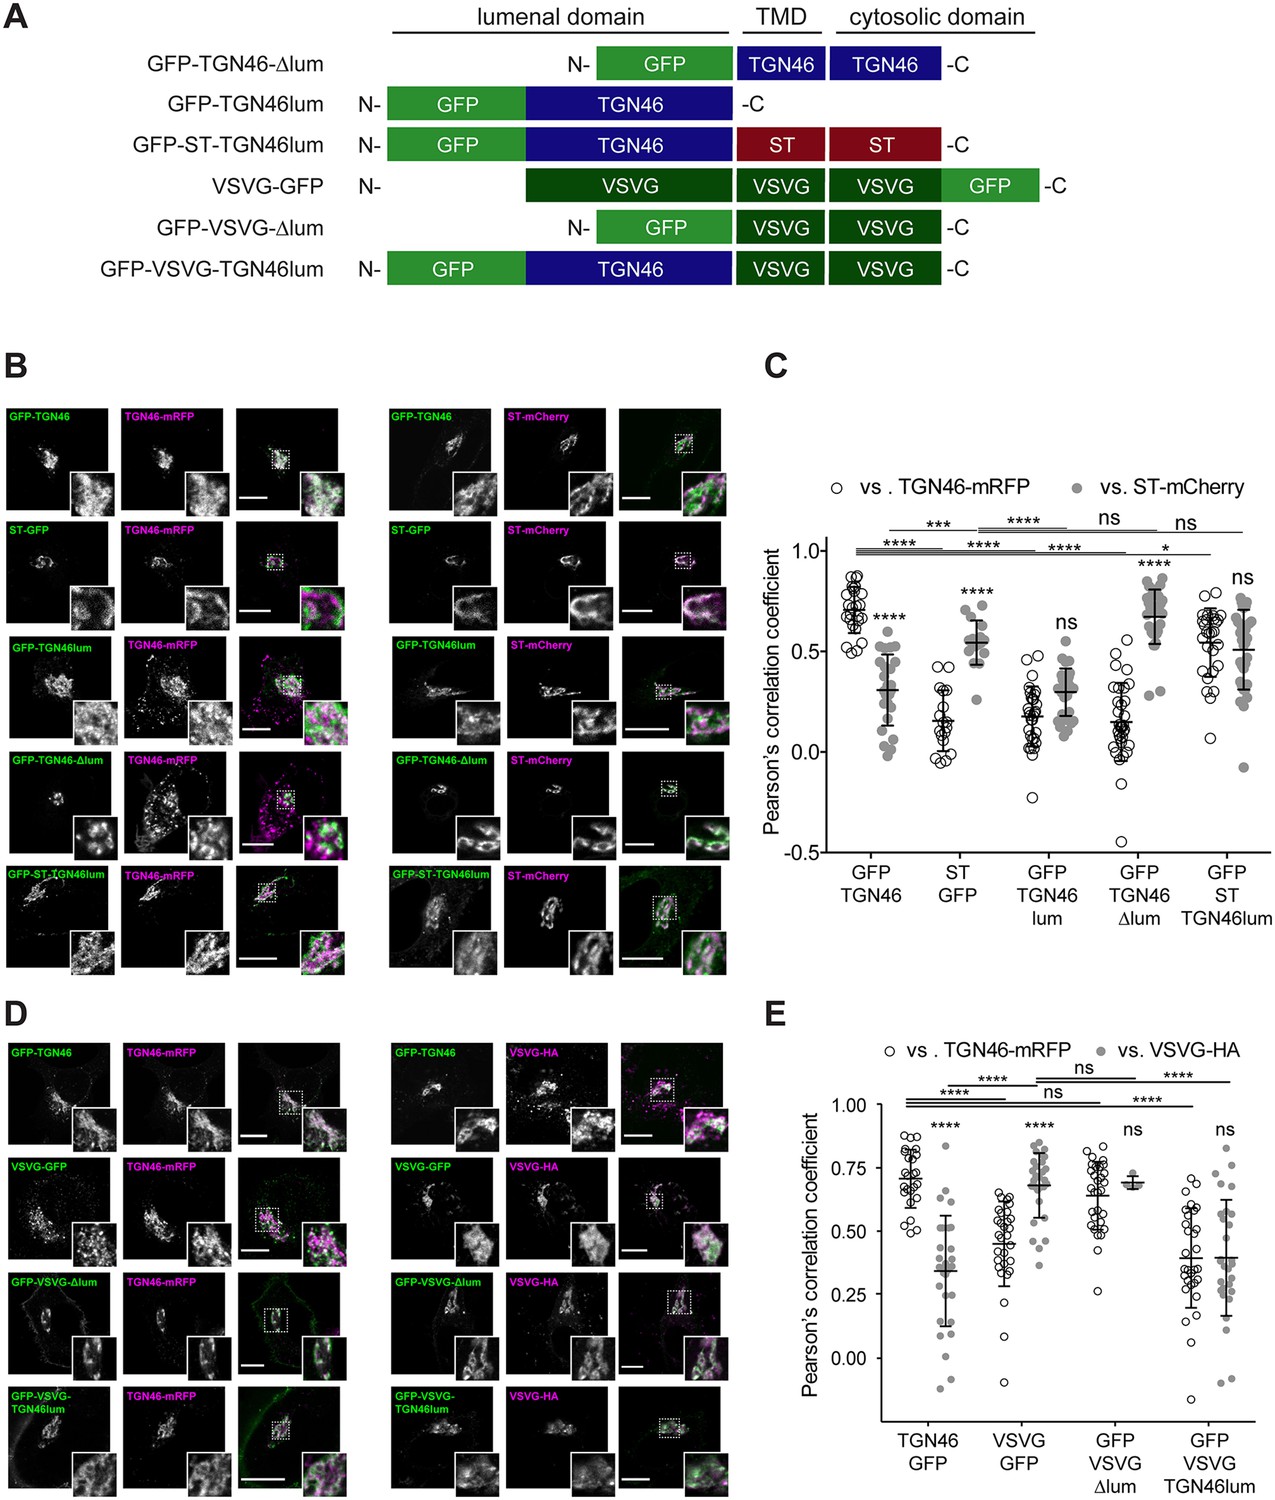
Intra-Golgi localization analysis for the role of the lumenal domain of TGN46 in CARTS-mediated export from the trans-Golgi network (TGN).
(A) Schematic representation of construct domain topology. TMD: transmembrane domain. (B) HeLa cells co-expressing the different indicated proteins (green and magenta channels) were fixed, and the localization of those proteins was monitored by fluorescence confocal microscopy. Insets correspond to zoom-in areas of the dashed, white boxed areas. (C) Pearson’s correlation coefficient between the perinuclear fluorescence signal of the x-axis indicated proteins with respect to TGN46-mRFP (empty circles) or ST-mCherry (gray circles), measured from confocal micrographs in (B). Results are from at least 10 cells from each of n = 3 independent experiments (individual values shown, with mean ± stdev; ns, p > 0.05; *p ≤ 0.05; ***p ≤ 0.001; ****p ≤ 0.0001). (D) HeLa cells co-expressing the different indicated proteins (green and magenta channels) were fixed, processed for immunostaining when required, and the localization of those proteins was monitored by fluorescence confocal microscopy. Insets correspond to zoom-in areas of the dashed, white boxed areas. (E) Pearson’s correlation coefficient between the perinuclear fluorescence signal of the x-axis-indicated proteins with respect to TGN46-mRFP (empty circles) or VSVG-HA (gray circles; detected by immunofluorescence using an Alexa Fluor 647-conjugated secondary antibody), measured from confocal micrographs in (D). Results are from at least 10 cells from each of n = 3 independent experiments (individual values shown, with mean ± stdev; ns, p > 0.05; ****p ≤ 0.0001). Scale bars in (B, D) are 10 µm.
Figure 6 with 1 supplement
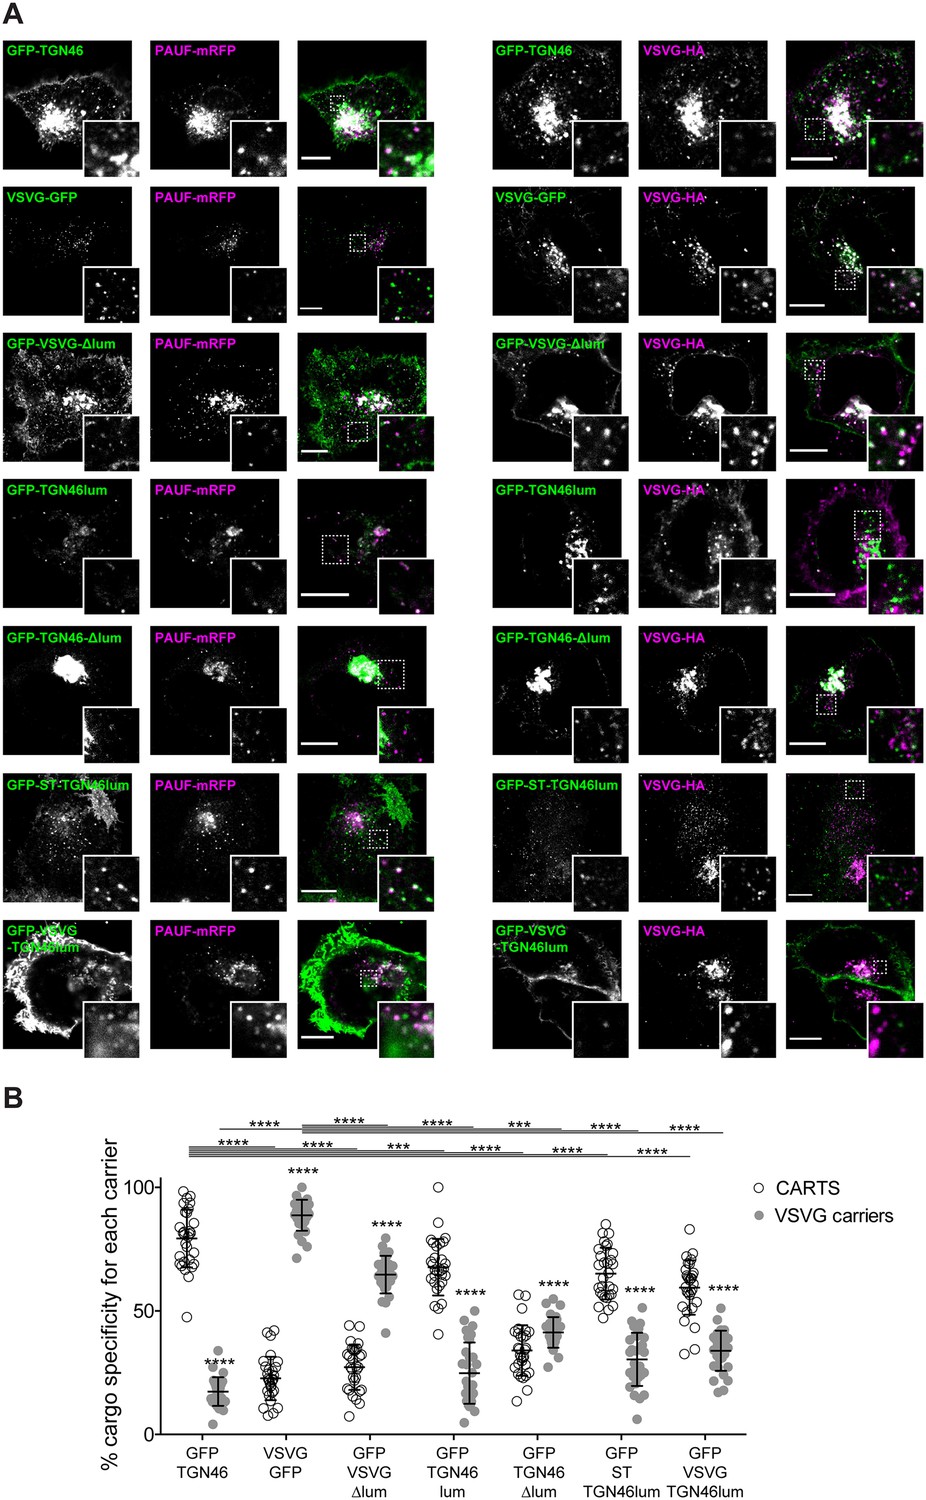
The lumenal domain of TGN46 is necessary and sufficient for its CARTS-mediated export from the trans-Golgi network (TGN).
(A) HeLa cells co-expressing the different indicated proteins (green and magenta channels) were fixed, processed for immunostaining when required, and the localization of those proteins was monitored by fluorescence confocal microscopy. Insets correspond to zoom-in areas of the dashed, white boxed areas. Scale bars are 10 µm. (B) Percentage of transport carriers containing each of the cargoes described on the x-axis that are also positive for pancreatic adenocarcinoma upregulated factor (PAUF; CARTS, empty circles) or VSVG (VSVG carriers, gray circles), as measured from confocal micrographs in (A). Results are from at least 10 cells from each of n = 3 independent experiments (individual values shown, with mean ± stdev; ***p ≤ 0.001; ****p ≤ 0.0001).
Figure 6—figure supplement 1
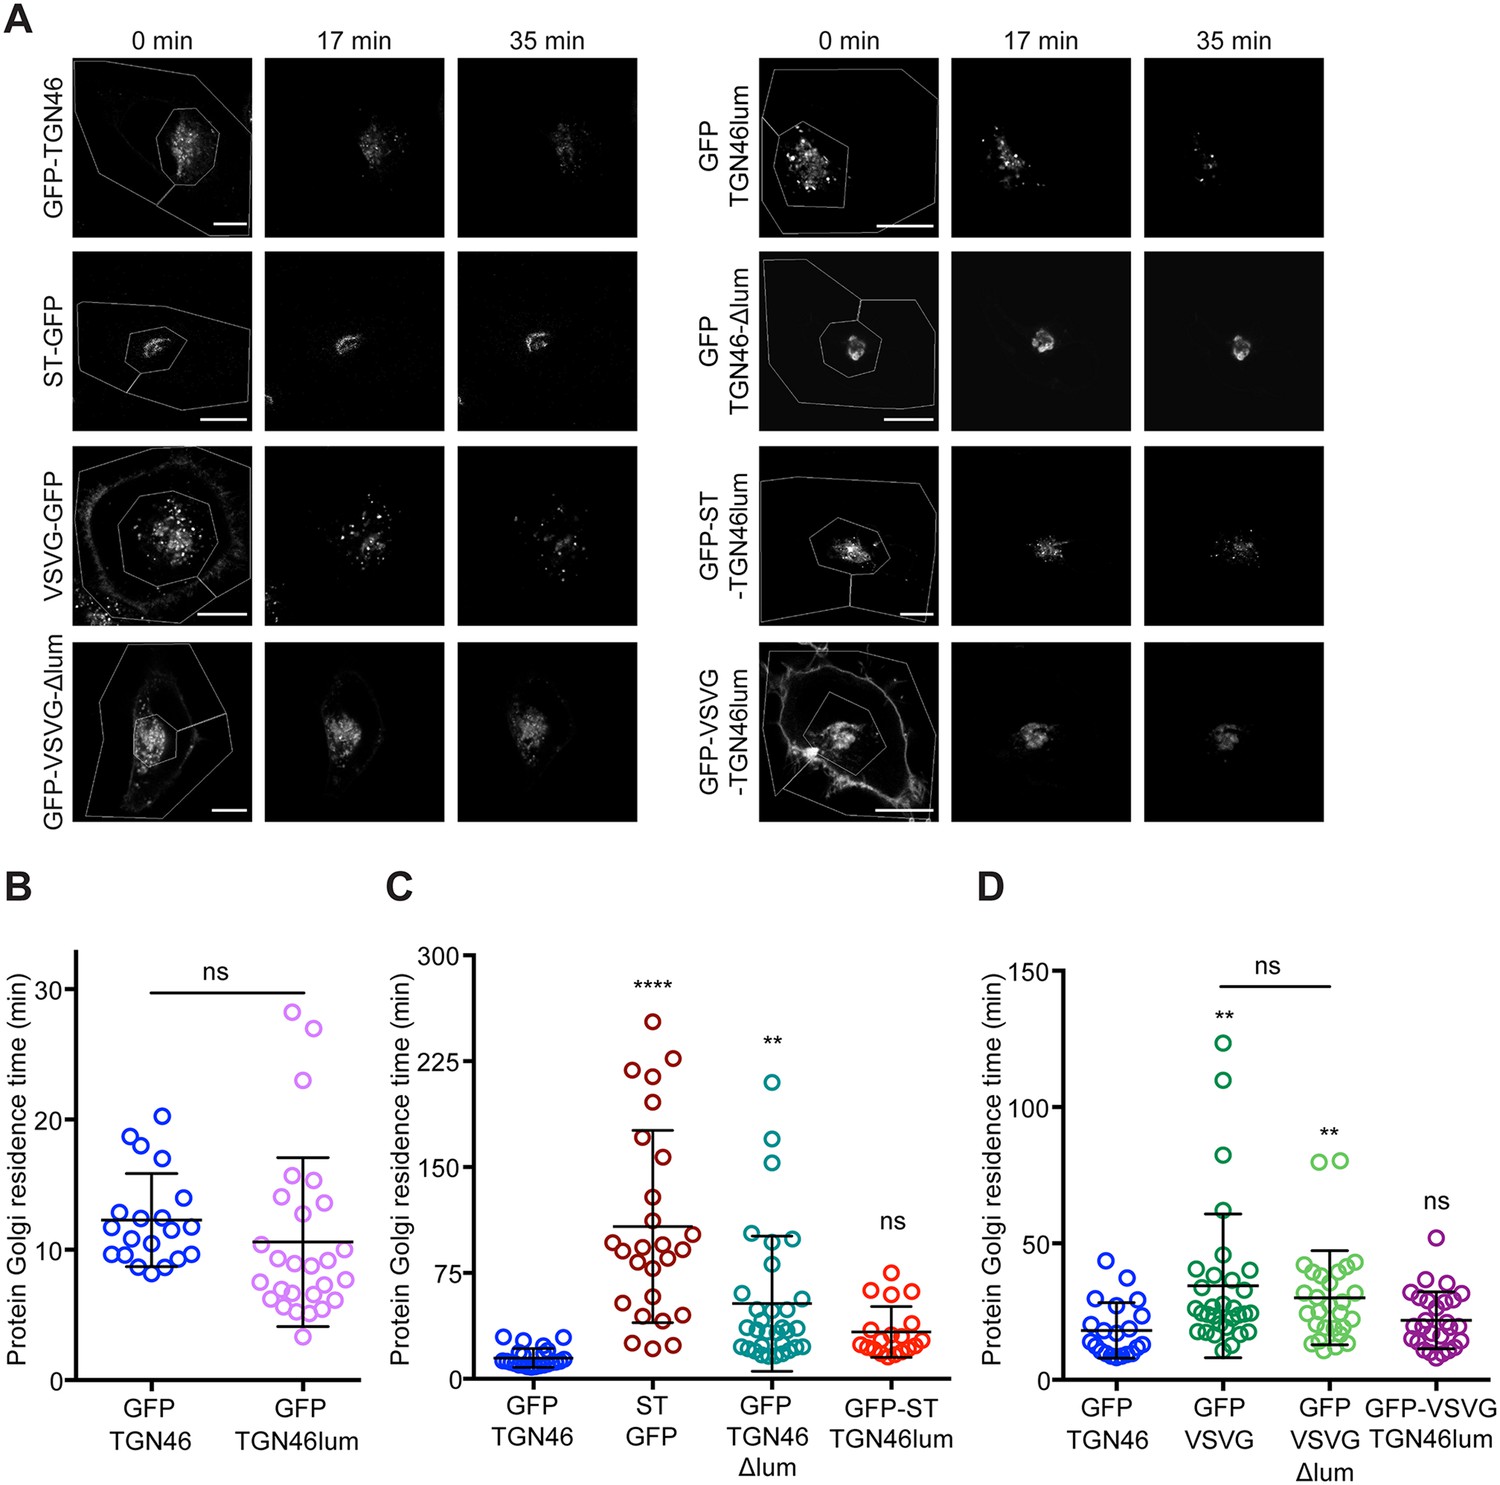
The lumenal domain of TGN46 is necessary and sufficient for its CARTS-mediated export from the trans-Golgi network (TGN).
(A) Fluorescence microscopy images obtained from a characteristic fluorescence loss in photobleaching (FLIP) experiment assessing the export rate of the denoted proteins from the perinuclear area in HeLa cells. Time from the beginning of the FLIP experiments is indicated, and the area enclosed by the white lines shown in the left images denotes the photobleached area. Scale bars are 10 µm. (B–D) Residence time in the perinuclear area measured as the half time of the FLIP curves. Results are from 7 to 12 cells from n = 3 independent experiments (individual values shown, with mean ± stdev; ns, p > 0.05; **p ≤ 0.01; ****p ≤ 0.0001). In (B), unpaired two-tailed t test (ns, p > 0.05).
Figure 7 with 3 supplements
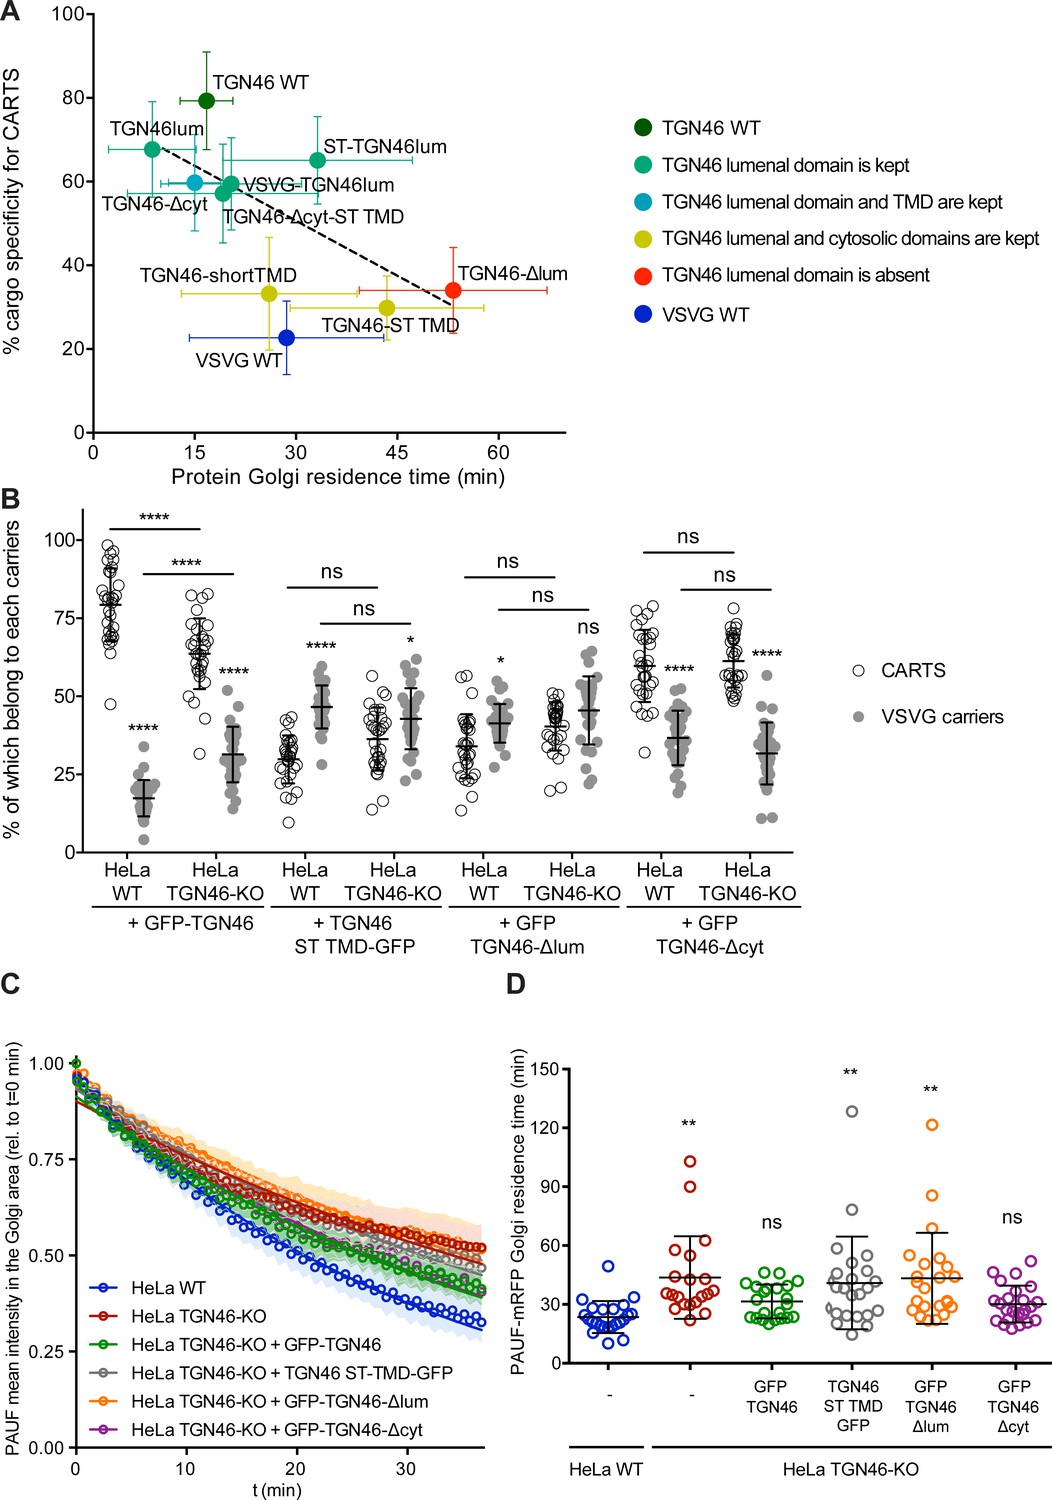
The cargo sorting function of TGN46 is mediated by its lumenal domain.
(A) CARTS specificity of cargo proteins correlates with their Golgi export rate. Plot of the percentage of cargo-positive vesicles that are also positive for pancreatic adenocarcinoma upregulated factor (PAUF; CARTS marker) as a function of the Golgi residence time as measured from fluorescence loss in photobleaching (FLIP) experiments, for the different indicated cargo proteins (color coding explained in the legend on the right). Dashed black line represents a linear fit of the data points (shown as mean ± standard error of the mean [s.e.m.]), where the slope is statistically different from zero (extra sum-of-squares F test, p-value = 0.04). (B) Percentage of transport carriers containing each of the cargoes described on the x-axis that are also positive for PAUF (CARTS, empty circles) or VSVG (VSVG carriers, gray circles), as measured from confocal micrographs of HeLa cells (either WT or TGN46-KO cell lines) expressing the indicated proteins. Results are at least 10 cells from each of n = 3 independent experiment (individual values shown, with mean ± stdev; ns, p > 0.05; *p ≤ 0.05; ****p ≤ 0.0001). (C) Relative fluorescence intensity average time trace (mean ± s.e.m.) of FLIP experiments for the indicated proteins expressed in HeLa WT or HeLa TGN46-KO cells, as detailed in the legend. Symbols correspond to actual measurements, solid lines to the fitted exponential decays. (D) Residence time of PAUF-mRFP in the perinuclear area of HeLa cells (WT or KO), expressing the different proteins as labeled in the x-axis, and measured as the half time of the FLIP curves. Results are from 7 to 12 cells from each of n = 3 independent experiments (individual values shown, with mean ± stdev; ns, p > 0.05; **p ≤ 0.01).
Figure 7—figure supplement 1
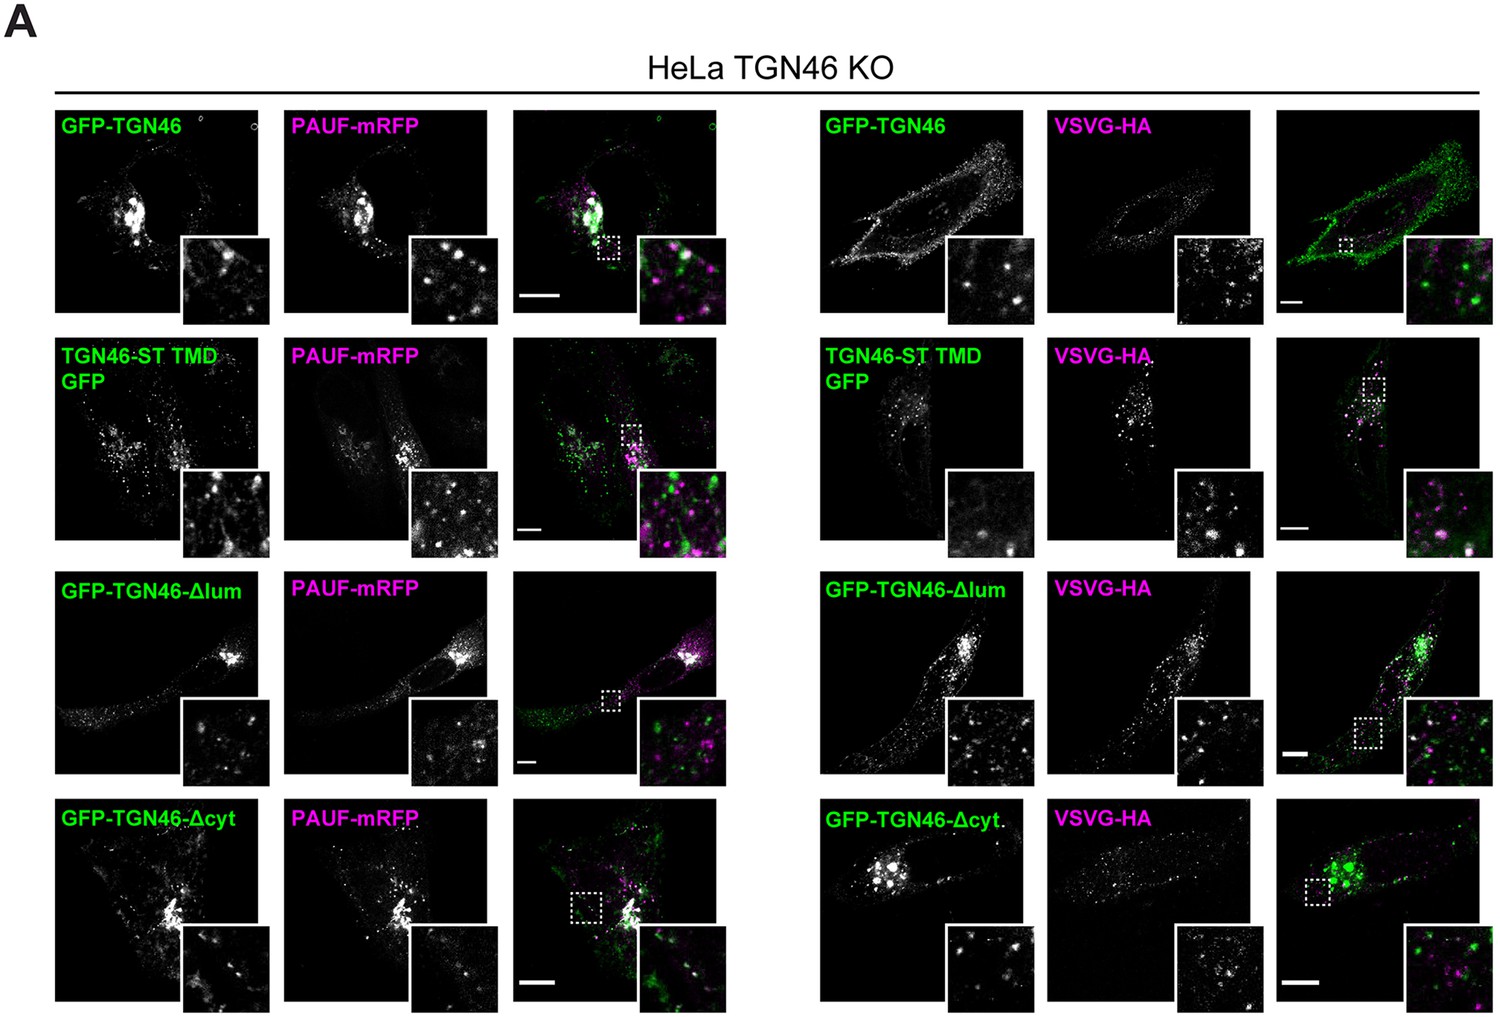
The cargo sorting function of TGN46 is mediated by its lumenal domain.
(A) HeLa TGN46-KO cells co-expressing the different indicated proteins (green and magenta channels) were fixed, processed for immunostaining when required, and the localization of those proteins was monitored by fluorescence confocal microscopy. Insets correspond to zoom-in areas of the dashed, white boxed areas. Scale bars are 10 µm.
Figure 7—figure supplement 2
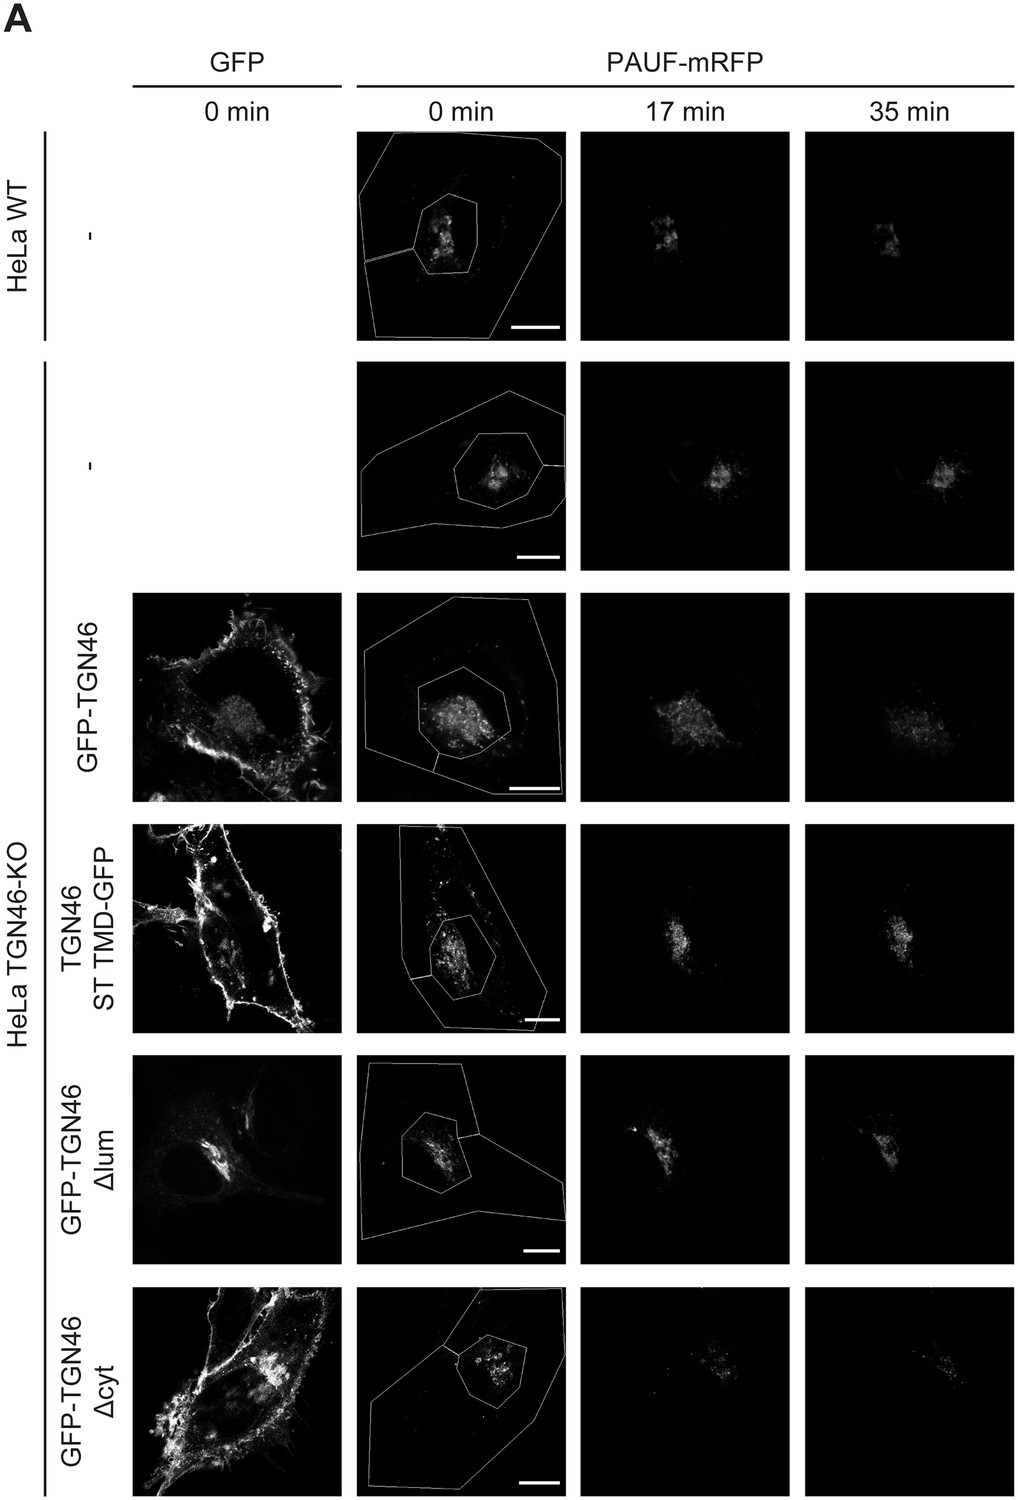
Golgi export of PAUF-mRFP is dependent on the lumenal domain of TGN46.
(A) Fluorescence microscopy images obtained from a characteristic fluorescence loss in photobleaching (FLIP) experiment assessing the export rate of PAUF-mRFP from the perinuclear area in HeLa cells (either WT or KO) expressing the indicated proteins. Time from the beginning of the FLIP experiments is indicated, and the area enclosed by the white lines shown in the left images denotes the photobleached area. Scale bars are 10 µm.
Figure 7—figure supplement 3
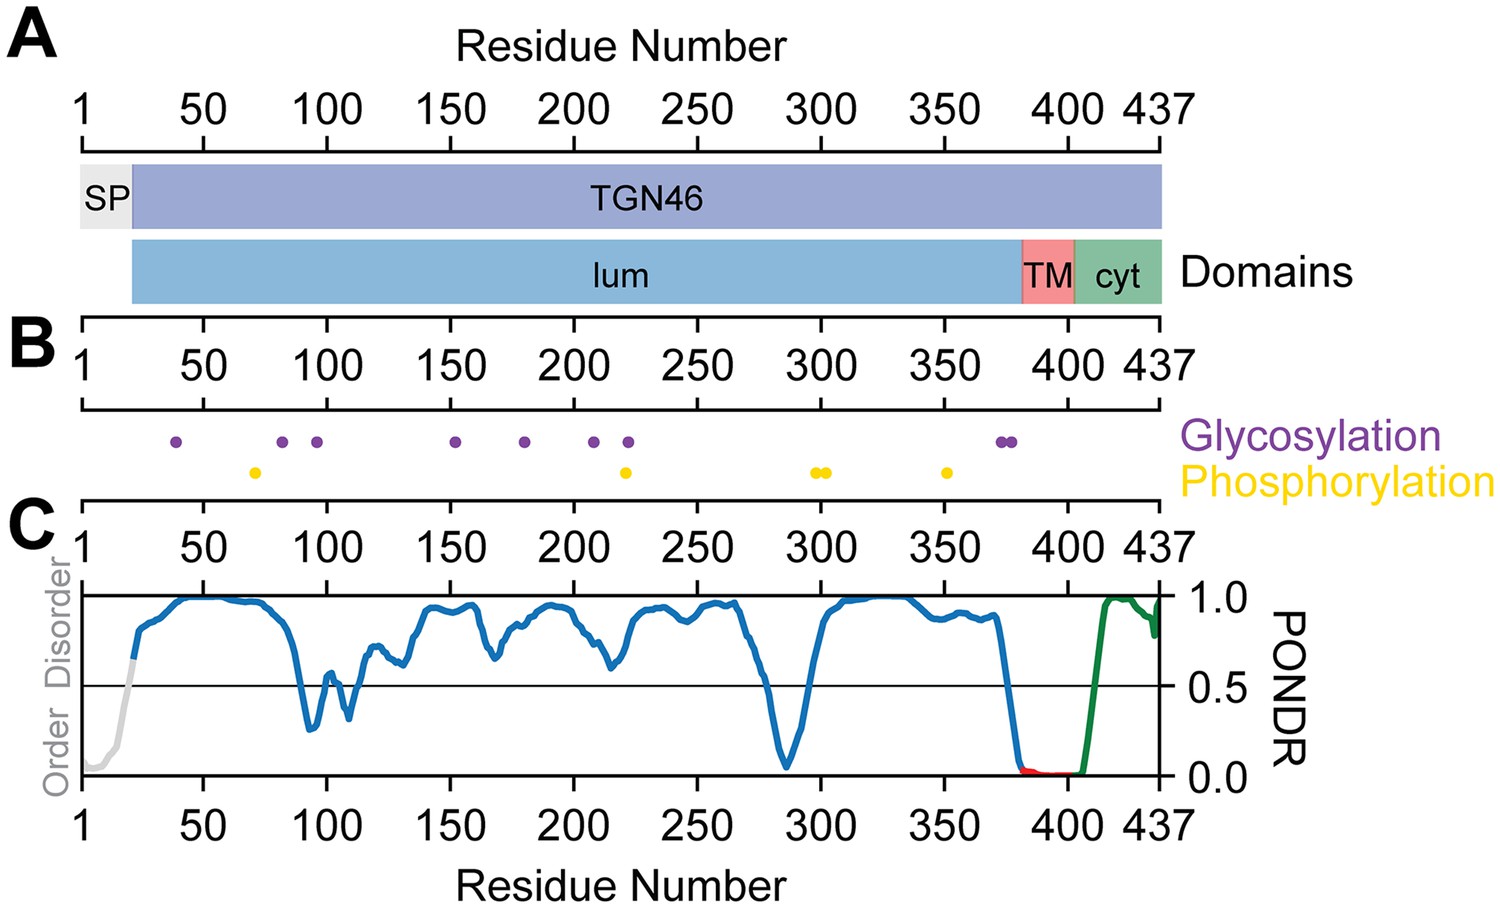
TGN46 domain structure and sequence characteristics.
(A) On the top, signaling peptide region (SP, gray) and mature TGN46 (TGN46, blue). On the bottom, the lumenal (lum, blue), transmembrane (TM, red), and cytoplasmic (cyt, green) domains. (B) Post-translational modifications. On the top, the glycosylation sites (purple) and on the bottom, the phosphorylation sites (yellow). (C) Disorder propensity indicated by PONDR score using the VL-XT algorithm (Li et al., 1999; Romero et al., 1997; Li et al., 1999). Values ranging 0.0–0.5 indicate order and values ranging 0.5–1.0 indicate disorder.
Additional files
-
MDAR checklist
- https://cdn.elifesciences.org/articles/91708/elife-91708-mdarchecklist1-v1.docx
-
Source data 1
Source data folder corresponding to the GraphPad files with the quantitative results shown in the figures, with the individual files named according to the respective figure panels they relate to.
- https://cdn.elifesciences.org/articles/91708/elife-91708-data1-v1.zip
Download links
A two-part list of links to download the article, or parts of the article, in various formats.
Downloads (link to download the article as PDF)
Open citations (links to open the citations from this article in various online reference manager services)
Cite this article (links to download the citations from this article in formats compatible with various reference manager tools)
Sorting of secretory proteins at the trans-Golgi network by human TGN46
eLife 12:RP91708.
https://doi.org/10.7554/eLife.91708.3


