Brain state and cortical layer-specific mechanisms underlying perception at threshold
- Department of Neuroscience, Yale University, United States
- Interdepartmental Neuroscience Program, Yale University, United States
- Systems Neurobiology Laboratories, The Salk Institute for Biological Studies, United States
- Department of Psychiatry, Yale University, United States
- Wu Tsai Institute, Yale University, United States
- Department of Psychology, Yale University, United States
- Kavli Institute for Neuroscience, Yale University, United States
Figures
Figure 1 with 3 supplements
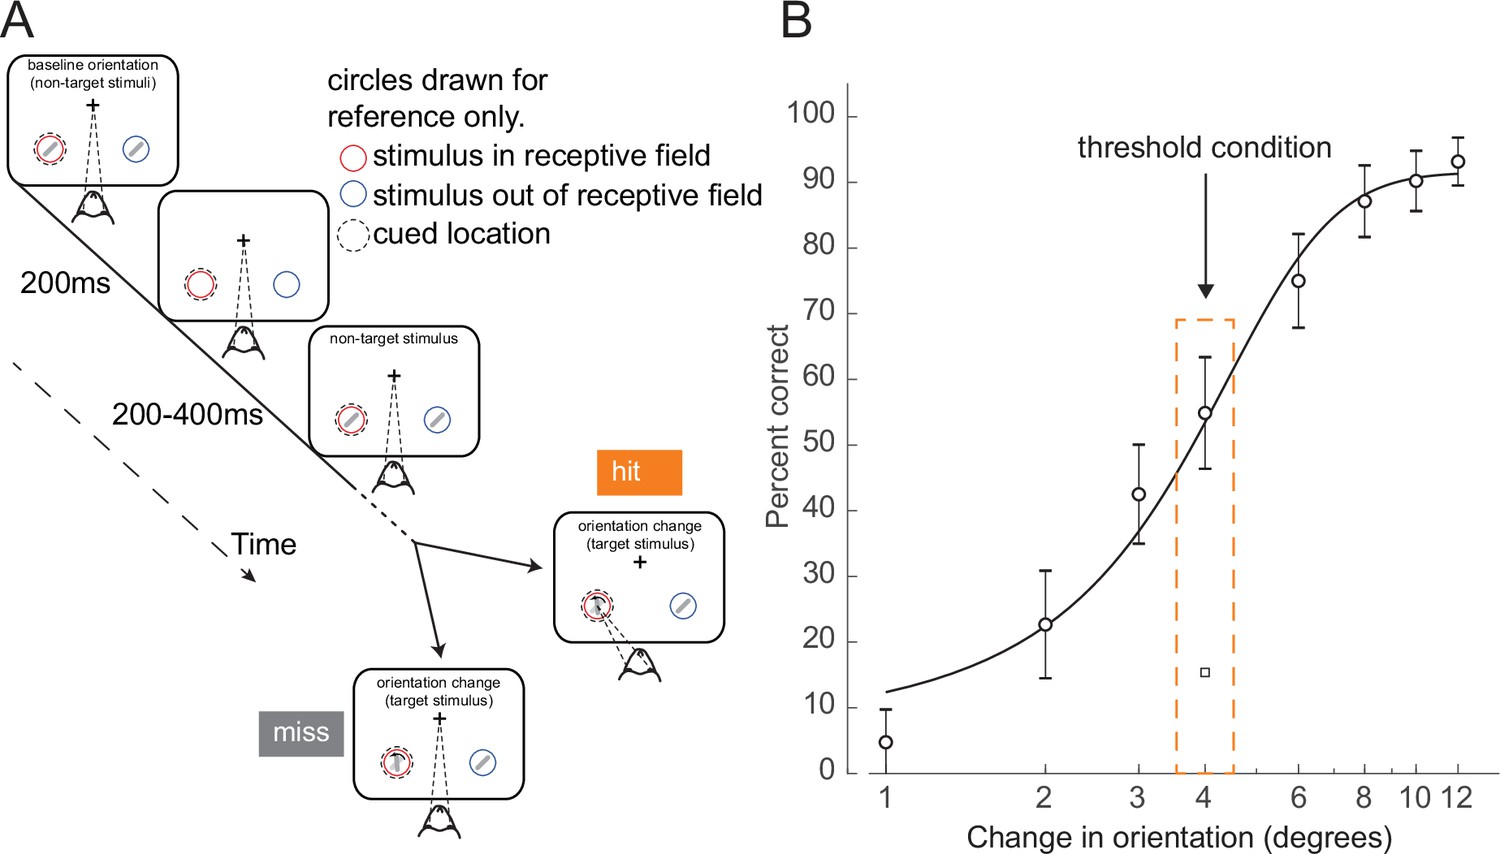
Orientation change detection task at perceptual threshold.
(A) Schematic of task structure. The monkey initiated a trial by fixating on the center of the screen. Two Gabor stimuli (represented by oriented lines) were presented for 200 ms and then turned off for 200–400 ms. This was repeated until, at an unpredictable time, one of the stimuli changed orientation. The monkey could report having seen the change by making an eye movement to the location of the target stimulus to receive a reward (hit trials). If the monkey failed to report the orientation change and maintained fixation on the center of the screen it was not rewarded (miss trials). Before a block of trials, the monkey was cued as to which stimulus was likely to undergo the change (95% valid cue). In 5% of trials the orientation change occurred at the other location (foil trials). Circles indicating the cued location and receptive field are drawn for figure reference only and were not presented during the task. (B) Example behavioral psychometric function from one recording session and attention condition. Behavioral performance (hit rate, circles) is presented as a function of orientation change. Data was fitted with a logistic function. The threshold condition, trials with performance halfway between the upper and lower asymptotes of the logistic function, is indicated by the orange box. Error bars represent standard deviation calculated with a jackknife procedure (20 jackknives). The square symbol indicates foil trial performance.
Figure 1—figure supplement 1
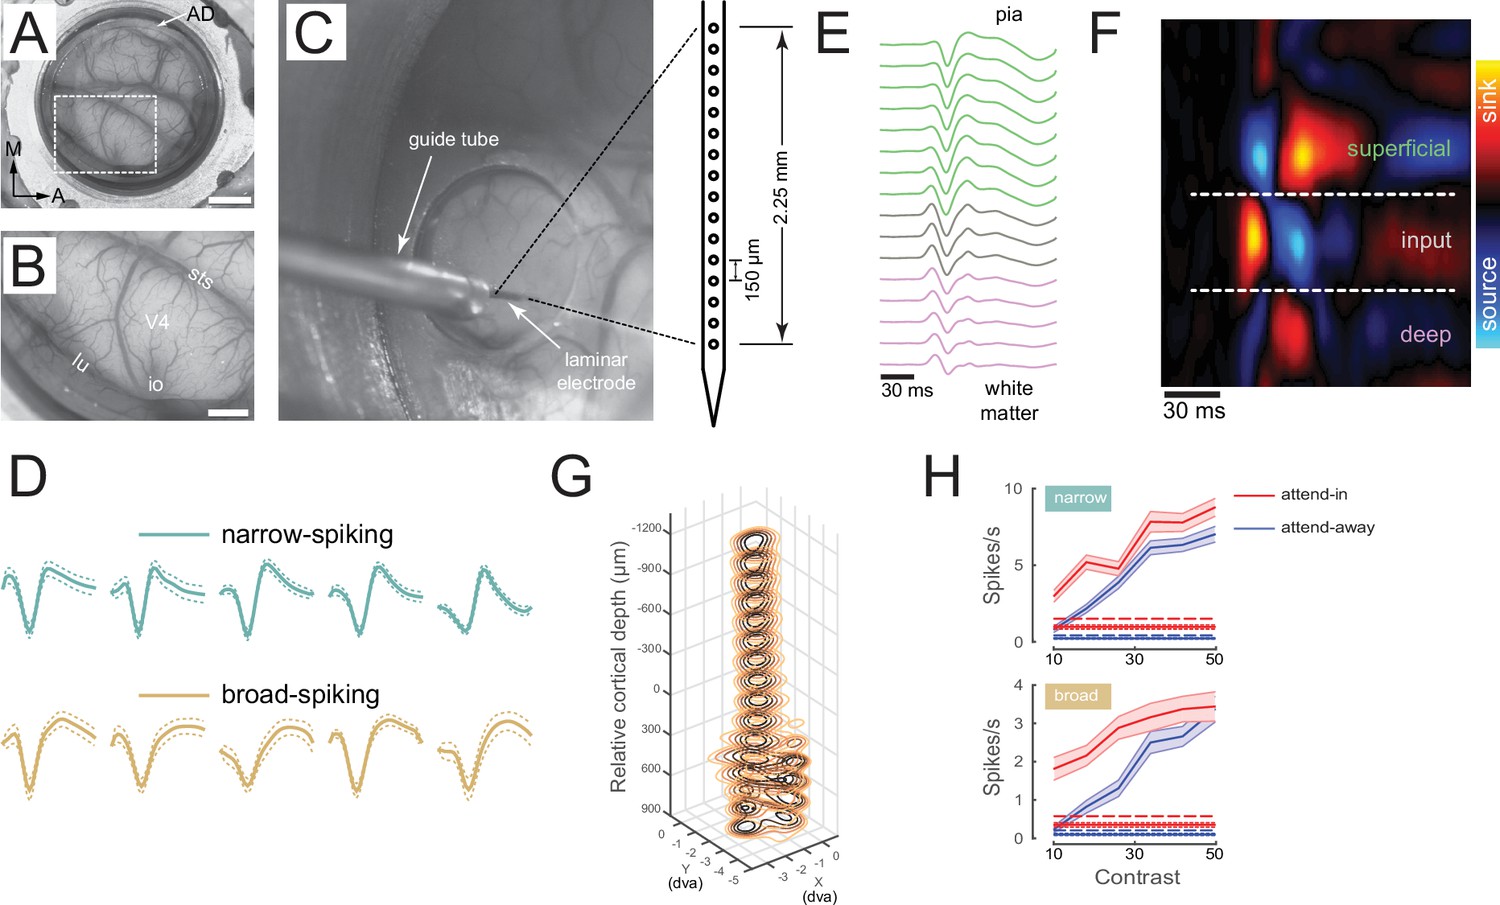
Laminar recordings in V4 (modified from Nandy et al., 2017).
(A) An artificial dura (AD) chamber is shown over dorsal V4 in the right hemisphere of Monkey A. The native dura mater was resected and replaced with a silicone-based AD, thereby providing an optically clear window into the cortex. Scale bar = 5 mm. (B) An enlarged view of the boxed region in A clearly shows the sulci and the microvasculature. sts = superior temporal sulcus, lu = lunate sulcus, io = inferior occipital sulcus. Area V4 lies on the pre-lunate gyrus between the superior temporal and lunate sulci. Scale bar = 2 mm. (C) Electrophysiology setup: a plastic stabilizer with a circular aperture is secured in place inside the chamber such that the aperture is centered over the pre-lunate gryus. A 16-channel linear array electrode (electrode spacing 150 μm) is positioned over the center of the gyrus and lowered into the cortex under microscopic guidance. The microvasculature pattern was used as a reference to target different cortical sites across recording sessions. (D) Example recording session in Monkey C depicting 12 single-unit waveforms (mean ± s.e.m.) isolated along the cortical column. Teal waveforms correspond to narrow-spiking putative interneurons and gold waveforms correspond to broad-spiking putative excitatory units. (E) Stimulus triggered local field potentials (LFPs) obtained by flashing 30 ms high-contrast ring stimuli in the receptive field (RF) of a V4 cortical column. LFP traces averaged across all stimulus repeats are shown color-coded as being part of either the superficial (green), input (gray), or deep (pink) layers. Layer assignment was done after current source density (CSD) analysis. (F) CSD calculated as the second spatial derivative of the stimulus-triggered LFPs and displayed as a colored map. The x-axis represents time from stimulus onset; the y-axis represents cortical depth oriented such that the pial surface is at the top and the white matter is at the bottom. Red hues represent current sink, blue hues represent current source. The input layer is identified as the first current sink followed by a reversal to current source. The superficial and deep layers have the opposite sink-source pattern. The CSD map has been spatially smoothed for visualization. (G) Stacked contour plots show spatial RFs mapped along each contact point in the laminar probe. The spatial RFs were obtained by applying reverse correlation to the LFP power evoked by sparse pseudo-random sequences of Gabor stimuli. The RFs are well aligned, indicating perpendicular penetration down a cortical column. Zero depth represents the center of the input layer as estimated from the CSD. (H) Contrast response functions – spikes rate as a function of stimulus contrast – are shown for two example units identified in a single recording session in Monkey A. Red and blue traces correspond to the attend-in to RF and attend-away from RF conditions, respectively. The dotted lines represent the corresponding background firing rates. The dashed lines are four standard deviations above baseline. A unit was considered as visually responsive, if the contrast response functions exceeded this threshold in both the attention conditions. Mean ± s.e.m. Panels are reproduced from Nandy et al., 2017.
© 2017, Elsevier Inc. Panels are reprinted from Nandy et al., 2017, with permission from Elsevier. It is not covered by the CC-BY 4.0 licence and further reproduction of this panel would need permission from the copyright holder.
Figure 1—figure supplement 2
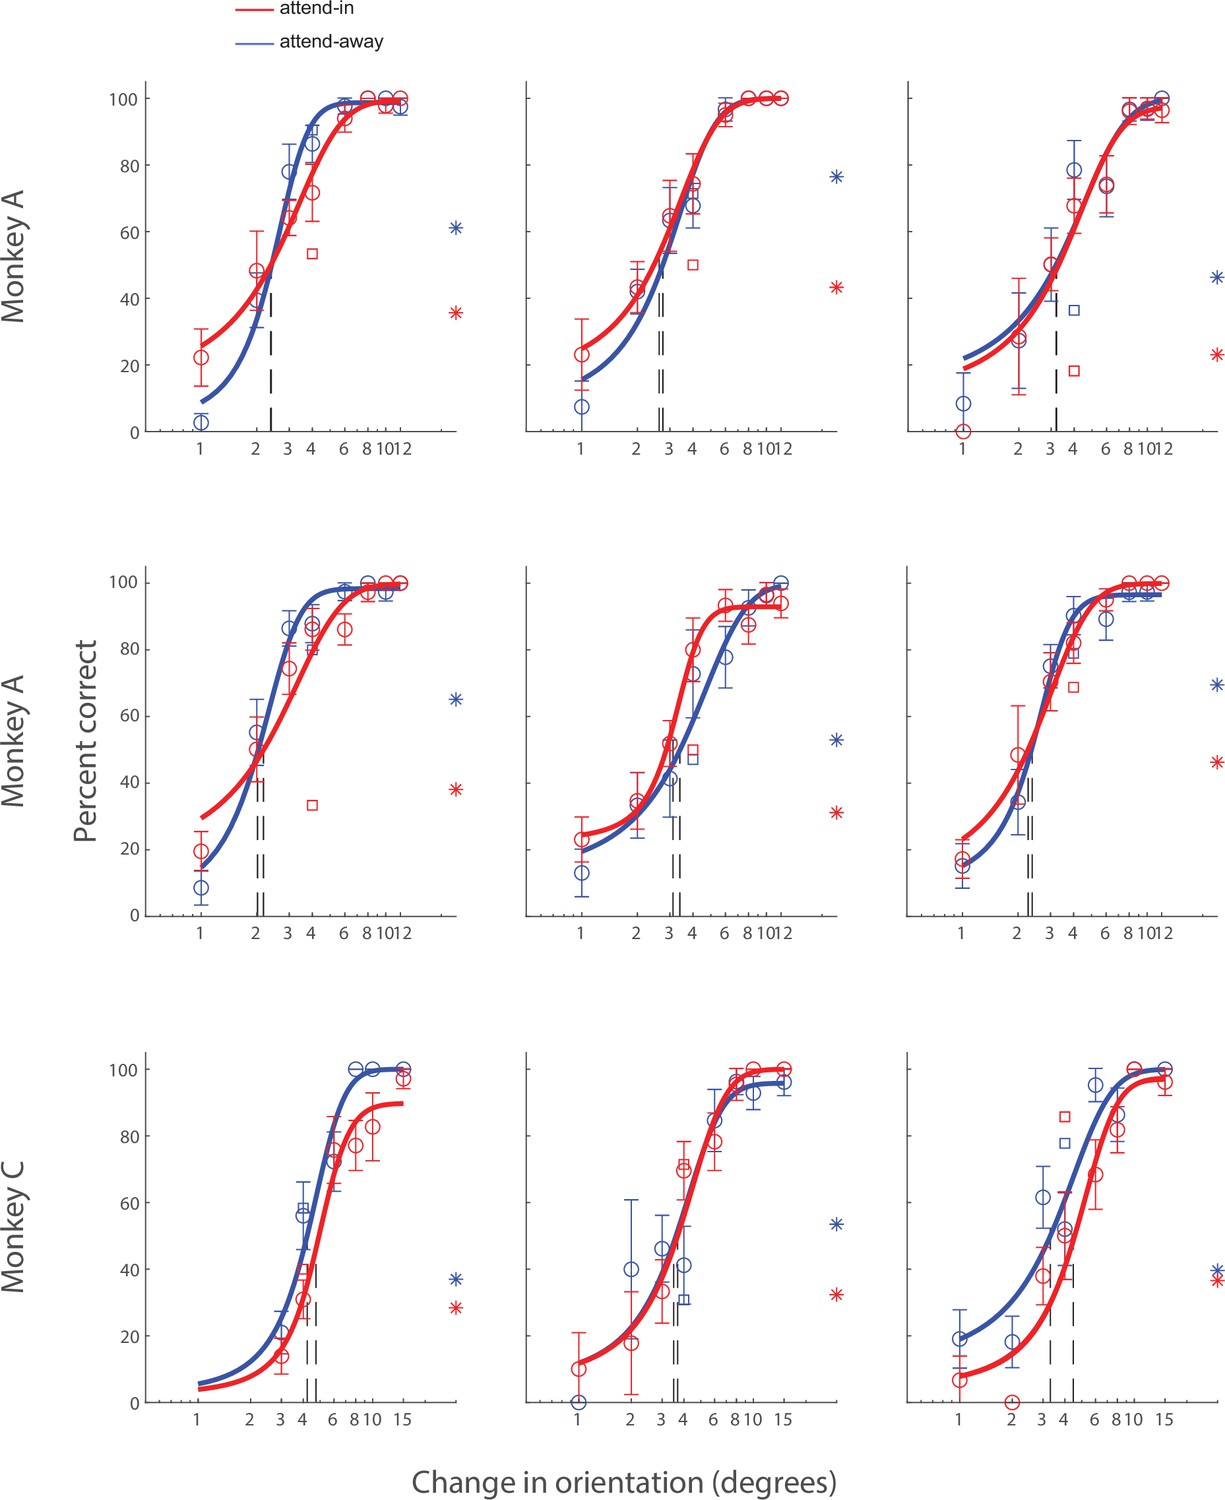
Additional psychometric function examples.
Example behavioral psychometric functions from nine recording sessions in the attend-in (red) and attend-away (blue) conditions. Behavioral performance (circles) is presented as a function of orientation change. Data was fitted with a logistic function. The threshold of each fitted logistic function is indicated by the vertical dashed line. The square symbol indicates foil trial performance, and the star symbol indicates catch trial performance.
Figure 1—figure supplement 3
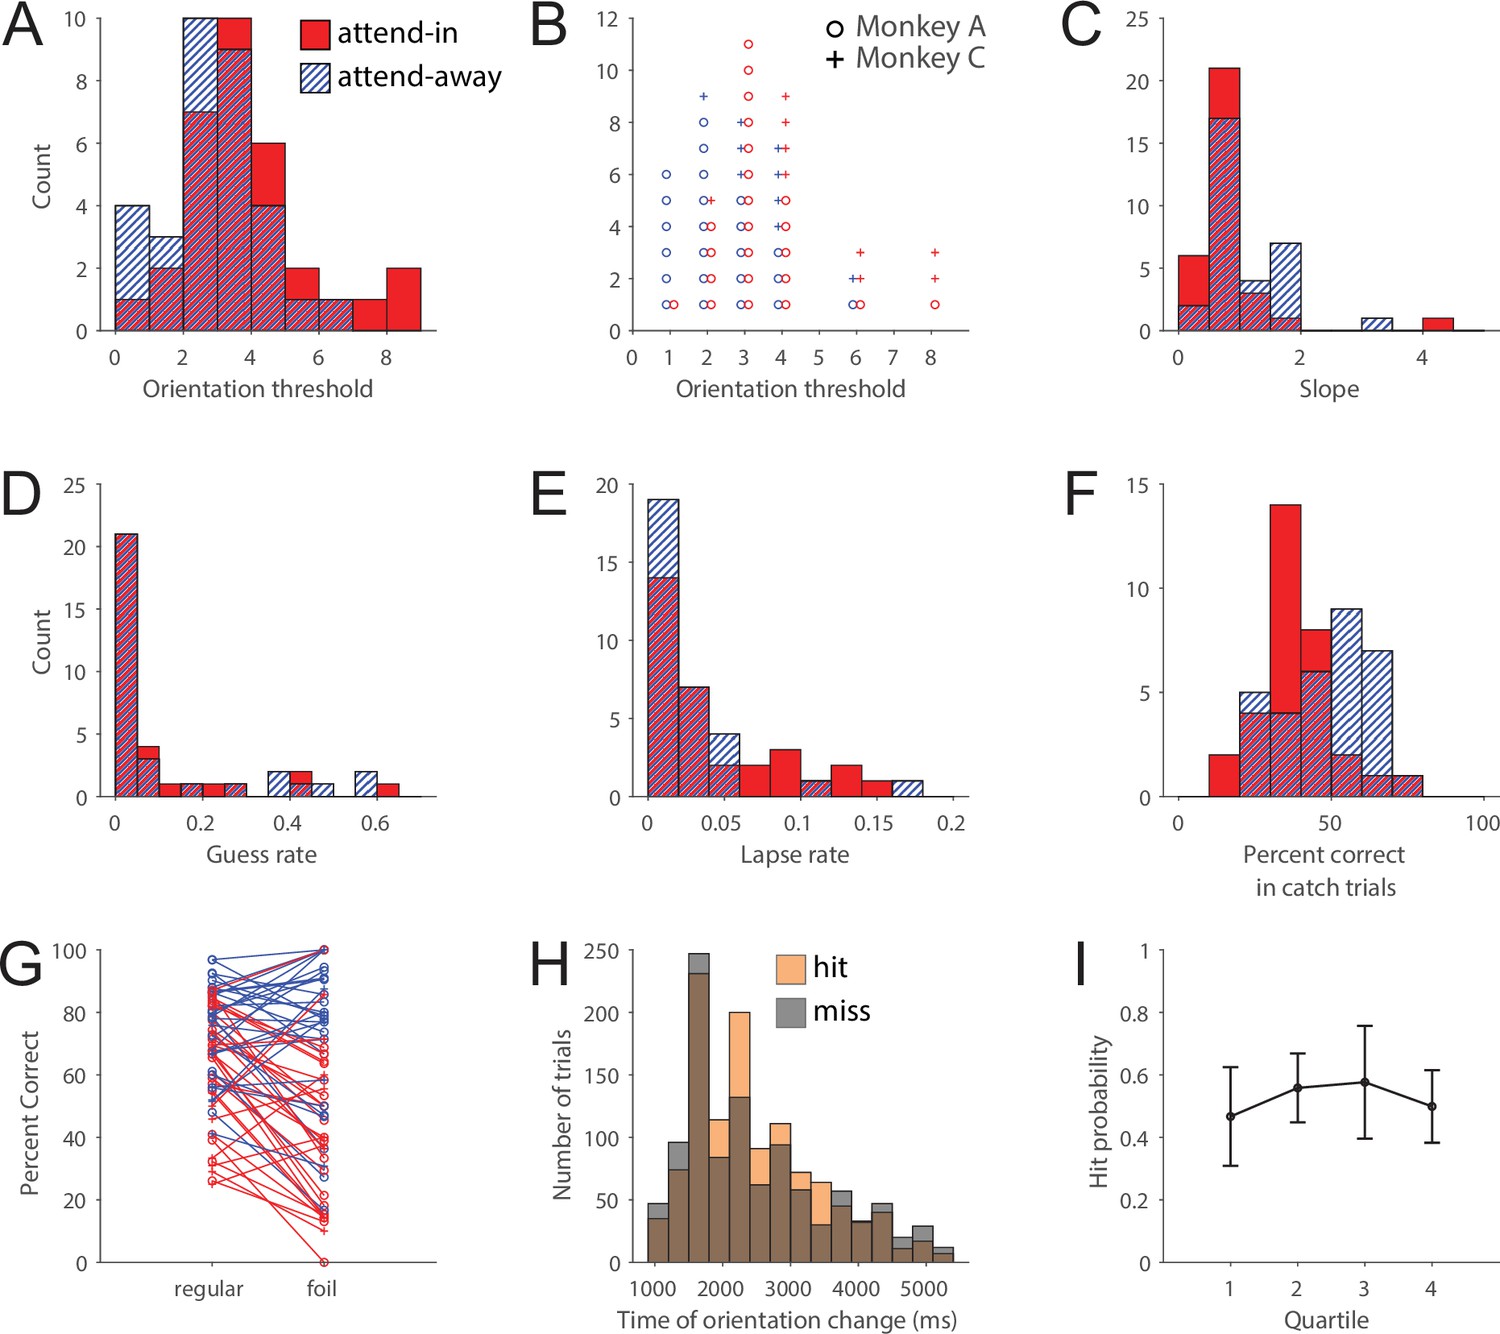
Psychometric function parameters.
(A) Distribution of the orientation threshold of the fitted psychometric functions in the attend-in (red solid) and attend-away (blue hatch) conditions for each recording session. The threshold of the sigmoid may not correspond exactly to an orientation change tested in the experiment. (B) Distribution of threshold orientation changes used as the threshold condition in the rest of this study (red = attend-in, blue = attend-away, circle = Monkey A, plus = Monkey C). (C) Distribution of slopes for the fitted psychometric functions (same conventions as in A). (D) Distribution of guess rate for the fitted psychometric functions (same conventions as in A). (E) Distribution of lapse rate for the fitted psychometric functions (same conventions as in A). (F) Distribution of catch trial performance in each session (same conventions as in A). (G) Performance on orientation change-matched regular trials (target presented at cued location) and foil trials (target presented at uncued location) for each session (same conventions as in B). (H) Distribution of target presentation time for hit (orange) and miss (gray) trials. (I) Performance in threshold trials in each recording session split by quartiles (see Materials and methods). Error bars represent standard deviation.
Figure 2 with 2 supplements
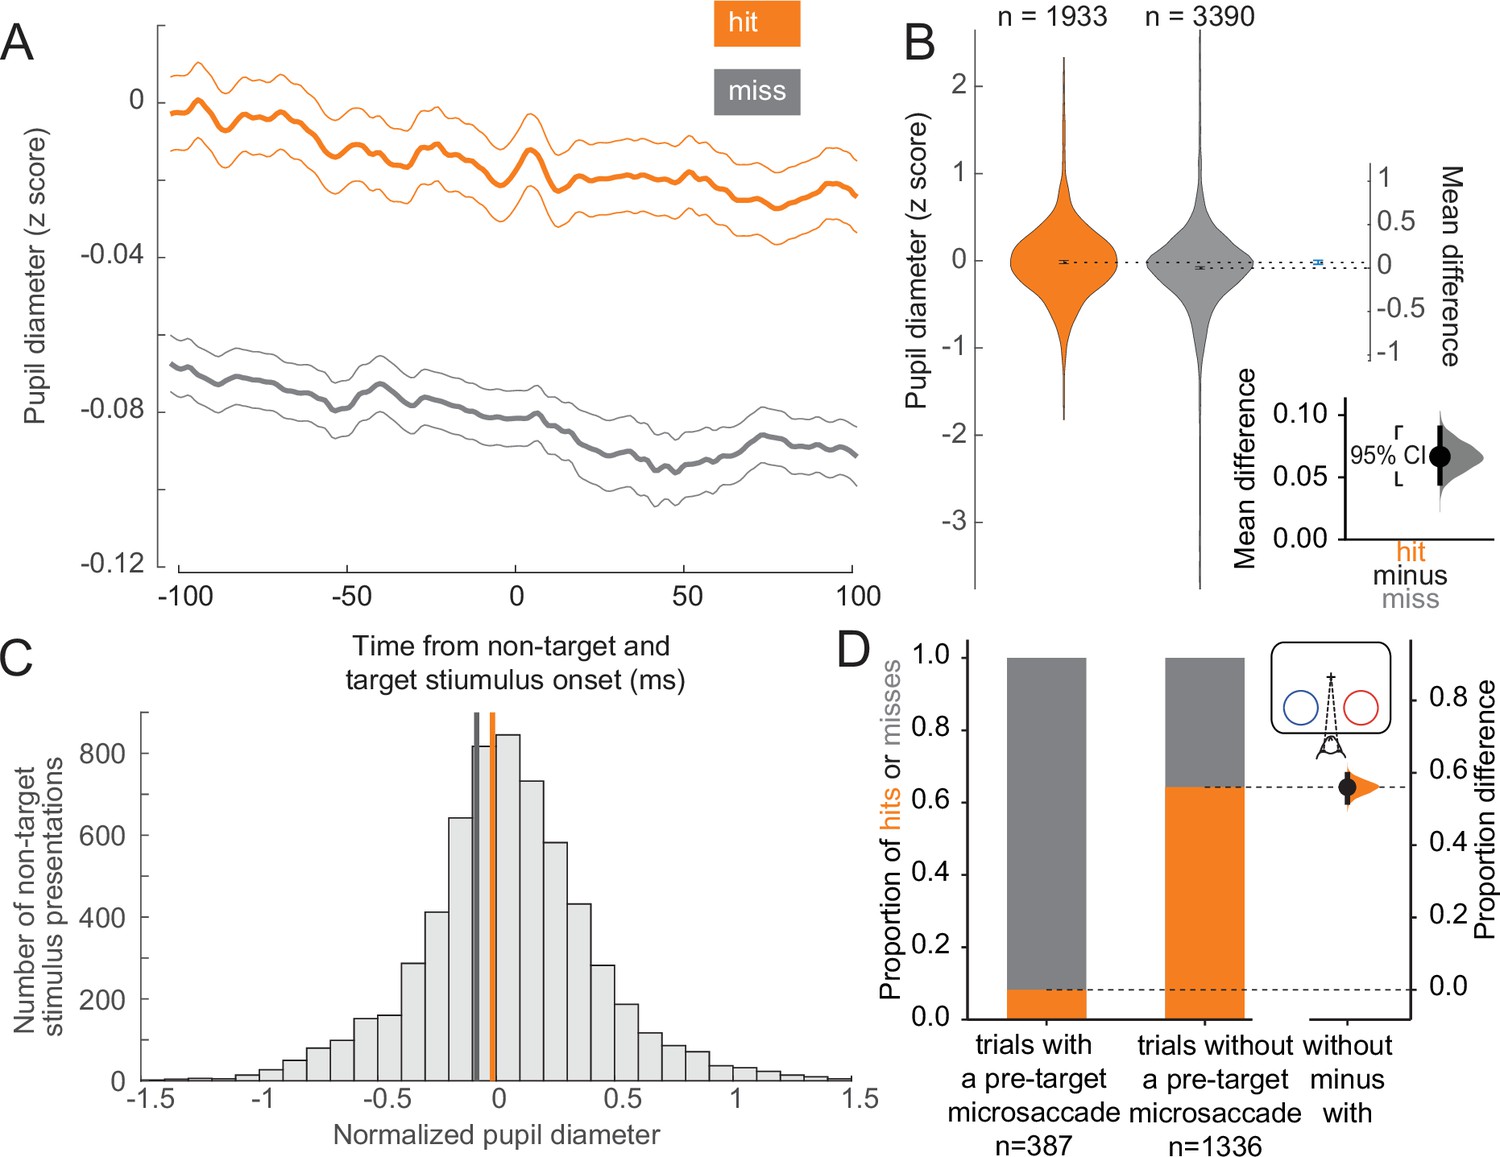
Hit trials have larger pupil diameter whereas microsaccades more often precede misses.
(A) Normalized pupil diameter for hit and miss trials in the threshold condition. 0 ms corresponds to non-target and target stimulus onset. Mean ± s.e.m. (B) Distribution of pupil diameter values associated with hit and miss trials. Pupil diameter was averaged from 100 ms before to 100 ms after non-target and target stimulus onset. Violin plots were generated using kernel smoothing (see Materials and methods). Error bars represent 95% confidence intervals for the mean of each distribution, and the mean difference (blue, right axes). Inset: zoomed-in view of the mean difference between hit and miss trials. Black bar represents a 95% confidence interval of the mean difference. Shaded region reflects the distribution of the bootstrapped estimation of the mean difference. (C) Histogram of mean pupil diameter around the time of non-target and target stimulus onset (calculated as in B). Orange and gray lines represent the mean pupil diameter for hit and miss trials, respectively. (D) Left: Hit rate for trials with (387 trials) and without (right, 1336 trials) a microsaccade detected in the time window 0–400 ms before target onset. Right: Bootstrapped estimation of the mean difference in hit proportion in trials with vs without a pre-target microsaccade. Same conventions as in B.
Figure 2—figure supplement 1
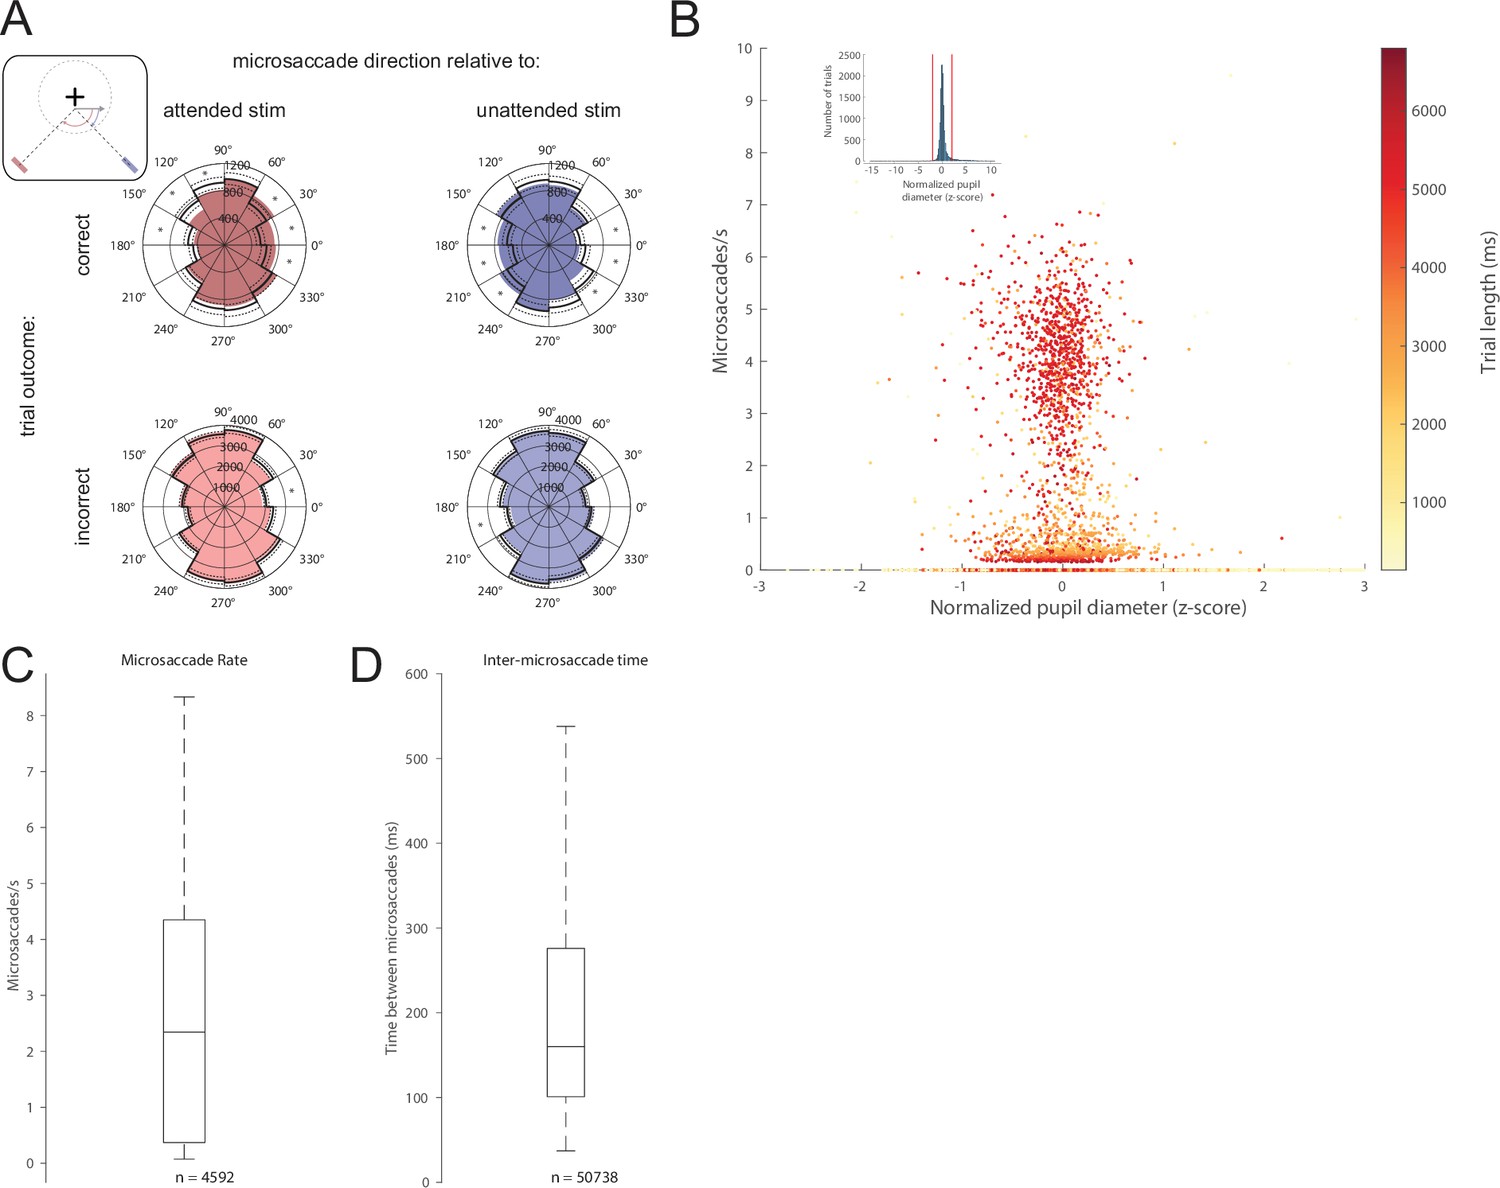
Microsaccades are preferentially directed toward the target in correct trials and have a slight correlation with pupil diameter.
Data is presented for all trials, regardless of orientation change (not just the threshold condition). (A) The histograms represent the direction of microsaccades relative to the attended stimulus (left column) or unattended stimulus (right column) in correct (top row) and incorrect (bottom row) trials. Black lines represent the mean (solid) and 99.5% confidence interval (dashed) of the bootstrapped null distribution estimated by pooling correct and incorrect microsaccades. *p < 0.005. Inset: Schematic for calculation of relative microsaccade direction. Microsaccade is represented by the gray arrow. (B) Scatterplot of microsaccade rate vs mean normalized pupil diameter shows a small but statistically significant relationship between the two quantities (r2 = 0.006, p < 0.001). Each dot is color-coded by trial length. Inset: Histogram of mean pupil diameter for all trials, including those less than –2 or greater than 2 (red lines). Only four of the trials with pupil diameters less than –2 or greater than 2 had detected microsaccades. (C) Boxplot of microsaccade rates for all trials. (D) Boxplot of the time between microsaccades recorded in the same trial. 4% of microsaccades separated by more than 538 ms were excluded as outliers (see Materials and methods).
Figure 2—figure supplement 2
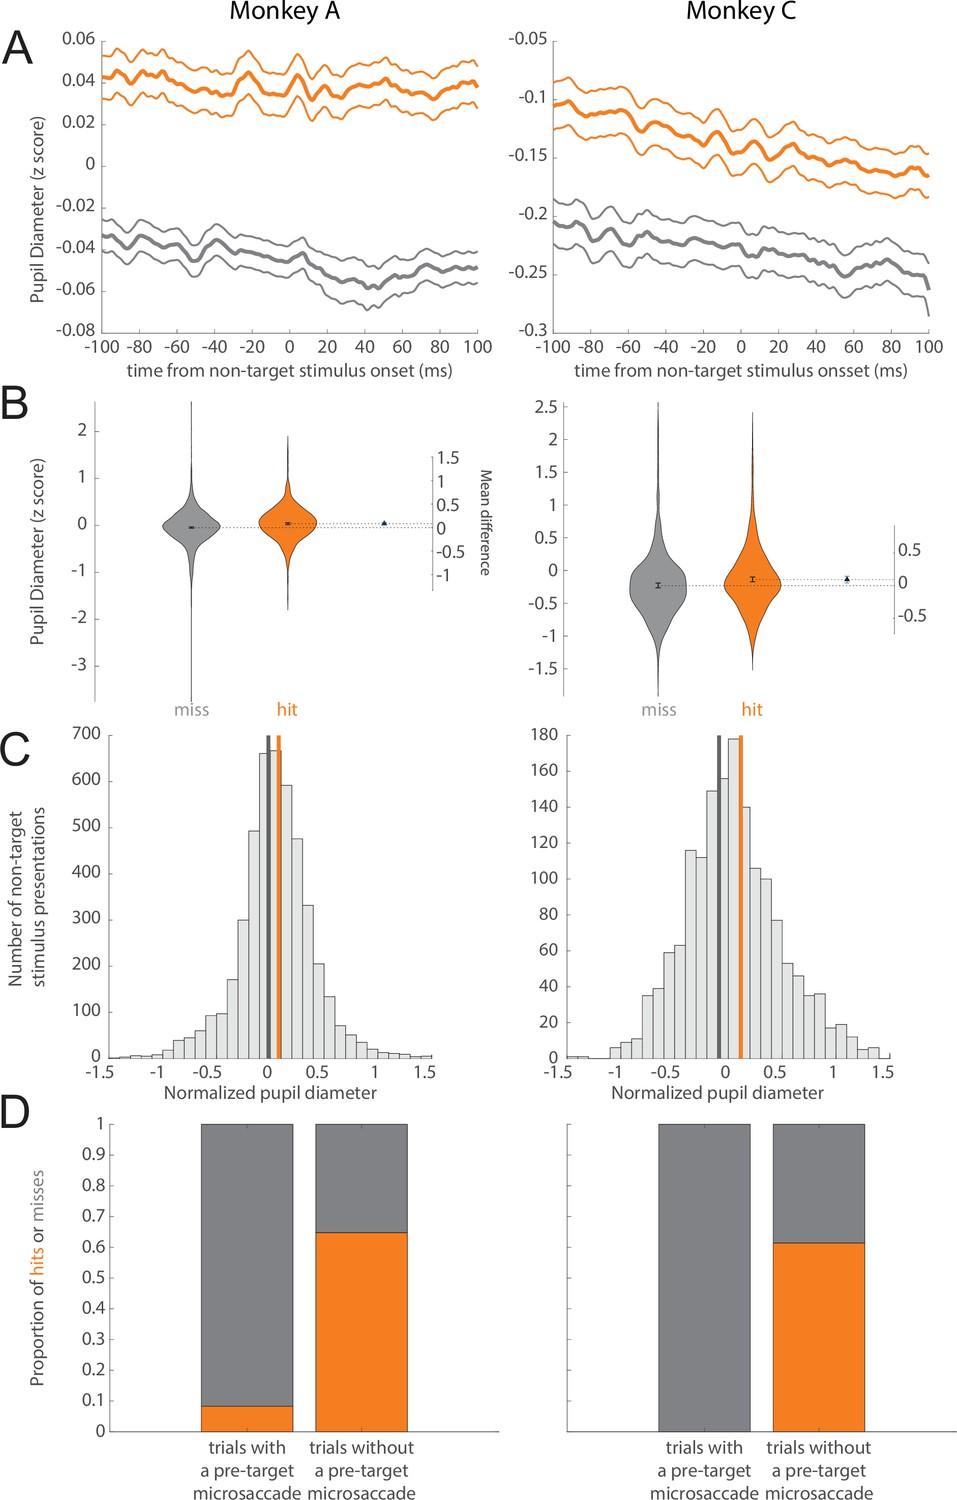
Single monkey pupil diameter and microsaccade data.
(A) Normalized pupil diameter for hit and miss trails in the threshold condition separated by monkey. 0 ms corresponds to non-target and target stimulus onset. Mean ± s.e.m. (B) Distribution of pupil diameter values associated with hit and miss trials separated by monkey. Pupil diameter was averaged from 100 ms before to 100 ms after non-target and target stimulus onset. Violin plots were generated using kernel smoothing (see Materials and methods). Error bars represent 95% confidence intervals for the mean of each distribution, and the mean difference (blue, right axes). (C) Histogram of mean pupil diameter around the time of non-target and target stimulus onset for each monkey (calculated as in B). Orange and gray lines represent the mean pupil diameter for hit and miss trials, respectively. (D) Hit rate for trials with and without a microsaccade detected in the time window 0–400 ms before target onset for each monkey.
Figure 3 with 3 supplements
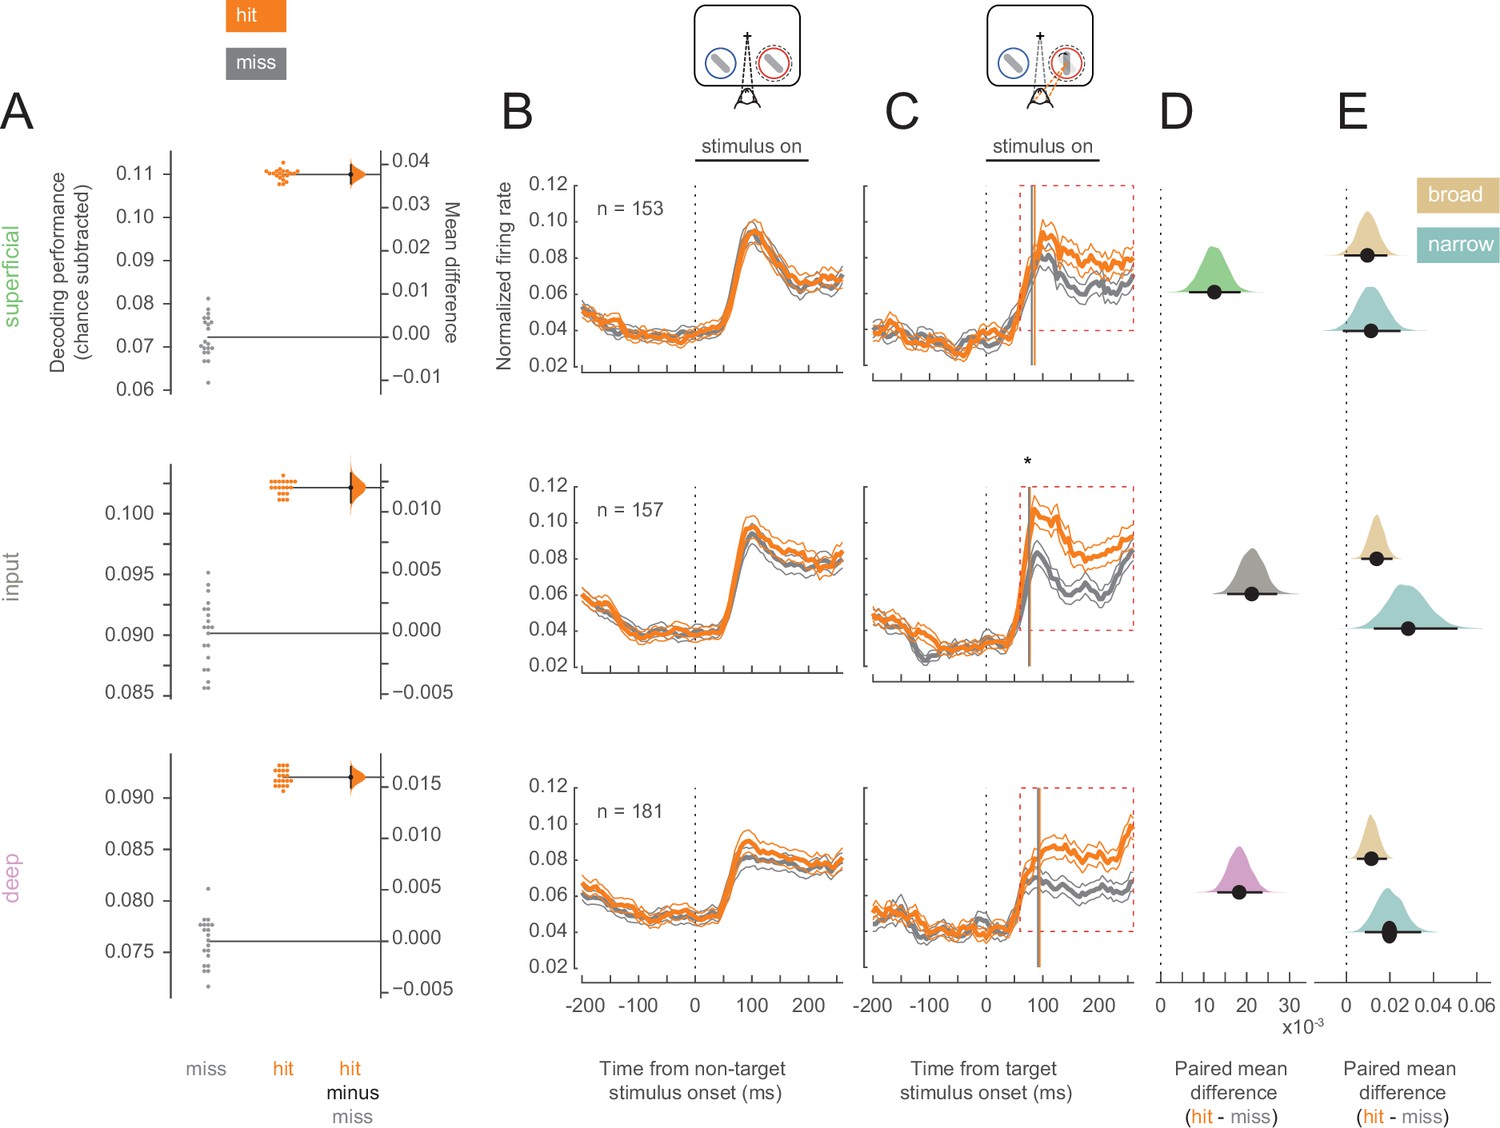
Target stimuli evoke higher firing rates in hit trials.
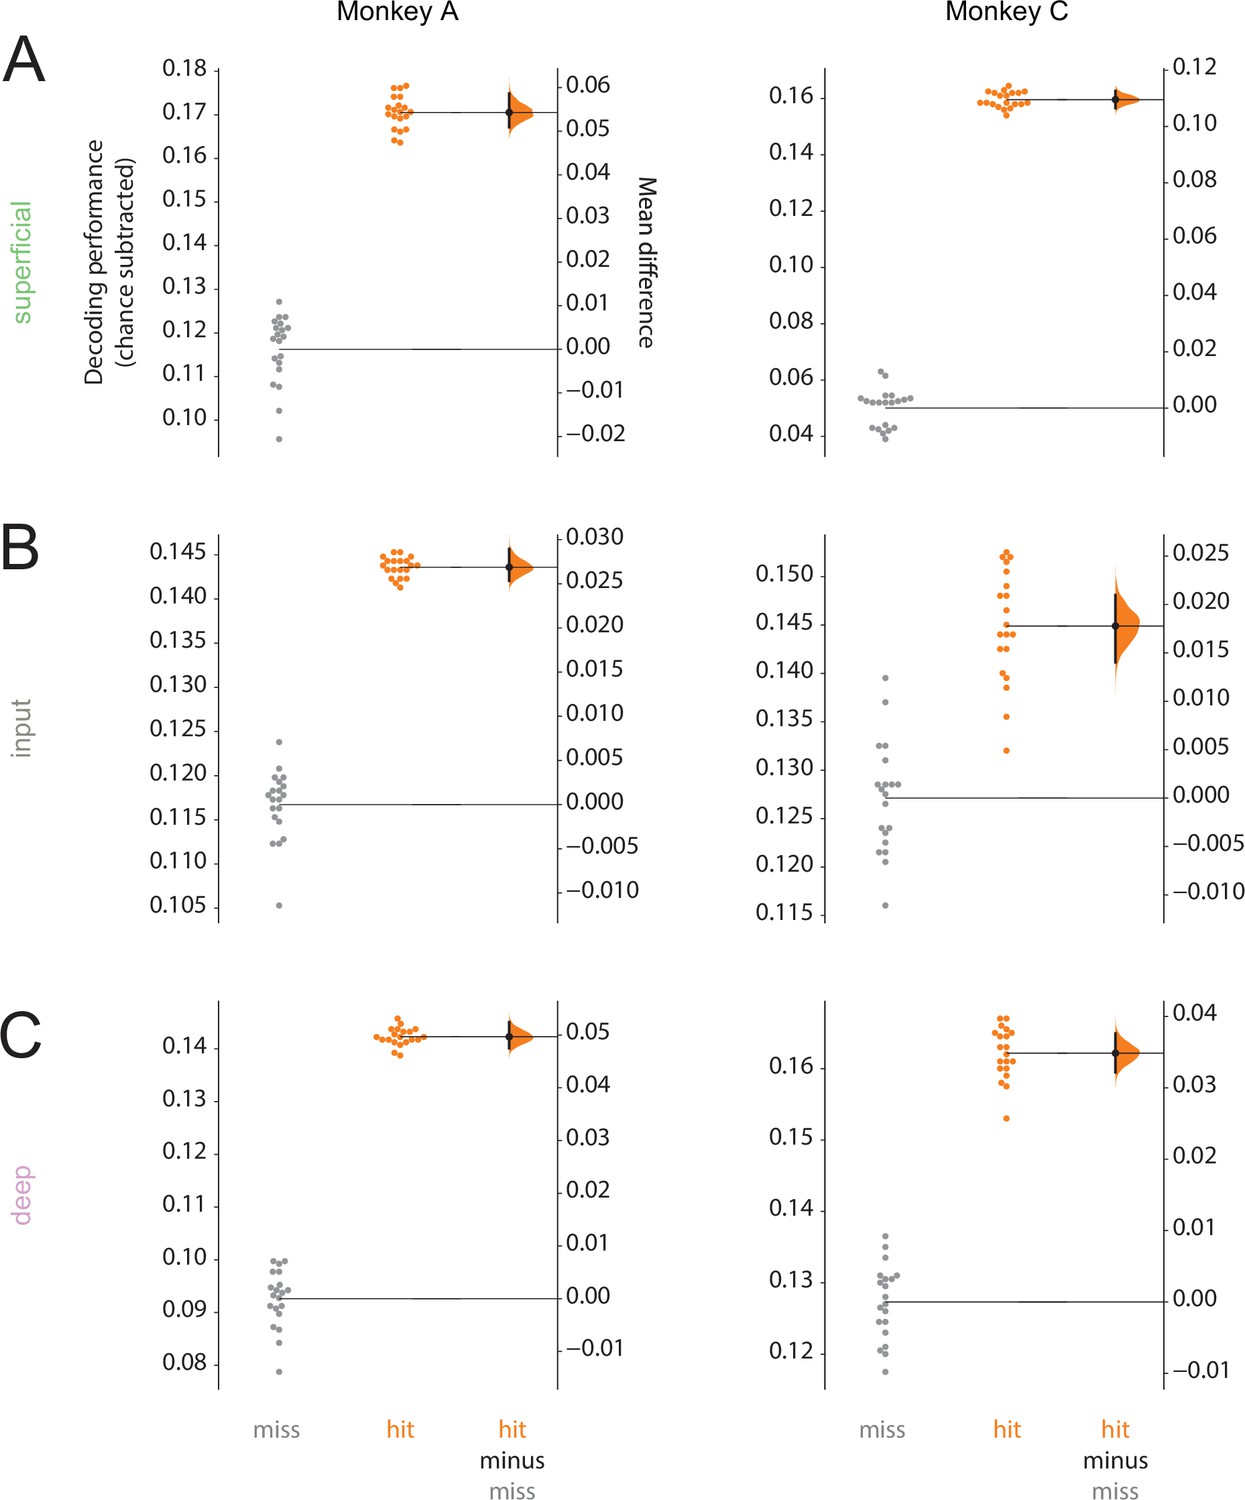
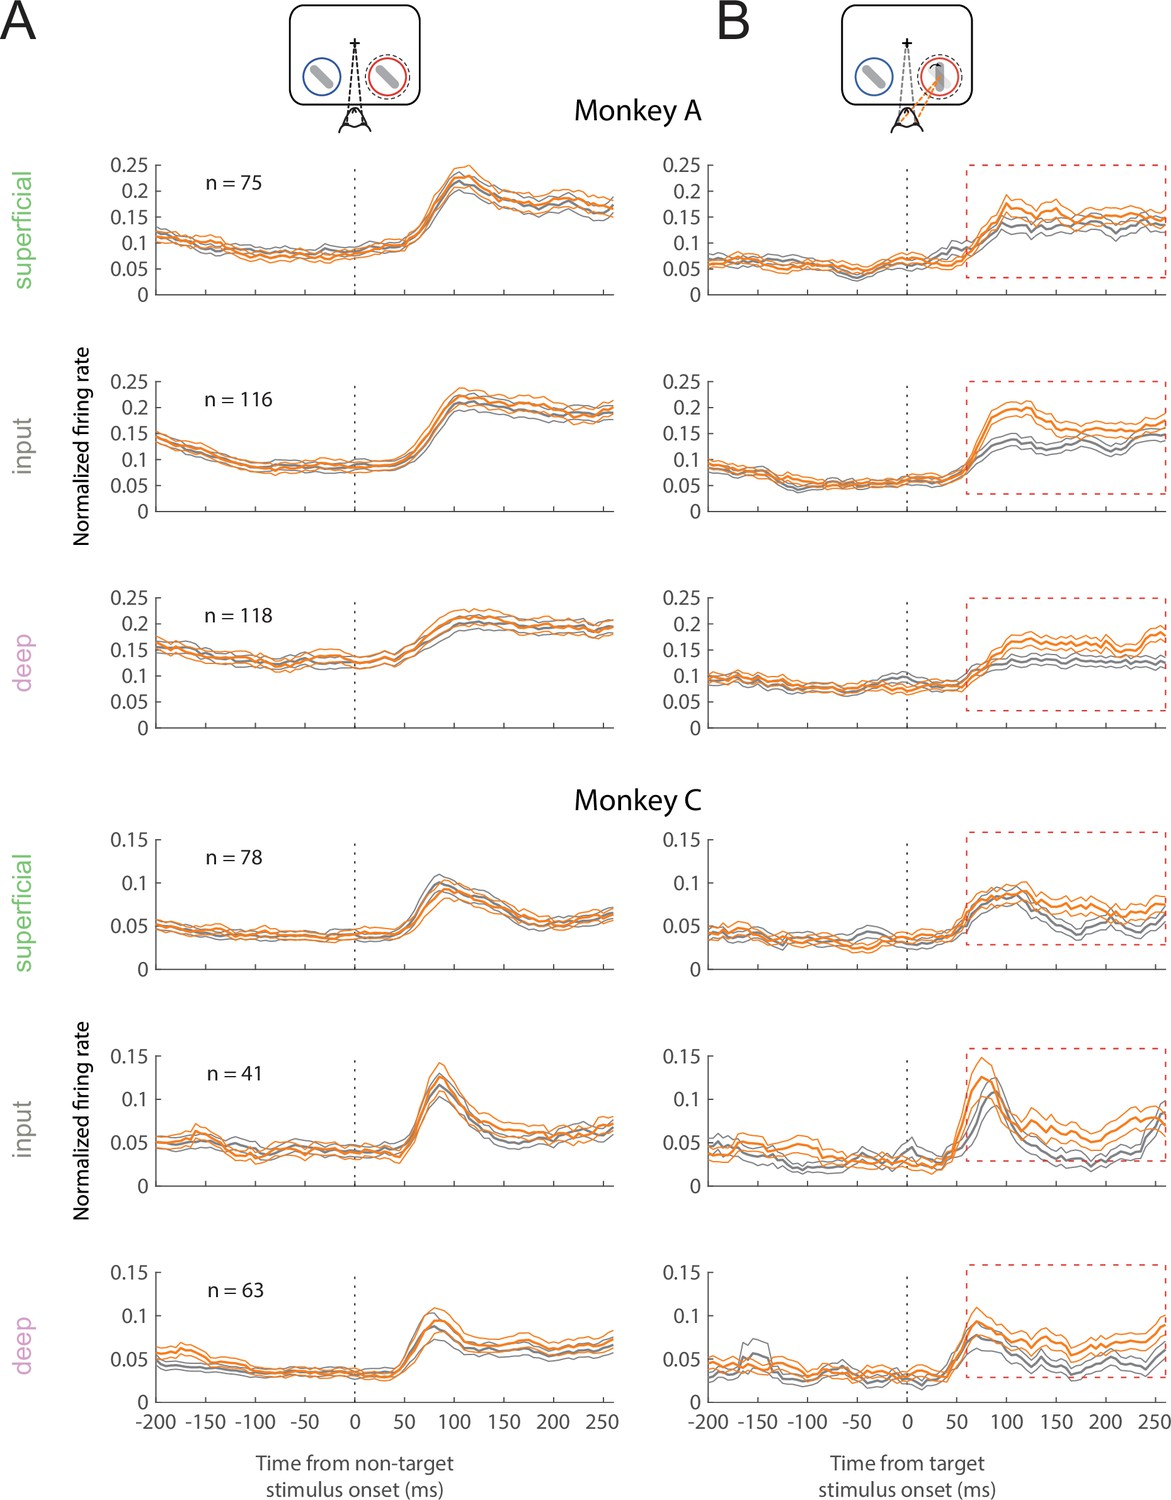
Rows correspond to different layers (top = superficial, middle = input, bottom = deep). (A) Performance for decoding targets from non-targets from single units and multi-units in each layer. Points in the left section of each plot show the decoding performance for each of the 20 different cross-validations. The right section for each layer shows the bootstrapped estimation of the difference between decoding performance between hits and misses. Half-violin plots show the bootstrapped distribution of the difference, and black dots and bars represent the mean and 95% confidence intervals of the difference in decoding performance. Chance levels, determined by shuffling target and non-target identity, were subtracted from the raw decoding performance values. (B) Non-target population (single- and multi-unit) PSTH of visually responsive neurons for the hit (orange) and miss (dark-gray) trials in the threshold condition (mean ± s.e.m.). The horizontal black bar indicates the time and duration of stimulus presentation. (C) As in B but for target stimuli. The star indicates the time at which firing rates in the input layer first differ significantly between hit and miss trials. Vertical lines represent the mean time at which firing rates for each neuron rise above the 95% confidence interval of their baseline activity (see also Figure 3—figure supplement 3C). (D) Bootstrapped estimation of the paired mean difference in target stimulus-evoked firing rate between hit and miss trials in the time window 60–260 ms (red dotted box in C) after target stimulus onset. Shaded regions represent the bootstrapped estimation of the paired mean difference in firing rate (hit-miss), and black lines are 95% confidence intervals. Plots include data from both single and multi-units, separated by layer (top = superficial, middle = input, bottom = deep). (E) As in D, bootstrapped estimation of the paired mean difference in firing rate for hit trials compared to miss trials in the target stimulus-evoked period, but only for single units broken up by cell class (gold = broad, teal = narrow).
Figure 3—figure supplement 1
Single monkey decoding performance.
(A) Performance for decoding targets from non-targets from single units and multi-units in the superficial layer for individual monkeys. Points in the left section of each plot show the decoding performance for each of the 20 different cross-validations. The right section for each layer shows the bootstrapped estimation of the difference between decoding performance in hits and misses. Half-violin plots show the bootstrapped distribution of the difference, and black dots and bars represent the mean and 95% confidence intervals of the difference in decoding performance. Chance levels, determined by shuffling target and non-target identity, were subtracted from the raw decoding performance values. (B) Same as A but for the input layer. (C) Same as A but for the deep layers.
Figure 3—figure supplement 2
Single monkey firing rate data.
(A) Single monkey non-target population (single- and multi-unit) PSTH of visually responsive neurons for the hit (orange) and miss (dark-gray) trials in the threshold condition (mean ± s.e.m.). (B) As in A but for target stimuli. Red box indicates the time window used for analysis in Figure 3C.
Figure 3—figure supplement 3
Firing rates for individual neurons and reaction time in threshold condition.
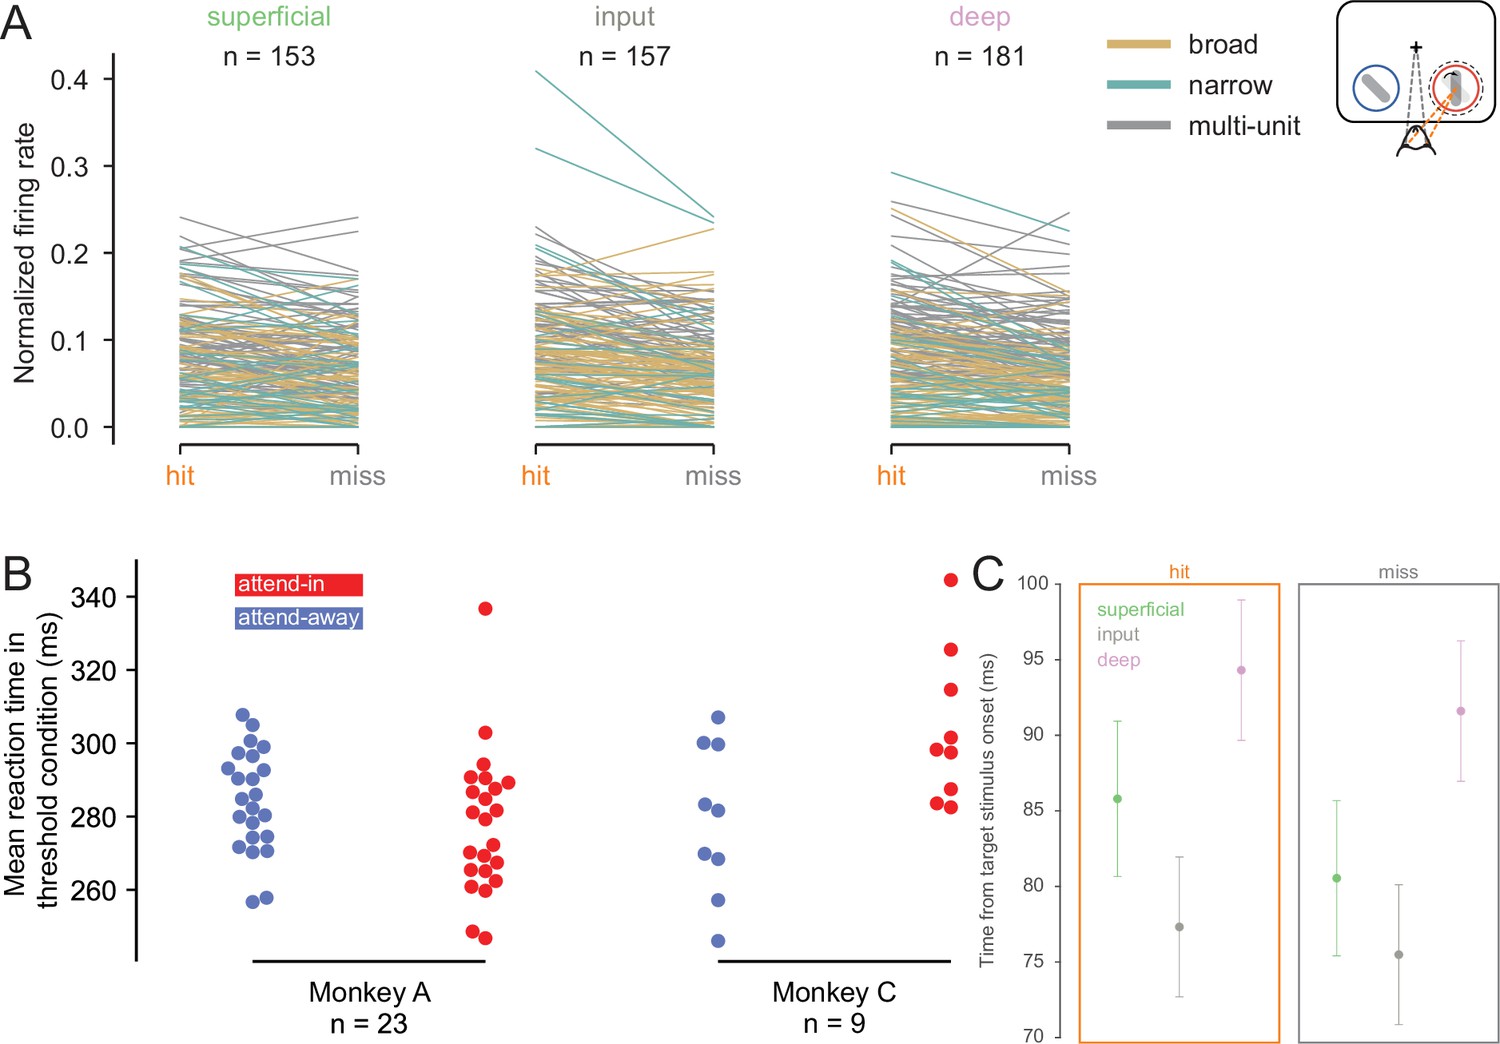
(A) Target stimulus-evoked normalized firing rates in hit and miss trials for each recorded single- and multi-unit cluster in hit and miss trials. Clusters are divided by layer: left = superficial, middle = input, right = deep. Related to Figure 3B. Each line represents the mean firing rate in response to target stimuli in hit and miss trials for a given unit. Data is color-coded by unit type (gold = broad, teal = narrow, gray = multi-unit). See Materials and methods for normalization method. (B) Mean reaction time (time from target stimulus onset to saccade onset) for hit trials in the threshold condition in both attend-in (red) and attend-away (blue) trials for each recording session. (C) Mean time at which single- and multi-unit firing rates rise significantly above pre-stimulus baseline in response to target stimuli in hit and miss trials. Mean ± s.e.m.
Figure 4 with 2 supplements
Broad-spiking neurons in the superficial layer have decreased variability in hit trials.
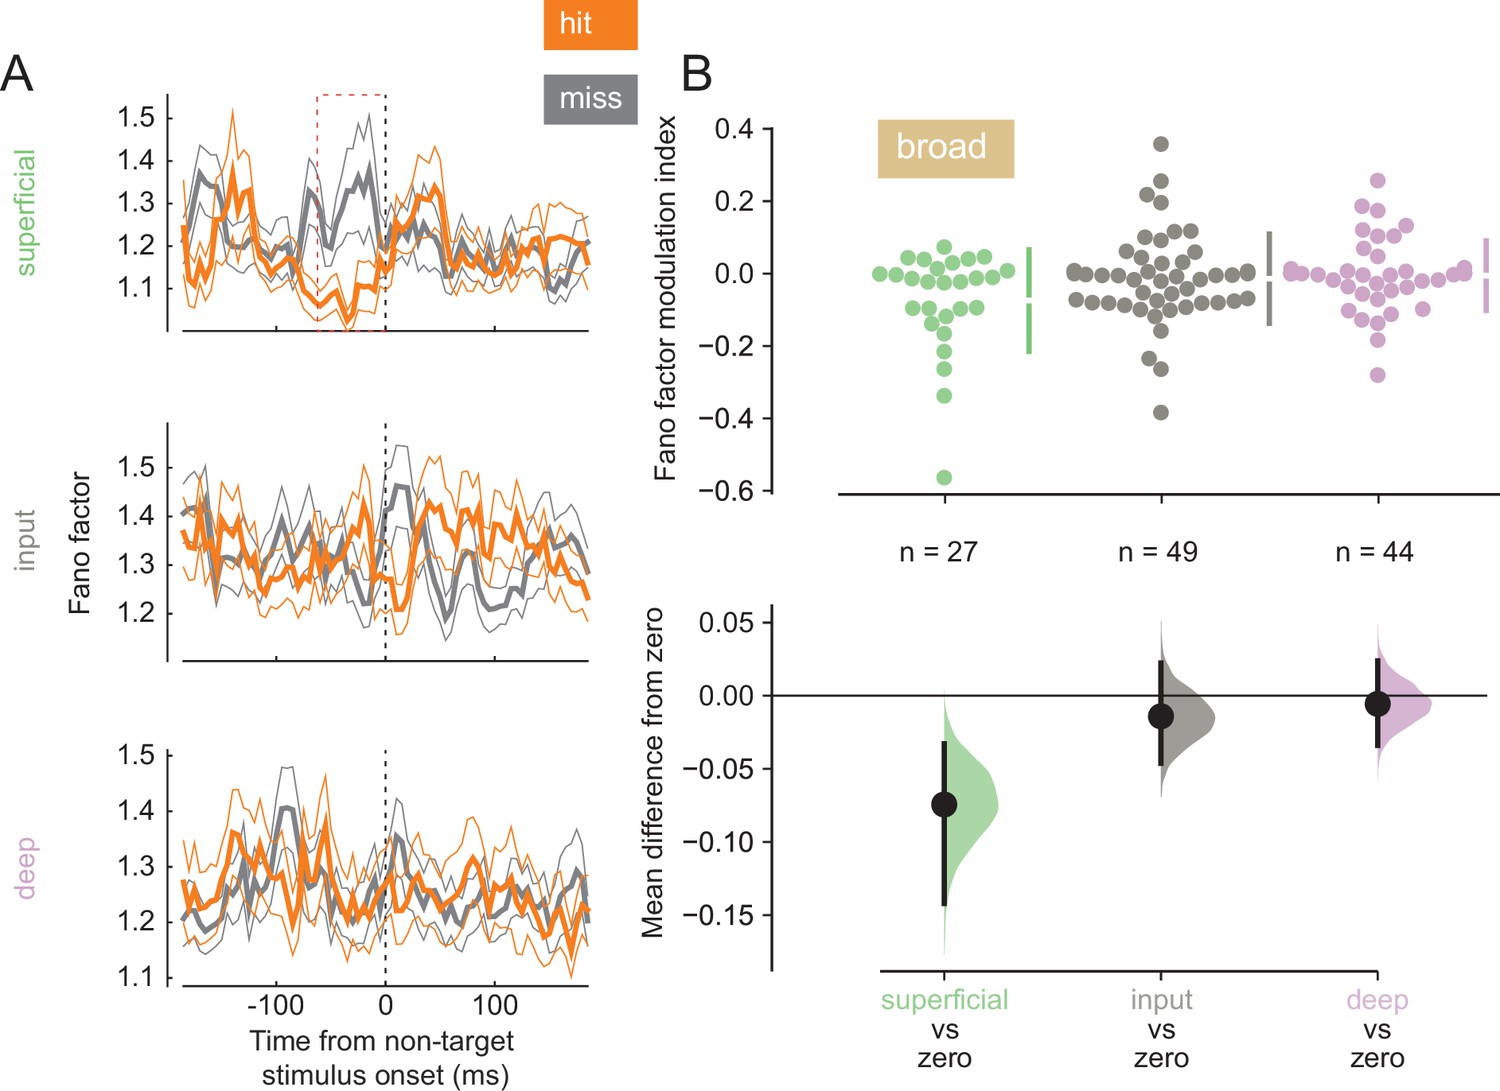
(A) Rows correspond to different layers (top = superficial, middle = input, bottom = deep). The Fano factor of broad-spiking putative excitatory neurons for the hit and miss trials in the threshold condition (mean ± s.e.m.). There is a significant decrease in variability for the hit trials prior to stimulus onset only in the superficial layer. 0 ms corresponds to non-target stimulus onset. The average Fano factor within a 60 ms time window (red dashed box) prior to non-target stimulus onset is plotted in B. (B) Top: Fano factor modulation index for each broad-spiking neurons recorded in each layer, averaged in the 60 ms preceding non-target stimulus onset. Bottom: Bootstrapped estimation of the mean difference of the Fano factor modulation index from zero in each of the three layers. Colored curves represent the estimated bootstrapped distribution. Black dots and lines reflect the mean and 95% confidence intervals of the distributions.
Figure 4—figure supplement 1
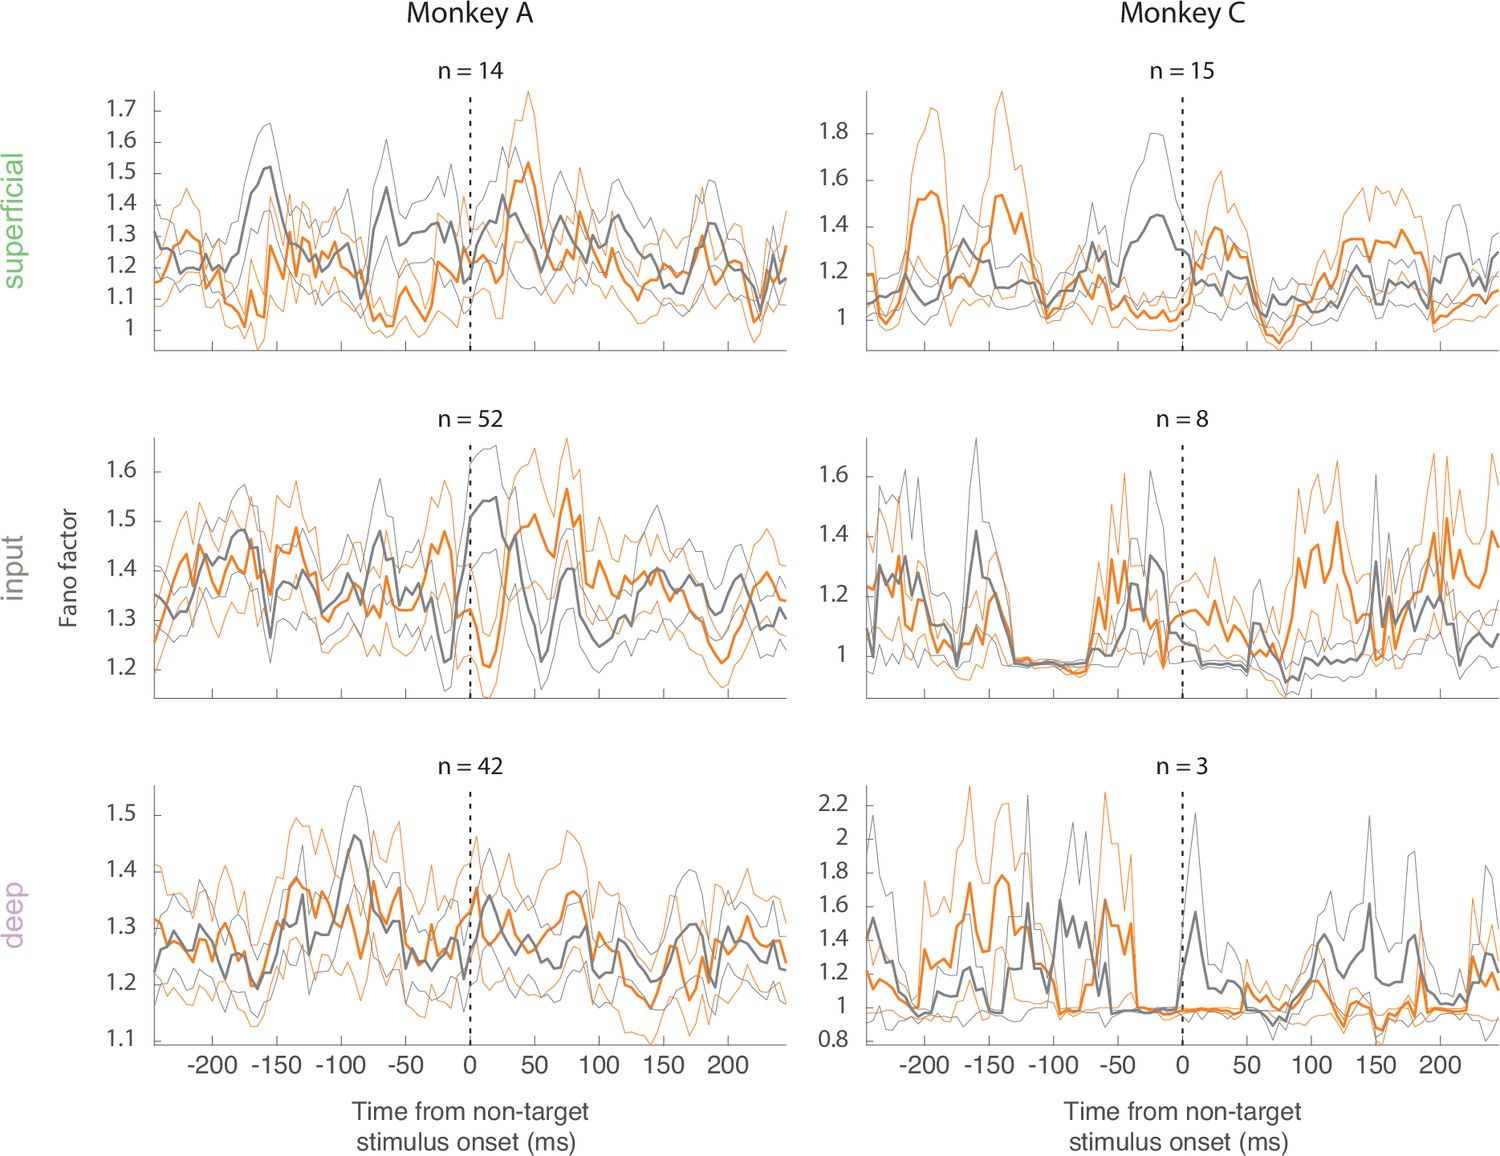
Single monkey Fano factor data.
Rows correspond to different layers (top = superficial, middle = input, bottom = deep) and columns correspond to monkeys. The Fano factor of broad-spiking putative excitatory neurons for the hit and miss trials in the threshold condition in each monkey (mean ± s.e.m.).
Figure 4—figure supplement 2
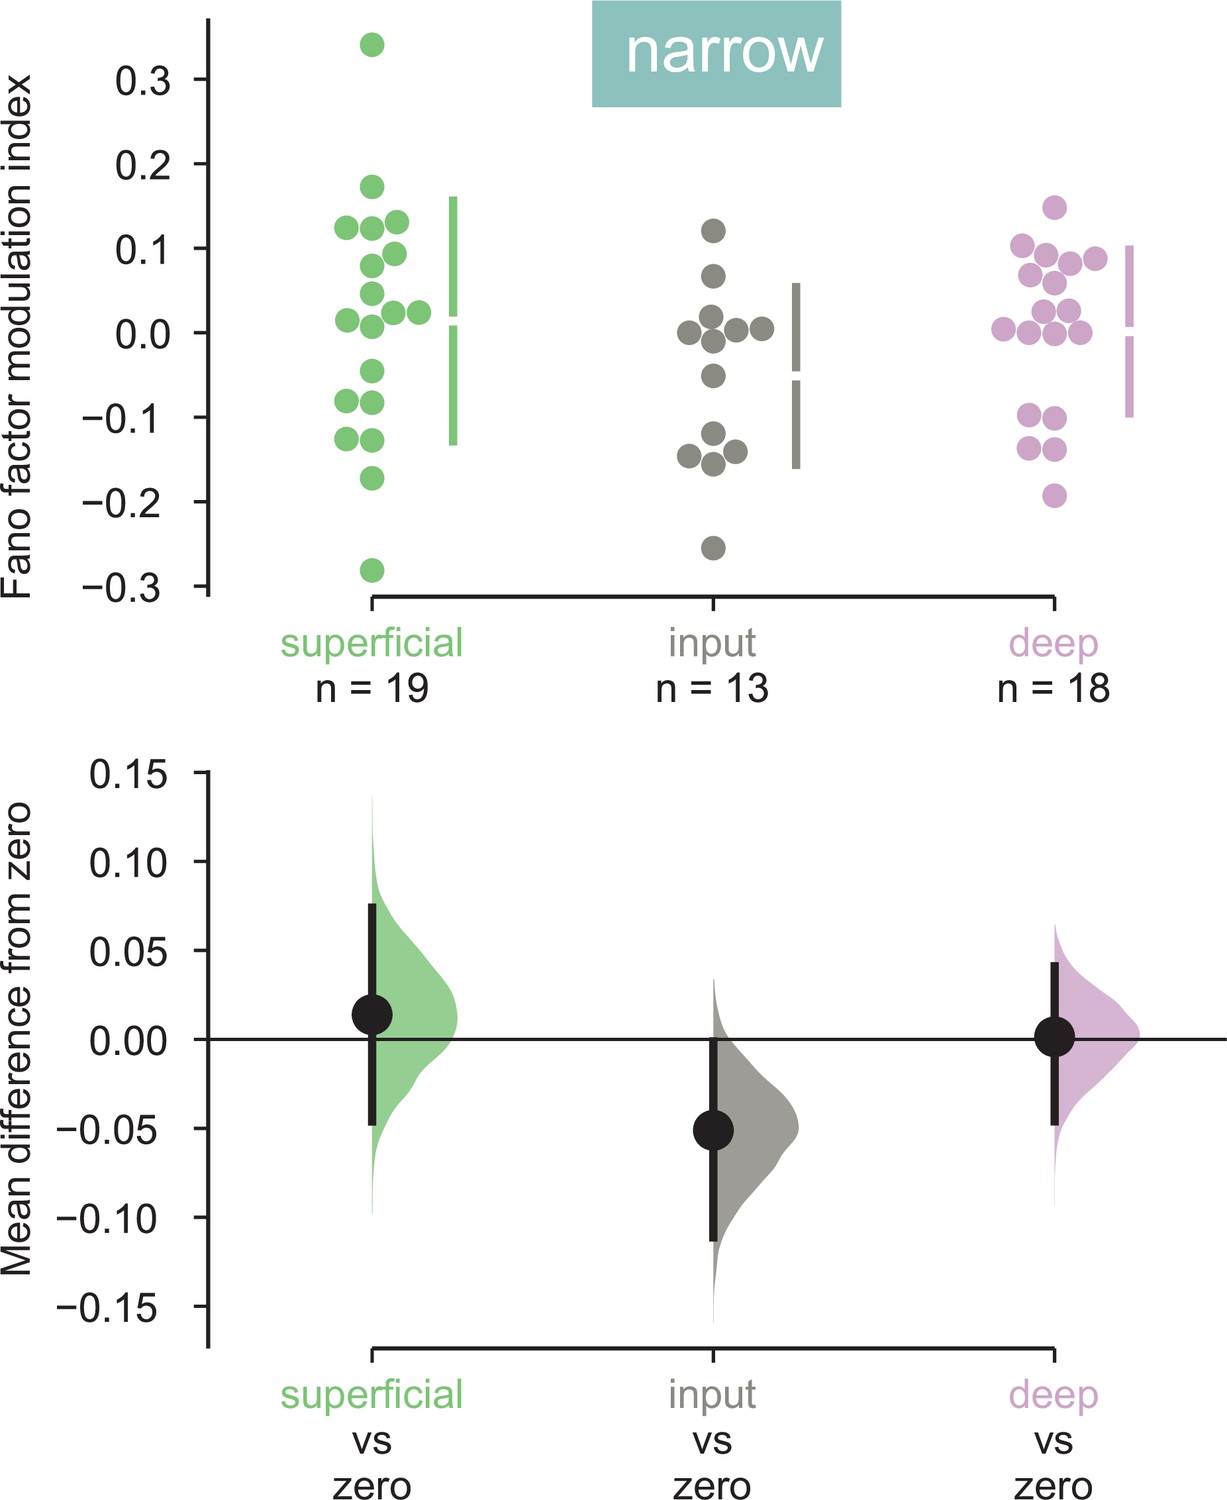
Narrow-spiking neurons do not have decreased variability in hit trials.
Top: Fano factor modulation index for each narrow-spiking neurons recorded in each layer, averaged in the 60 ms preceding non-target stimulus onset. Bottom: Bootstrapped estimation of the mean difference of the Fano factor modulation index from zero in each of the three layers. Colored curves represent the estimated bootstrapped distribution. Black dots and lines reflect the mean and 95% confidence intervals of the distributions.
Figure 5 with 2 supplements
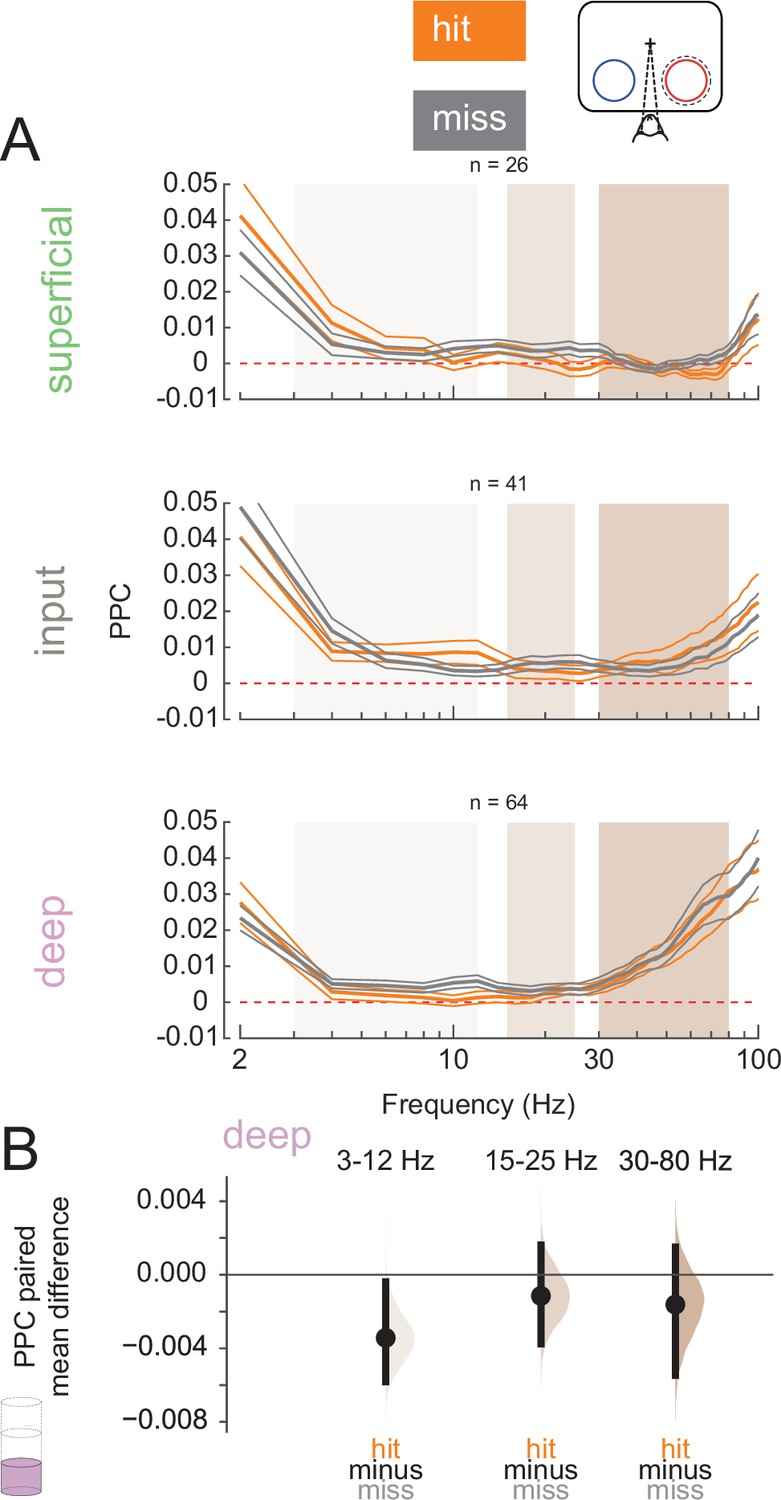
Deep-layer neurons are phase-locked to low-frequency rhythms in miss trials.
(A) Pairwise phase consistency (PPC) of single and multi-units in each layer to the local field potential (LFP) signal recorded from the same channel in hit and miss trials at threshold. PPC was calculated in the pre-stimulus period (0–200 ms before stimulus onset). Dashed red line indicates a PPC of 0, below which there is no consistent relationship between spikes and LFP phase. (B) Bootstrapped estimation plot for the paired mean difference in PPC for deep-layer neurons over three frequency bands: 3–12 Hz, 15–25 Hz, 30–80 Hz. Curves represent the bootstrapped distribution for the paired difference, and black dots and vertical lines represent the mean and 95% confidence intervals for the paired mean difference.
Figure 5—figure supplement 1
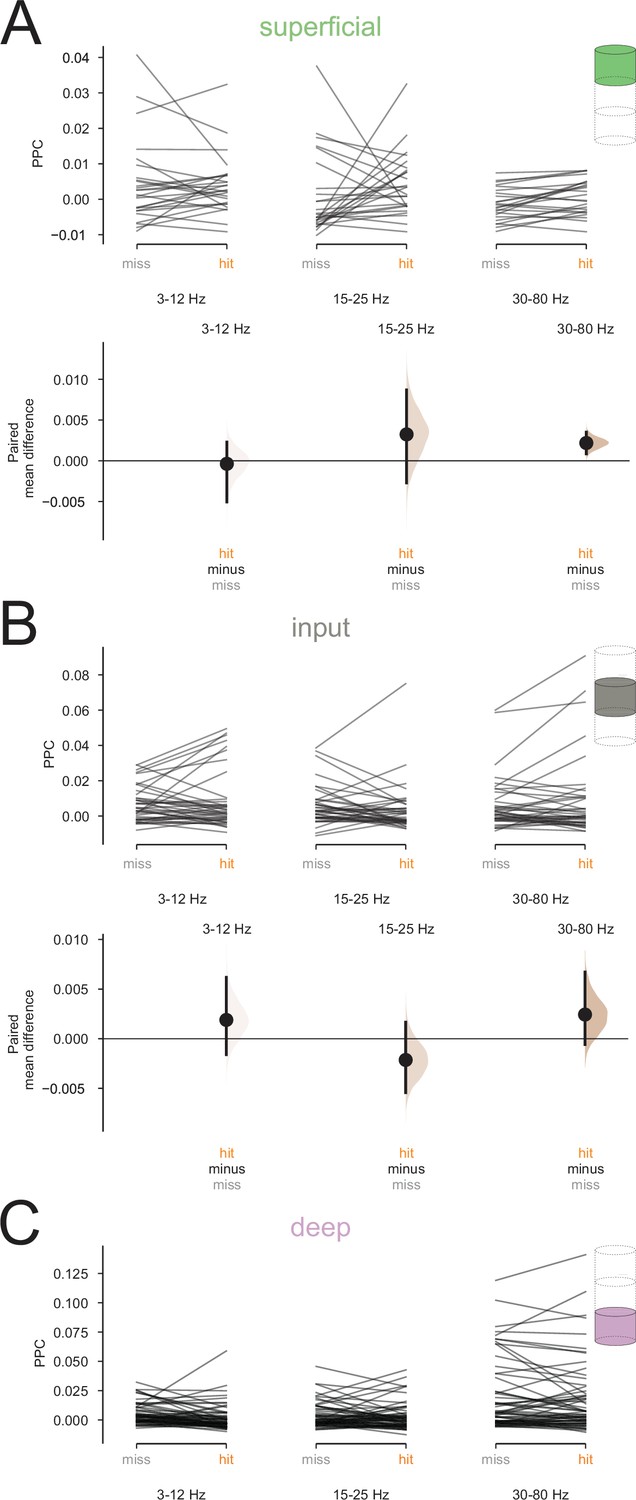
Additional pairwise phase consistency (PPC) data.
(A–B) Top: Raw PPC values calculated for clusters recorded in the superficial (A) and (B) input layers in hit and miss trials, averaged into three frequency bands, 3–12 Hz, 15–25 Hz, and 30–80 Hz. PPC was calculated using the local field potential (LFP) recorded on the same channel as the spikes. Bottom: Bootstrapped estimation of the paired mean difference in PPC across hit and miss trials for each frequency band. Note that although there appears to be a difference in high-frequency PPC in the superficial layer, this population does not have significantly positive PPC in either condition, indicating that there is no phase-locking in either hits or misses. (C) Raw PPC values for neurons recorded in the deep layer in hit and miss trials, averaged into the same three frequency bands. Related to Figure 5B.
Figure 5—figure supplement 2
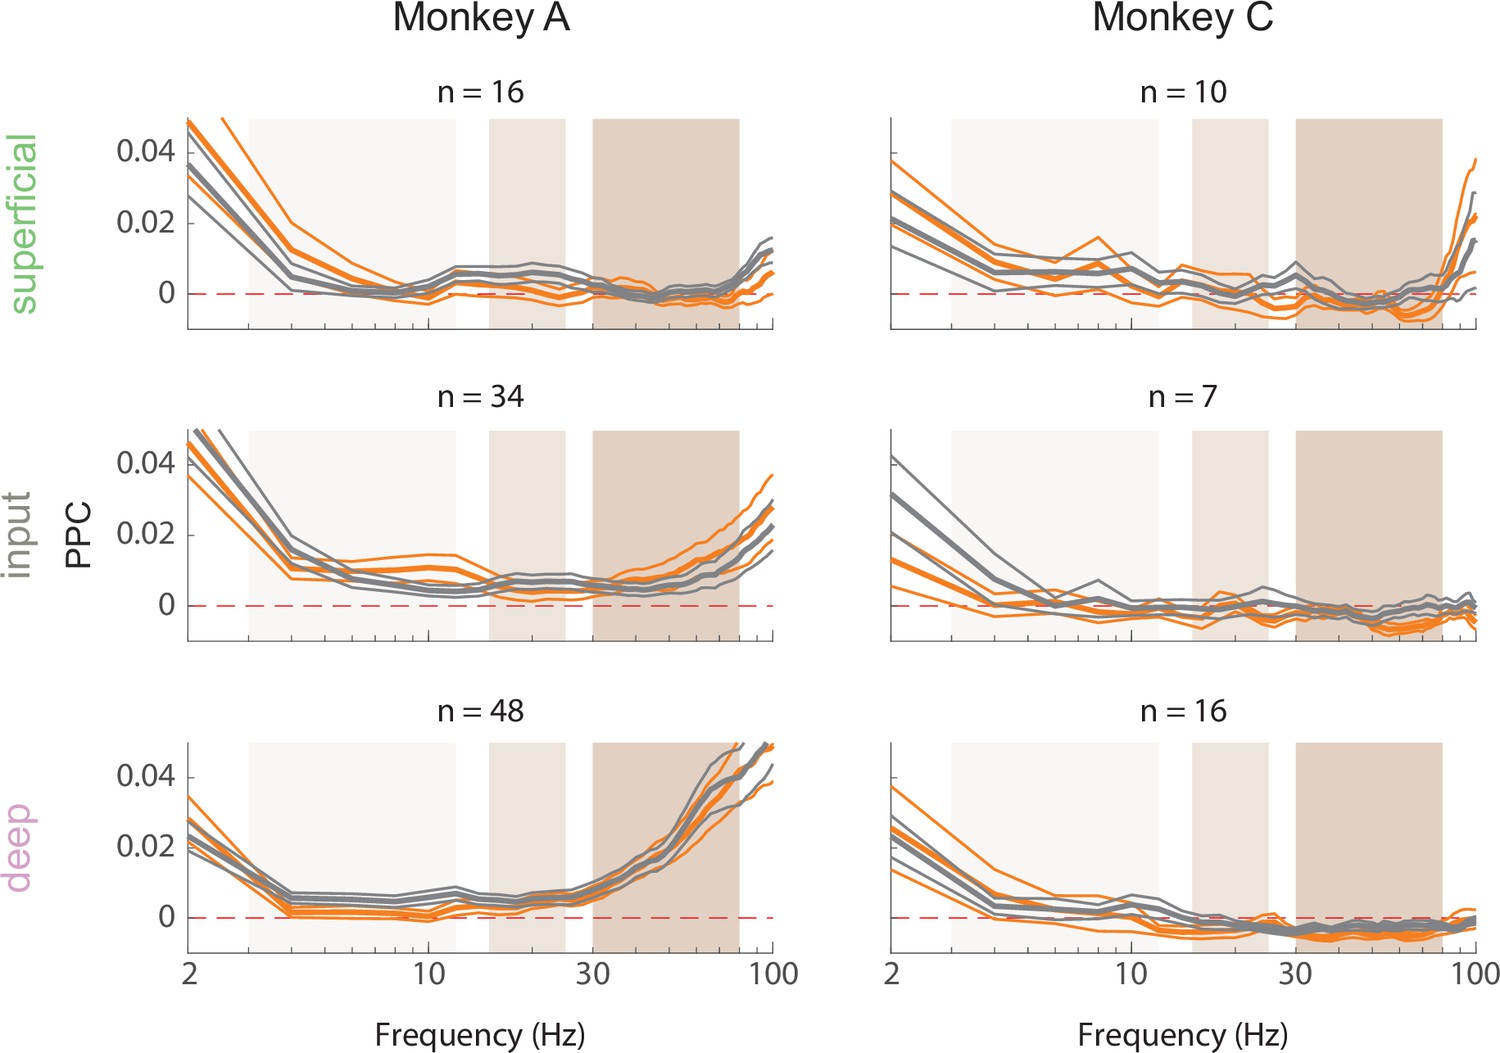
Single monkey pairwise phase consistency (PPC) data.
Rows correspond to different layers (top = superficial, middle = input, bottom = deep) and columns correspond to monkeys. PPC of single and multi-units in each layer to the local field potential (LFP) signal recorded from the same channel in hit (orange) and miss (gray) trials at threshold. PPC was calculated in the pre-stimulus period (0–200 ms before stimulus onset). Dashed red line indicates a PPC of 0, below which there is no consistent relationship between spikes and LFP phase.
Figure 6
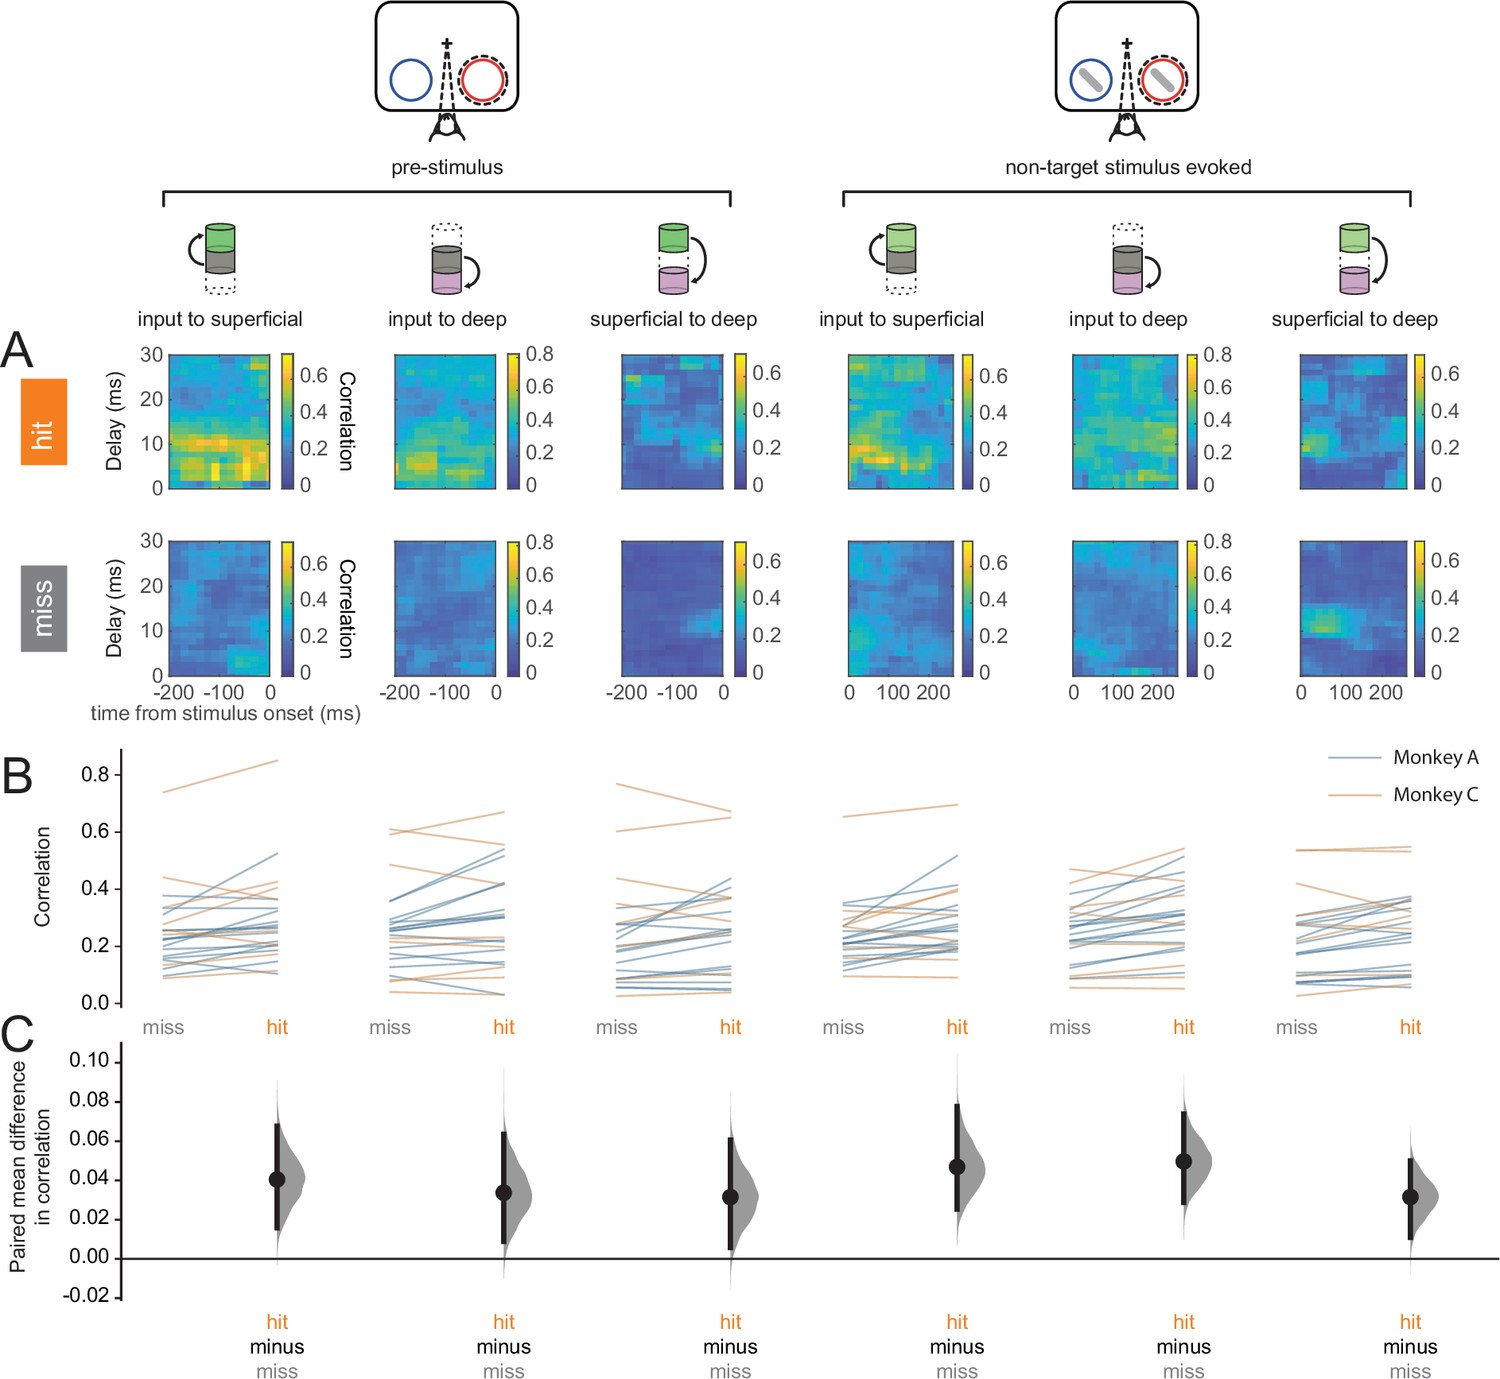
Hit trials are characterized by stronger feed-forward interlaminar population correlations.
(A) Canonical correlation analysis (CCA)-based population correlation as a function of time and interlaminar delay during the pre-stimulus and stimulus-evoked periods in hit and miss trials in an example session. (B) Mean feed-forward population correlation in each session. Color indicates the monkey (blue = Monkey A, yellow = Monkey C). (C) Bootstrapped estimation plot for the paired mean difference in population correlation for each pair of layers and time window (pre-stimulus or stimulus-evoked). Curves represent the bootstrapped distribution for the paired difference, and black dots and vertical lines represent the mean and 95% confidence intervals for the paired mean difference.
Figure 7 with 1 supplement
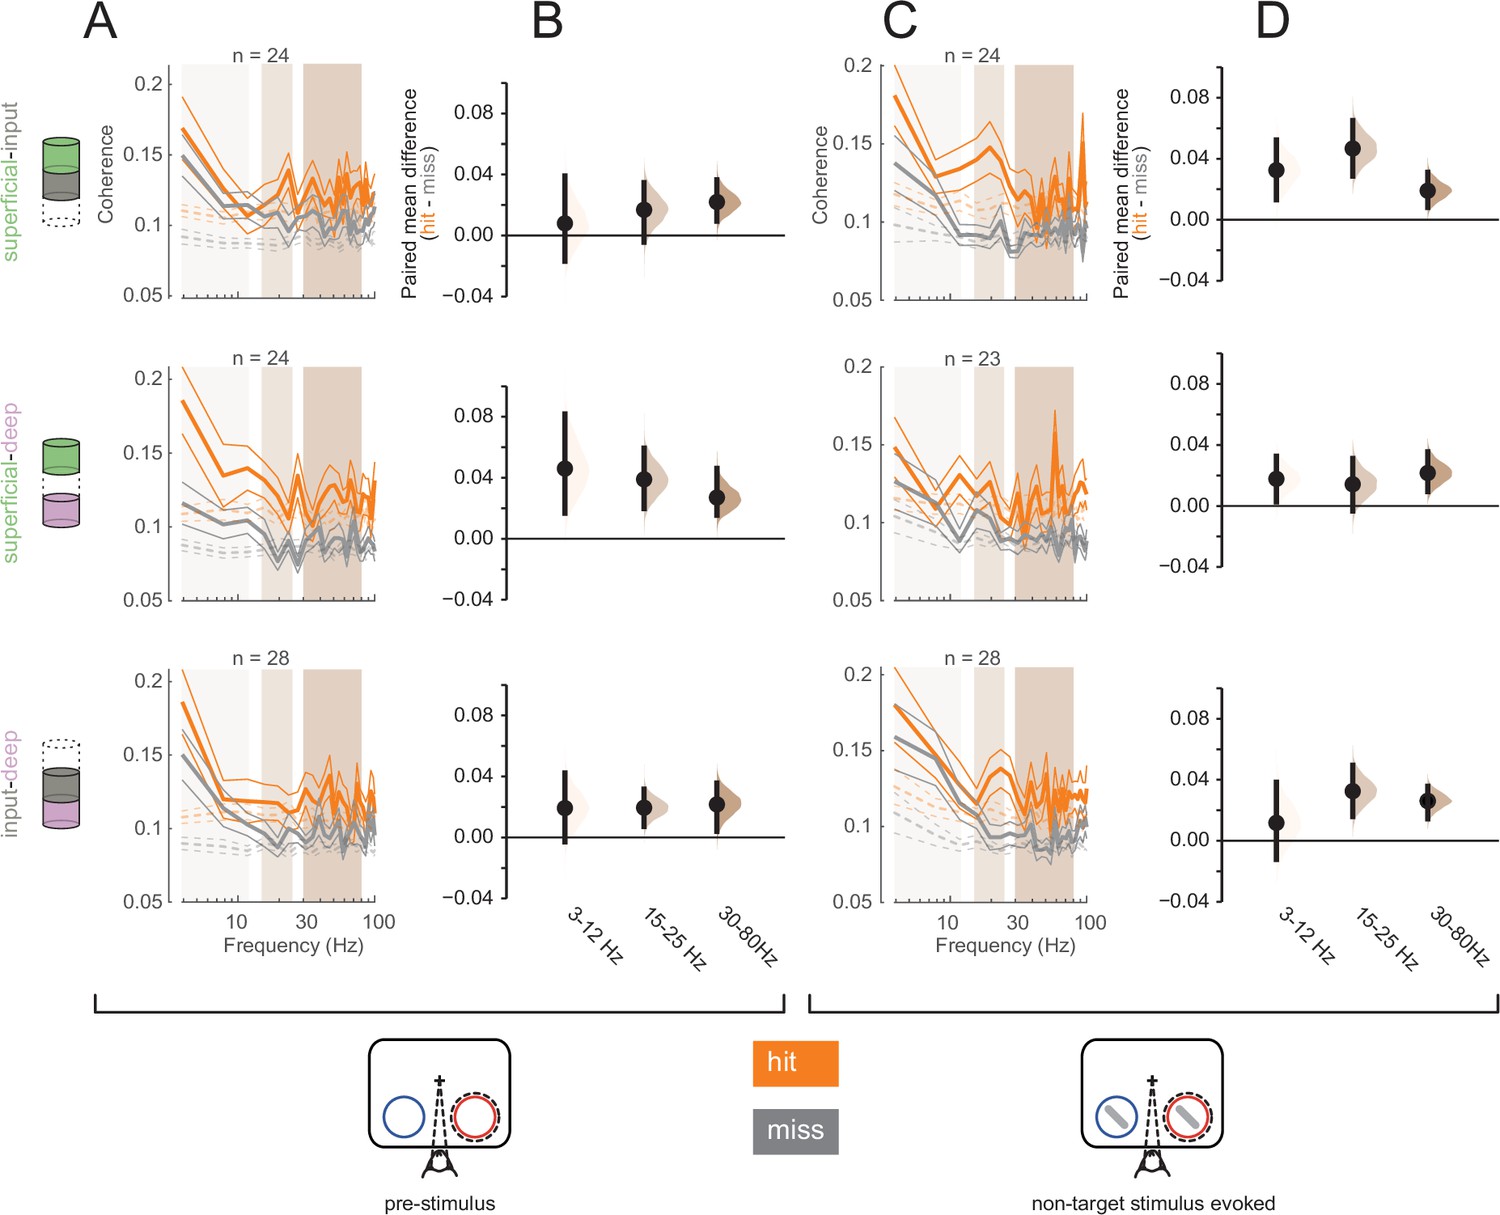
Greater interlaminar coherence in hit trials in the pre-stimulus and non-target stimulus-evoked periods.
Rows correspond to different pairs of layers (top = superficial-input, middle = superficial-deep, bottom = input-deep). (A) Multi-unit interlaminar spike-spike coherence (SSC) calculated in the 200 ms before non-target stimulus onset in hit and miss trials (solid lines, mean ± s.e.m.). Firing rates were matched across hit and miss trials. Dashed lines represent coherence calculated with shuffled trial identities (mean ± s.e.m.). (B) Bootstrapped estimation plot for the paired mean difference in SSC for each pair of layers averaged over three frequency bands: 3–12 Hz, 15–25 Hz, 30–80 Hz. Curves represent the bootstrapped distribution for the paired difference, and black dots and vertical lines represent the mean and 95% confidence intervals for the paired mean difference. (C) Interlaminar SSC in the non-target stimulus-evoked period (60–260 ms after stimulus onset). Same conventions as in A. (D) Bootstrapped estimation plot for the paired mean difference in SSC for each pair of layers averaged over three frequency bands. Same conventions as in B.
Figure 7—figure supplement 1
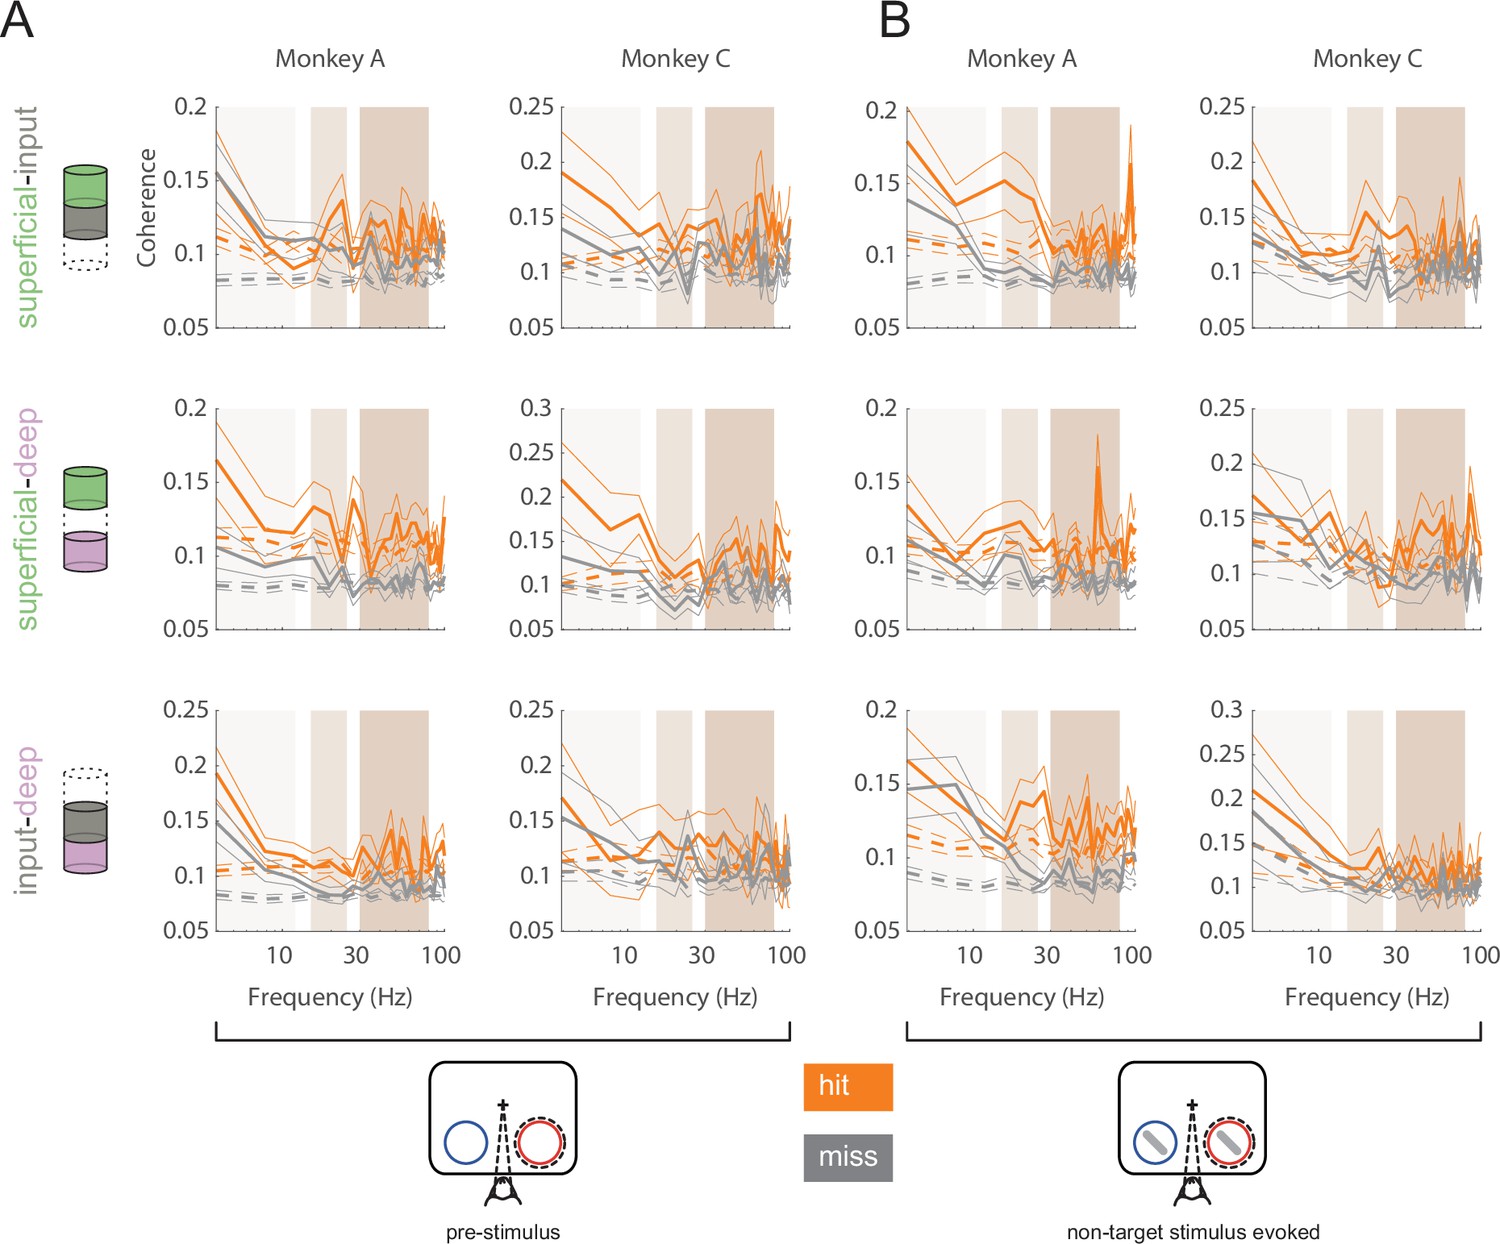
Single animal interlaminar coherence.
Rows correspond to different pairs of layers (top = superficial-input, middle = superficial-deep, bottom = input-deep). (A) Single monkey multi-unit interlaminar spike-spike coherence (SSC) calculated in the 200 ms before non-target stimulus onset in hit and miss trials (solid lines, mean ± s.e.m.). Firing rates were matched across hit and miss trials. Dashed lines represent coherence calculated with shuffled trial identities (mean ± s.e.m.). (B) Interlaminar SSC in the non-target stimulus-evoked period in each monkey (60–260 ms after stimulus onset). Same conventions as in A.
Figure 8
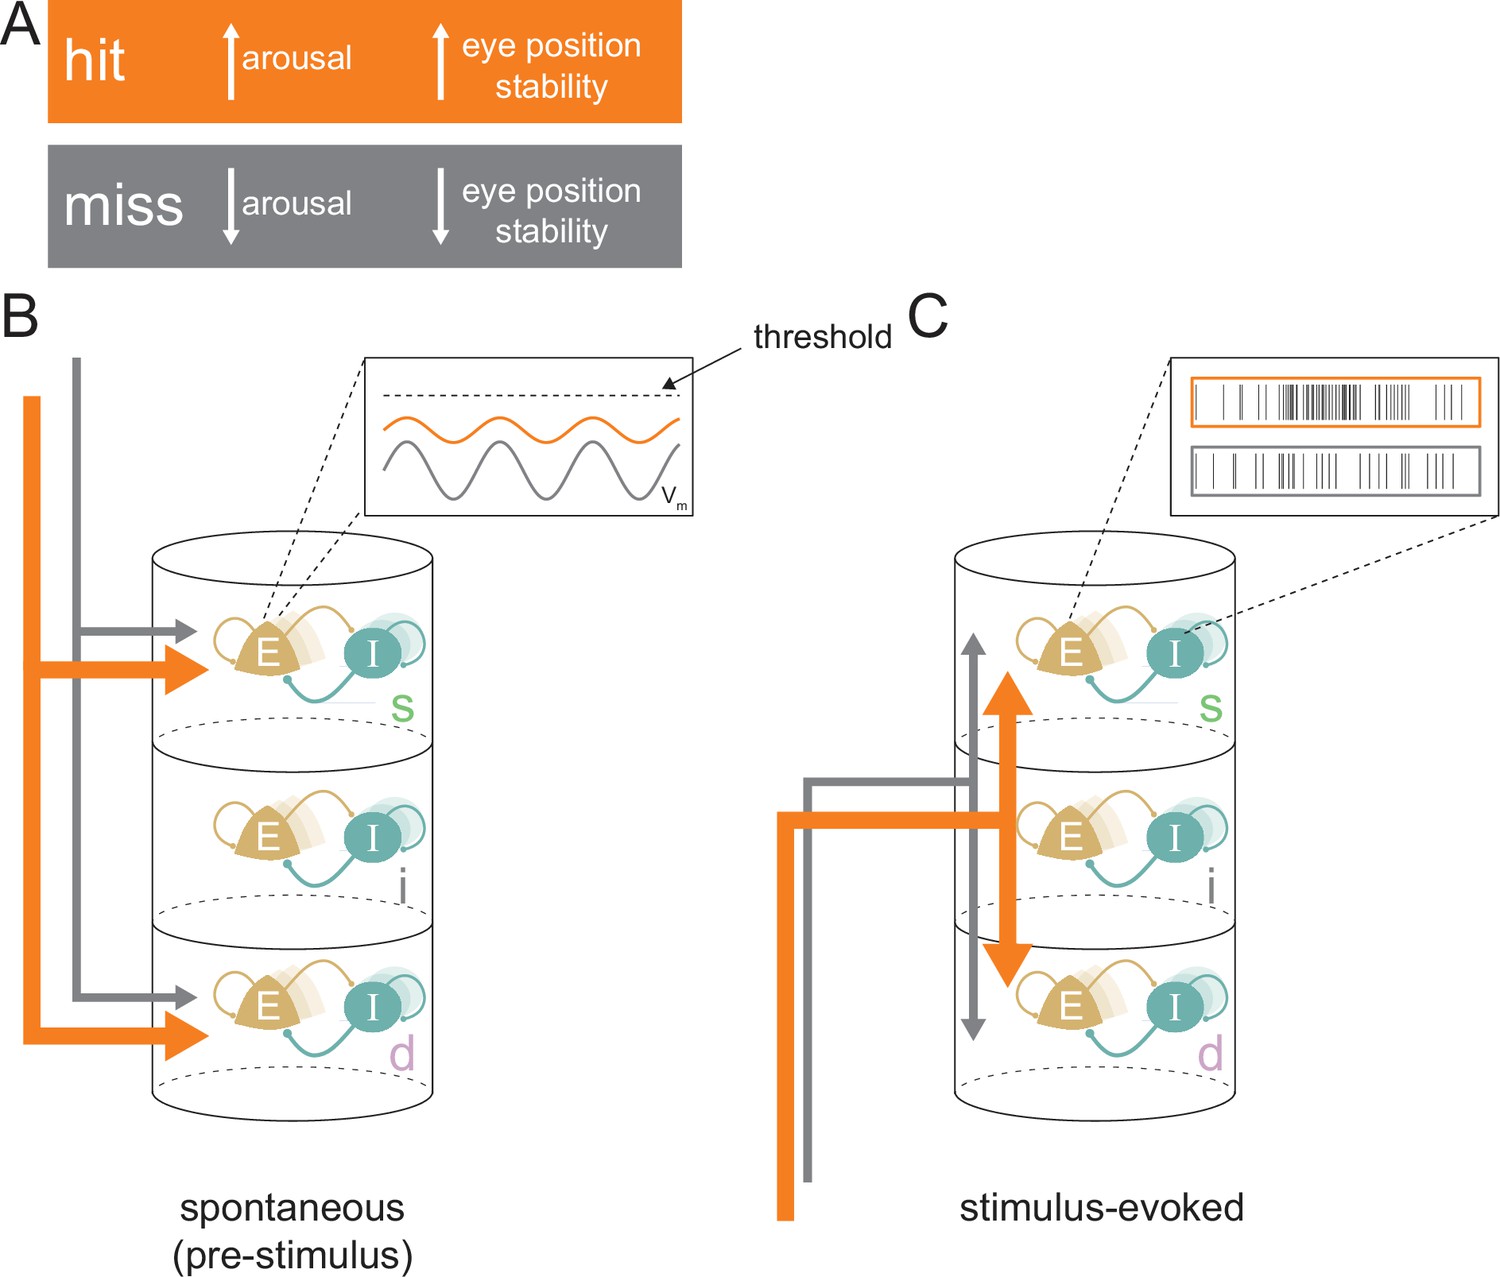
Conceptual model for stimulus processing at perceptual threshold.
(A) Hit trials have a larger pupil diameter and fewer pre-target microsaccades, reflecting a state of increased arousal and greater eye position stability. Conversely, miss trials show decreased arousal and eye position stability. (B) In the spontaneous pre-stimulus period, hits are characterized by decreased variability in superficial layer broad-spiking neurons, which we hypothesize is reflective of lower membrane potential (Vm) variability (inset). Hit trials are also characterized by greater synchrony between the superficial and deep layers (indicated by thicker arrows), which could be reflecting a stronger top-down influence on the cortical column. (C) In the stimulus-evoked period there is greater interlaminar synchrony between pairs that include the input layer (represented by thicker arrows), which we propose reflects improved feed-forward propagation of information. We propose these state differences in hits contribute to elevated firing rates in response to target stimuli, particularly in the superficial layers (inset), resulting in a higher-fidelity output to downstream areas. E=excitatory; I=inhibitory; s=superficial; i=input; d=deep.
Author response image 1
Tables
Key resources table
| Reagent type (species) or resource | Designation | Source or reference | Identifiers | Additional information |
|---|---|---|---|---|
| Other | Monkey | This paper | Species (Macaca mulatta) | |
| Software, algorithm | MATLAB | MathWorks | R2019a | |
| Software, algorithm | Cortex | NIMH | http://www.cortex.salk.edu/ |
Additional files
-
Supplementary file 1
Supplementary tables.
(a) Corresponding null hypothesis testing results. Null hypothesis testing results corresponding to the estimation statistics-based analyses. (b) Generalized linear model (GLM) coefficient values. Coefficients and significance values of the variables used in the GLM analysis. (c) GLM summary. Additional summary statistics of the GLM analysis.
- https://cdn.elifesciences.org/articles/91722/elife-91722-supp1-v1.docx
-
MDAR checklist
- https://cdn.elifesciences.org/articles/91722/elife-91722-mdarchecklist1-v1.docx
Download links
A two-part list of links to download the article, or parts of the article, in various formats.
Downloads (link to download the article as PDF)
Open citations (links to open the citations from this article in various online reference manager services)
Cite this article (links to download the citations from this article in formats compatible with various reference manager tools)
Brain state and cortical layer-specific mechanisms underlying perception at threshold
eLife 12:RP91722.
https://doi.org/10.7554/eLife.91722.4


