The role of GABA in semantic memory and its neuroplasticity
- School of Psychology, University of Nottingham, United Kingdom
- Division of Informatics, Imaging and Data Science, School of Health Sciences, University of Manchester, United Kingdom
- MRC Cognition and Brain Sciences Unit (CBU), University of Cambridge, United Kingdom
Figures
Figure 1
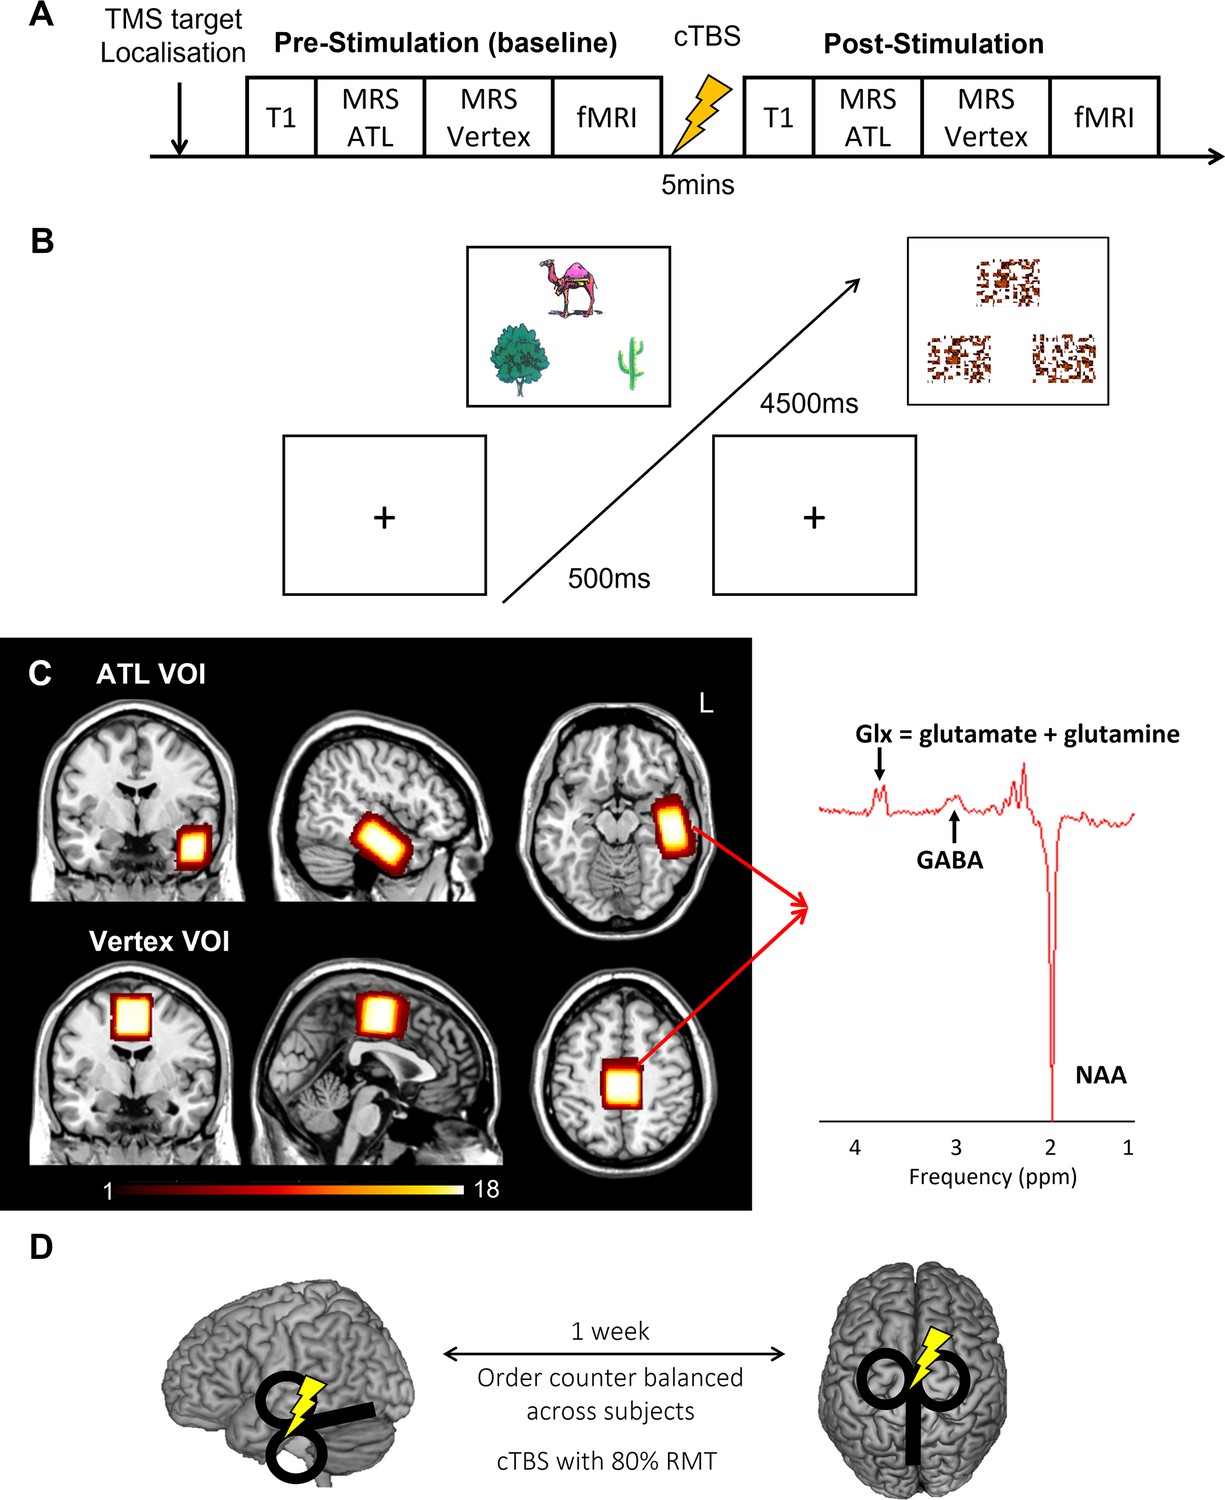
Experimental design and procedure.
(A) Experimental procedure. (B) An example of the semantic association task (left) and control task (right: pattern matching). Each trial starts with a fixation followed by stimuli, which have three items, a target on the top and two choices at the bottom. (C) The location of volume of interest (VOI) for MRS (left ATL and vertex) and a representative MRS spectrum with estimated peaks (right). Colour bar indicates the number of overlapping participants. NAA: N-acetylaspartate. (D) cTBS protocols. cTBS was applied over the left ATL and vertex as a control site. Each stimulation was delivered on different days with a week gap at least.
Figure 2 with 5 supplements
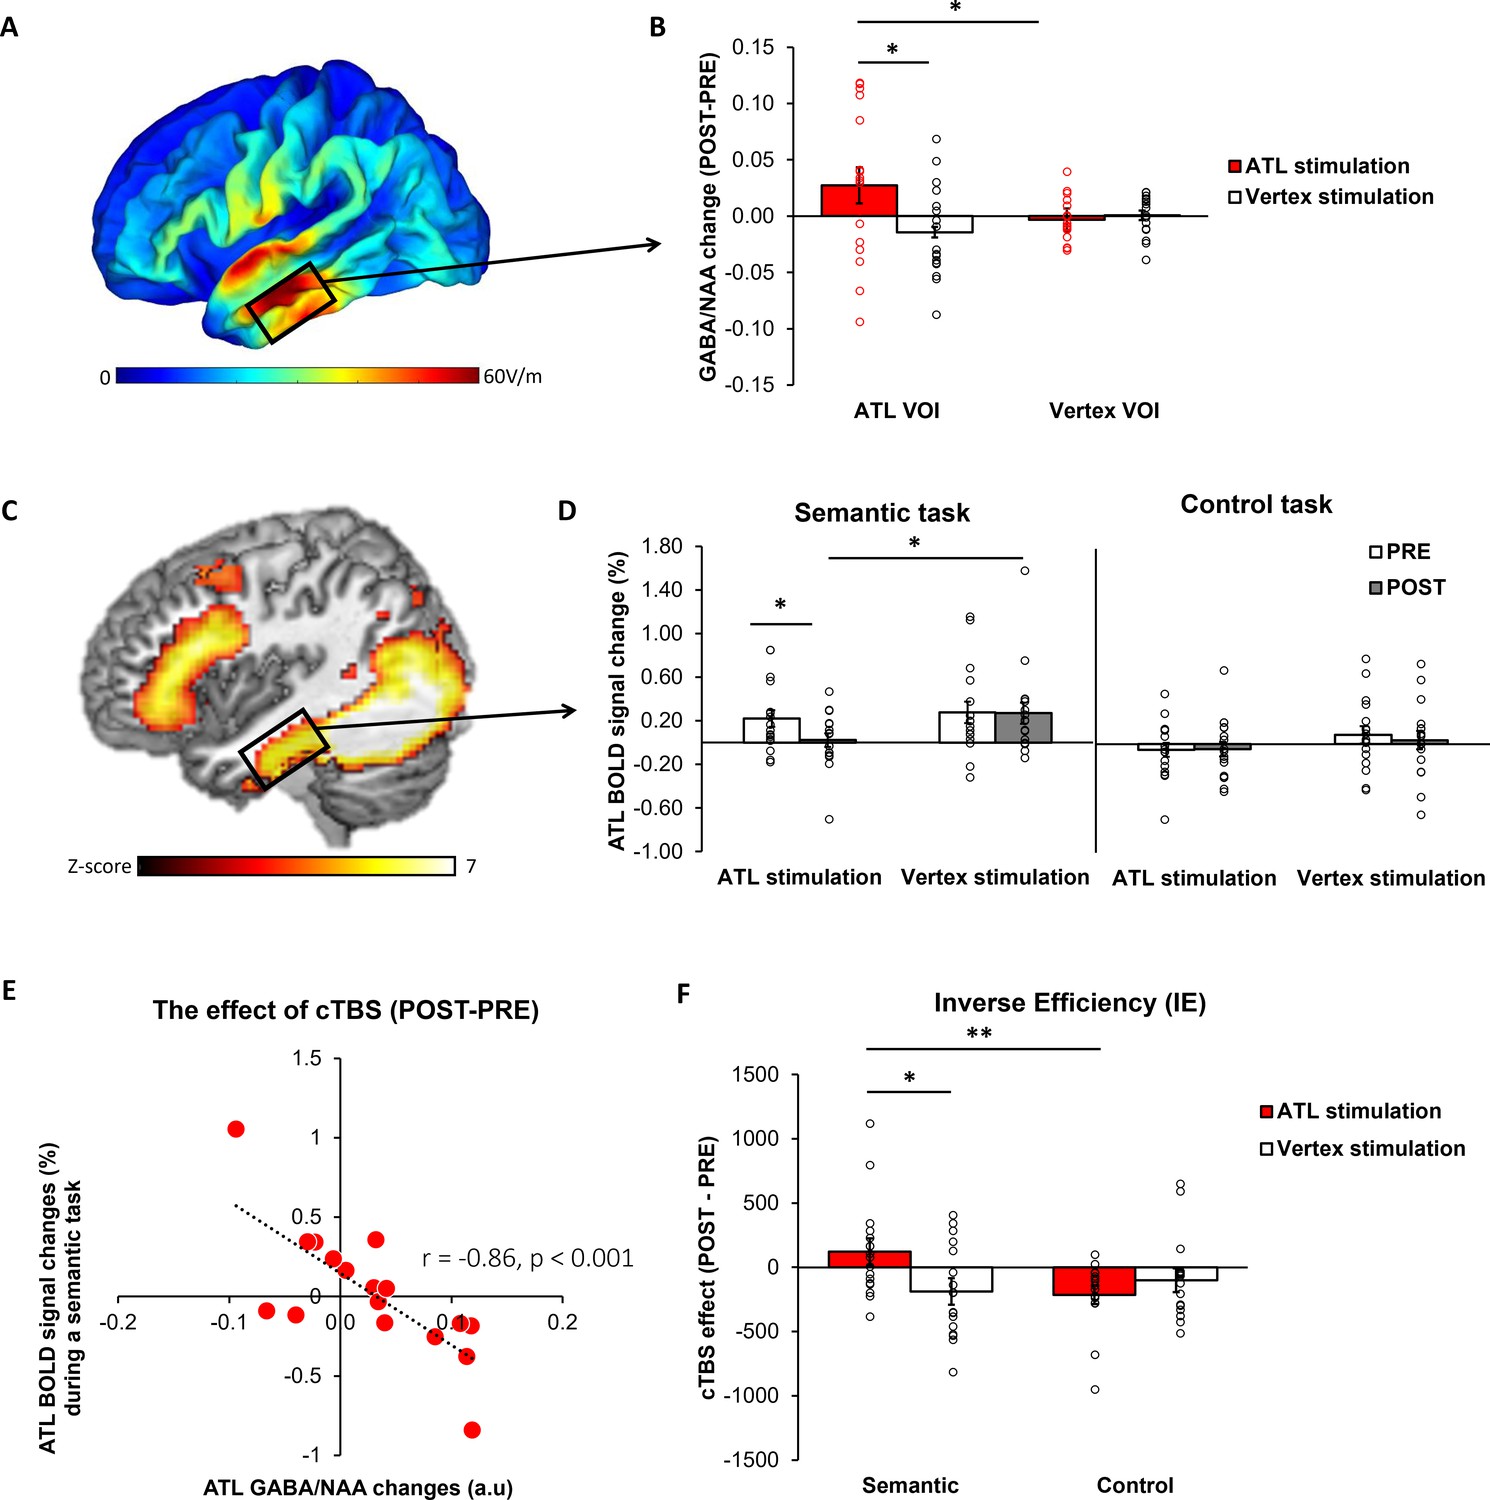
The effects of cTBS in the ATL.
(A) ATL cTBS e-field modelling. (B) cTBS-induced regional GABA changes in the ATL. Red bar indicates the ATL stimulation and white bar indicates the control (vertex) stimulation. (C) fMRI results of the contrast of interest (semantic >control) in the ATL pre-stimulation session. (D) cTBS-induced ATL BOLD signal changes during a semantic and control task. White bars represent the pre-stimulation session, and grey bars represent the post-stimulation session. (E) The relationship between cTBS-induced GABA changes and BOLD signal changes in the ATL. (F) The results of task performance. A positive value of cTBS effect (Post – Pre) in IE suggests an inhibitory effect, indicating poorer performance after the stimulation. In contrast, a negative value denotes a facilitatory effect, signifying improved performance following the stimulation. Red bar indicates the ATL stimulation and white bar indicates the control (vertex) stimulation. Each individual is represented as a circle. * p<0.05, ** p<0.01.
Figure 2—figure supplement 1

The effects of cTBS in Glx.
We conducted a 2x2 x 2 repeated measure of ANOVA with a stimulation (ATL vs. vertex), session (PRE vs. POST), and VOI (ATL vs. vertex) as within subject factors. The results demonstrated a significant main effect of VOI (F1, 16 = 41.56, p<0.001; Figure 1). The other effects did not reach a significant level.
Figure 2—figure supplement 2

The results of fMRI (semantic >control).
Figure 2—figure supplement 3

The results of task performance.
Red circles represent the average of the group. Error bars stand for standard errors.
Figure 2—figure supplement 4

E-field modelling of vertex stimulation.
Figure 2—figure supplement 5

The location of the ATL target site (MNI −36,–15, –30) and its regional activity during semantic processing.
Figure 3
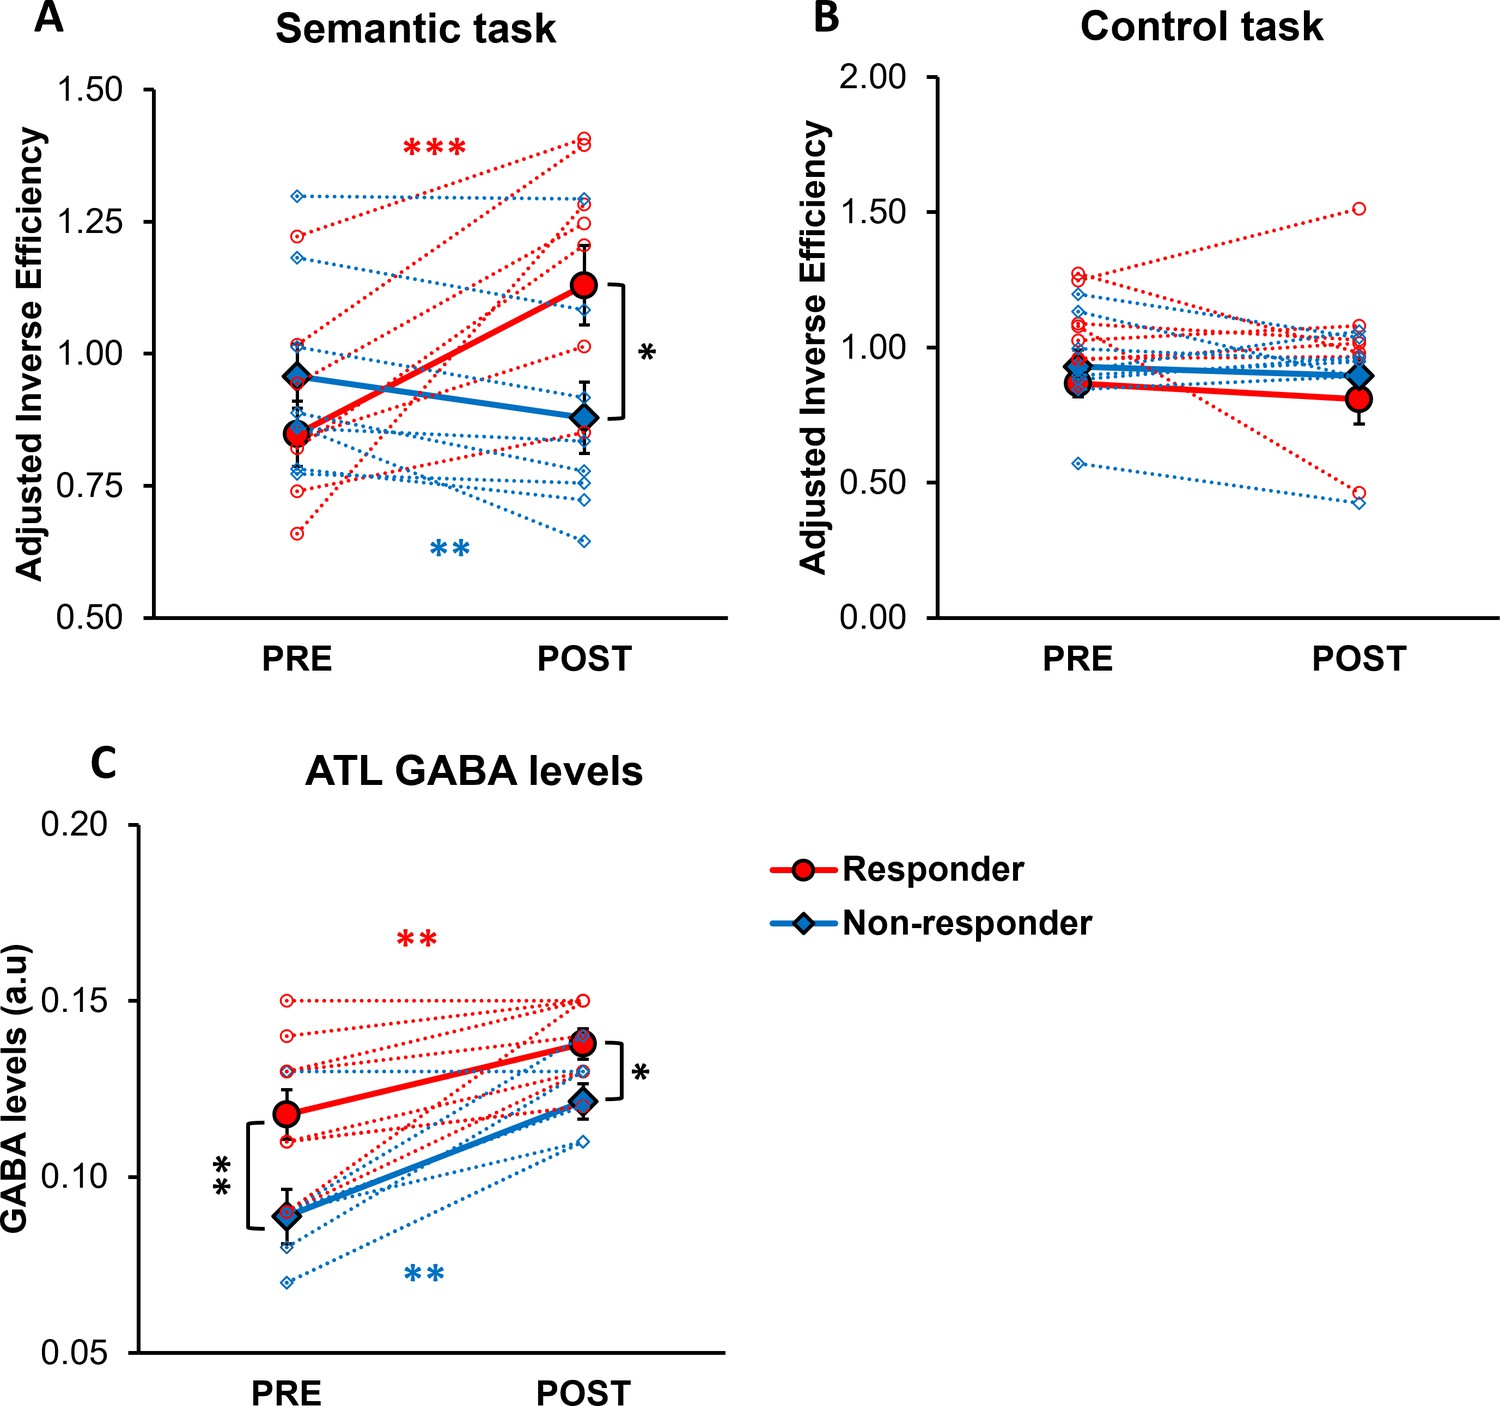
The effects of cTBS on behaviour and individual variability in responsiveness to cTBS.
(A) Semantic task performance (IE) in pre- and post-ATL stimulation session. (B) Control task performance (IE) in pre- and post-ATL stimulation session. To account for the practice effect, task performance was adjusted by dividing ATL stimulation performance by vertex stimulation performance. (C) ATL GABA levels in pre- and post-ATL stimulation session. The red circle represents the responder, while the blue diamond denotes the non-responder. Each individual is represented as a circle. Error bars indicate standard errors. * p<0.05, ** p<0.01, *** p<0.001.
Figure 4 with 2 supplements
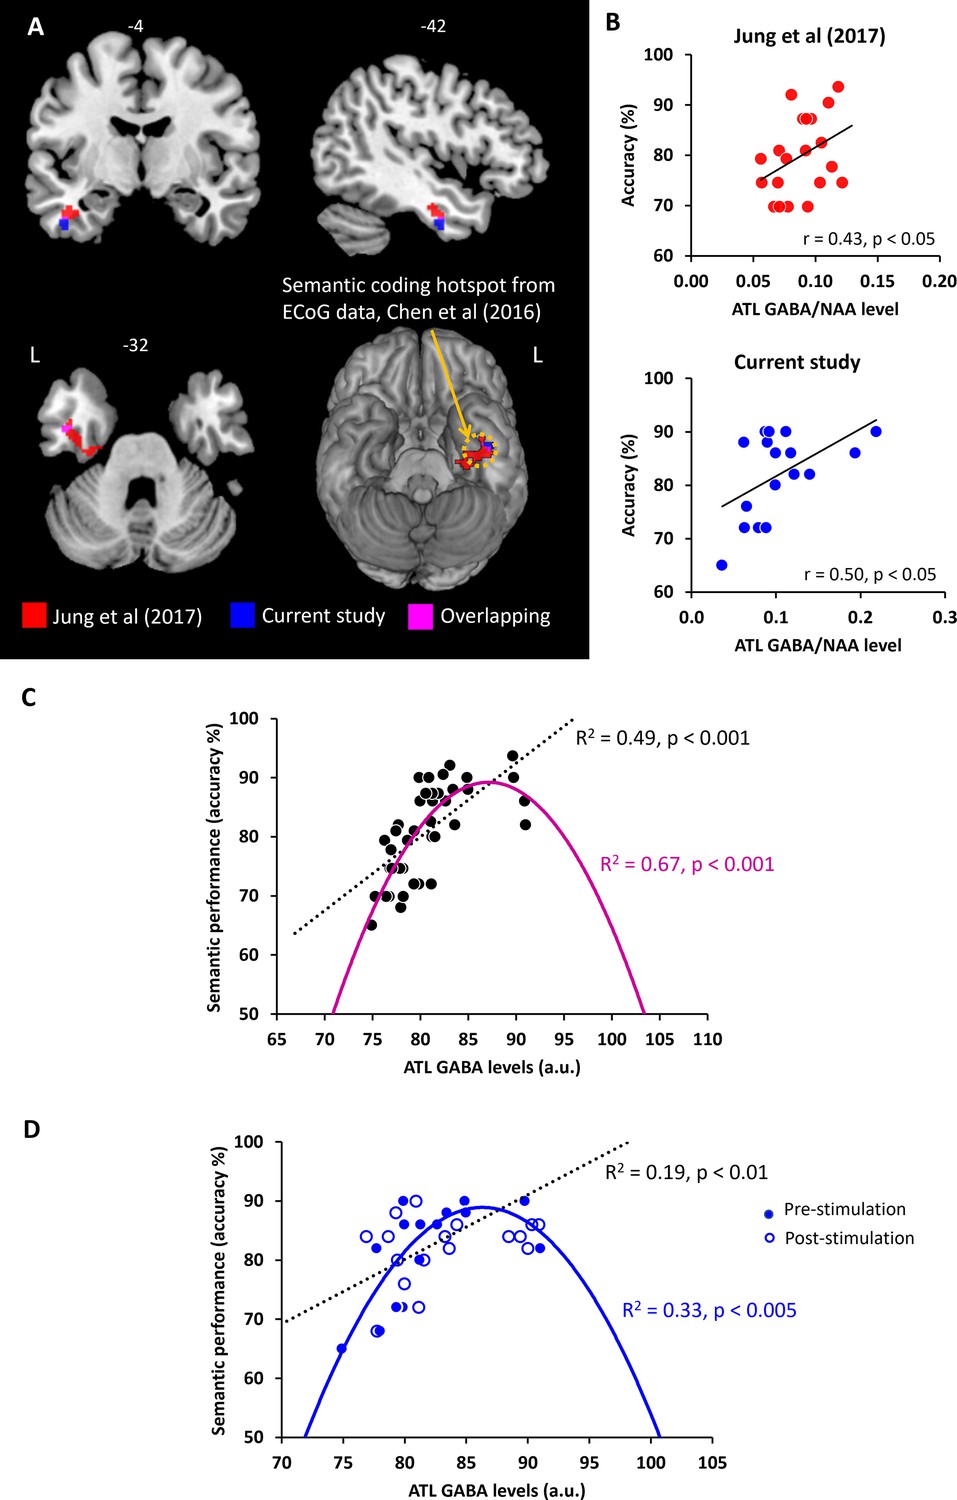
The relationship between ATL GABA levels and semantic memory.
(A) Local maxima of the voxel-wise regression analysis of the contrast (semantic >control) with GABA concentrations in the ATL. (B) The relationship between individual GABA levels in the ATL and semantic task performance from our previous study (Jung et al., 2017) and current study (pre-stimulation session). (C) The ATL GABA function in relation to semantic performance. (D) The relationship between cTBS-induced changes in ATL GABA levels and semantic task performance. Dotted line represents the linear function between ATL GABA levels and semantic task performance. Coloured line represents the inverted U-shaped (quadratic) function between ATL GABA levels and semantic task performance.
Figure 4—figure supplement 1

The relationship between the ATL GABA levels and semantic task performance in the vertex stimulation.
Figure 4—figure supplement 2

The relationship between the ATL GABA levels and semantic task performance (RT).
Figure 5
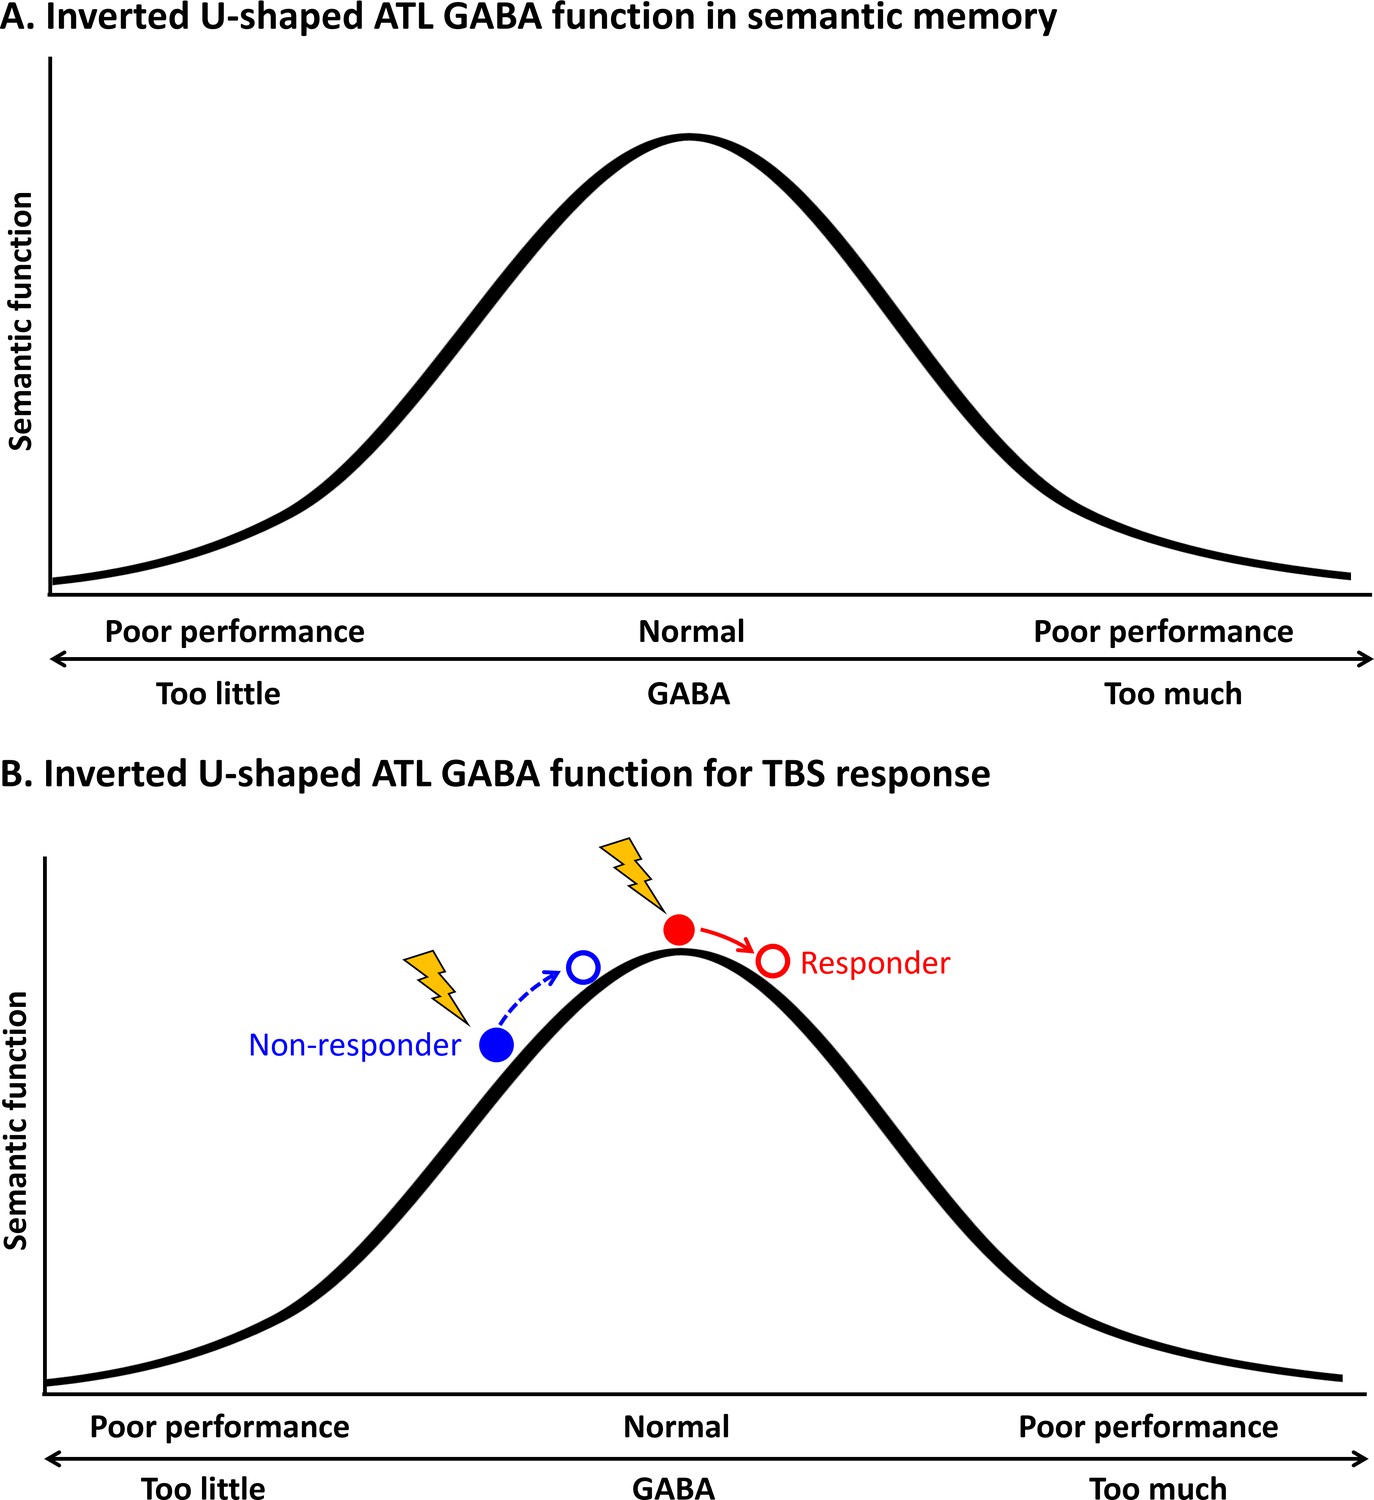
Schematic diagram of the relationship between the concentration of GABA in the ATL and semantic function.
(A) Inverted U-shaped ATL GABA function in semantic memory (B) Inverted U-shaped ATL GABA function for cTBS response on semantic memory.
Tables
Key resources table
| Reagent type (species) or resource | Designation | Source or reference | Identifiers | Additional information |
|---|---|---|---|---|
| Software, algorithm | SimNIBS 3.2 | SimNIBS | n/a | |
| Software, algorithm | SPM8 | Statistical Parametric Mapping | RRID:SCR_007037 | |
| Software, algorithm | jMRUI5.1 | jMRUI | RRID:SCR_021893 | |
| Software, algorithm | MATLAB | MathWorks | RRID:SCR_001622 | |
| Software, algorithm | SPSS, Version 25 | IBM | RRID:SCR_002865 | |
| Software, algorithm | RStudio | RStudio | RRID:SCR_000432 | |
| Other | Magstim Super Rapid stimulator | MagStim | n/a | Transcranial Magnetic stimulation |
| Other | 3T Philips Achieva MRI | Philips | n/a | Magnetic Resonance Imaging Scanner |
Author response table 1
| Model | ATL GABA and semantic performance | cTBS-induced changes in ATL GABA and semantic performance | ||
|---|---|---|---|---|
| R^(2) | BIC | R^(2) | BIC | |
| Logarithmic curve | 0.54 | 245 | 0.20 | 229 |
| Quadratic curve (inverted U shaped) | 0.67 | 233 | 0.33 | 227 |
| Model comparison (F-test) | F=14.01,p=0.00067 | F=6.24,p=0.018 |
Additional files
-
Supplementary file 1
Supplementary methods and tables.
- https://cdn.elifesciences.org/articles/91771/elife-91771-supp1-v1.docx
-
MDAR checklist
- https://cdn.elifesciences.org/articles/91771/elife-91771-mdarchecklist1-v1.docx
Download links
A two-part list of links to download the article, or parts of the article, in various formats.
Downloads (link to download the article as PDF)
Open citations (links to open the citations from this article in various online reference manager services)
Cite this article (links to download the citations from this article in formats compatible with various reference manager tools)
The role of GABA in semantic memory and its neuroplasticity
eLife 12:RP91771.
https://doi.org/10.7554/eLife.91771.4


