Toolkits for detailed and high-throughput interrogation of synapses in C. elegans
- Department of Biological Sciences, Howard Hughes Medical Institute, Columbia University, United States
- School of Electrical and Computer Engineering, Georgia Institute of Technology, United States
- The Parker H Petit Institute of Bioengineering and Bioscience, Georgia Institute of Technology, United States
- School of Chemical and Biomolecular Engineering, Georgia Institute of Technology, United States
Figures
Figure 1

An expanded toolkit of synaptic reporters to study C. elegans synapses.
(A) A schematic of reporters used to visualize C. elegans synapses. Chemical synapses were visualized using fluorophore-tagged CLA-1 or RAB-3 proteins to label presynaptic specializations, or synapse-specific reporters using transsynaptic tools such as NLG-1-based GRASP. Electrical synapses were visualized by directly tagging constituent innexin proteins with a fluorophore. (B) A schematic showing all neuron classes in the adult C. elegans hermaphrodite. Neurons for which new reporters are described in this paper are colored in orange. Neurons for which reporters have been previously published but are quantified with WormPsyQi in this paper are colored in green.
Figure 2 with 4 supplements

WormPsyQi robustly segments neurites and quantifies synapses.
(A) A flowchart of the WormPsyQi pipeline. The pipeline is automated except for the correction process, which can be skipped if the initial segmentation result is deemed good enough. (B) Representative input raw and output segmentation images for the interneuron pair AIB. AIB-specific presynaptic specializations and processes were visualized using GFP-tagged CLA-1 (otIs886) and a cytoplasmic marker (otEx8023). Predicted puncta in the lower panel are colored arbitrarily to represent discrete fluorescent signal. Cell bodies are removed from the mask to exclude any soma-localized puncta in downstream steps. Images are maximum intensity projections of confocal Z-stacks. (C, D) Synapse segmentation accuracy is assessed with intersection over union (IoU) score between the ground-truth and predicted labels. Calculations were performed on six images of the I5p::GFP::CLA-1 reporter (otEx7503). The images were labeled by four different experts. (C) The IoU score over the size of the training set shows that having one labeled image as a training set is enough to reliably predict synapses for the remaining images in a dataset. In bars 1–3 (from left to right), one image was selected as the training set and then the given number of patches in the column label were randomly sampled after the regular patch sampling step of training (see Methods) to further reduce the size of the training set. In bars 4–6, the number of images in the column label was selected as the training set. For each expert’s labels, all possible combinations of the training set were tested and the IoU score for the hold-out test set is shown. (D) The average IoU score between different experts’ labels is taken as a benchmark (bar 1, leftmost). The IoU scores of WormPsyQi prediction are significantly greater than the benchmark IoU when the same expert’s labels used in the training step were taken as the ground-truth to compare with, both when one and five images were used for training. If another expert’s labels were taken as ground-truth, then the IoU score of WormPsyQi prediction was lower but still demonstrated significant improvement compared to the benchmark IoU. p values were calculated using one-way analysis of variance (ANOVA) with Bonferroni correction for multiple comparisons ***p ≤ 0.001, **p ≤ 0.01, *p ≤ 0.05, and p > 0.05 not significant (ns).
Figure 2—figure supplement 1
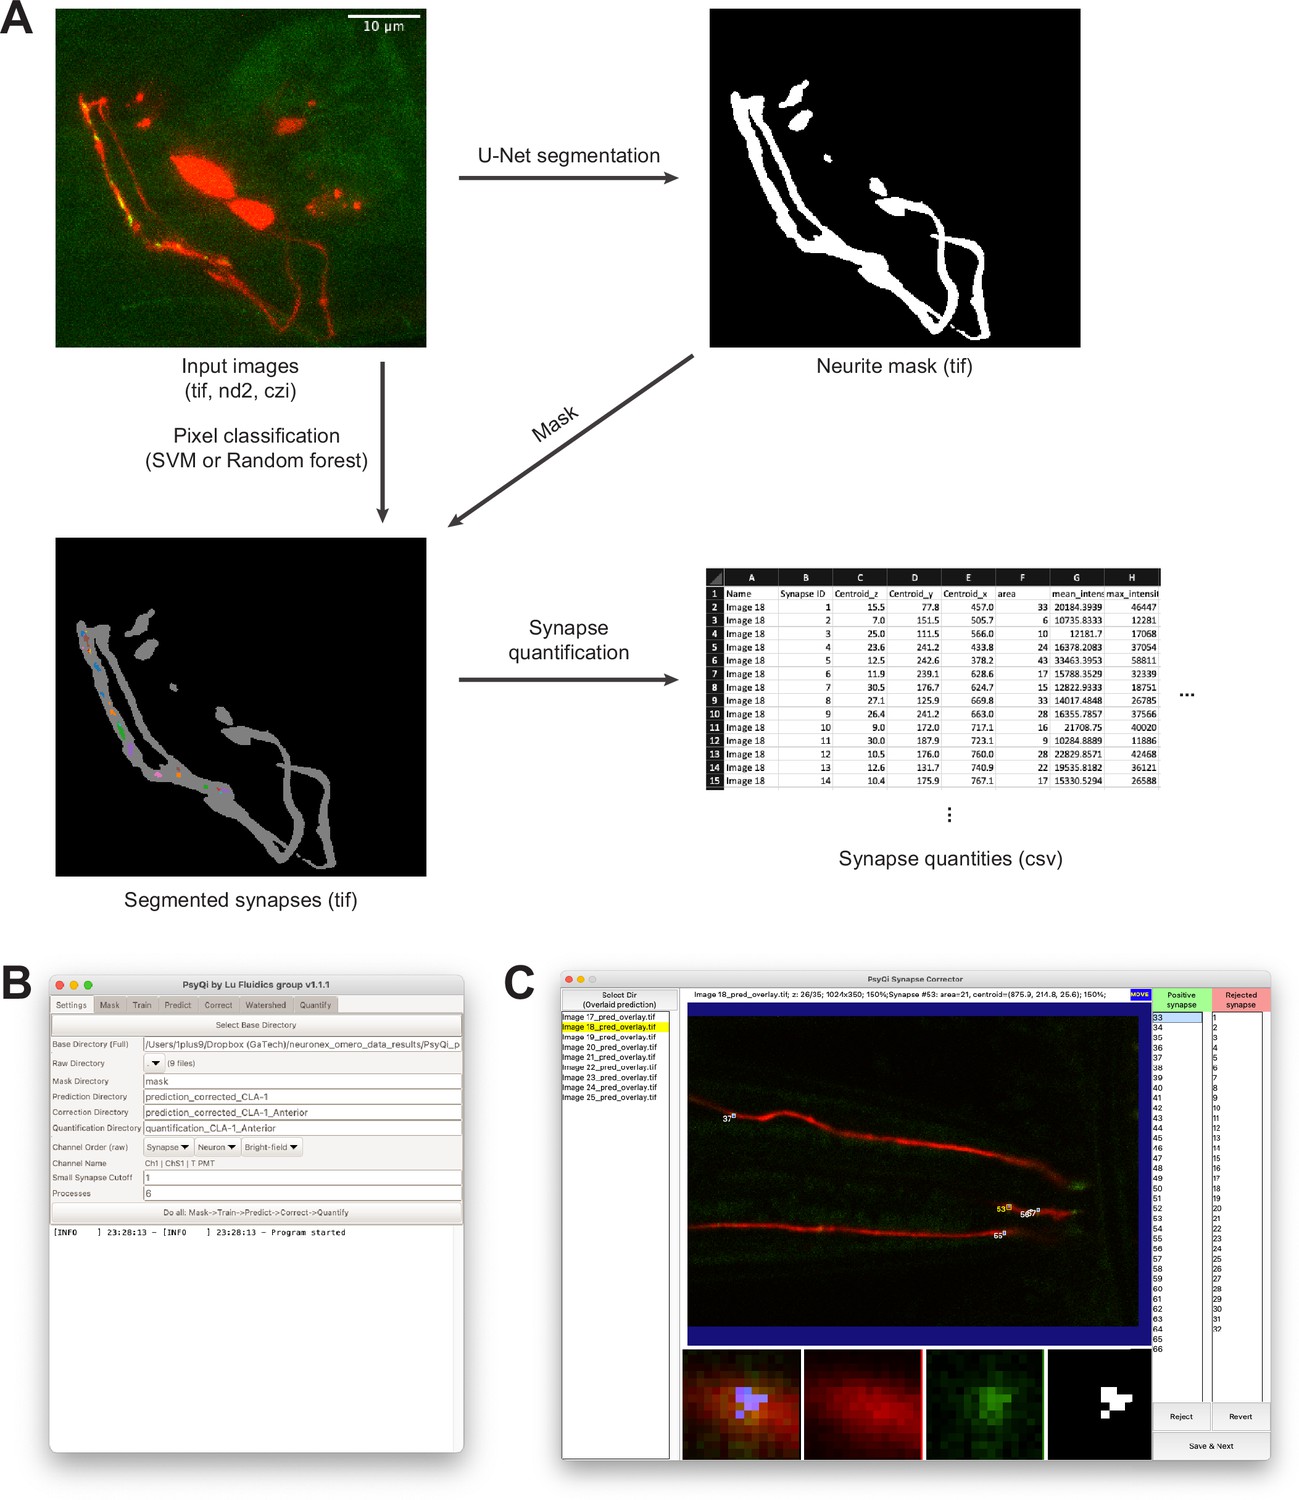
Visual demonstration of WormPsyQi workflow and interface.
(A) Input images are typically three-dimensional (3D) multicolor stacks. Neurite segmentation process generates a 3D binary image labeling regions where synapses could be localized. The synapse segmentation process takes the input image and the neurite mask, and generates a binary image labeling synapses. The example image is showing the connected components from the binary synapse label colored differently and overlaid with the neurite label in gray for visualization. The synapse quantification process extracts various synapse- and image-level quantities and saves them in a .csv file. (B) WormPsyQi’s main graphical user interface (GUI). WormPsyQi provides a GUI to easily manage the processing parameters and the output data storage. (C) WormPsyQi GUI for reviewing and correcting synapse segmentation. Users can quickly scroll through the slices to visually inspect the quality of synapse segmentation. False-positive synapses can be rejected individually, or an ROI can be selected to reject synapses inside/outside of the ROI.
Figure 2—figure supplement 2
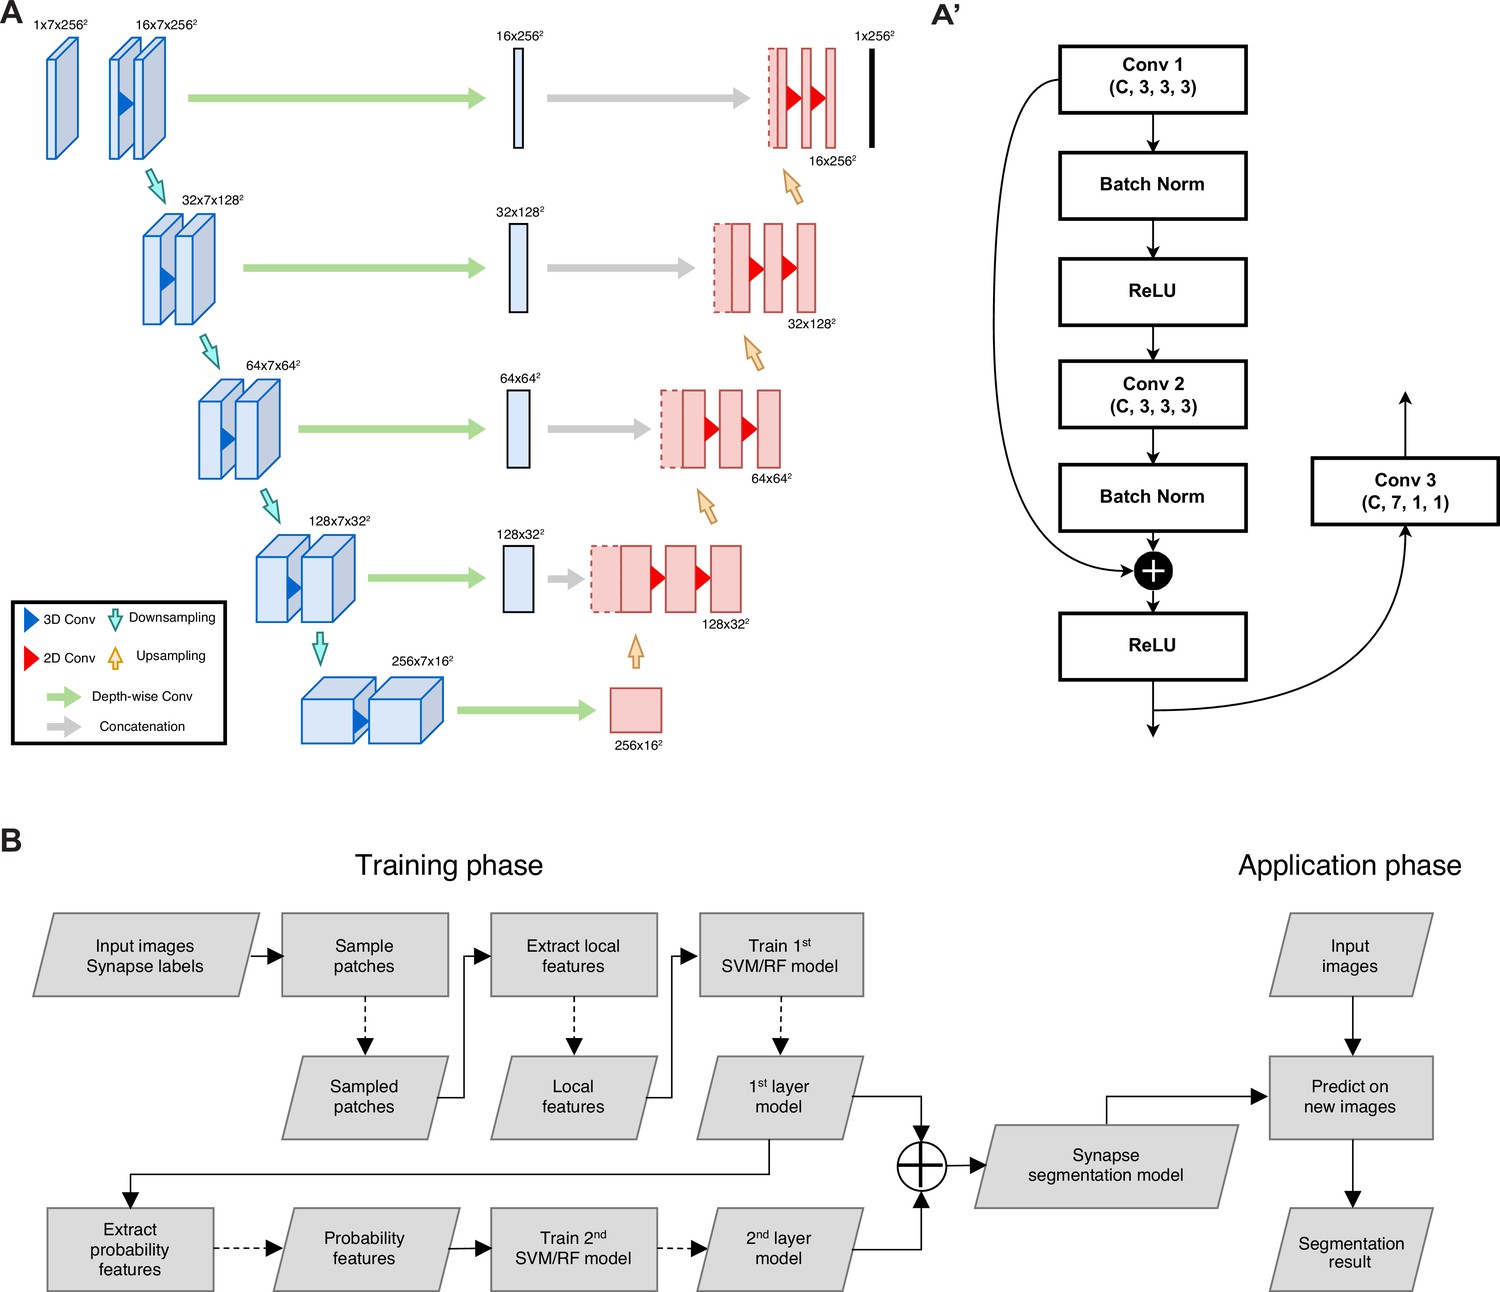
Architecture overview of neurite segmentation and synapse segmentation models.
(A) The input is a chunk with seven slices and the output is the segmentation mask of the center slice, with intermediate convolution blocks that combine depth-wise spatial context in the concatenation path. The structure of the encoding block is detailed in panel A’. (B) Flowchart for synapse segmentation. Rectangles represent a process or action, and parallelograms represent an input, output, or intermediate data.
Figure 2—figure supplement 3
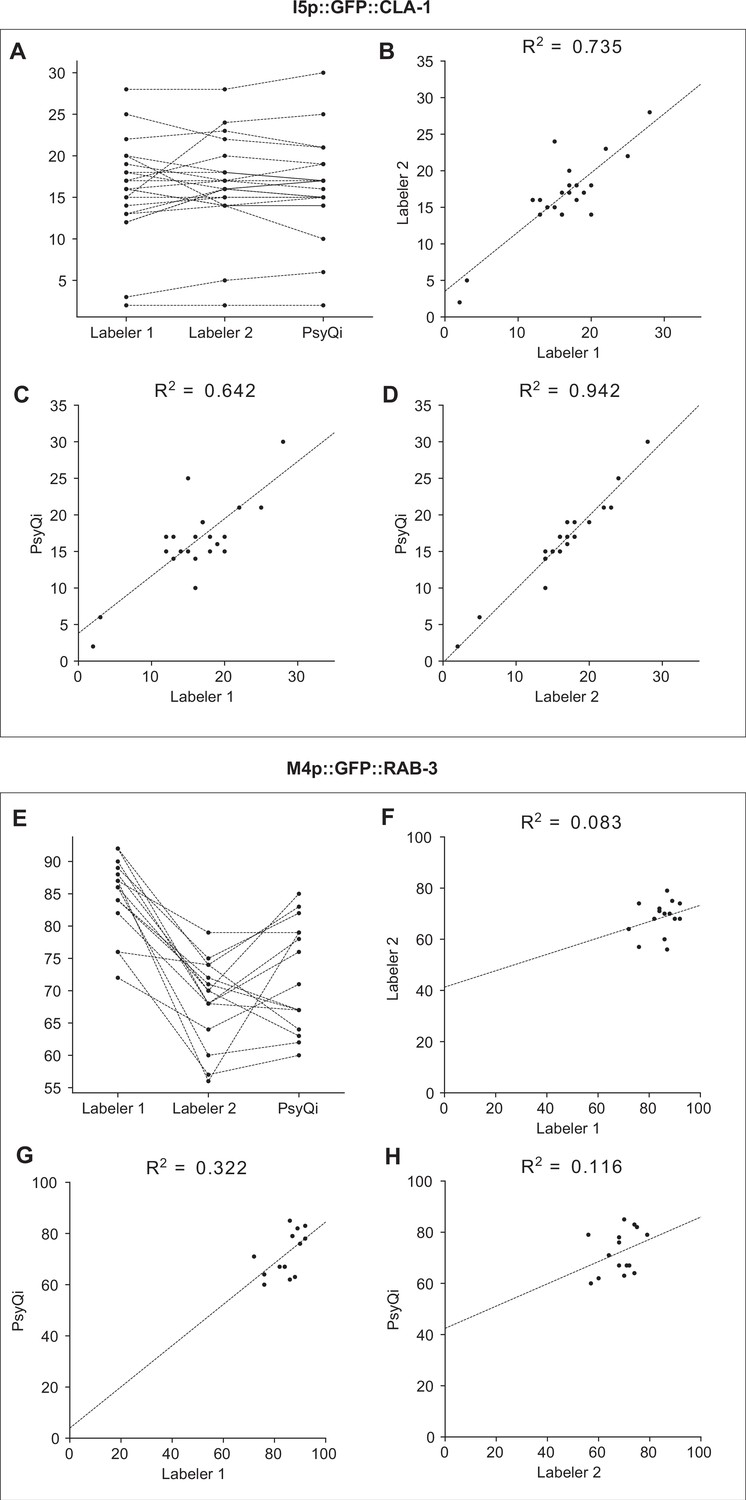
The correlation between WormPsyQi and manual count is comparable to the human-to-human correlation.
Graphs depict the synapse count of individual worms for I5p::GFP::CLA-1 strain (otEx7403) (A–D) and M4p::GFP::RAB-3 strain (otIs597) (E–H). WormPsyQi’s puncta count display a stronger or comparable correlation with manual counts than that seen between manual counts of two labelers, for both the good quality strain I5p::GFP::CLA-1 and the poor quality strain M4p::GFP::RAB-3. Each dot in the graphs represents an individual worm. (A, E) Changes in synapse count between two human labelers and WormPsyQi. Each dotted line is connecting counts from the same individual worm. (B–D, F–H) Pairwise synapse count comparison between (B, F) labelers 1 and 2, (C, G) labeler 1 and WormPsyQi, and (D, H) labeler 2 and WormPsyQi. The dotted line represents the linear regression, and the Pearson correlation coefficient is displayed at the top of each graph.
Figure 2—figure supplement 4
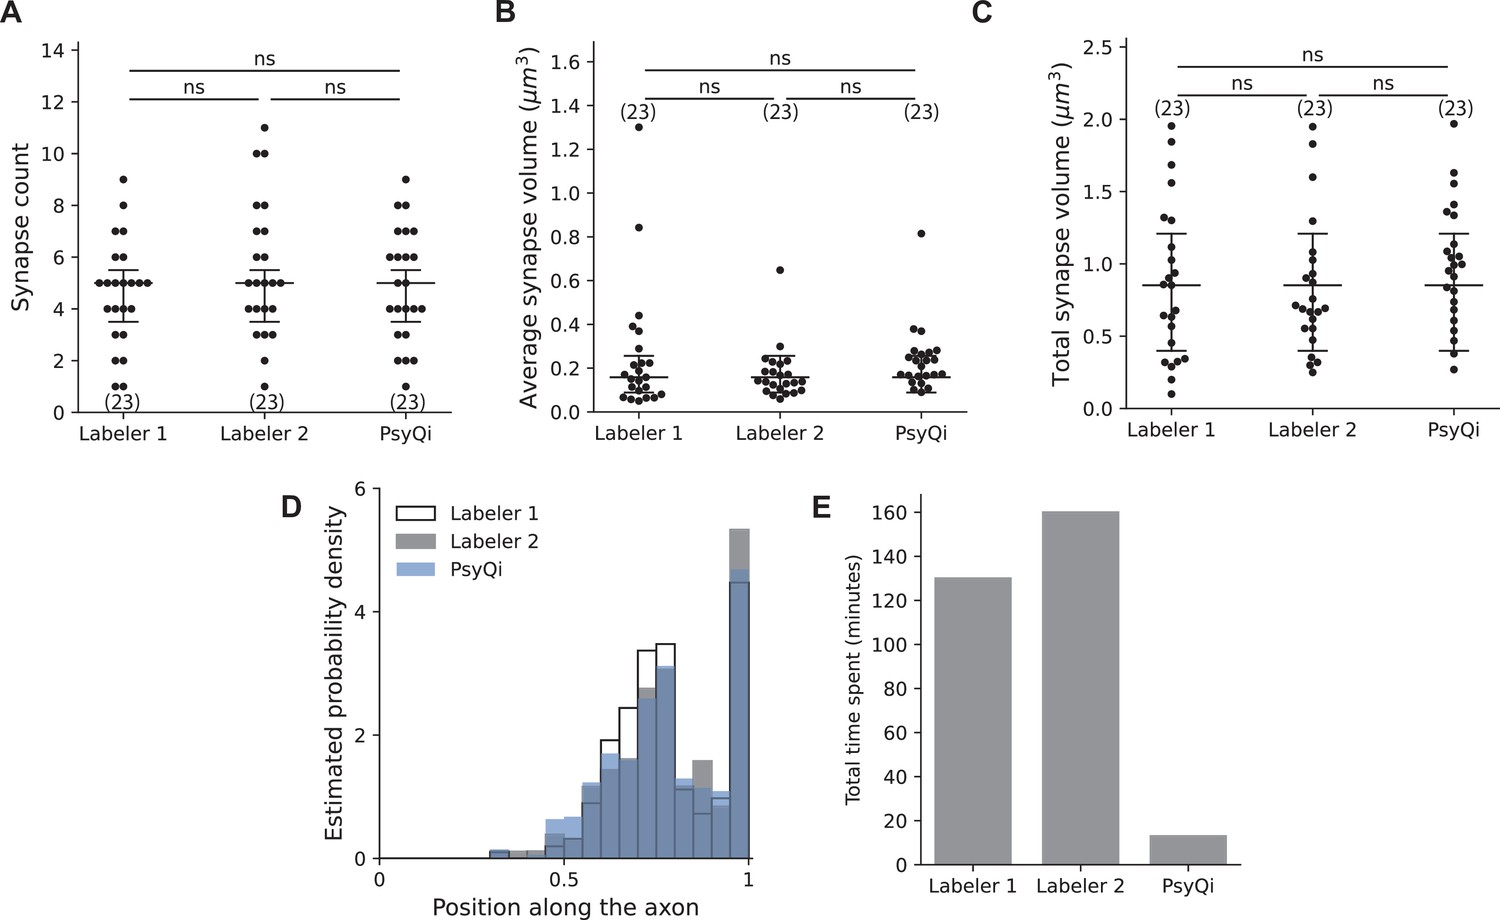
Comparison between WormPsyQi and human quantification for puncta features and processing time.
For proof-of-principle, all quantification is based on an ASKp:::GFP::CLA-1 reporter (otIs789). No statistically significant difference was observed in human vs. WormPsyQi scoring of total puncta (synapse) count (A), average synapse volume (B), and total synapse volume (C). (D) WormPsyQi’s segmentation results show a spatial distribution of synapses along the axon similar to the annotations of two individual human labelers. (E) WormPsyQi achieves over a 10-fold reduction in processing time: while labelers 1 and 2 took 130 and 160 min to annotate puncta, respectively, WormPsyQi processed the same dataset (15 images) in 13 min using an affordable desktop machine. Each dot on the graphs represents an individual worm. Statistical significance was calculated using one-way analysis of variance (ANOVA) with Bonferroni correction, ‘ns’ denotes not significant.
Figure 3
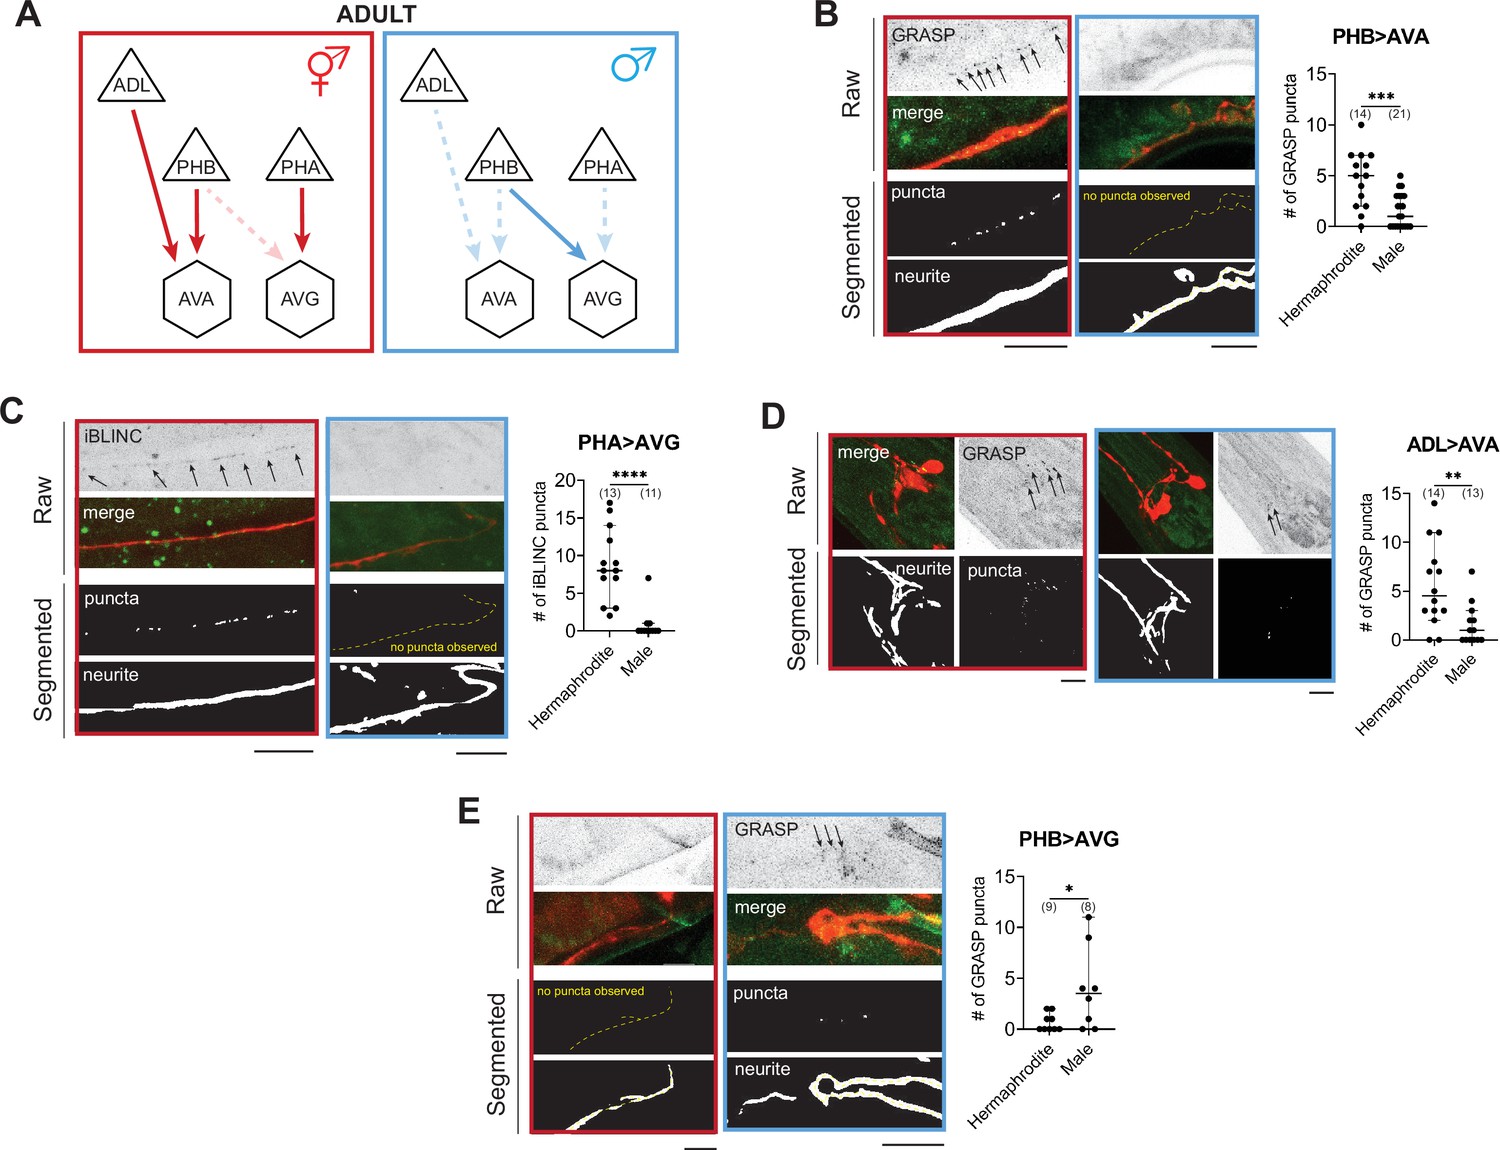
WormPsyQi validates sexually dimorphic synapses in C. elegans.
(A) Subsets of hermaphrodite (red) and male (blue) connectivity diagrams, based on electron microscopy (EM) studies (Cook et al., 2019; White et al., 1986), showing adult stage sexually dimorphic synapses analyzed for validating WormPsyQi. Synapses, depicted by arrows, were visualized using GRASP or iBLINC reporters generated either for previous studies (PHA>AVG, ADL>AVA, and PHB>AVG in Cook et al., 2019; Bayer and Hobert, 2018; Oren-Suissa et al., 2016) or this paper (PHB>AVA). Sensory, inter-, and motor neurons are depicted as triangles, hexagons, and circles, respectively. (B-E) WormPsyQi validates sex-specific synapses in adult hermaphrodites and males. PHB>AVA, PHA>AVG, ADL>AVA, and PHB>AVG synapses were visualized using the transgenes otIs839, otIs630, otEx6829, and otIs614, respectively. Panels corresponding to each reporter show raw confocal images (top) and segmented neurites and synapses (bottom). Segmentation and quantification were performed using WormPsyQi. Synchronized day-1 adult animals were scored. Red – hermaphrodite, blue – male. p values were calculated using an unpaired t-test. ****p ≤ 0.0001, ***p ≤ 0.001, **p ≤ 0.01, and *p ≤ 0.05. In each dataset, a dot represents a single worm and lines represent median with 95% confidence interval. All raw and segmented images are maximum intensity projections of confocal Z-stacks. Scale bars = 10 μm.
Figure 4 with 1 supplement

WormPsyQi is generalizable across diverse synaptic reporters targeting the synapses in the central nervous system.
(A) Representative images of cell-specific synaptic reporters showing presynaptic specializations, as visualized with GFP-tagged CLA-1, for neuron classes ASK (otIs789), AFD (otEx7786), IL1 (otEx7363), IL2 (otIs815), RIB (otIs810), HSN (otIs788), AIB (otEx8023; otIs886), and PHB (otIs883). (B) Representative images of cell-specific synaptic reporters showing presynaptic specializations, as visualized with fluorescently tagged RAB-3, for neuron classes PHA (otIs702) and ASK (otEx7231). In each panel, top (raw) and bottom (segmented) images represent both neuronal processes, based on a cytoplasmic marker, and synaptic puncta. There was no cytoplasmic marker in the PHB reporter used, so only puncta are shown. All images are maximum intensity projections of confocal Z-stacks. Quantification of the number of puncta, performed using WormPsyQi, is shown in corresponding graphs. In each graph, a dot represents a single worm and lines represent median with 95% confidence interval. L4 animals were scored unless otherwise noted. Scale bars = 10 μm.
Figure 4—figure supplement 1
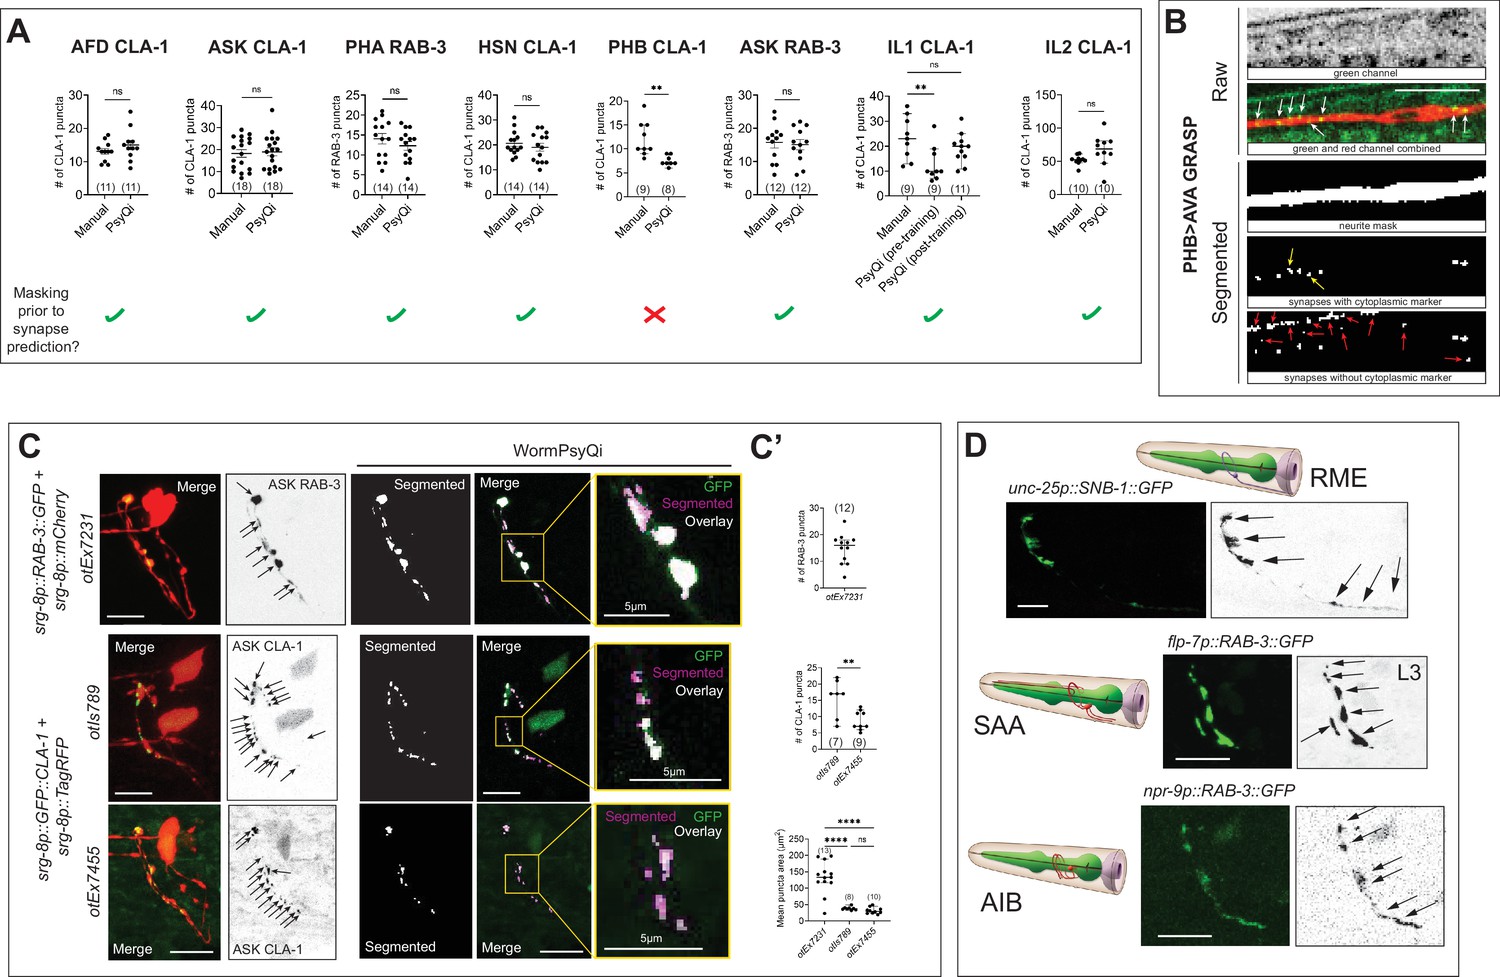
WormPsyQi performs optimally on images with a cytoplasmic marker and discrete puncta.
(A) Manual vs. WormPsyQi quantification for representative GFP::CLA-1 (for neurons AFD, ASK, HSN, PHB, IL1, and IL2) and GFP::RAB-3 (for neurons PHA and ASK) reporters. No significant difference was observed in all cases besides PHB, where the masking step was skipped. The bottom row denotes whether a neurite mask was used prior to synapse segmentation in the pipeline. (B) Representative images of PHB>AVA GRASP synapse segmentation with and without the channel having cytoplasmic marker. The panels illustrate raw confocal images (top) and segmented neurite and synapses (bottom). The third panel displays WormPsyQi’s mask segmentation, the fourth panel shows synapse segmentation using the original image, and the last panel shows synapse segmentation using only the green channel (no-mask). The cytoplasmic marker not only helps exclude false-positive gut autofluorescence puncta (red arrows), but also assists in identifying some GRASP puncta that were missed in the no-mask segmentation (yellow arrows). All real GRASP puncta are pointed with white arrows. (C) Representative raw and segmented images and quantification of RAB-3 (otEx7231) CLA-1 reporters (otIs789 and otEx7455) for ASK neurons. ASK presynaptic specializations were diffuse compared to both CLA-1 reporters (magnified insets), as denoted by mean puncta area, although relative number of puncta at L4 stage were similar (C’). p values were calculated using an unpaired t-test or one-way analysis of variance (ANOVA) with Bonferroni correction. ****p ≤ 0.0001, **p ≤ 0.01, and p > 0.05 not significant (ns). In each dataset in (A) and (C), a dot represents a single worm and lines represent median with 95% confidence interval. (D) Images of a representative subset of reporters for neurons RME, SAA, and AIB, for which WormPsyQi could not segment and quantify puncta because of diffuse signal and high synapse density. Specializations were visualized using fluorescently tagged presynaptic SNB-1 and RAB-3. All images are maximum intensity projections of confocal Z-stacks. Scale bars = 10 μm unless otherwise noted.
Figure 5
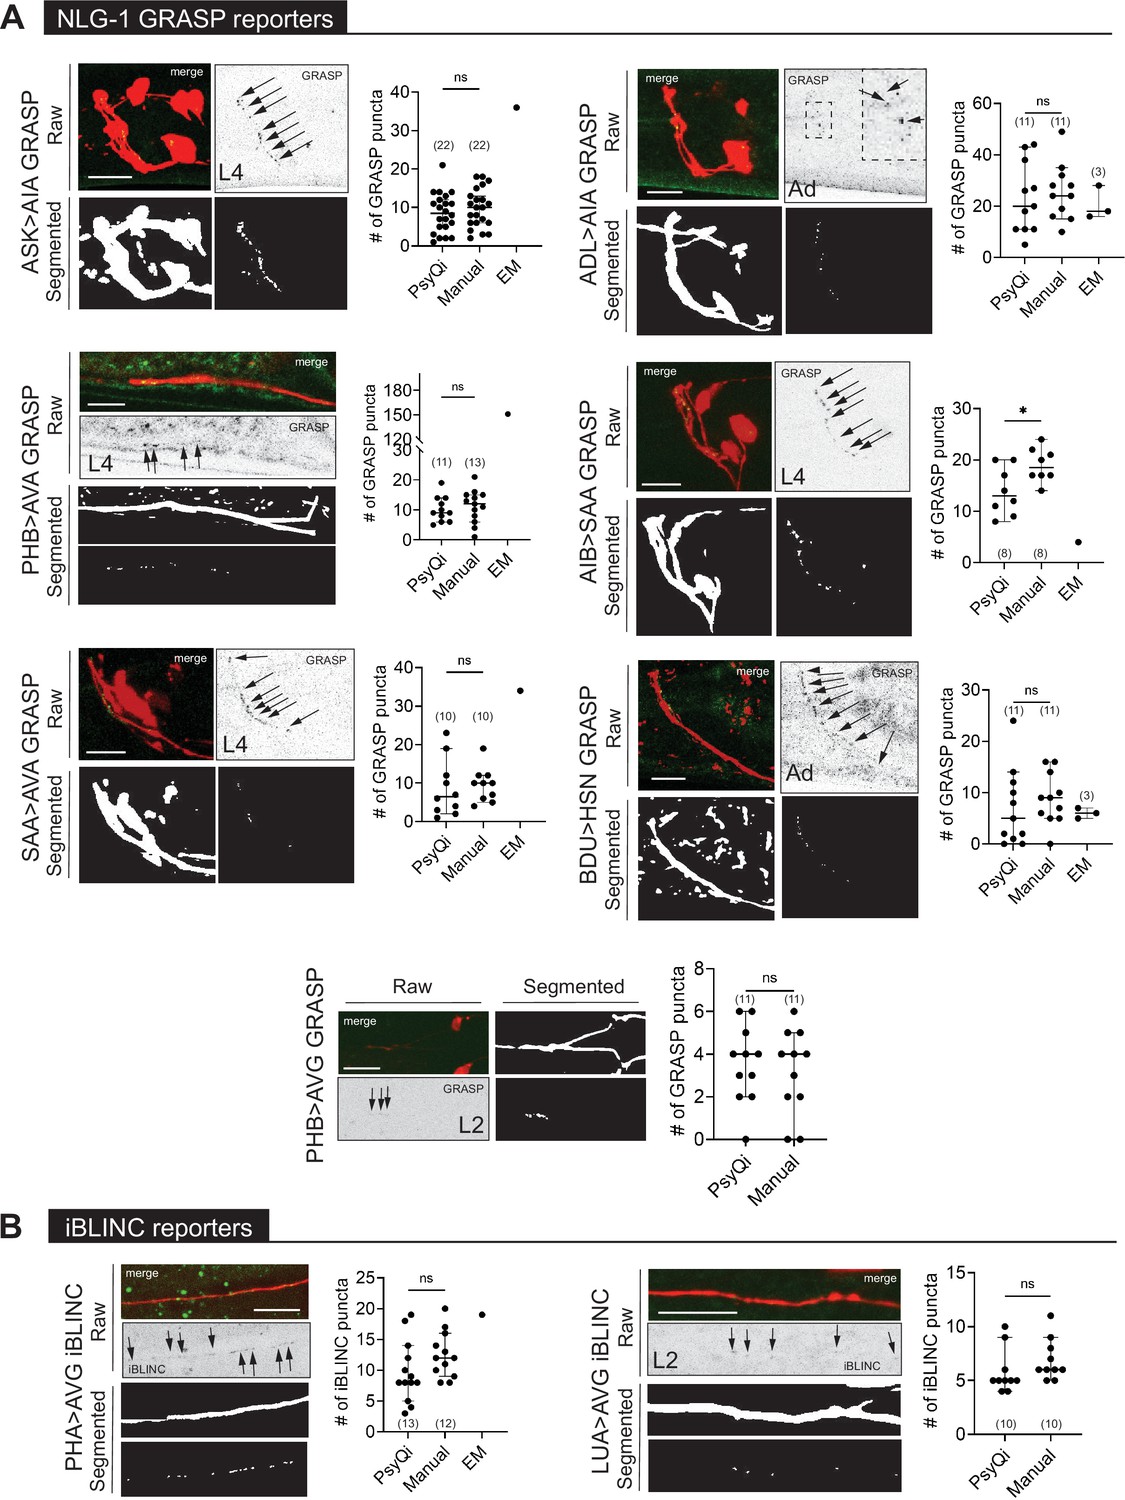
WormPsyQi can quantify synapses in variable GRASP and iBLINC reporters.
(A) Representative images of NLG-1 GRASP-based synaptic reporters labeling the following synapses: ASK>AIA (otIs653), ADL >AIA (otEx7457), PHB >AVA (otIs839), AIB-SAA (otEx7809), SAA-AVA (otEx7811), BDU>HSN (otEx7759), and PHB>AVG (otIs614). (B) Representative images of iBLINC-based synaptic reporters labeling PHA>AVG (otIs630) and LUA>AVG (otEx6344) synapses. WormPsyQi vs. manual quantification is shown in corresponding plots; electron microscopy (EM) data are shown where available (Witvliet et al., 2021; Cook et al., 2019; White et al., 1986), but was excluded from statistical analyses due to small sample sizes (n = 1–3). In each dataset, a dot represents a single worm and lines represent median with 95% confidence interval. All raw and segmented images are maximum intensity projections of confocal Z-stacks. p values were calculated using an unpaired t-test. *p ≤ 0.05 and p > 0.05not significant (ns). Scale bars = 10 μm.
Figure 6 with 1 supplement
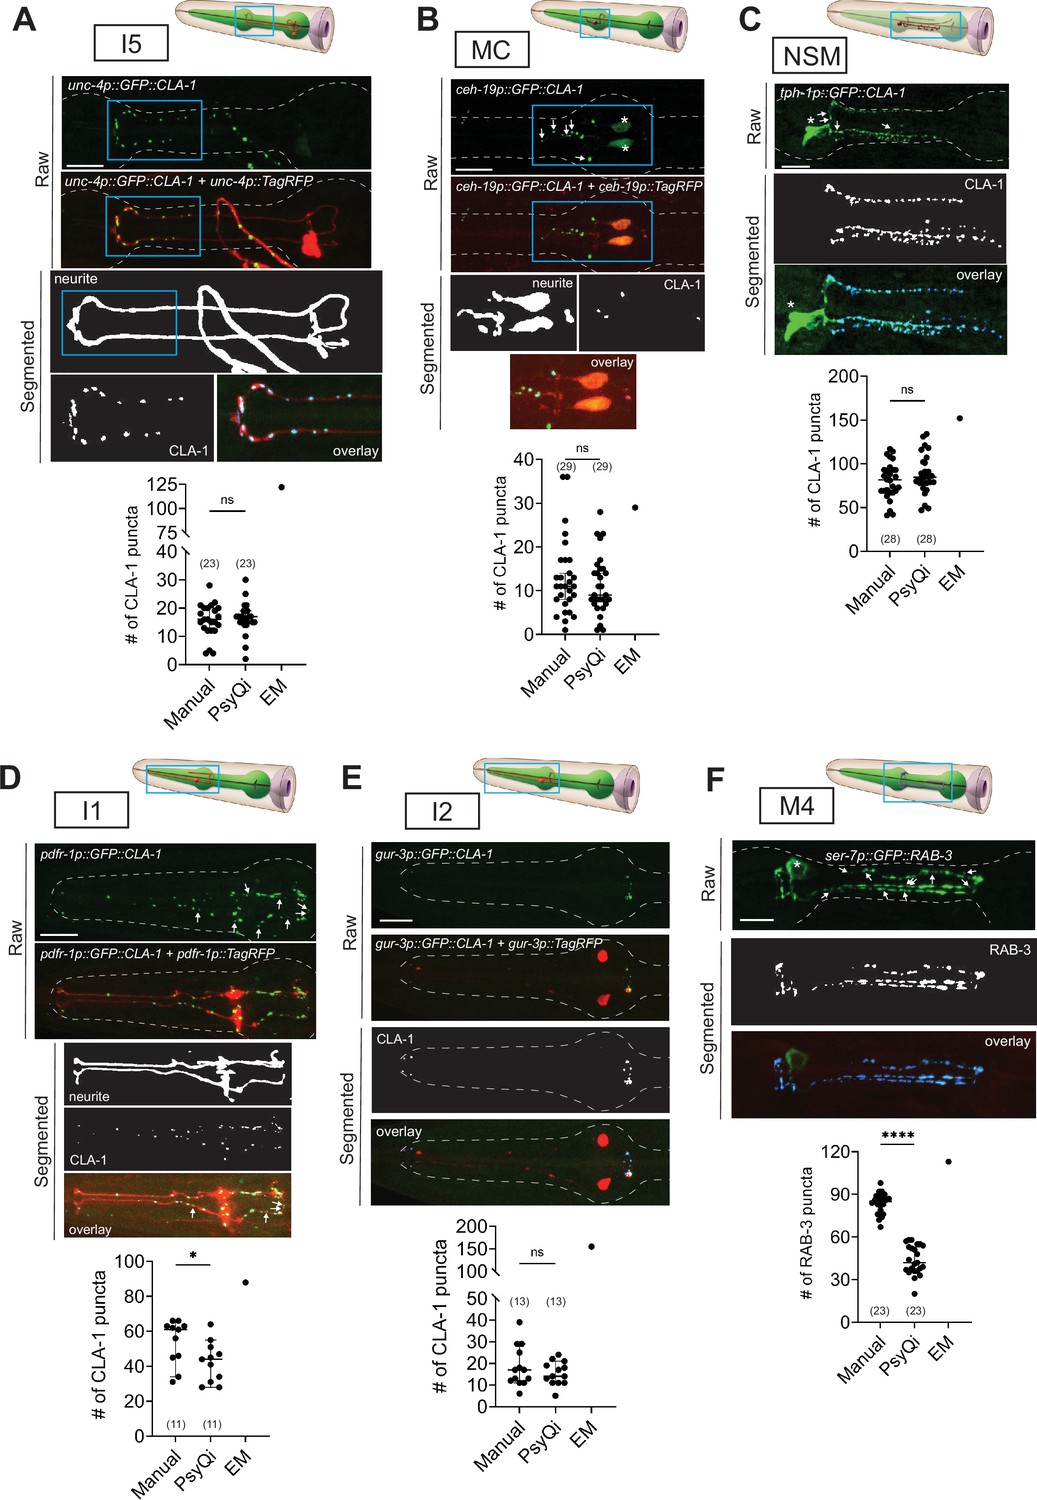
Systematic analysis of pharyngeal synapses using WormPsyQi.
CLA-1- or RAB-3-based presynaptic specializations of pharyngeal neurons: (A) I5, (B) MC, (C) NSM, (D) I1, (E) I2, and (F) M4 analyzed using transgenes otEx7503, otEx7505, otEx7499, otEx7501, and otIs597, respectively. For each reporter, a corresponding graph shows manual vs. WormPsyQi quantification, along with electron microscopy (EM) synapse counts as described in Cook et al., 2020. Day-1 adults were scored, with some datasets previously published (Cook et al., 2020) and re-analyzed here. Masking was used prior to synapse prediction for all neurons except I2, where the cytoplasmic reporter was too dim for creating a continuous mask. Puncta that were not segmented by WormPsyQi are marked with white arrows in the raw GFP image to help inform users what kind of images/reporters are best quantified using WormPsyQi. Cell bodies are marked with an asterisk. p values were calculated using an unpaired t-test. ****p ≤ 0.0001, *p ≤ 0.05, and p > 0.05 not significant (ns). EM data were excluded from statistical analyses based on limited sample size (n = 1). In each dataset, a dot represents a single worm and lines represent median with 95% confidence interval. All raw and segmented images are maximum intensity projections of confocal Z-stacks. Scale bars = 10 μm.
Figure 6—figure supplement 1
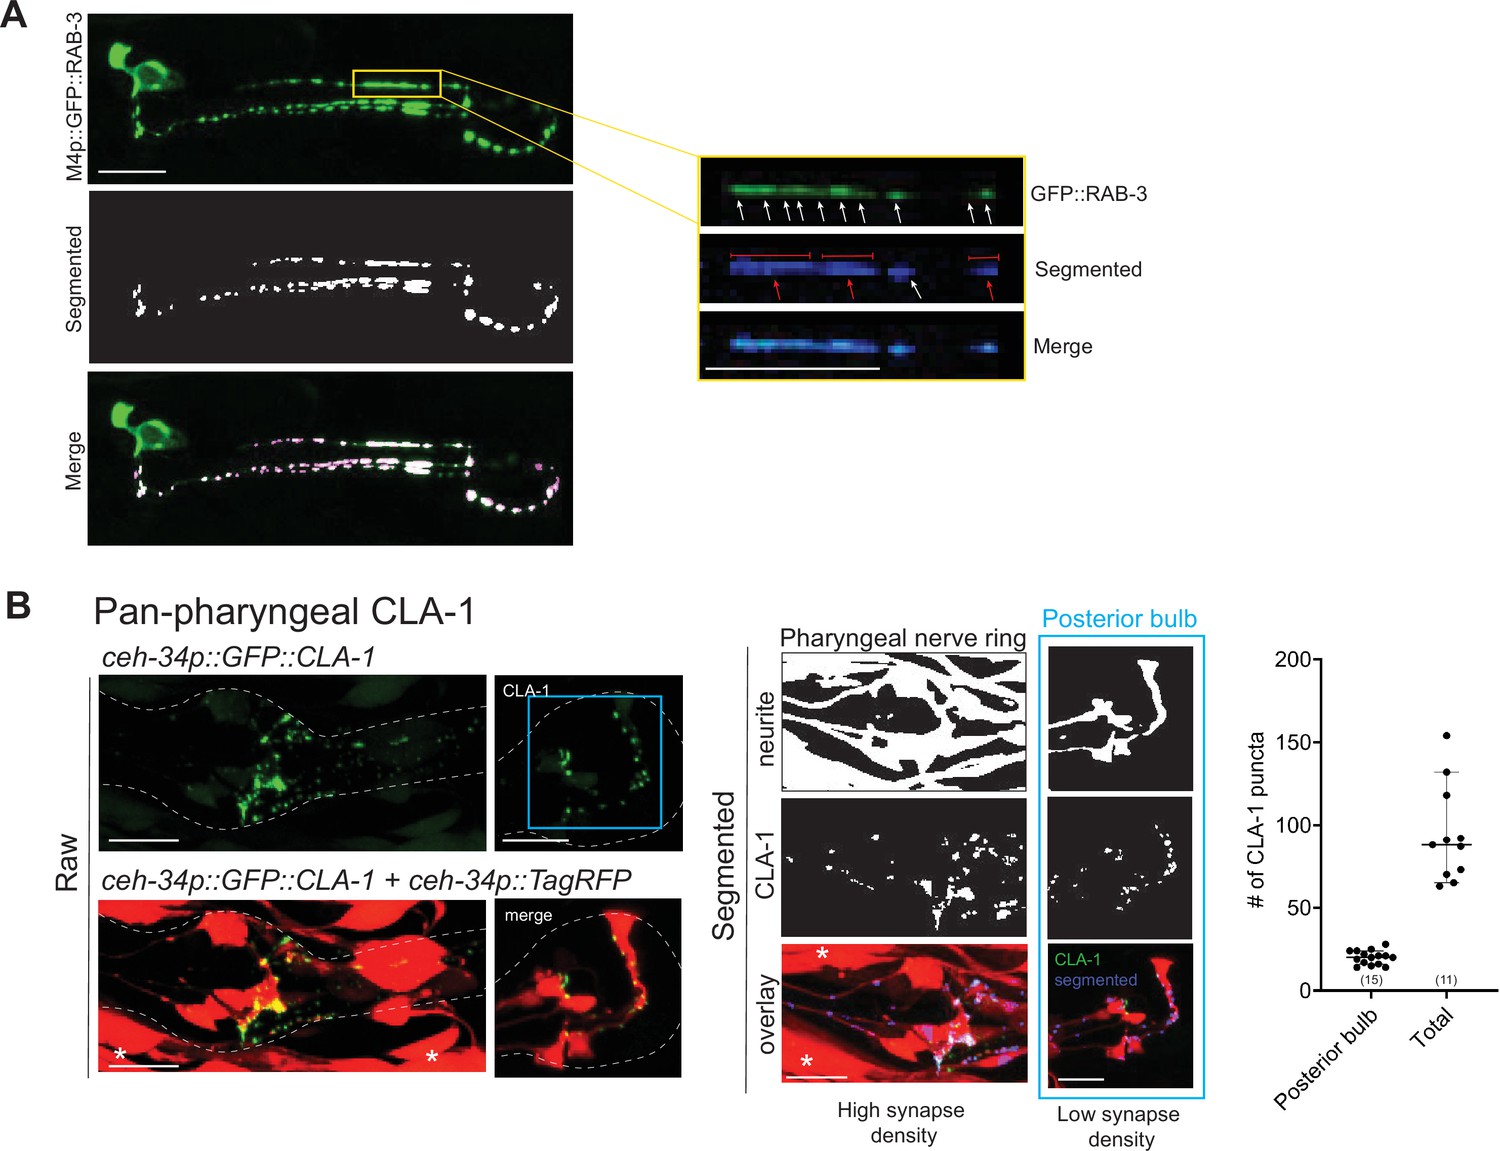
WormPsyQi analysis of all presynaptic specializations in the pharynx.
(A) Representative images of M4p::GFP::RAB-3 (otIs597) processed with WormPsyQi. Magnified insets show a synapse-dense region where multiple puncta (white arrows) are discernible in the raw GFP image, but WormPsyQi segments adjacent puncta together (red arrows), therefore undercounting as presented in the larger dataset for the same reporter in Figure 6F. (B) Representative images and quantification of a pan-pharyngeal synaptic reporter (otIs785). Neuronal processes were labeled with ceh-34p::TagRFP and presynaptic specializations were visualized with ceh-34p::GFP::CLA-1. Raw (top), segmented (middle), and overlap (bottom) images are shown. Quantification of puncta in the whole pharynx (‘Total’) and posterior pharyngeal bulb (blue) are shown in the graph. In each dataset, a dot represents a single worm and lines represent median. Compared to the posterior bulb the spread is greater for total count, where synapse segmentation was suboptimal due to a high synapse density and inseparable processes. All images are maximum intensity projections of confocal Z-stacks. Muscle expression from ceh-34p is marked with an asterisk. Scale bars = 10 μm.
Figure 7

An analysis of electrical synapses using WormPsyQi.
INX-6::GFP (ot805) puncta are observed in the pharynx and the nerve ring. Nerve ring gap junctions are compared between L4 and dauer animals to validate previous observations (Bhattacharya et al., 2019). Given that outside of the pharynx, inx-6 is exclusively expressed in AIB interneurons in dauers, the puncta can be assigned to AIB axons as shown previously (Bhattacharya et al., 2019); in the absence of a cytoplasmic marker, WormPsyQi scores a limited number of puncta in L4 animals, but the dauer count significantly exceeds L4 count, as expected. Red arrows denote AIB-localizing electrical synapses and yellow arrows denote electrical synapses in the pharyngeal muscles. All raw and processed images are maximum intensity projections of confocal Z-stacks. Statistical analysis was performed using an unpaired t-test. Nerve ring synapses are denoted by a yellow box; synapses outside the box are pharyngeal. In each dataset, a dot represents a single worm and the height of the bar represents median with 95% confidence interval. Images are maximum intensity projections of confocal Z-stacks. Scale bars = 10 μm.
Figure 8

Developmental synapse addition in the central nervous system (CNS) roughly scales with neurite length in strains analyzed.
(A) Representative quantification of the total nerve ring length of late-L1 and day-1 adult animals, as analyzed with an ASK-specific cytoplasmic transgene (srg-8p::tagRFP in reporter otIs789). Total ASK axon length in the nerve ring increases ~twofold between late-L1 and adulthood. Dashed lines mark axons in laterally positioned worms. (B) Representative images of an ASK-specific CLA-1 reporter (analyzed using the transgene otIs789) at late-L1 and day-1 adult stages. The graph shows the number of puncta representing ASK-specific presynaptic specializations quantified using WormPsyQi. The number of puncta increases ~twofold, which is in proportion with the increase in axon length across development. Representative images and WormPsyQi-based quantification of synapse addition using synapse-specific GRASP reporters visualizing (C) ASK>AIA (otIs653), (D) AIB>SAA (otEx7809), and (E) PHB>AVA (otIs839) synapses at early larval (L1 or L2) and L4 or day-1 adult (Ad) stages. p values were calculated using an unpaired t-test (A, B, D, E) or one-way analysis of variance (ANOVA) with Bonferroni correction for multiple comparisons (C). ****p ≤ 0.0001 and ***p ≤ 0.001. Electron microscopy (EM) data (taken from Witvliet et al., 2021; Cook et al., 2019; White et al., 1986) were excluded from statistical analysis based on limited sample sizes (n = 1–4), which were out of proportion with reporter-based data. In each dataset, a dot represents a single worm and lines represent median with 95% confidence interval. All raw and segmented images are maximum intensity projections of confocal Z-stacks. Scale bars = 10 μm.
Figure 9 with 2 supplements
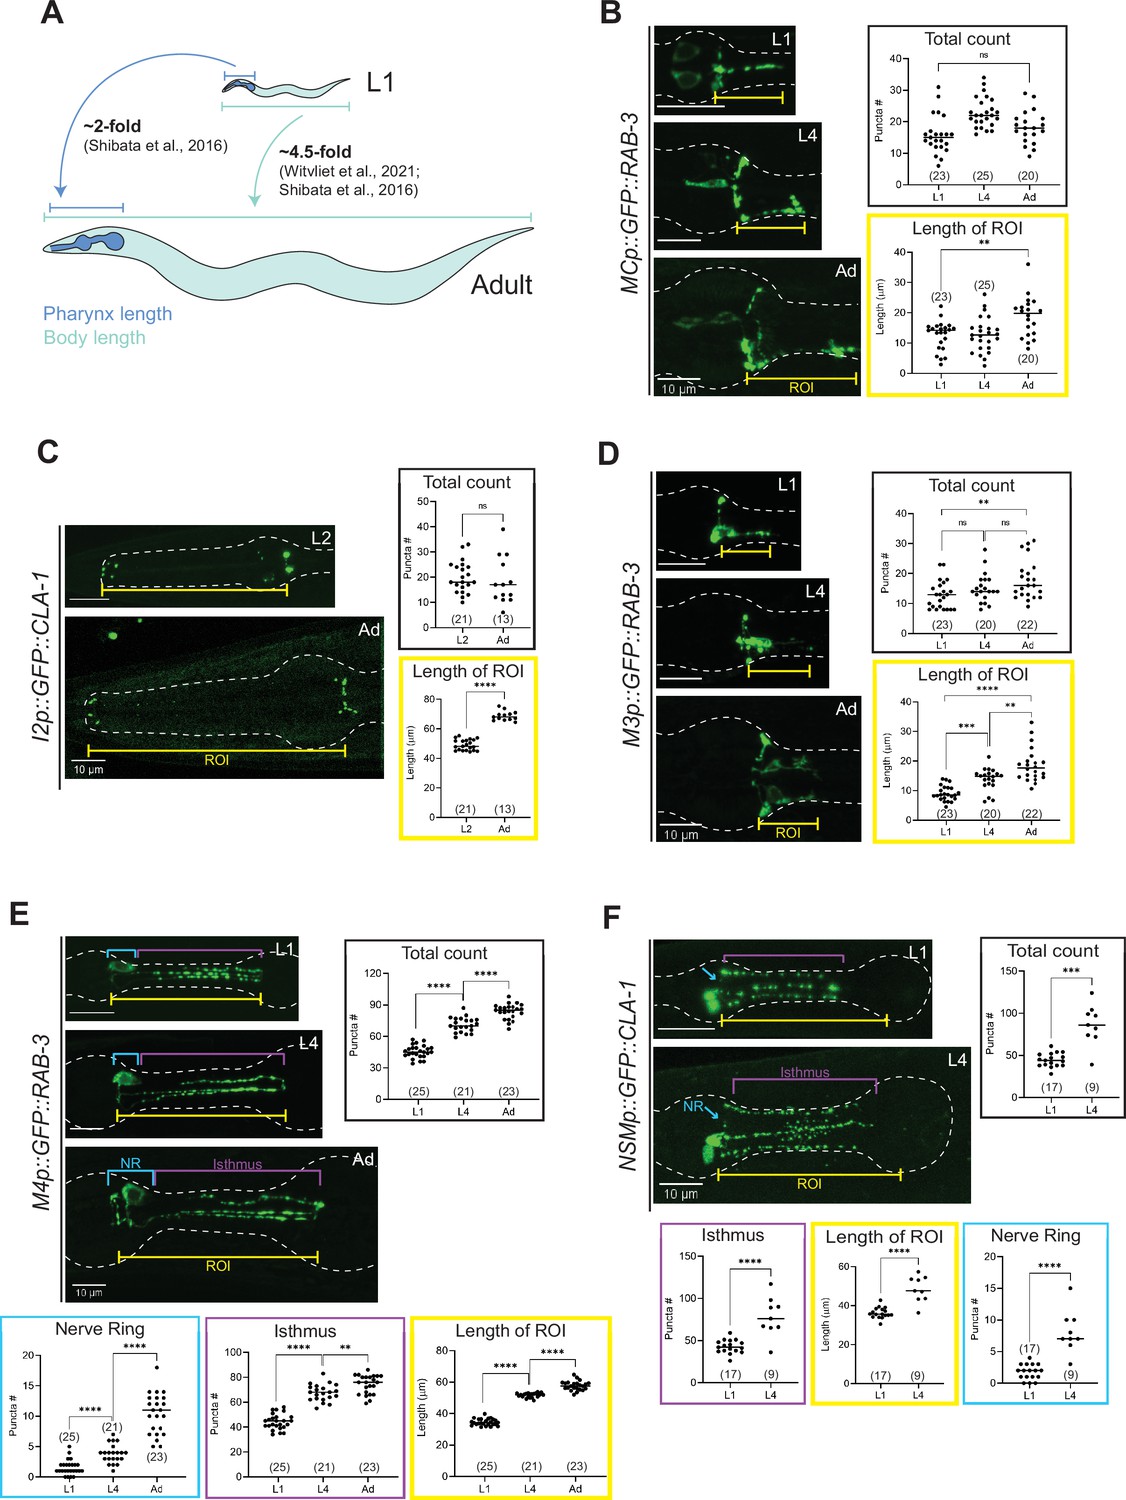
Synapse addition in the enteric nervous system does not scale with neuron growth over developmental.
(A) Overview of pharynx and total body length elongation between L1 and adult stages based on previous findings (Witvliet et al., 2021; Shibata et al., 2016). Representative images and quantification of number of presynaptic specializations at early larval and adult stages visualized using (B) GFP::RAB-3 in MC (otEx7505), (C) GFP::CLA-1 in I2 (otEx7497), (D) GFP::RAB-3 in M3 (otIs602), (E) GFP::RAB-3 in M4 (otIs597), and (F) GFP::CLA-1 in NSM (otEx7499) neurons. Manual counts of total CLA-1 or RAB-3 puncta are plotted for each reporter (black boxes). For neurons MC, M3, M4, and NSM, region of interest (ROI, yellow box) length was measured from the pharyngeal nerve ring to the most posterior CLA-1 or RAB-3 signal observed. For I2 neurons, ROI length was measured from the pharyngeal nerve ring to the tip of the anterior end of the pharynx based on brightfield. For NSM neurons, ROI length was measured from the pharyngeal nerve ring to the grinder in the terminal bulb, based on brightfield. For neurons M4 and NSM, additional quantification was performed for the pharyngeal nerve ring region (NR, blue box) and the isthmus (purple). p values were calculated using Mann–Whitney test. ****p ≤ 0.0001, ***p ≤ 0.001, **p ≤ 0.01, and p > 0.05 not significant (ns). In each dataset, a dot represents a single worm and lines represent median. All images are maximum intensity projections of confocal Z-stacks. Scale bars = 10 μm.
Figure 9—figure supplement 1
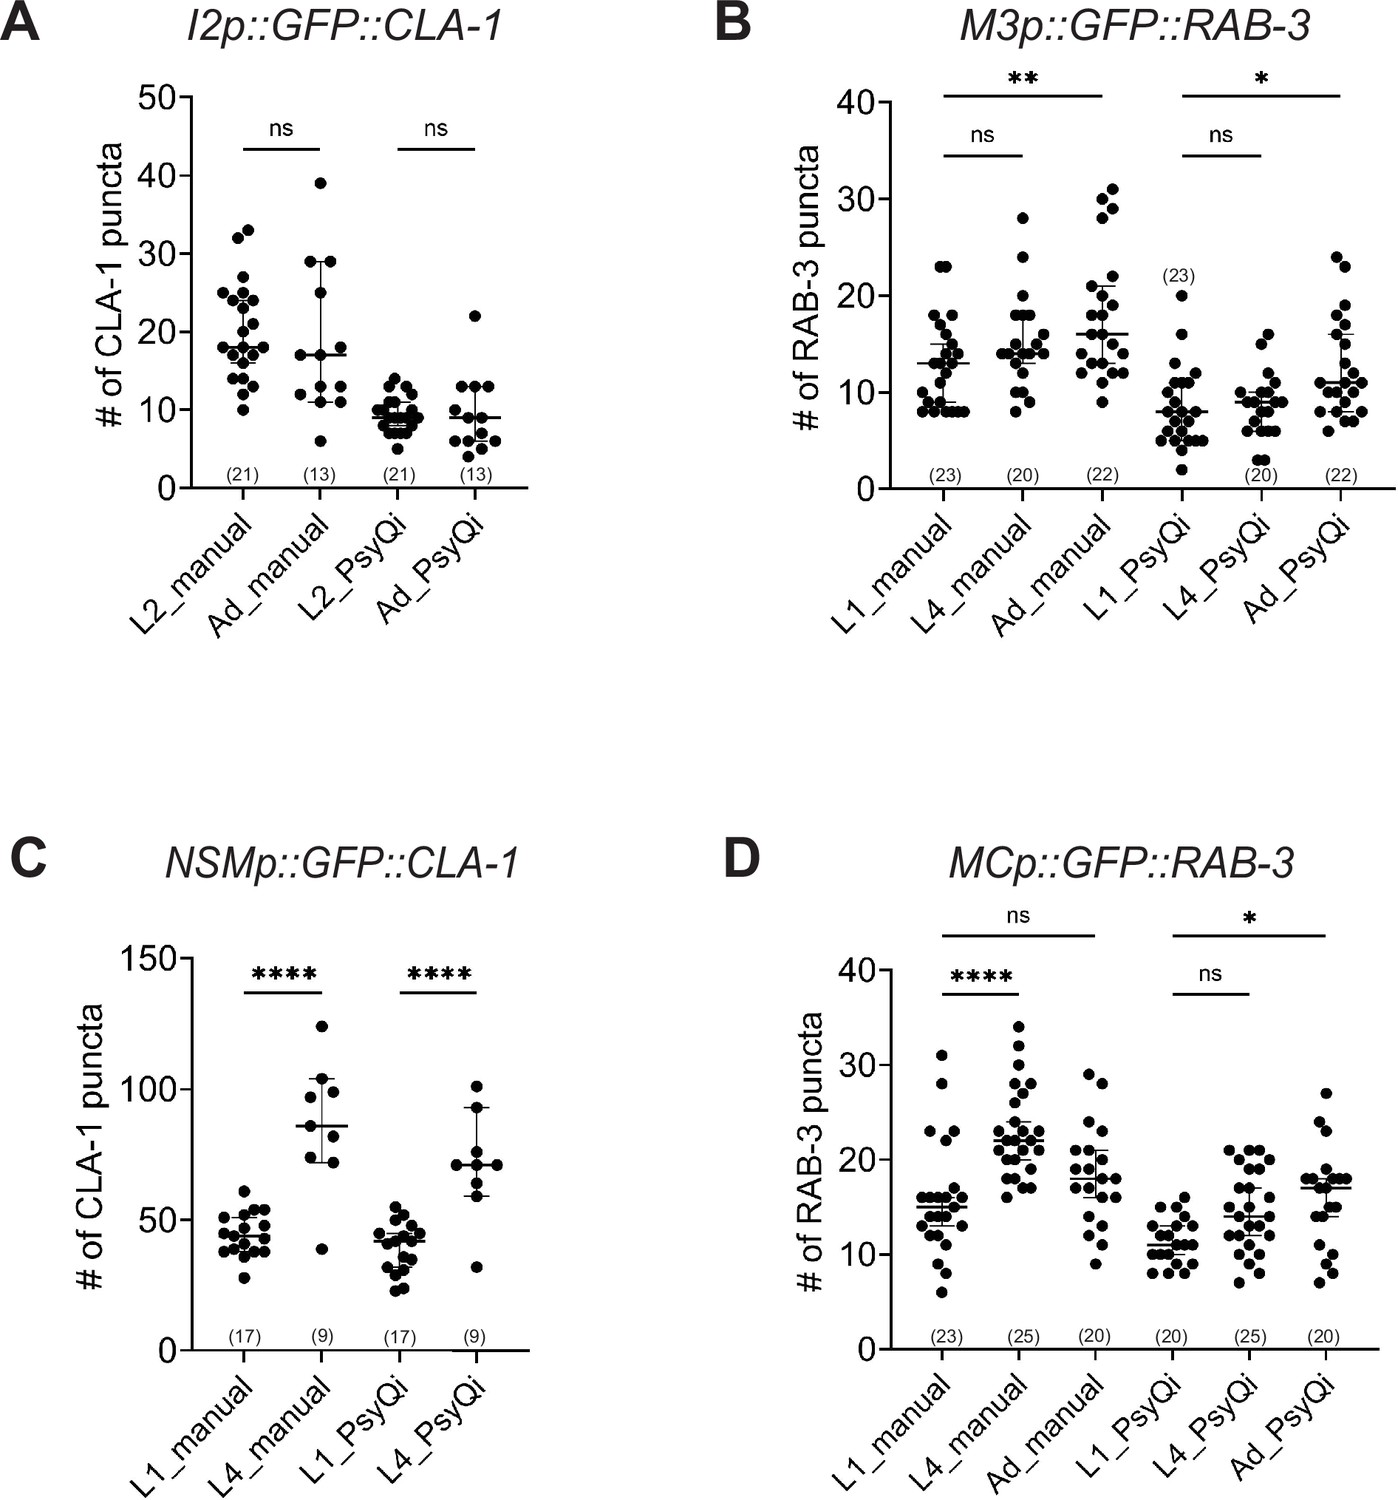
Manual and WormPsyQi quantification show the same developmental trends in synapses in the pharynx.
Graphs showing manual vs. WormPsyQi puncta quantification for presynaptic specializations in pharyngeal neurons: (A) I2, (B) M3, (C) NSM, and (D) MC in early larval (L1, L2) and late larval (L4) or adult (Ad) stages. Although WormPsyQi scores fewer puncta relative to manual counts in L1 and L2 animals, the trends between the two modes of scoring are consistent with modest synapse addition in neurons I2, M3, and MC, and significant addition in neurons NSM. p values were calculated using one-way analysis of variance (ANOVA) with Bonferroni correction. ****p ≤ 0.0001, **p ≤ 0.01, *p ≤ 0.05, and p > 0.05 not significant (ns). In each dataset, a dot represents a single worm and lines represent median with 95% confidence interval.
Figure 9—figure supplement 2
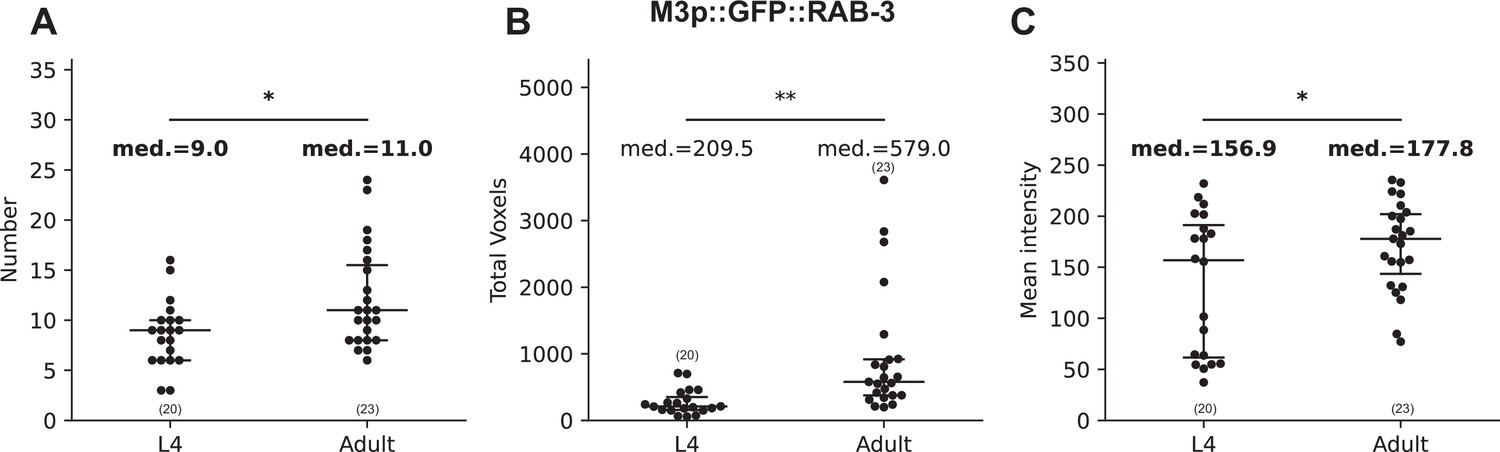
WormPsyQi quantification reveals small but significant differences between adjacent developmental stages.
Graphs showing WormPsyQi quantification of synapse count (A), total puncta volume (B), and mean pixel intensity of puncta (C) for M3p::GFP::RAB-3 reporter (otIs602) between L4 and adult stages. All three quantities show significant changes from L4 to adult, even when the changes are marginal (10–20%) in the case of total puncta count and mean pixel intensity (highlighted in bold). p values were calculated using one-way analysis of variance (ANOVA). **p ≤ 0.01 and *p ≤ 0.05.
Figure 10 with 2 supplements

Extracting subcellular and spatial synaptic features using WormPsyQi.
(A–C) Synaptic puncta distribution profiles of RAB-3 in PHA, CLA-1 in AIB, and CLA-1 and RAB-3 in ASK neurons. Top: schematic of neurons (source: WormAtlas). Middle left: maximum intensity projection of raw image with contrast enhancement. Middle right: skeleton diagram of neurons. Position 0 indicates soma and 1 indicates the furthest axon terminal. Bottom: probability density histogram of puncta distribution along the neurite. Puncta distribution profiles of worms at the same stage were combined to give a histogram (see Methods). (C) RAB-3 and CLA-1 puncta profiles overlaid. (D) Representative features describing developmental changes of ASK‘s presynaptic specializations. Top: puncta volume and puncta number per worm, from left to right. Bottom: puncta number density and puncta volume density per worm (calculated along the neurite domain covered where synapses are localized). p values were calculated using one-way analysis of variance (ANOVA) with Bonferroni correction for multiple comparisons. ***p ≤ 0.001, *p ≤ 0.05, and p > 0.05 not significant (ns). In each dataset, a dot represents a single worm. (E) Synaptic puncta density distribution in ASK neurons at different stages. For each worm, the synaptic volume distribution was normalized by axon length.
Figure 10—figure supplement 1
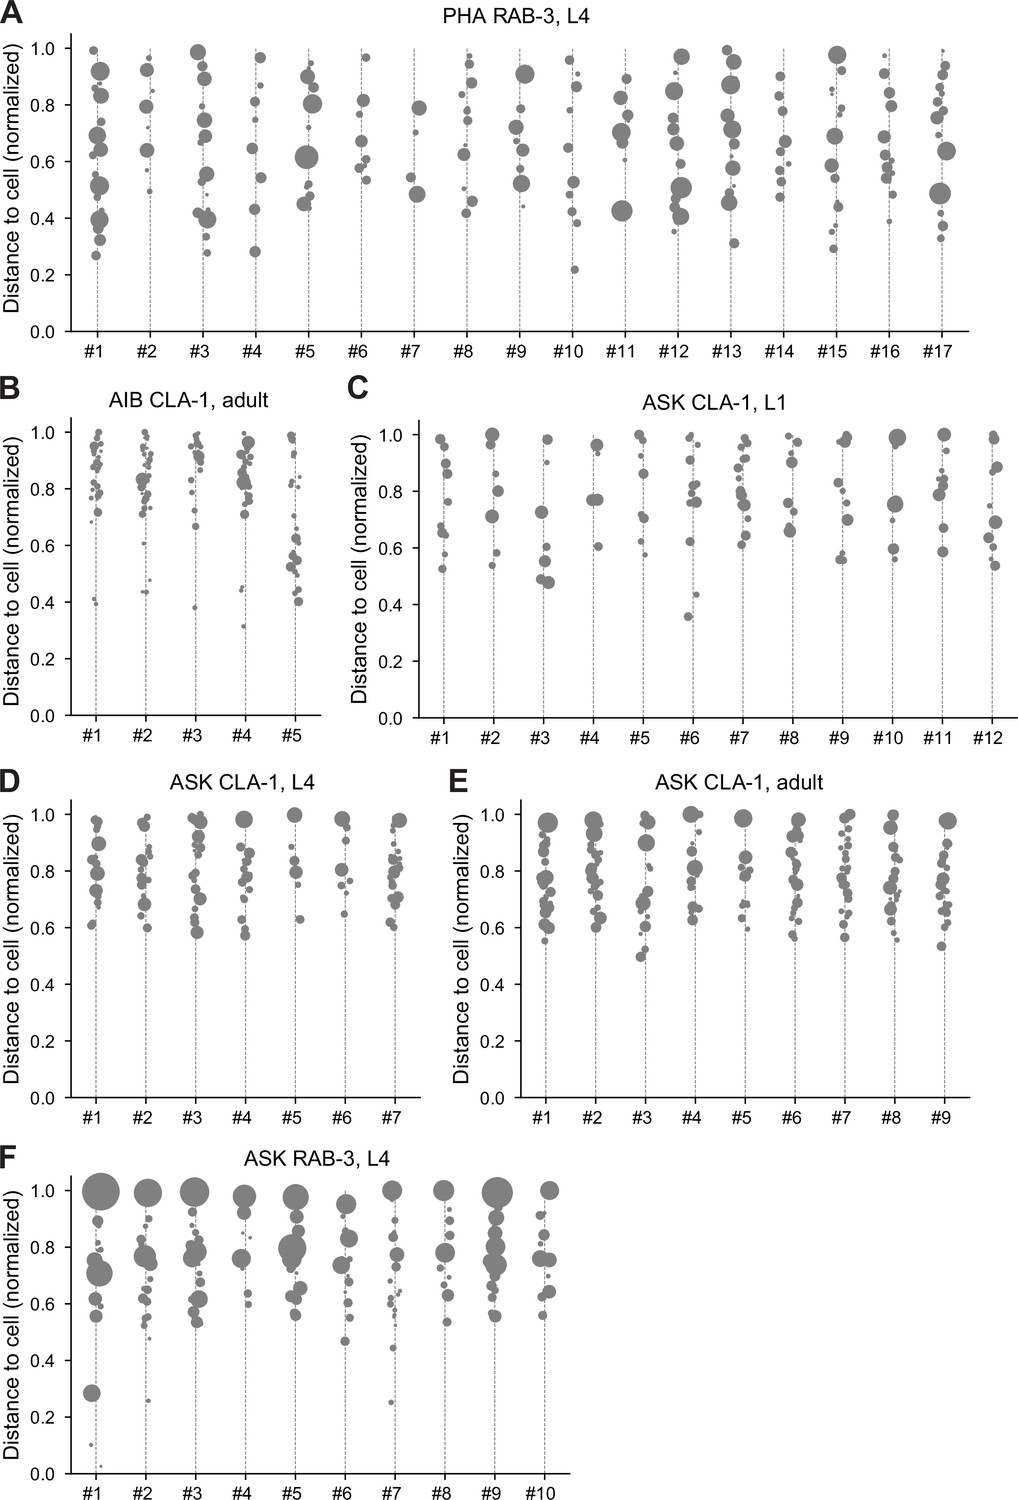
Distribution of CLA-1 or RAB-3 puncta in individual worms.
Individual CLA-1 or RAB-3 puncta distribution in cell-specific reporters for neurons PHA, AIB, and ASK (population-level quantification and statistics summarized in Figure 10). Each column in the graphs corresponds to an individual worm. Gray dots denote discrete puncta, and the size of dots corresponds to the synapse volume. The y-axis represents the normalized distance from the soma, with 0 being the closest and 1 being the farthest point along the neurite ROI. (A) PHA RAB-3 adults, (B) AIB CLA-1 L4s, (C) ASK CLA-1 L1s, (D) ASK CLA-1 L4s, (E) ASK RAB-3 L4s, and (F) ASK CLA-1 adults.
Figure 10—figure supplement 2
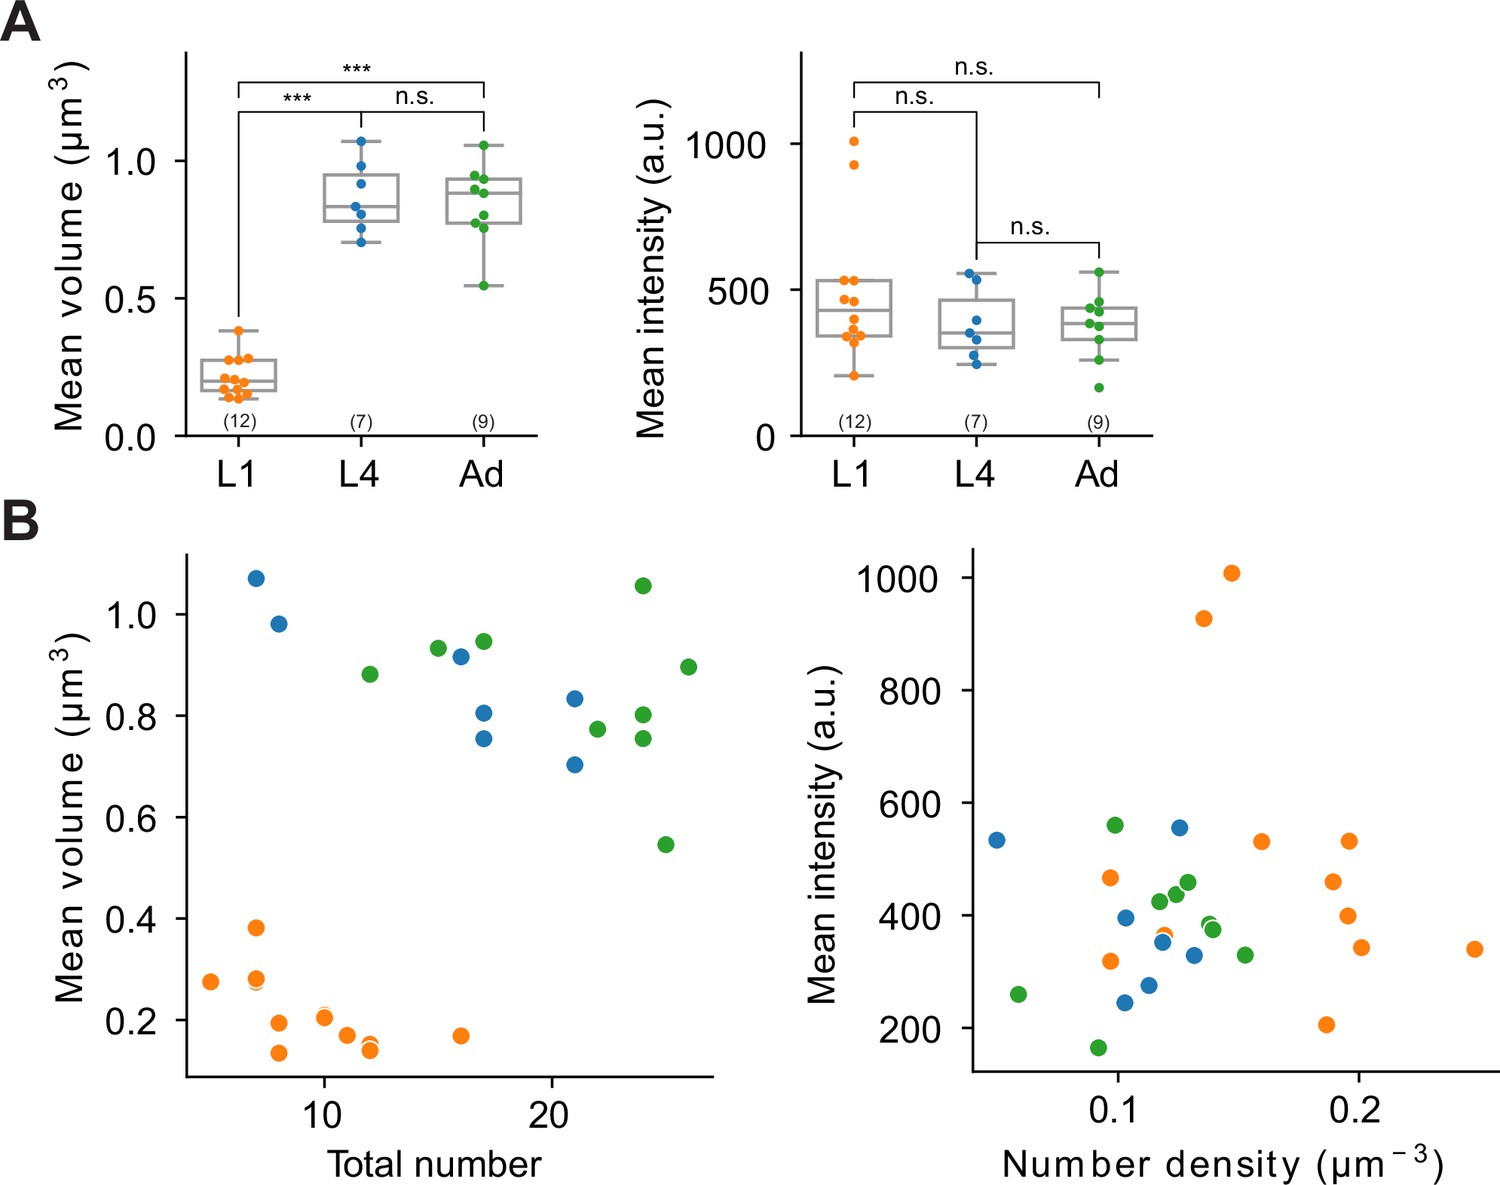
Extended features and representative two-dimensional scatter plots of ASK CLA-1 reporter across different developmental stages.
(A) Left: average volume of synaptic puncta. Right: average fluorescence intensity. Each dot in a dataset represents a single worm. p values were calculated using one-way analysis of variance (ANOVA) with Bonferroni correction for multiple comparisons ***p ≤ 0.001 and p > 0.05 not significant (ns). (B) Two examples illustrating two-dimensional synapse ultrastructure analysis. Color coding is consistent with Figure 10. Left: total number vs. average volume of puncta at L1, L4, and adult stages. In this representation, L1 stage worms are clustered separately from L4 and adult stages, which are grouped together. Right: number density vs. average intensity of puncta; developmental stages are not clearly differentiated in this feature space.
Additional files
-
Supplementary file 1
List of fluorescent reporters analyzed in this paper using WormPsyQi.
Strain identifier, genotype, datasets analyzed, and imaging conditions (stage, sex) are listed for each reporter.
- https://cdn.elifesciences.org/articles/91775/elife-91775-supp1-v2.xlsx
-
Supplementary file 2
Details of transgenic constructs and injections.
- https://cdn.elifesciences.org/articles/91775/elife-91775-supp2-v2.xlsx
-
Supplementary file 3
Segmentation benchmark for different U-Net structures.
- https://cdn.elifesciences.org/articles/91775/elife-91775-supp3-v2.xlsx
-
MDAR checklist
- https://cdn.elifesciences.org/articles/91775/elife-91775-mdarchecklist1-v2.docx
Download links
A two-part list of links to download the article, or parts of the article, in various formats.
Downloads (link to download the article as PDF)
Open citations (links to open the citations from this article in various online reference manager services)
Cite this article (links to download the citations from this article in formats compatible with various reference manager tools)
Toolkits for detailed and high-throughput interrogation of synapses in C. elegans
eLife 12:RP91775.
https://doi.org/10.7554/eLife.91775.3


