SMAD4 promotes somatic-germline contact during murine oocyte growth
- Research Institute, McGill University Health Centre, Canada
- Present address: Cancer CIBER (CIBERONC), Spain
- Present address: Pathology Department, Medical School, University of Valencia-INCLIVA, Spain
- Departments of Obstetrics and Gynecology and Biology, Division of Experimental Medicine, McGill University, Canada
Figures
Figure 1
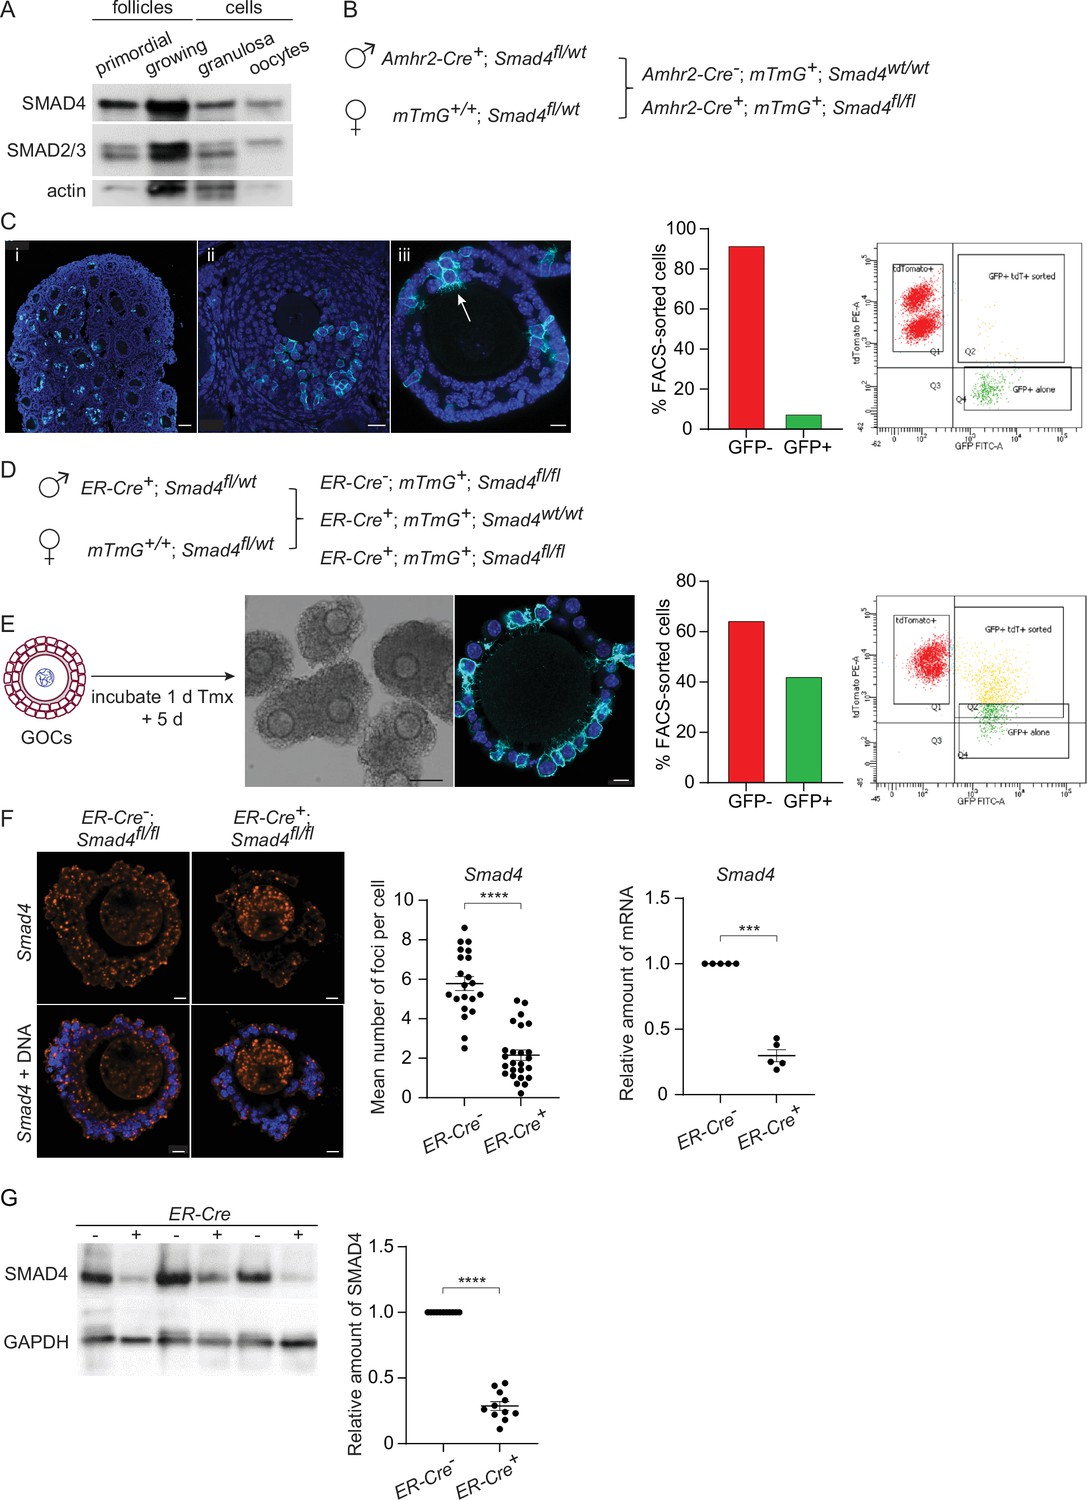
SMAD4 is efficiently depleted in granulosa cells of granulosa cell-oocyte complexes (GOCs) in vitro using tamoxifen-induced Cre recombinase.
(A) Immunoblot of primordial follicles, growing follicles, and granulosa cells and oocytes isolated from antral follicles, probed using anti-SMAD4 and anti-SMAD2/3. (B) Breeding scheme to delete Smad4 in the granulosa cells using Amhr2-Cre. The mTmG cassette enables Cre recombinase activity to be verified through expression of EGFP. (C) Left: Confocal images of histological sections of paraffin-embedded 12-d ovary (i, ii) and an isolated follicle (iii) stained using an anti-green fluorescent protein (GFP) antibody and DAPI to counterstain DNA. Relatively few granulosa cells are GFP-positive (arrow in iii). Scale bars: 50 µm, 20 µm, 10 µm. Right: Histogram and chart showing the percentage of FACS-sorted GFP + and GFP- granulosa cells from growing follicles in a representative experiment. Granulosa cells expressing both td tomato and GFP and GFP alone were scored as GFP+. (D) Breeding scheme to delete Smad4 in vitro using generate tamoxifen-inducible ER-Cre. The mTmG cassette enables Cre recombinase activity to be verified through expression of EGFP. (E) Left: Schematic illustrating timeline of GOC exposure to tamoxifen and subsequent incubation. Center: Bright-field image of GOCs following incubation and confocal image of a representative GOC stained using anti-GFP antibody and DAPI to counterstain DNA. Scale bar = 100 µm and 10 µm, respectively. Right: Bar chart showing the percentage of FACS-sorted GFP + and GFP- granulosa cells from GOCs in a representative experiment. Granulosa cells expressing td tomato and GFP and GFP alone are counted as GFP+. (F) Left: Confocal image of representative GOCs stained with single-molecule RNA FISH probe for Smad4 exon 8 and DAPI to counterstain DNA. Right: Mean and SEM of the average number of Smad4 mRNA foci per cell (left) and relative mRNA amounts of Smad4 quantified using qRT-PCR (right) in granulosa cells five days after tamoxifen treatment. Number of foci: n=26 (ER-Cre-); n=21 (ER-Cre+). Relative mRNA: n=5 for both genotypes. (G) Immunoblot and plot of mean and SEM of SMAD4 protein content in granulosa cells from GOCs five days after tamoxifen treatment. A. n=11 for both genotypes. Statistical analysis using t-test (F, left) and one-sample t-test (F, right, and G), ***p<0.001; ****p<0.0001.
Figure 2
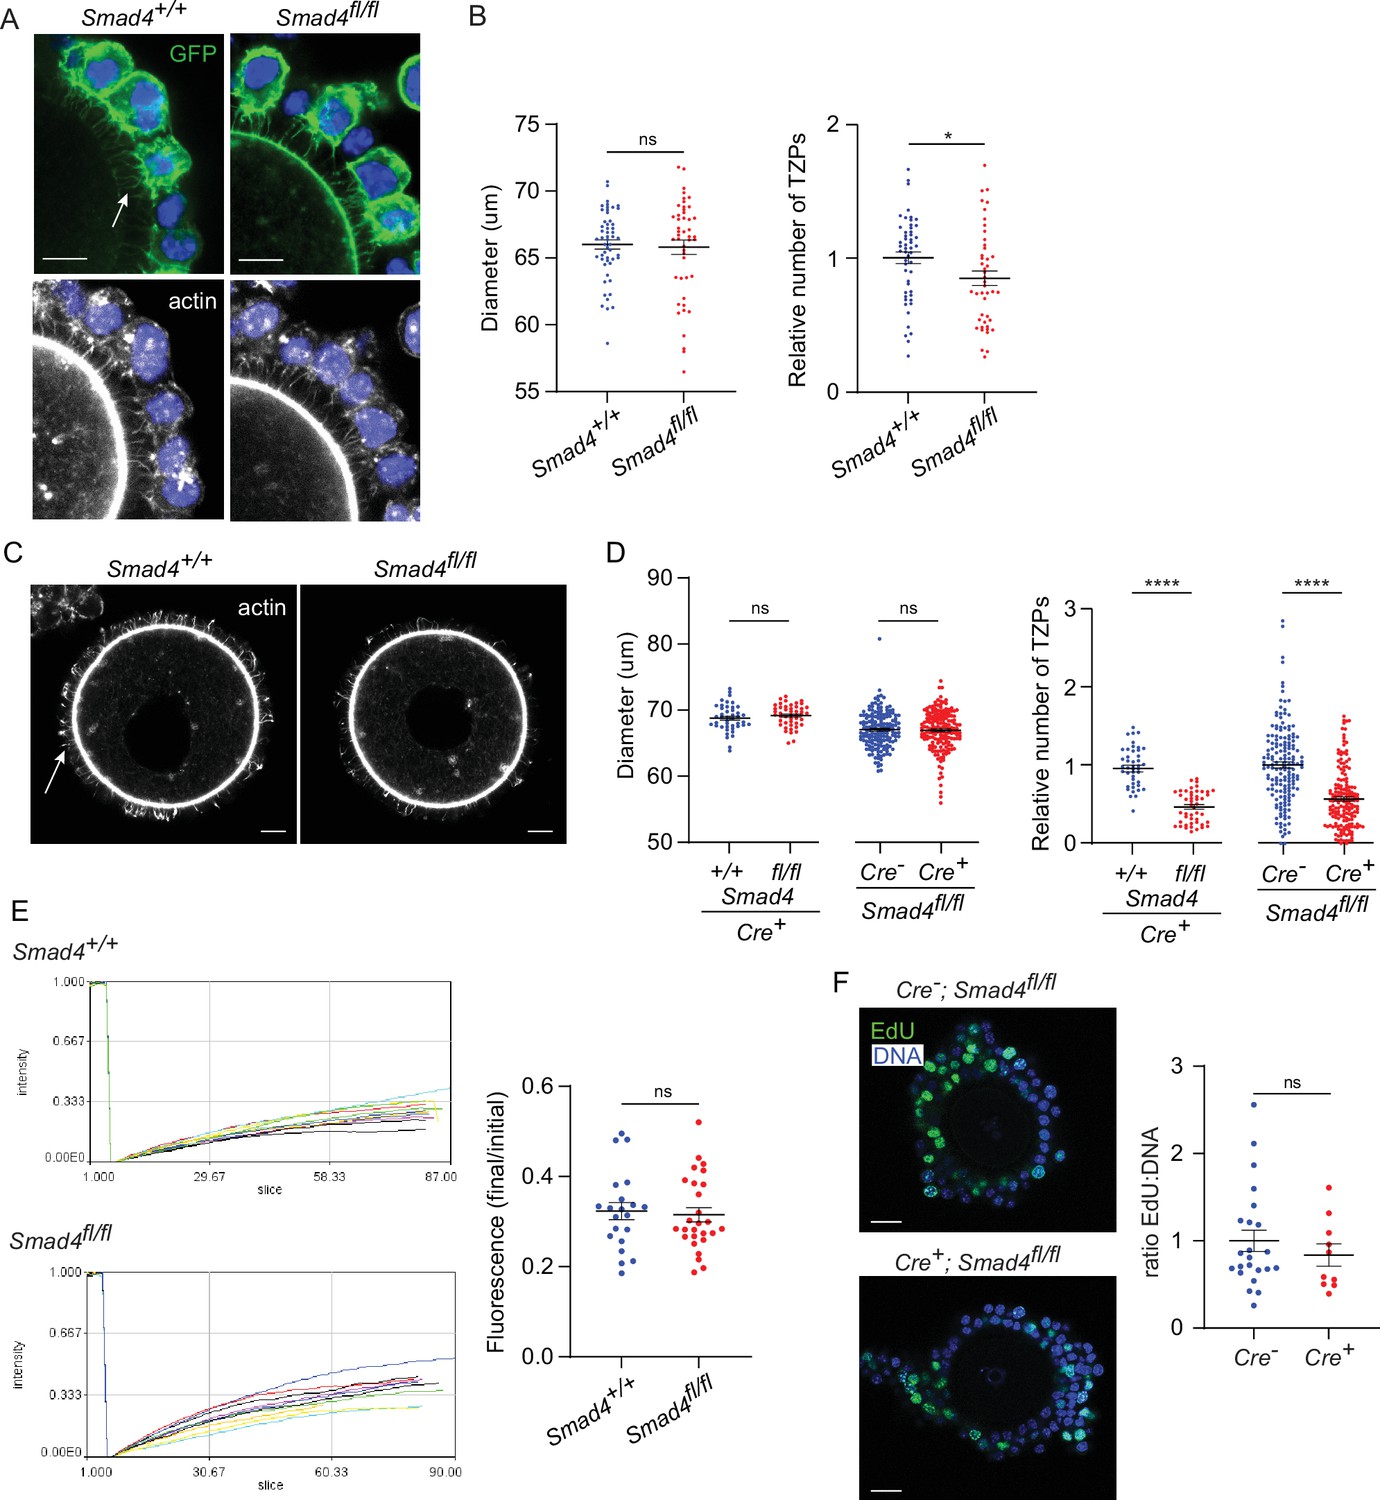
Depletion of SMAD4 reduces transzonal projection (TZP)-number but does not affect granulosa cell communication with the oocyte or proliferation.
(A) Confocal images of granulosa cell-oocyte complexes (GOCs) five days after tamoxifen treatment stained with anti-green fluorescent protein (GFP), phalloidin to visualize F-actin and DAPI to counterstain DNA. Arrow shows GFP-labelled TZPs. Scale bar = 20 µm. (B) Mean and SEM of oocyte diameter and TZP number five days after tamoxifen treatment. TZP number in each GOC is normalized to the oocyte diameter. n=63 (+/+), 59 (fl/fl). (C) Confocal image of a denuded GOC five days after tamoxifen treatment and removal of the granulosa cells, stained with anti-GFP, phalloidin to visualize F-actin and DAPI to counterstain DNA. Arrow shows phalloidin-labelled TZPs that remain embedded in the zona pellucida. Scale bar = 20 µm. (D) Mean and SEM of oocyte diameter and TZP number five days after tamoxifen treatment in denuded GOCs. TZP number for each specimen is normalized to the oocyte diameter. For the groups where all mice were Cre+: n=44 (+/+), 47 (fl/fl). For the groups where all mice were fl/fl: n=164 (Cre-), 172 (Cre+). (E) Left: Time course of fluorescence recovery in oocyte of GOCs following bleaching. Each line represents an individual GOC. Right: Mean and SEM of the ratio of the final to pre-bleach fluorescence in each GOC. n=21 (+/+); 27 (fl/fl). (F) Left: Confocal image of a GOC after tamoxifen treatment followed by treatment with EdU and visualization. DNA was stained using DAPI. Scale bar = 20 µm. Right: Mean and SEM of the ratio of Edu-labelled cells to the total number of cells. n=23 (Cre-); 10 (Cre+). Statistical analysis using t-test, *p<0.05; ****p<0.0001; ns, not significant.
Figure 3
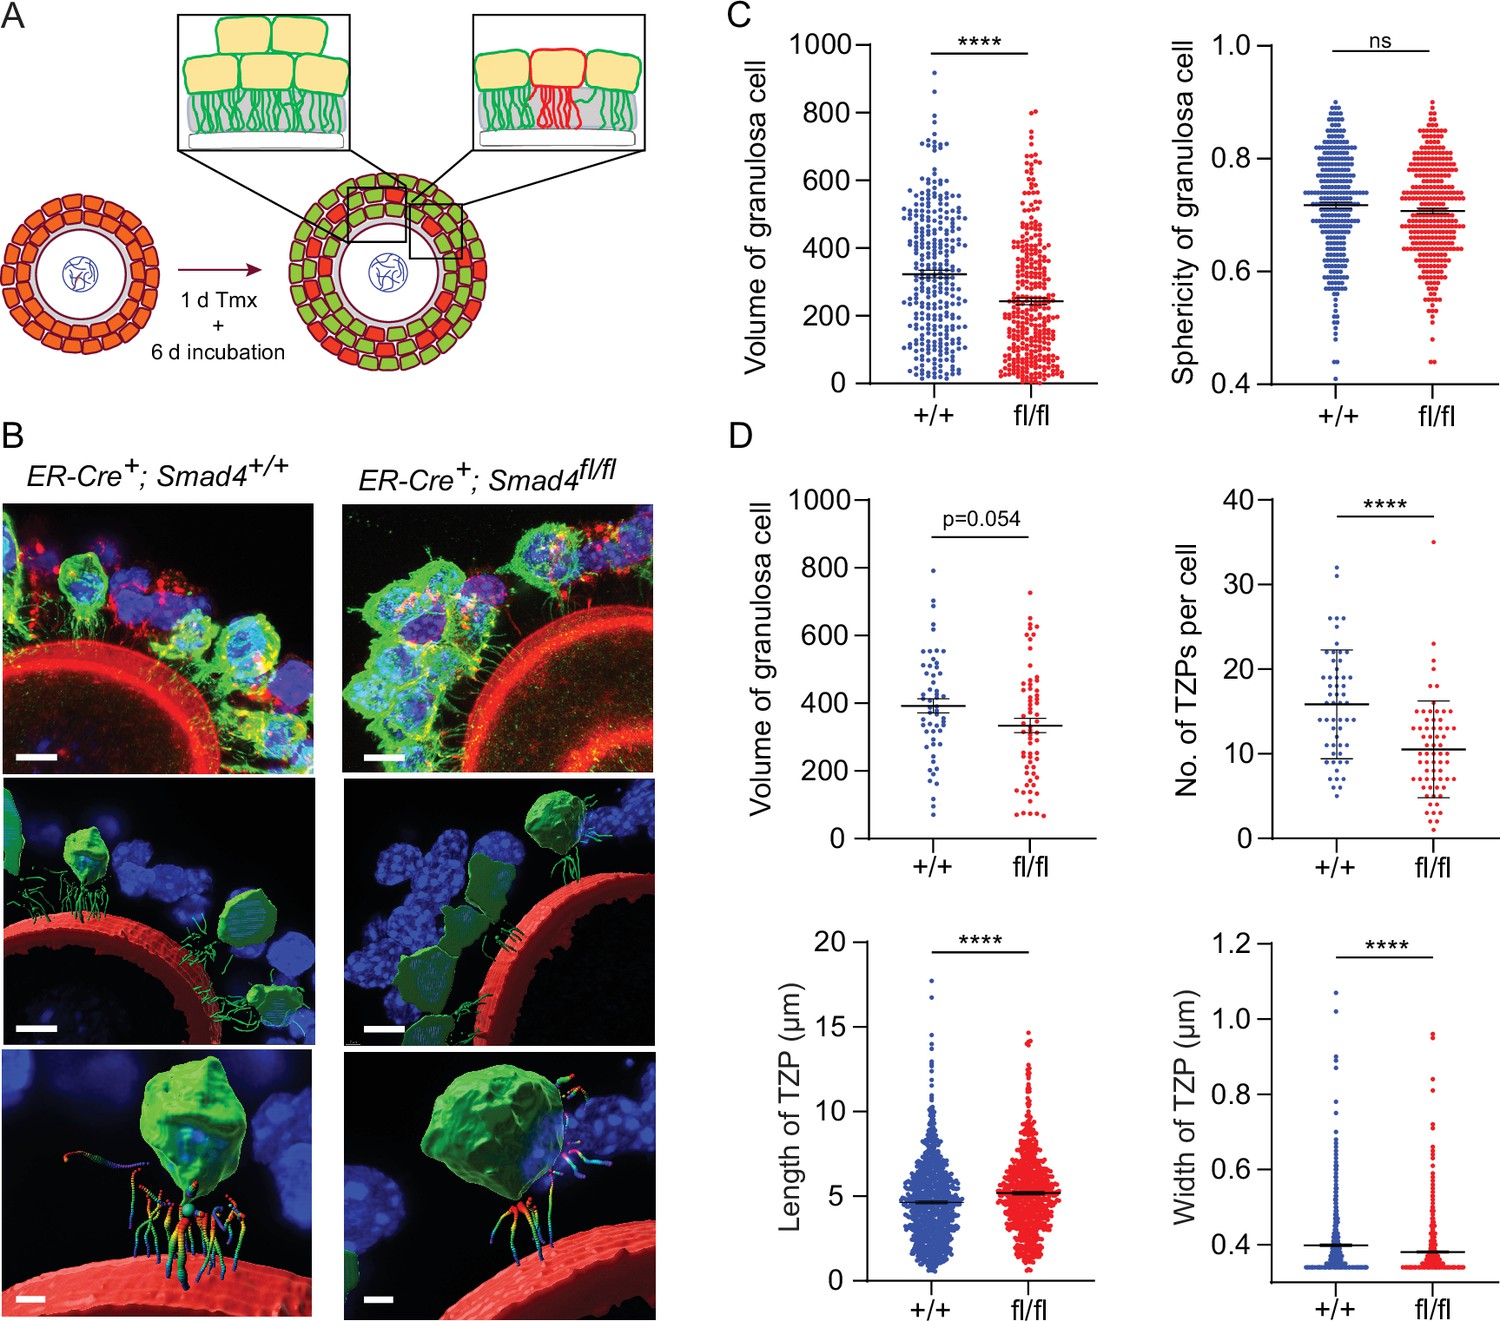
Depletion of SMAD4 in granulosa cell-oocyte complexes (GOCs) reduces the number of transzonal projections (TZPs) per granulosa cell and alters their morphometric parameters.
(A) Schematic illustrating the experimental protocol. green fluorescent protein (GFP+) granulosa cells in clusters were used for calculations in C and individual GFP + granulosa cells were used for calculations in D. (B) Three-dimensional reconstruction of a GOC, showing granulosa cell bodies, TZPs, and oocyte cortex. Serial optical confocal sections were processed using Imaris software. GOCs were stained using anti-GFP (green), phalloidin (red), and DAPI (blue). Scale bar = 10 µm (upper, middle), 3 µm (lower). (C) Mean and SEM of volumes and sphericities of individual granulosa cells from a cluster and those selected for TZP analyses. Volume: n = 293 (+/+), 322 (fl/fl); sphericity: n = 293 (+/+), 322 (fl/fl). (D) Mean and SEM of volumes of individual granulosa cells selected for TZP analysis, number of TZPs per cell, TZP length, and width. Volume: n = 55 (+/+), 63 (fl/fl); no. of TZPs: n = 55 (+/+), 65 (fl/fl) length: n = 893 (+/+), 720 (fl/fl); width: n = 870 (+/+), 719 (fl/fl). Statistical analysis using t-test, ****p<0.0001; ns, non-significant.
Figure 4 with 1 supplement
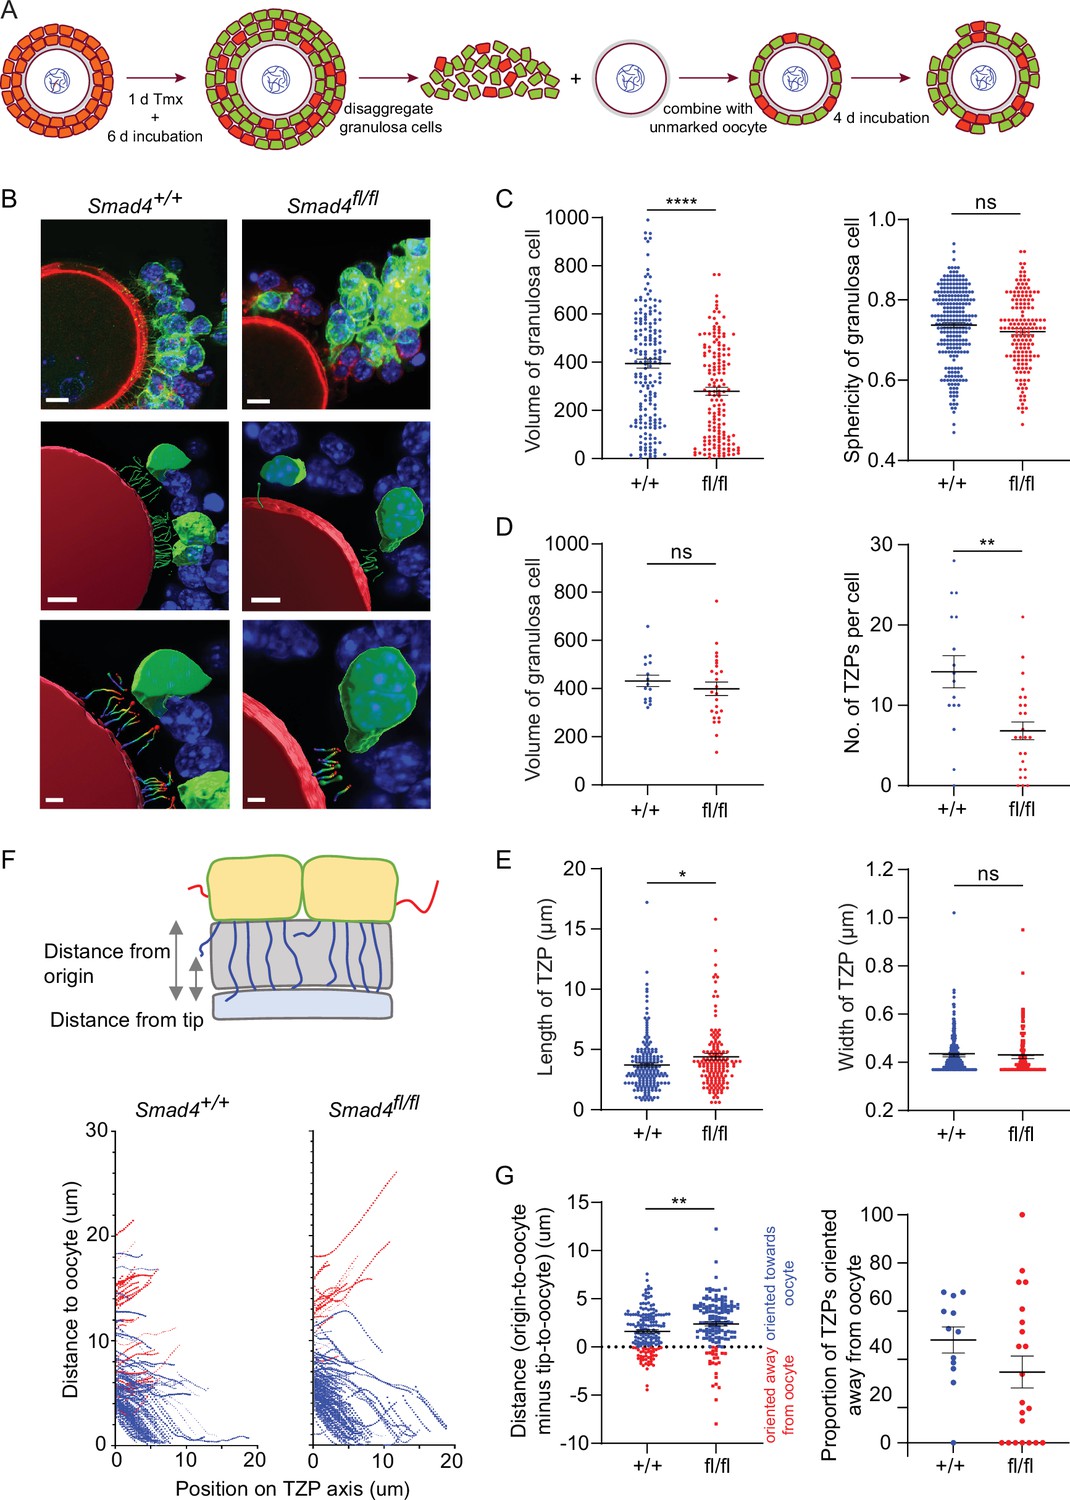
Depletion of SMAD4 in reaggregates reduces the number of newly generated transzonal projections (TZPs) and alters their morphometric parameters.
(A) Schematic illustrating the reaggregation procedure. (B) Three-dimensional reconstruction of a reaggregate, showing granulosa cell bodies, TZPs, and oocyte cortex. Serial optical confocal sections were processed using Imaris software. Granulosa cell-oocyte complexes (GOCs) were stained using anti-green fluorescent protein (GFP) (green), phalloidin (red), and DAPI (blue). Scale bar = 10 µm (upper), 3 µm (lower). (C) Mean and SEM of volumes and sphericities of individual granulosa cells. Volume: n = 185 (+/+), 159 (fl/fl); sphericity: n = 185 (+/+), 159 (fl/fl). (D, E) Mean and SEM of volumes of individual granulosa cells, number of TZPs per cell, TZP length, and TZP width. Volume: n = 16 (+/+), 25 (fl/fl); no. of TZPs: n = 16 (+/+), 25 (fl/fl) length: n = 174 (+/+), 154 (fl/fl); width: n = 316 (+/+), 169 (fl/fl). (F) Upper: Schematic illustrating how the distance from the origin and the tip, respectively, of TZPs (blue) and non-TZP projections (red) to the oocyte surface was determined. Lower: TZP trajectories of 3D-reconstructed TZPs, representing the distance from origin relative to the position on the TZP axis. (G) Left: Mean and SEM of the difference between the distance from the origin and the tip of individual TZPs to the oocyte surface. Blue symbols (>0) represent TZPs oriented towards the oocyte; red symbols (<0) represent non-TZPs oriented away from the oocyte. n = 174 (+/+), 157 (fl/fl). Right: Mean and SEM of the proportion of TZPs in individual cells that were oriented away from the oocyte. n = 12 (+/+), 21 (fl/fl). Statistical analysis using t-test, *p<0.05; **p<0.01; ****p<0.0001; ns, non-significant.
Figure 4—figure supplement 1
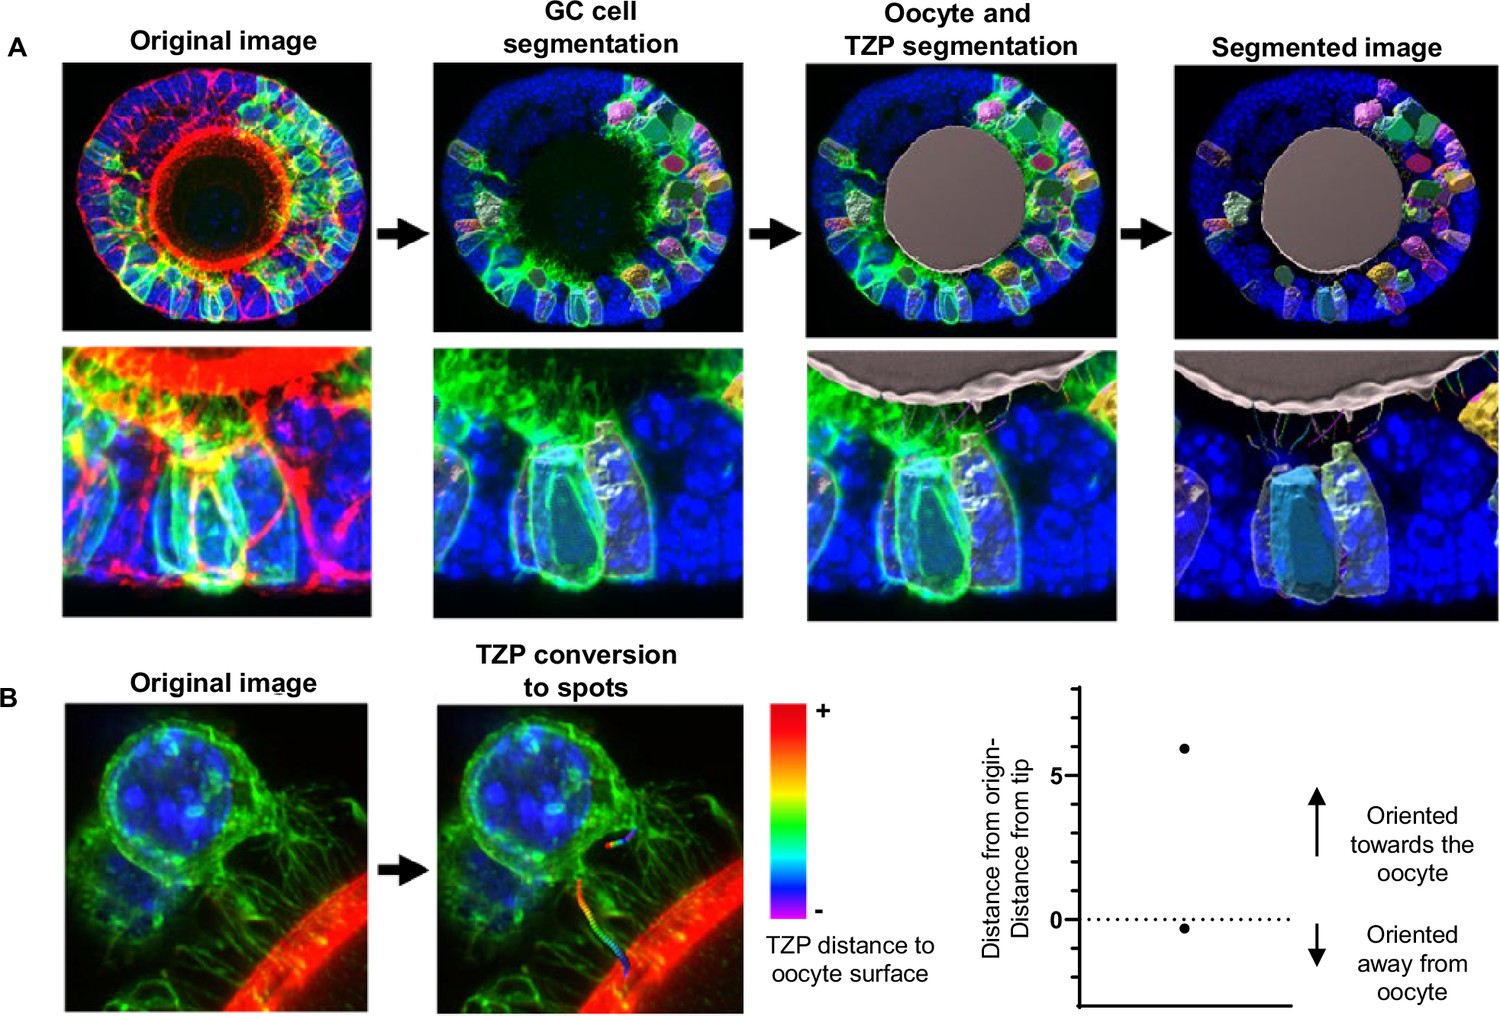
Segmentation pipeline of green fluorescent protein (GFP)-positive granulosa cells.
(A) Three-dimensional (3D) reconstruction of granulosa cells, oocyte, and transzonal projections (TZPs). (B) TZP segmentation into spots. Graph shows an example of spot subtraction of two TZPs oriented towards and away from the oocyte. Heatmap depicts the gradient of colours for the spots that are closer (violet) and farther from the oocyte (red). TZP segmentation into spots. Graph shows an example of spot subtraction of two TZPs oriented towards and away from the oocyte. Heatmap depicts the gradient of colours for the spots that are closer (violet) and farther from the oocyte (red).
Figure 5
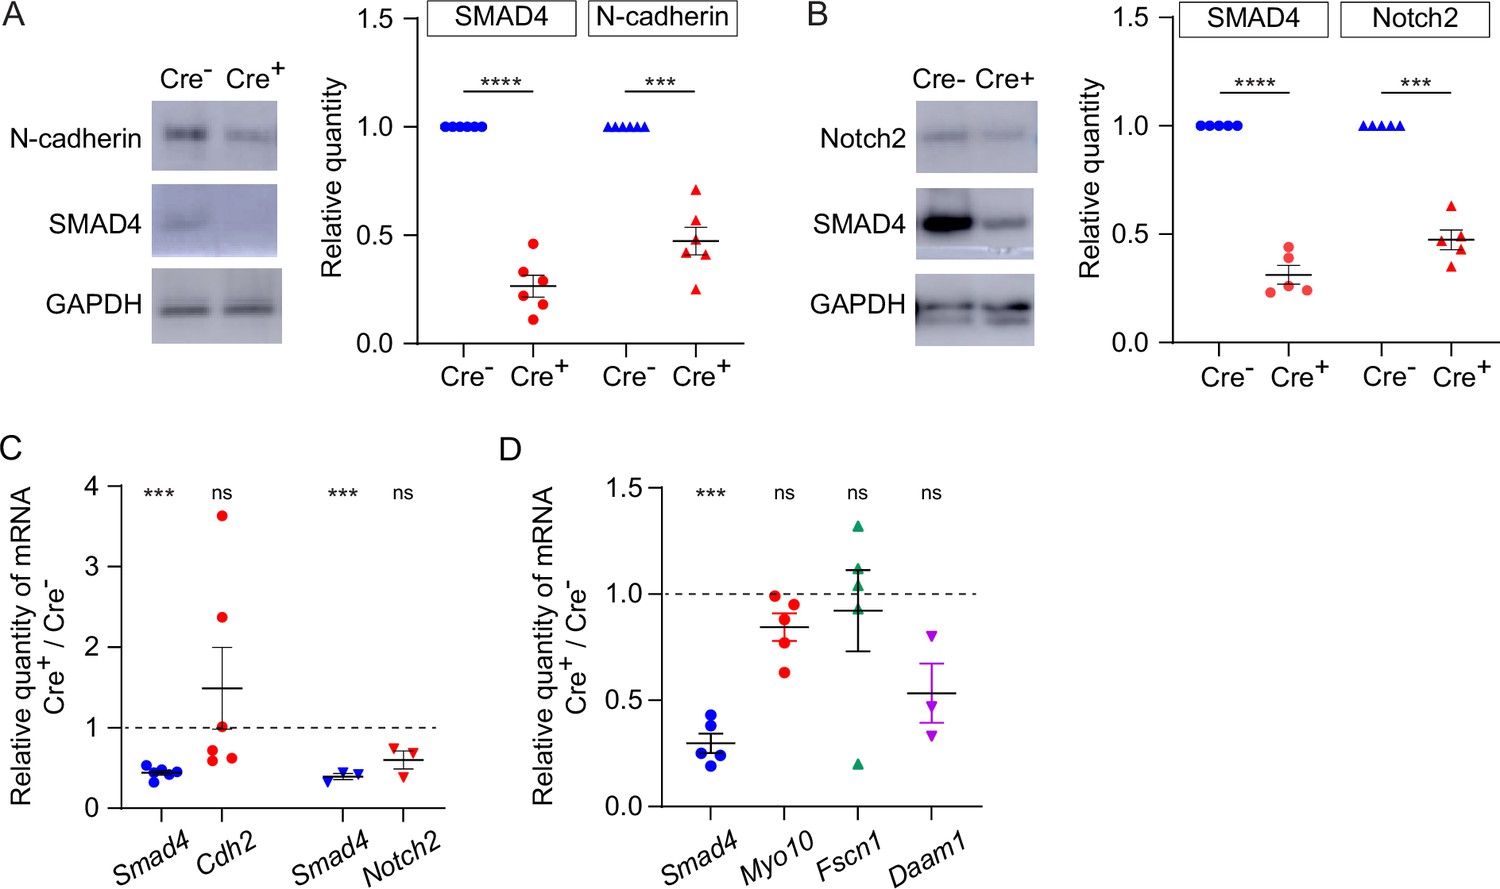
Expression of transmembrane N-cadherin and Notch proteins is reduced in SMAD4-depleted granulosa cells.
(A) Immunoblot and graph showing mean and SEM of SMAD4 and N-cadherin in granulosa cells. Protein quantities are normalized to amounts in ER-Cre- cells. n=6. (B) As in A, showing Notch2. n=5. (C) Mean and SEM of relative mRNA amounts of Smad4, Cdh2 (encoding N-cadherin), and Notch2 in granulosa cells purified from granulosa cell-oocyte complexes (GOCs) five days after tamoxifen treatment. mRNA quantities are normalized to amounts in ER-Cre- cells. n=6 (Cdh2), 3 (Notch2). (D) As in C, showing Smad4, Myo10, Fscn1, and Daam1. n=5, except for Daam1 (n=3). Statistical analysis using one-sample t-test, ***p<0.001; ****p<0.0001; ns non-significant.
Figure 6

Model for regulation of the size of the transzonal projection (TZP) population.
Upper: Dynamics of an individual TZP. When growing TZP contacts the surface of the oocyte, it becomes stably attached if there is sufficient N-cadherin, as in wild-type cells. In SMAD4-depleted cells, there is insufficient N-cadherin to stabilize the attachment. The TZP may continue to elongate but eventually becomes retracted. Lower: Dynamics of the population of TZPs. Owing to increased stability of attachment of individual TZPs to the oocyte surface, the total number of TZPs becomes larger in wild-type cells than in SMAD4-depleted cells.
Tables
Key resources table
| Reagent type (species) or resource | Designation | Source or reference | Identifiers | Additional information |
|---|---|---|---|---|
| gene (M. musculus) | Smad4 | GenBank | Gene ID: 17128 | |
| strain, strain background (M. musculus) | Smad4tm2.1Cxd/J | Jackson Laboratories | strain 017462 | Supplied by Dr. Daniel. J. Bernard, McGill University |
| strain, strain background (M. musculus) | Amhr2tm3(cre)Bhr | MMRRC | strain 014245-UNC | Supplied by Dr. Makoto Nagano, McGill University |
| strain, strain background (M. musculus) | B6.129-Gt(ROSA)26Sortm1(cre/ERT2)Tyj/J | Jackson Laboratories | strain 008463 | |
| strain, strain background (M. musculus) | B6.129(Cg)-Gt(ROSA)26Sortm4(ACTB-tdTomato,-EGFP)Luo/J | Jackson Laboratories | strain 007676 | |
| antibody | anti-SMAD2/3 (Rabbit monoclonal) | Cell Signaling Technology | 8685 RRID: AB_10889933 | 1:1000 (immunoblot) |
| antibody | anti-SMAD4 (Rabbit polyclonal) | Sigma | HPA019154 RRID: AB_1853480 | 1:1000 (immunoblot) |
| antibody | anti-N-cadherin (Mouse monoclonal) | BD Biosciences | B610920 RRID: AB_2077527 | 1:1000 (immunoblot) |
| antibody | anti-Notch2 (Rabbit polyclonal) | Abcam | Ab8926 RRID: AB_2267338 | 1:1000 (immunoblot) |
| antibody | anti-GFP (Rabbit polyclonal) | Invitrogen | A11122 RRID: AB_2307355 | 1:100 (immunofluorescence, immunohistochemistry) |
| antibody | anti-rabbit IgG-HRP (Goat polyclonal) | Promega | W4011 RRID: AB_430833 | 1:5000 (immunoblot) |
| antibody | anti-mouse IgG-HRP (Goat polyclonal) | Promega | W4021 RRID: AB_430834 | 1:5000 (immunoblot) |
| antibody | anti-rabbit IgG- Alexa 488 (Donkey polyclonal) | Invitrogen | A21206 RRID: AB_2535792 | 1:100 (immunofluorescence, immunohistochemistry) |
| sequence-based reagent | Primer for polymerase chain reaction (PCR) genotyping | Sigma | Smad4 – wild-type | 5ʹ:GGGCAGCGTAGCATATAAGA 3ʹ:GACCCAAACGTCACCTTCAG Predicted size: 390 nt |
| sequence-based reagent | Primer for PCR genotyping | Sigma | Smad4 – floxed | 5ʹ:GGGCAGCGTAGCATATAAGA 3ʹ:GACCCAAACGTCACCTTCAG Predicted size: 450 nt |
| sequence-based reagent | Primer for PCR genotyping | Sigma | Smad4 – recombined | 5ʹ:TAAGAGCCACAGGGTCAAGC 3ʹ:GACCCAAACGTCACCTTCAG Predicted size: 450 nt |
| sequence-based reagent | Primer for PCR genotyping | Sigma | Amhr2-Cre | 5ʹ:CTCTGGTGTAGCTGATGATC 3ʹ:TAATCGCCATCTTCCAGCAG Predicted size: 380 nt |
| sequence-based reagent | Primer for PCR genotyping | Sigma | Rosa26CreERT2 | 5ʹ:CGTGATCTGCAACTCAGTC 3ʹ:AGGCAAATTTTGGTGTACGG Predicted size: 150 nt |
| sequence-based reagent | Primer for reverse-transcription (RT)-PCR | Sigma | Smad4 | 5ʹ:TCACAATGAGCTTGCATTCC 3ʹ:CCATCCACAGTCACAACAGG Predicted size: 143 nt |
| sequence-based reagent | Primer for reverse-transcription (RT)-PCR | Sigma | Cdh2 (N-cadherin) | 5ʹ:CCAGGAAAAGTGGCAGGTAG 3ʹ:CACTGTGCTTGGCAAGTTGT Predicted size: 121 nt |
| sequence-based reagent | Primer for reverse-transcription (RT)-PCR | Sigma | Notch2 | 5ʹ:GACCCTATCCTACCCTCTAGTG 3ʹ:AGCAGGATGAAGAACAGGATG Predicted size: 103 nt |
| sequence-based reagent | Primer for reverse-transcription (RT)-PCR | Sigma | Myo10 | 5ʹ:TCCAGACAGACTATGGGCAGG 3ʹ:GGAAGCCATGTCGTCCACG Predicted size: 109 nt |
| sequence-based reagent | Primer for reverse-transcription (RT)-PCR | Sigma | Fscn1 | 5ʹ:AGAACGCCAGCTGCTACTTT 3ʹ:CGAGGAATCACTACCCACCG Predicted size: 331 nt |
| sequence-based reagent | Primer for reverse-transcription (RT)-PCR | Sigma | Daam1 | 5ʹ:GCGGCTGCTCAGAGTATAGAAA 3ʹ:AAACATGGCTTCCCTGTGTTTG Predicted size: 273 nt |
| sequence-based reagent | Primer for reverse-transcription (RT)-PCR | Sigma | Rpl19 | 5ʹ:GAAATCGCCAATGCCAACTC 3ʹ:CTTCCCTATGCCCATATGCC Predicted size:147 nt |
| sequence-based reagent | RNA in situ hybridization probe | Advanced Cell Diagnostics | 857571 | Smad4, exon 8 |
| sequence-based reagent | RNA in situ hybridization probe | Advanced Cell Diagnostics | 310043 | Bacillus subtilis DapB |
| commercial assay or kit | Click-iT EdU Alexa Fluor 488 Imaging Kit | Molecular Probes | C10337 | In situ detection of DNA replication |
| commercial assay or kit | BaseScope Assay | Advanced Cell Diagmostics | 322337 | In situ detection of RNA |
| chemical compound, drug | 4-hydroxytamoxifen | Sigma | T176 | 1 µg/ml |
| chemical compound, drug | Phalloidin (Alexa Fluor 568) | Thermo Fisher | A12380 | 1:100 |
| chemical compound, drug | EdU | Thermo Fisher | C10337 | 100 μM |
| software, algorithm | Imaris | Bitplane | 9.7.2 | Image analysis |
Additional files
Download links
A two-part list of links to download the article, or parts of the article, in various formats.
Downloads (link to download the article as PDF)
Open citations (links to open the citations from this article in various online reference manager services)
Cite this article (links to download the citations from this article in formats compatible with various reference manager tools)
SMAD4 promotes somatic-germline contact during murine oocyte growth
eLife 13:RP91798.
https://doi.org/10.7554/eLife.91798.3


