Human HPSE2 gene transfer ameliorates bladder pathophysiology in a mutant mouse model of urofacial syndrome
- Division of Cell Matrix Biology and Regenerative Medicine, School of Biological Sciences, Faculty of Biology Medicine and Health, University of Manchester, United Kingdom
- Division of Pharmacy and Optometry, School of Health Sciences, Faculty of Biology Medicine and Health, University of Manchester, United Kingdom
- Manchester Centre for Genomic Medicine, Manchester University NHS Foundation Trust, Manchester Academic Health Science Centre, United Kingdom
- Division of Evolution Infection and Genomics, School of Biological Sciences, Faculty of Biology Medicine and Health, University of Manchester, United Kingdom
- Maternal & Fetal Medicine, EGA Institute for Women's Health, Faculty of Population Health Sciences, University College London, United Kingdom
- Wits/SAMRC Antiviral Gene Therapy Research Unit, Faculty of Health Sciences, University of the Witwatersrand, South Africa
Figures
Figure 1
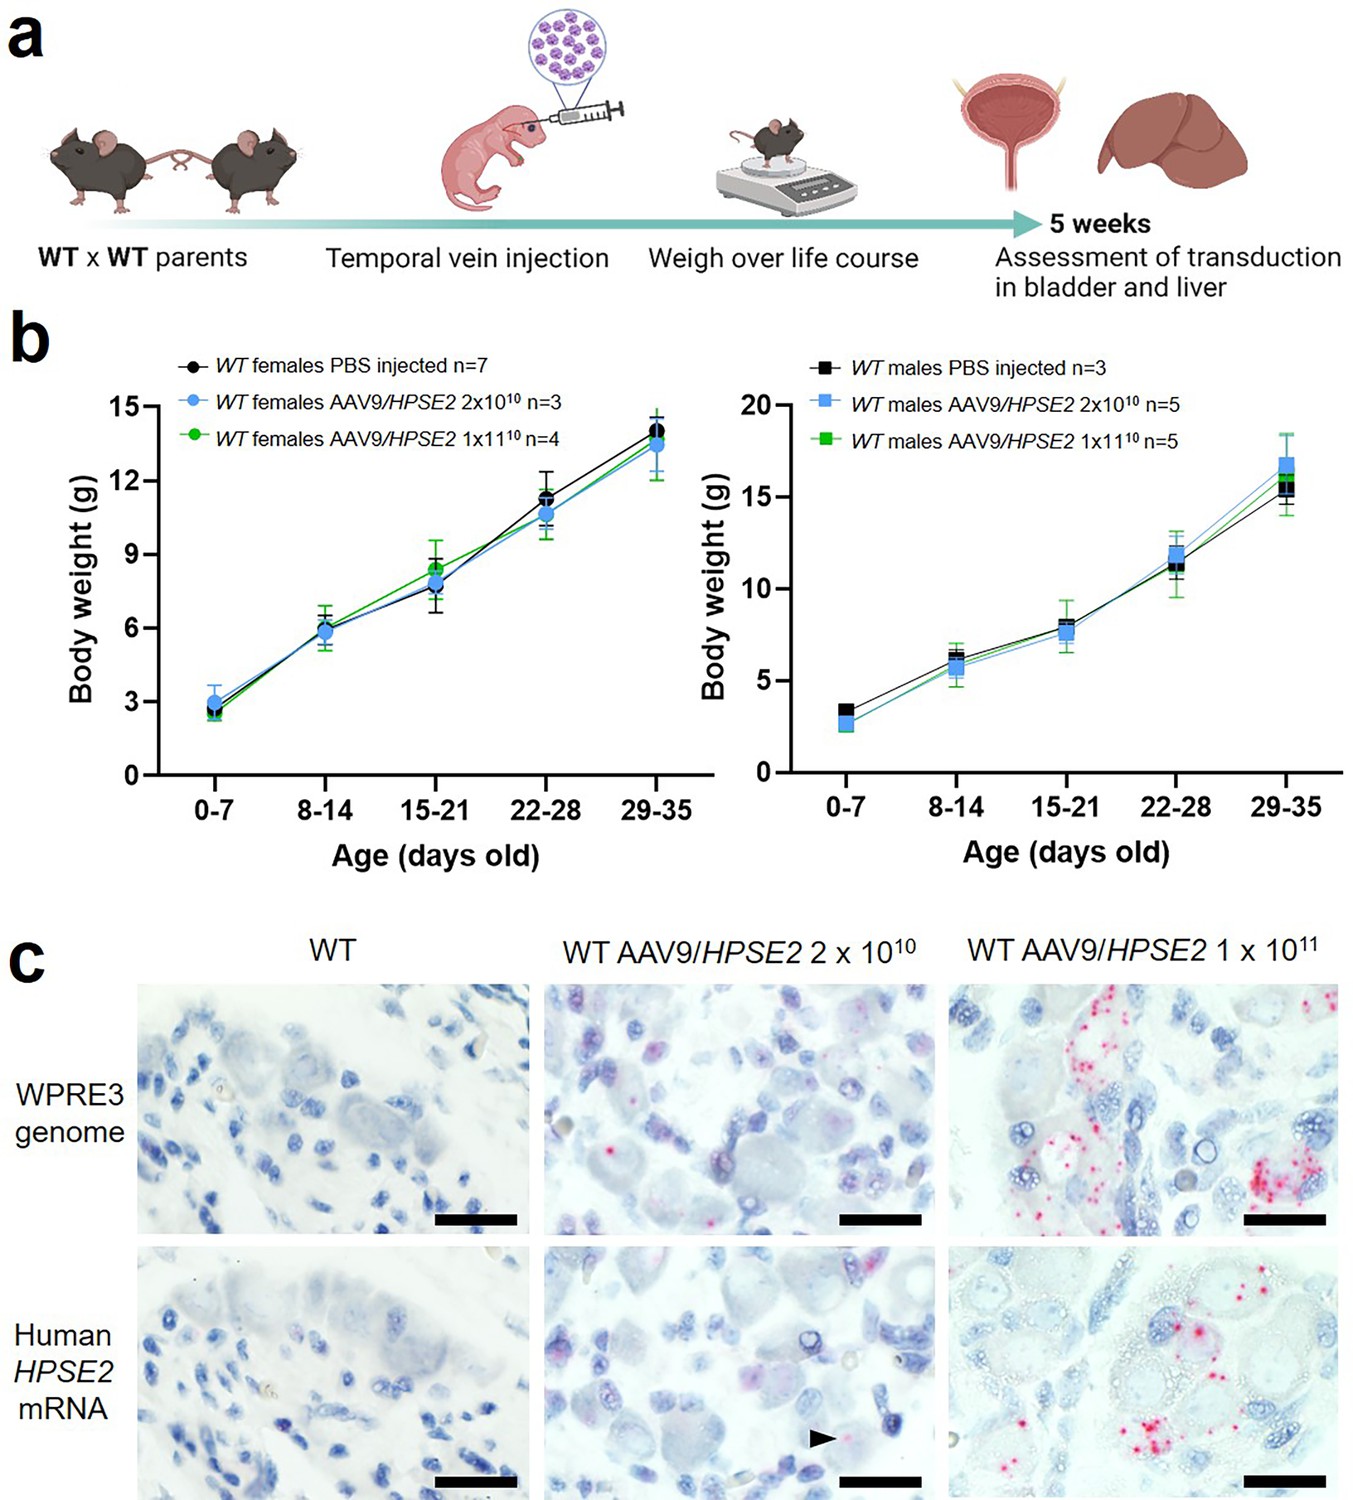
Administration of AAV9/HPSE2 to neonatal WT mice.
(a) Graphic of study design. The AAV9/HPSE2 vector genome consisting of flanking AAV2 ITR sequences, the ubiquitous CAG promoter, human HPSE2 coding sequence, and the WPRE3 sequence. A single dose (2 × 10¹⁰ or 1 × 10¹¹ genome copies) of AAV9/HPSE2 was administered to neonates via the temporal vein. Another group of mice received vehicle-only injections. Body weights were monitored, and bladders and livers were harvested for histology analyses at 5 weeks. (b) Whole body weights (g). No significant differences were found in growth trajectories comparing 2 × 10¹⁰ AAV9/HPSE2-injected mice with vehicle-only controls (two-way ANOVA); 1 × 10¹¹ AAV9/HPSE2-injected compared with vehicle-only injected controls; and lower dose compared with higher dose AAV9/HPSE2-injected mice. (c) BaseScope in situ hybridization (ISH) of the pelvic ganglia. Histology sections are counterstained so that nuclei appear blue. Images are representative of ganglia from three mice in each experimental group. WPRE3 genomic sequence and human HPSE2 transcripts were not detected in the pelvic ganglia of WT mice injected with vehicle-only (left panel). In contrast, positive signals (red dots) for each probe were detected in the pelvic ganglia of WT mice administered either 2 × 10¹⁰ (arrow head) or 1 × 10¹¹ AAV9/HPSE2. For quantification of positive signals, see ‘Results’. Bars are 20 μm.
© 2024, BioRender Inc. Figure 1a was created using BioRender, and is published under a CC BY-NC-ND 4.0. Further reproductions must adhere to the terms of this license.
Figure 2
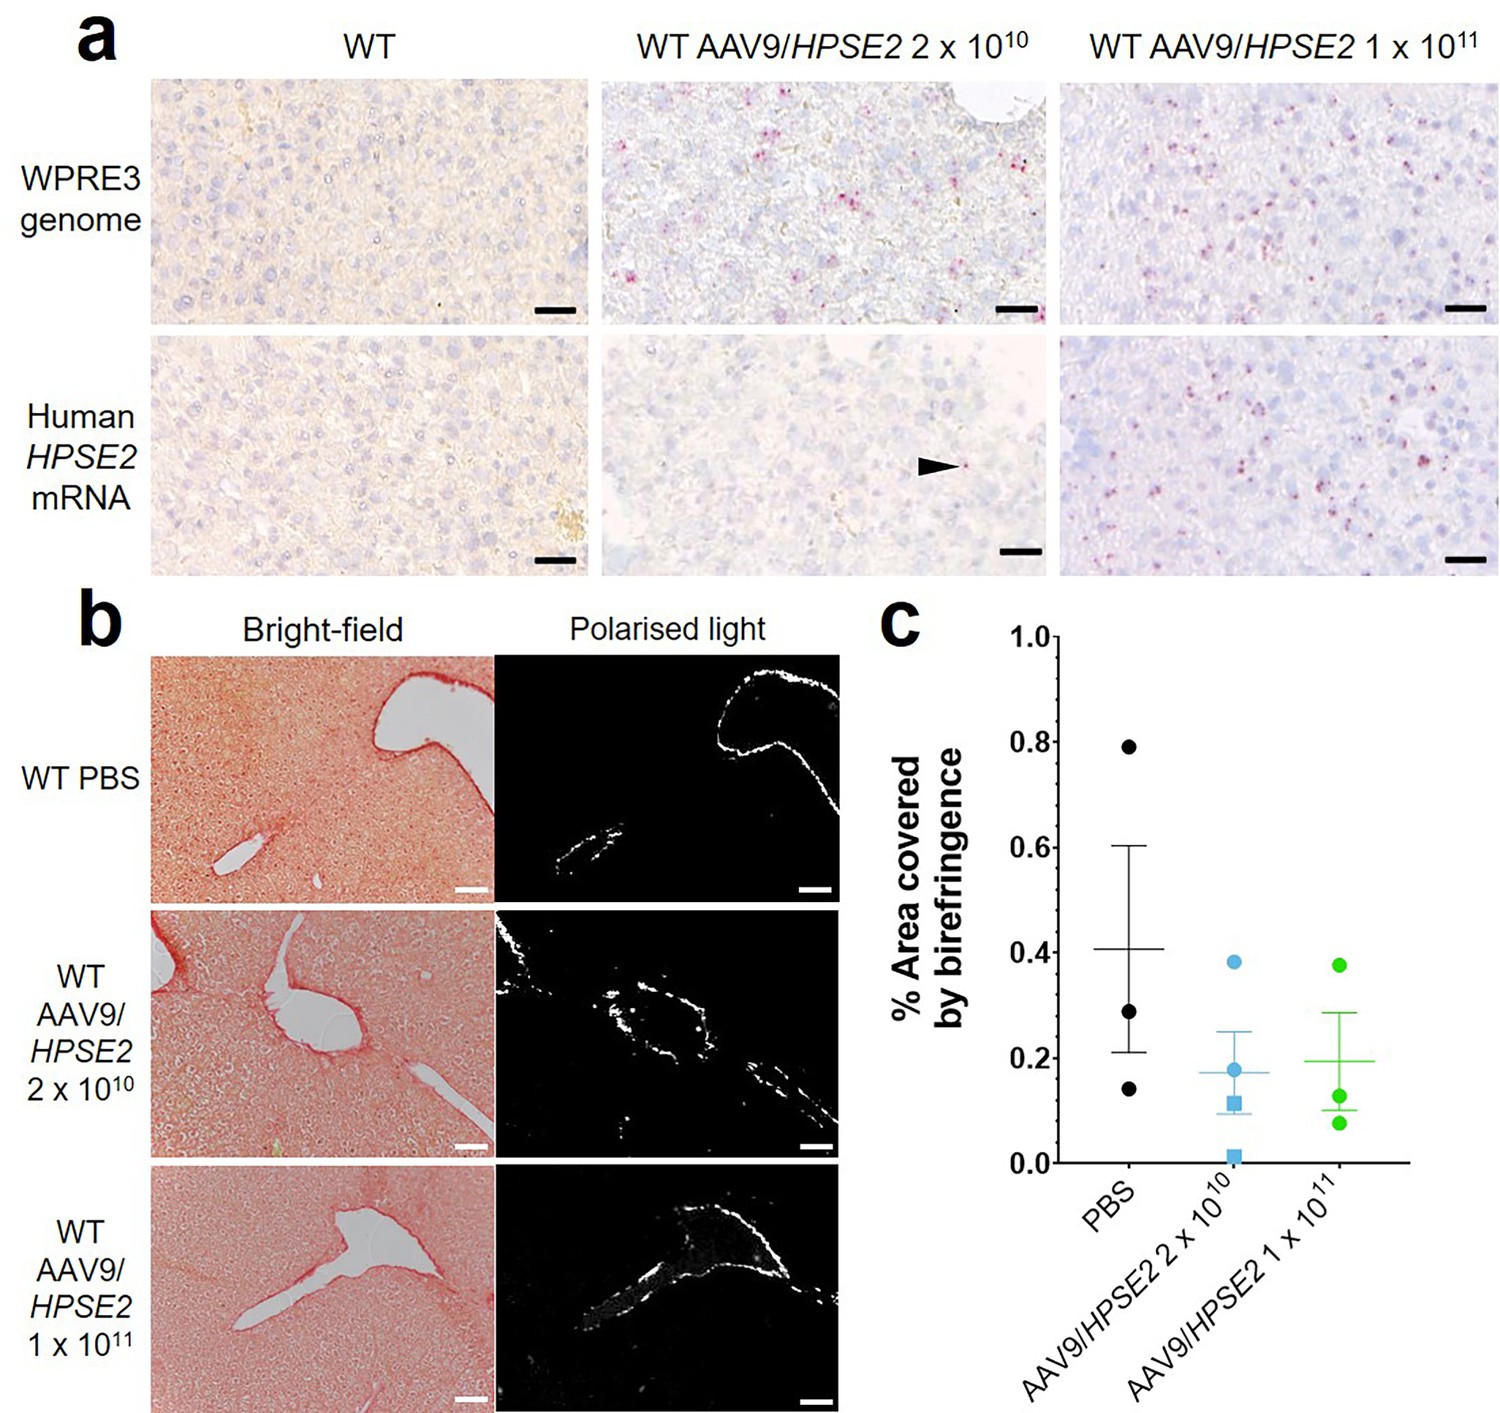
Histology of livers of 5-week-old WT mice that had been administered AAV9/HPSE2 as neonates.
In each experimental group, livers from three mice were examined, and representative images are shown. (a) BaseScope in situ hybridization (ISH) analyses of livers, with positive signals appearing as red dots. Nuclei were counterstained with haematoxylin. Note the absence of signal for WPRE3, part of the AAV9/HPSE2 genomic cargo, in mice administered PBS only. In contrast, WPRE3 signal was evident in livers of mice that had received a single dose of 2 × 10¹⁰ or 1 × 10¹¹ genome copies. Regarding human HPSE2 transcripts, none were detected in the PBS-only livers. Only sparse signals were noted in livers of mice administered the lower AAV dose (arrow head) but the signal for HPSE2 was prominent in livers of mice administered the higher dose. See the text for quantification of signals. (b) PSR staining to seek collagen imaged under direct light (left column) and polarized light (right column). (c) There was no significant difference in extent of birefringence between the three groups. Black bars are 30 μm, white are 200 μm.
Figure 3
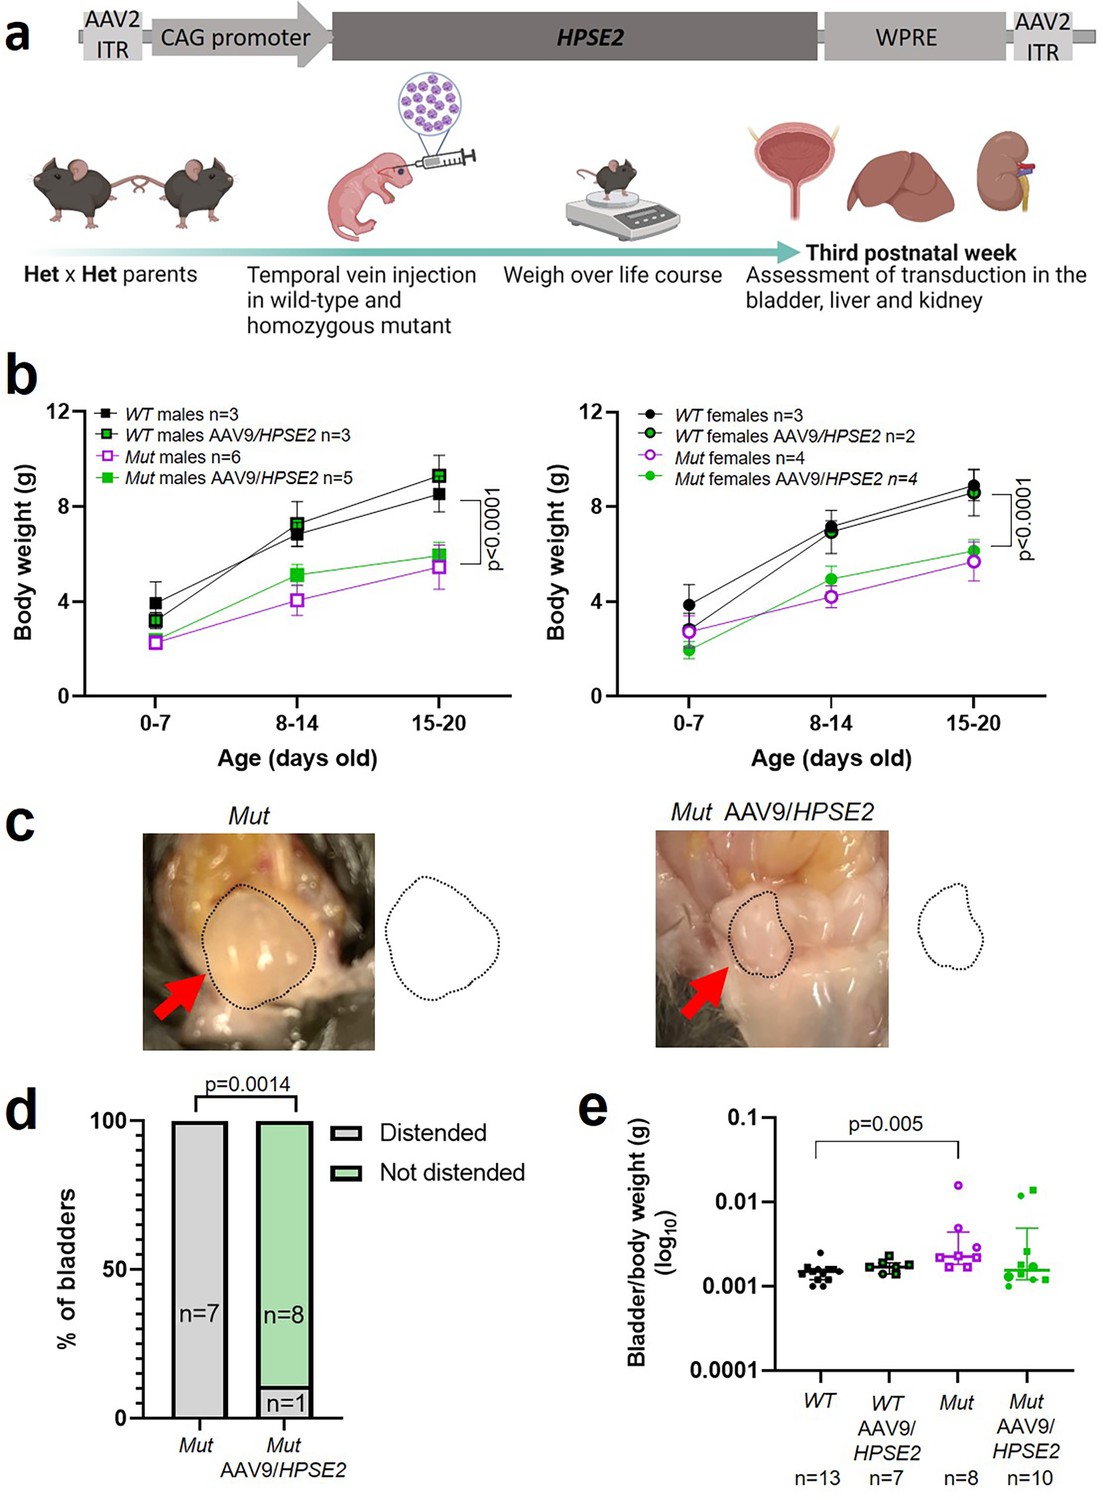
Administration of AAV9/HPSE2 to neonatal mice.
(a) Graphic of therapy study design, with schematic of AAV9/HPSE2 vector genome. Heterozygous Hpse2 parents were mated to generate litters and neonates were genotyped, with WT and Mut offspring used in the study. Some baby mice were not administered the viral vector while others were intravenously administered 1 × 10¹¹ AAV9/HPSE2. Mice were weighed regularly, and in the third week of postnatal life they were culled and autopsies undertaken to determine whether or not bladders appeared distended with urine. Livers and kidneys were harvested for histology analyses. Bladders were harvested and used either for histology analyses or for ex vivo myography. (b) Body weights (g; mean ± SD). Results were analysed with two-way ANOVA. As expected, body growth was impaired in Mut mice that had not received the viral vector compared with sex-matched WT mice that did not receive the vector. There was no significant difference in the body growth of Mut mice that either had or had not received AAV9/HPSE2. (c) Examples at autopsy of a distended bladder in a Mut mouse that had not received the viral vector, and a not-distended bladder in a Mut that had been administered AAV9/HPSE2 as a neonate. Bladder size indicated by dotted line. (d) Untreated Mut mice had distended bladders on autopsy more often than Mut mice that had received AAV9/HPSE2 (Fisher’s exact test). (e) Untreated Mut mice had significantly higher empty bladder/whole body weight ratios than untreated WT mice (Kruskal–Wallis test). While viral vector-administered Mut mice tended to have higher empty bladder/whole body weight ratios than WT mice, this was not statistically significant.
© 2024, BioRender Inc. Figure 3a was created using BioRender, and is published under a CC BY-NC-ND 4.0. Further reproductions must adhere to the terms of this license.
Figure 4
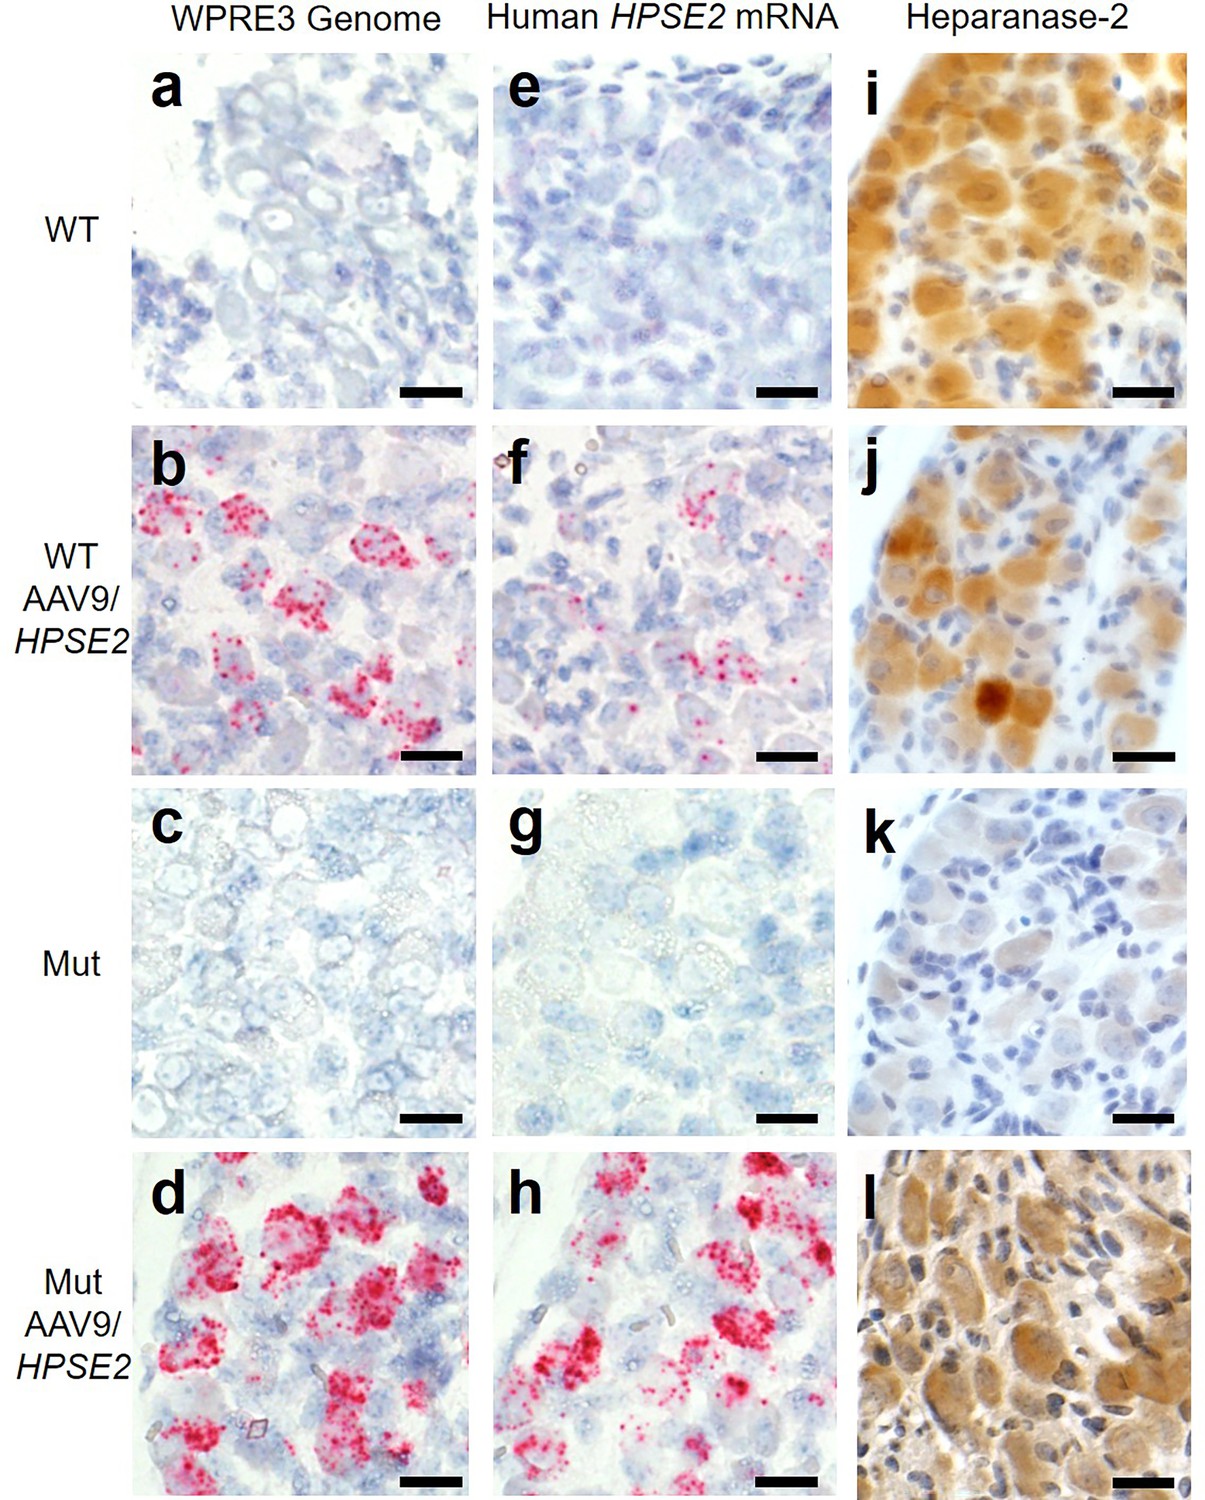
Pelvic ganglia histology in the third week of life.
BaseScope probes were applied for the WPRE3 genomic sequence (a–d) and for human HPSE2 transcripts (e–h). Other sections were reacted with an antibody to heparanase-2 reactive both human and mouse proteins (i–l). The four experimental groups were WT mice that were not administered the viral vector (a, e, i); WT mice that had been administered 1 × 10¹¹ AAV9/HPSE2 as neonates (b, f, j); Mut mice that were not administered the viral vector (c, g, k); and Mut mice that had been administered 1 × 10¹¹ AAV9/HPSE2 as neonates (d, h, l). In each group, ganglia from three mice were examined, and representative images are shown. Sections were counterstained with haematoxylin (blue nuclei). Note the absence of BaseScope signals in both WT and Mut mice that had not received the viral vector. In contrast, ganglia from WT or Mut mice that were administered AAV9/HPSE2 displayed signals for both WPRE3 and HPSE2. Note that the signals appeared prominent in the large cell bodies which are postganglionic neurons; signals were rarely noted in the small support cells between the neural cell bodies. See text for quantification of signals. Immunostaining for heparanase-2 showed a positive (brown) signal in all groups apart from ganglia from Mut mice that had not been administered the viral vector; those cells had only a faint background signal. Bars are 20 μm.
Figure 5
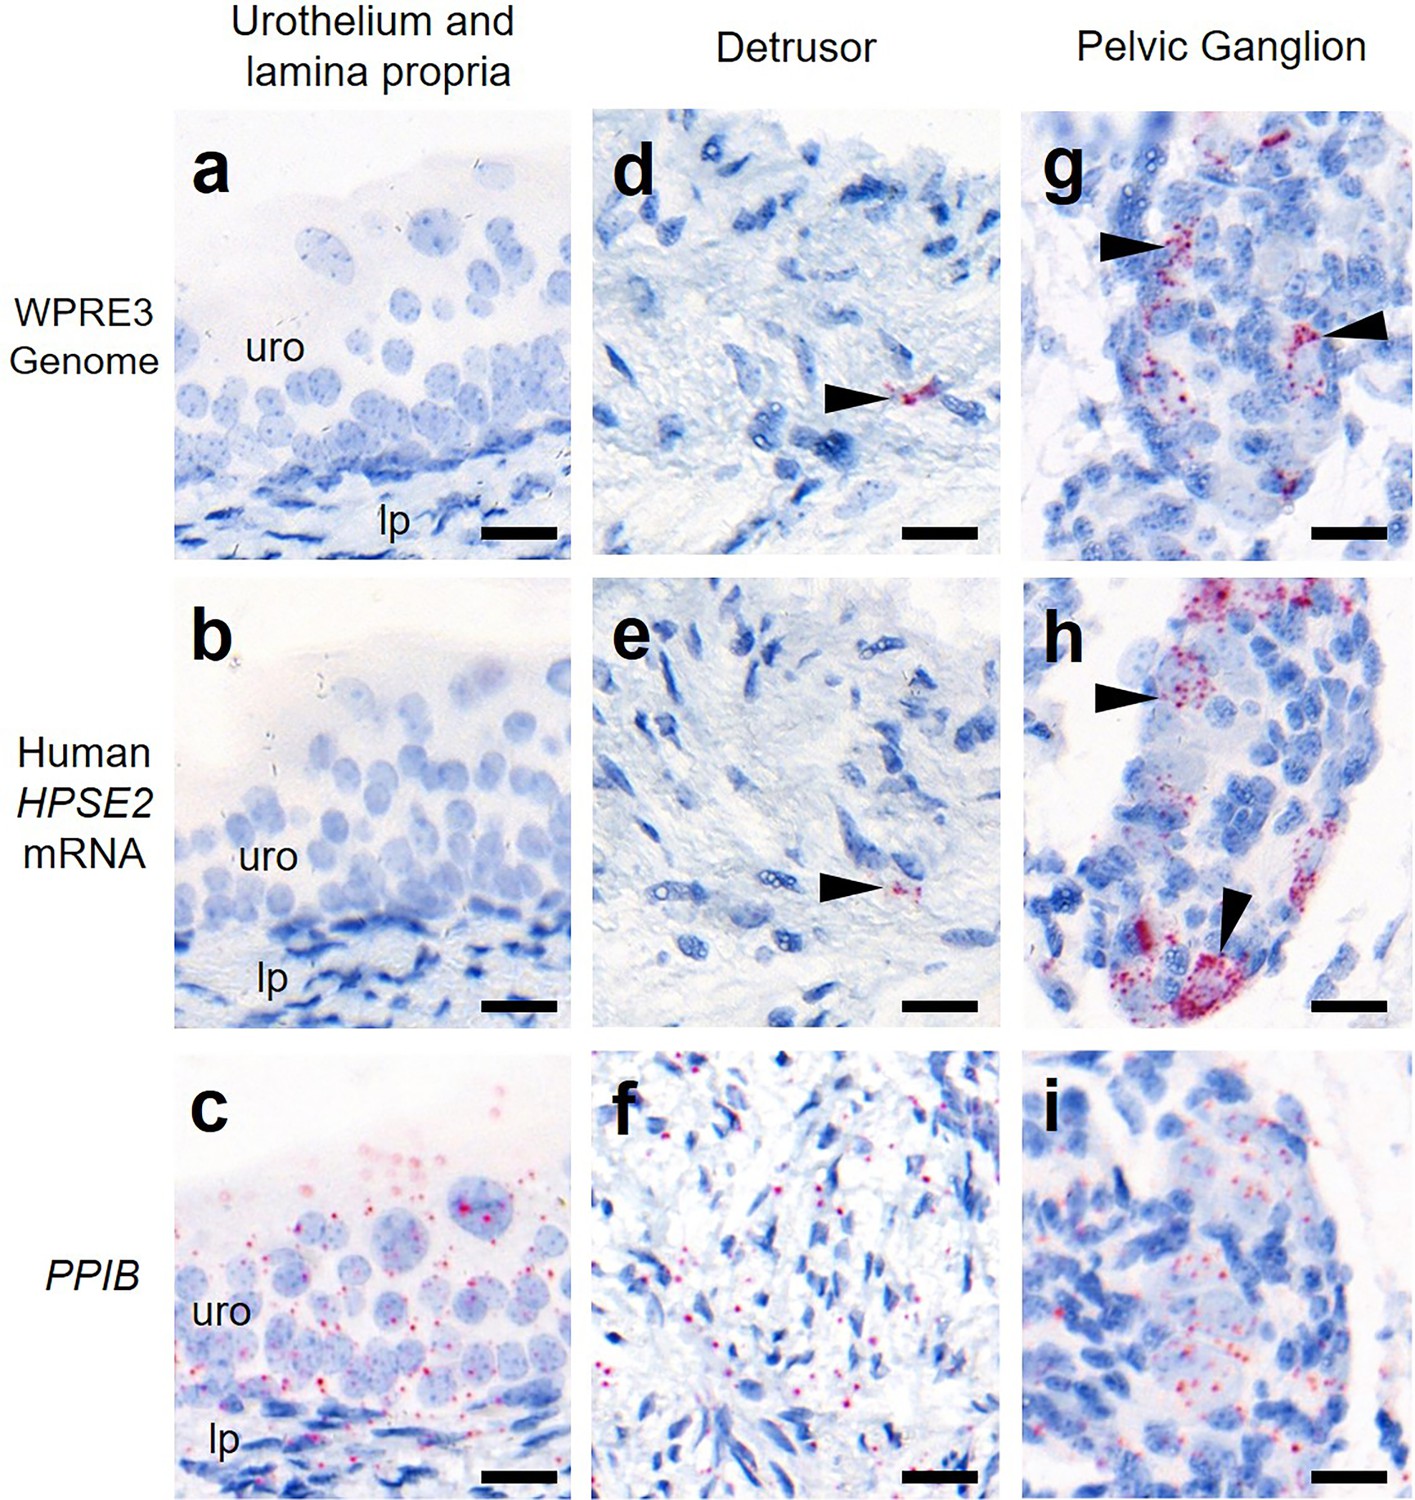
Bladder body histology in the third week of life.
BaseScope in situ hybridization (ISH) analyses of bladder tissue from AAV9/HPSE2 administered Hpse2 mutant mice. Images are representative of three mice examined in this manner. Positive signals appear as red dots and nuclei were counterstained with haematoxylin for the bladder urothelium (uro) and lamina propria (lp) (a–c), detrusor smooth muscle layer (d–f), and pelvic ganglia body (g–i). BaseScope probes were applied for the WPRE3 genomic sequence (a, d, g), human HPSE2 transcripts (b, e, h), and a positive control transcript, PPIB (c, f, i). Note the absence of BaseScope signals for WPRE3 and HPSE2 in the urothelium and lamina propria. There were rare isolated foci of staining in the detrusor layer (indicated by the arrowheads in d and e) and abundant staining in the pelvic ganglion (arrowheads in g and h). In contrast, note the widespread expression patterns of the positive control transcript in all tissue types. Scale bars are 20 μm.
Figure 6
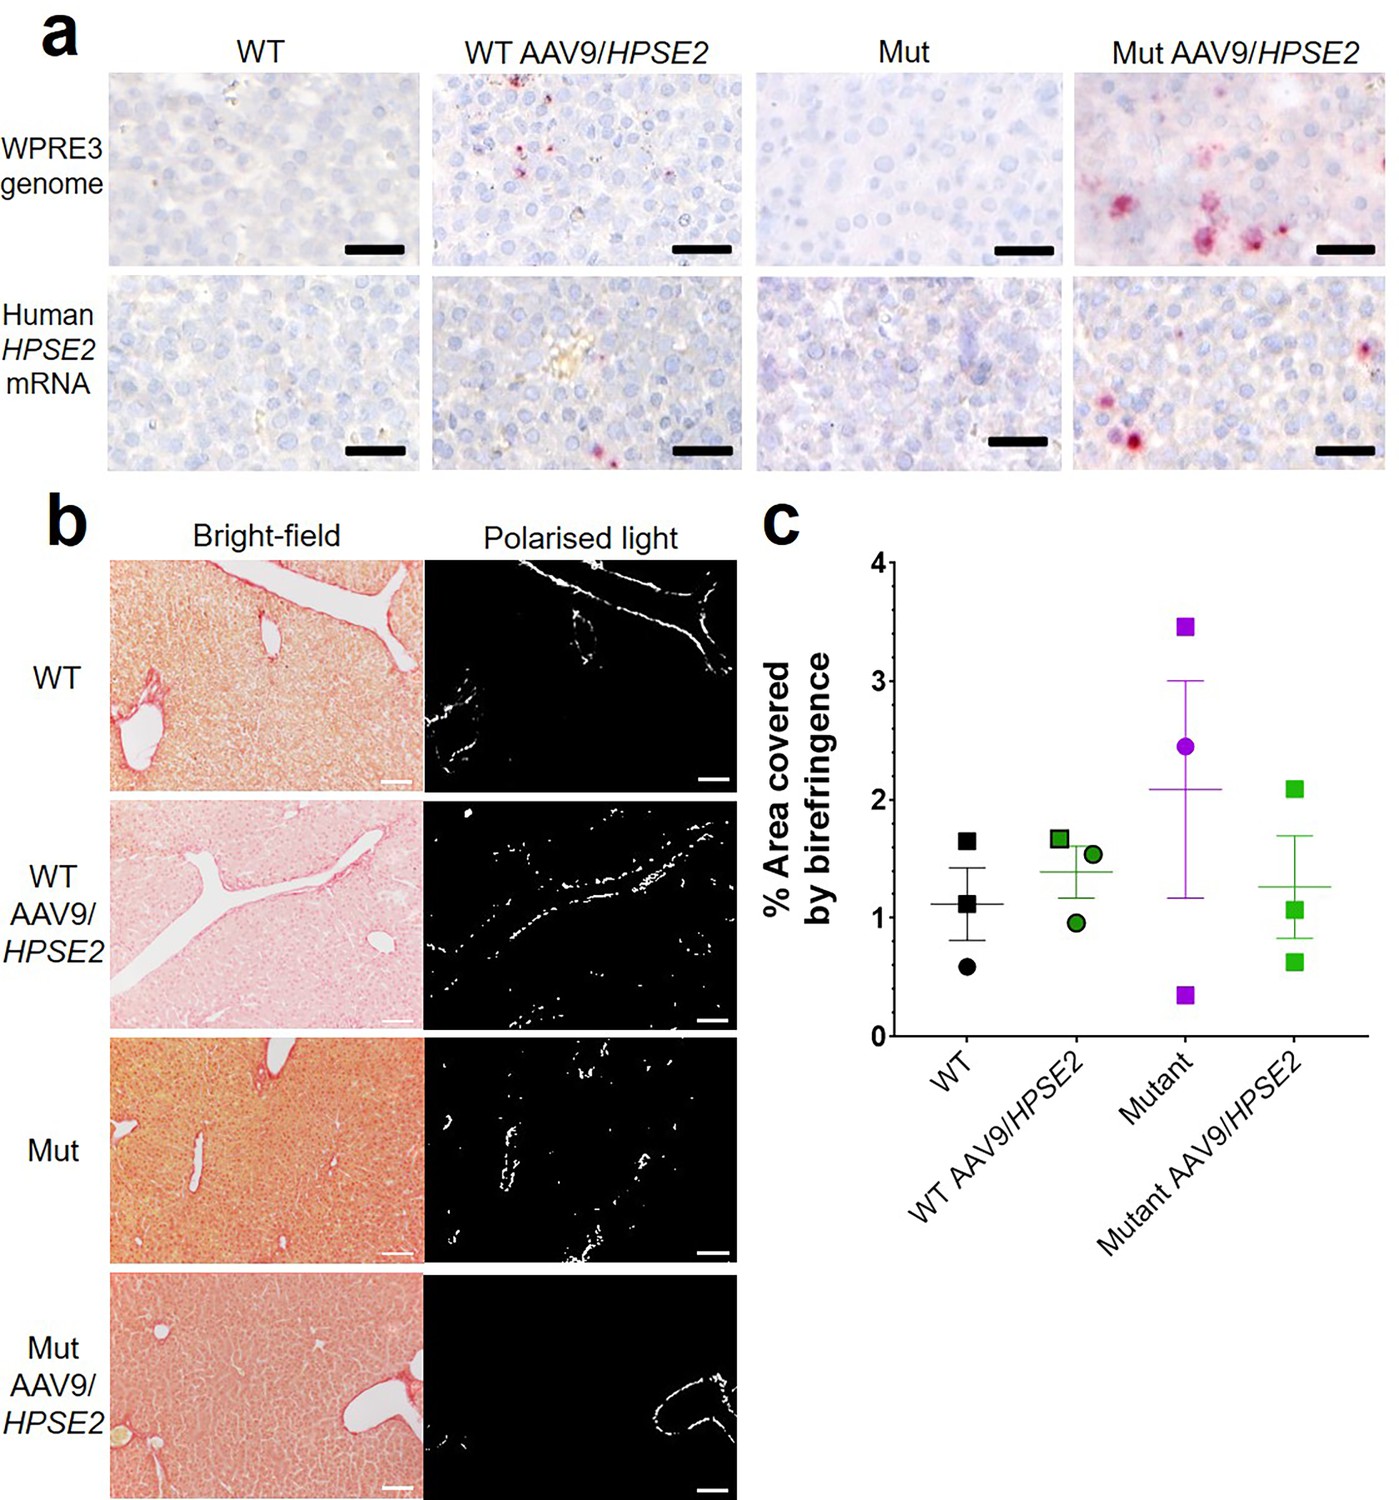
Liver histology in the third week of life.
The four experimental groups were WT mice that were not administered the viral vector; WT mice that had been administered the viral vector; Mut mice that were not administered the viral vector; and Mut mice that had been administered AAV9/HPSE2 as neonates. In each group, livers from three mice were examined, and representative images are shown. (a) BaseScope in situ hybridization (ISH) analyses of livers, with positive signals appearing as red dots. Nuclei were counterstained with haematoxylin. The vector genome sequence WPRE3 and HPSE2 transcripts were detected in the livers of WT and Mut mice that had been administered AAV9/HPSE2. See text for quantification. (b) PSR staining to seek collagen imaged under direct light (left column) and polarized light (right column). (c) There was no significant difference in extent of birefringence between the four groups. Black bars are 30 μm, white are 200 μm.
Figure 7
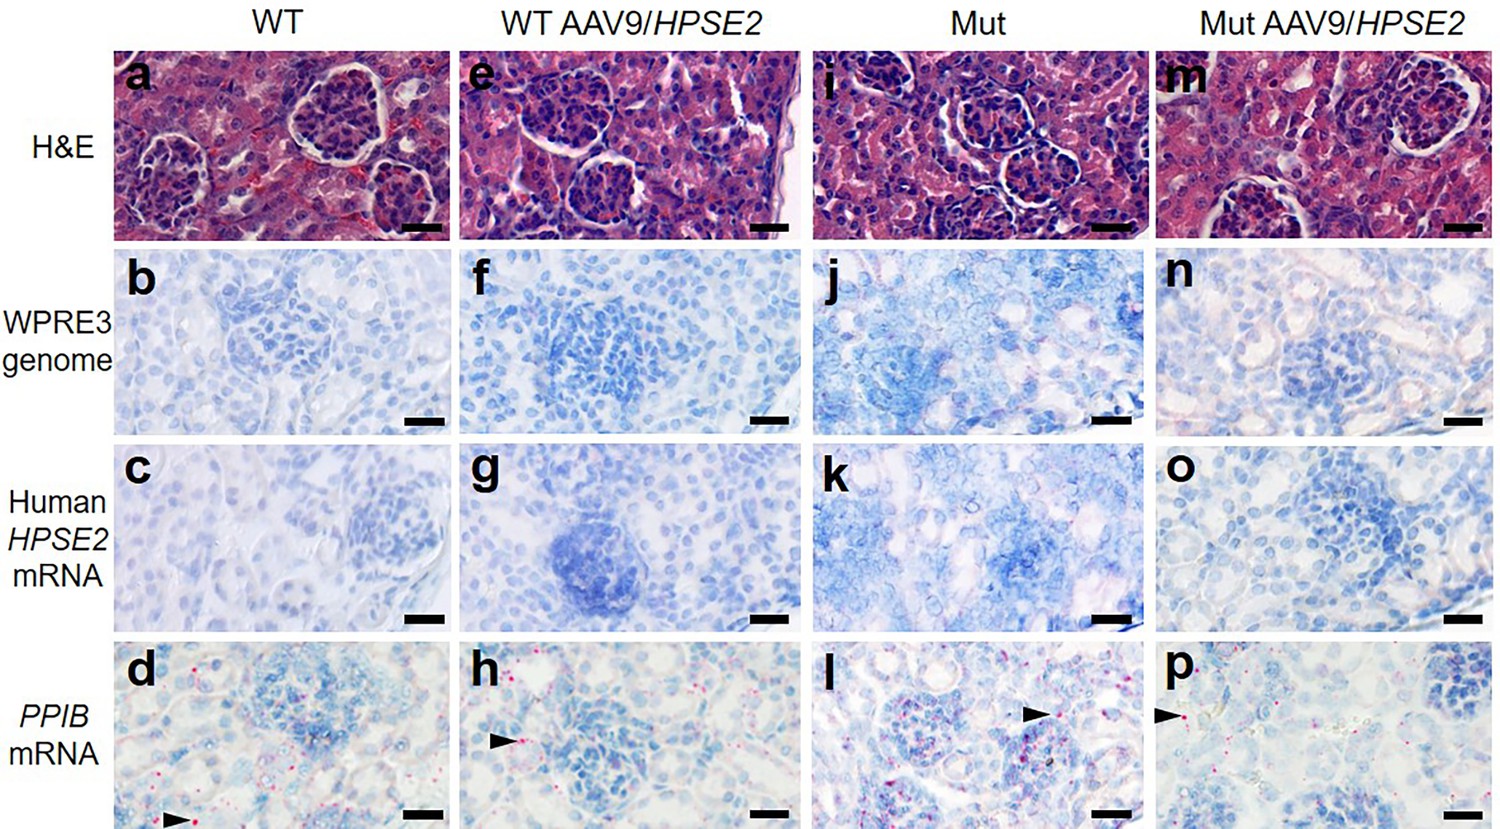
Kidney histology in the third week of life.
The four experimental groups were WT mice that were not administered the viral vector (a–d); WT mice that had been administered 1 × 10¹¹ AAV9/HPSE2 as neonates (e–h); Mut mice that were not administered the viral vector (i–l); and Mut mice that had been administered 1 × 10¹¹ AAV9/HPSE2 as neonates (m–p). In each group, kidneys from three mice were examined, and representative images are shown. Some sections were stained with haematoxylin and eosin (a, e, I, m) with similar appearances of glomeruli and tubules in all four groups. BaseScope probes were applied for the WPRE3 genomic sequence (b, f, j, n) and for human HPSE2 transcripts (c, g, k, o). Note the absence of BaseScope signals for WPRE3 and HPSE2 in all four groups. In contrast, signals (red dots) were noted after application of a BaseScope probe for the house-keeping transcript PPIB (d, h, l, p) as shown by the arrowheads. Bars are 20 μm.
Figure 8
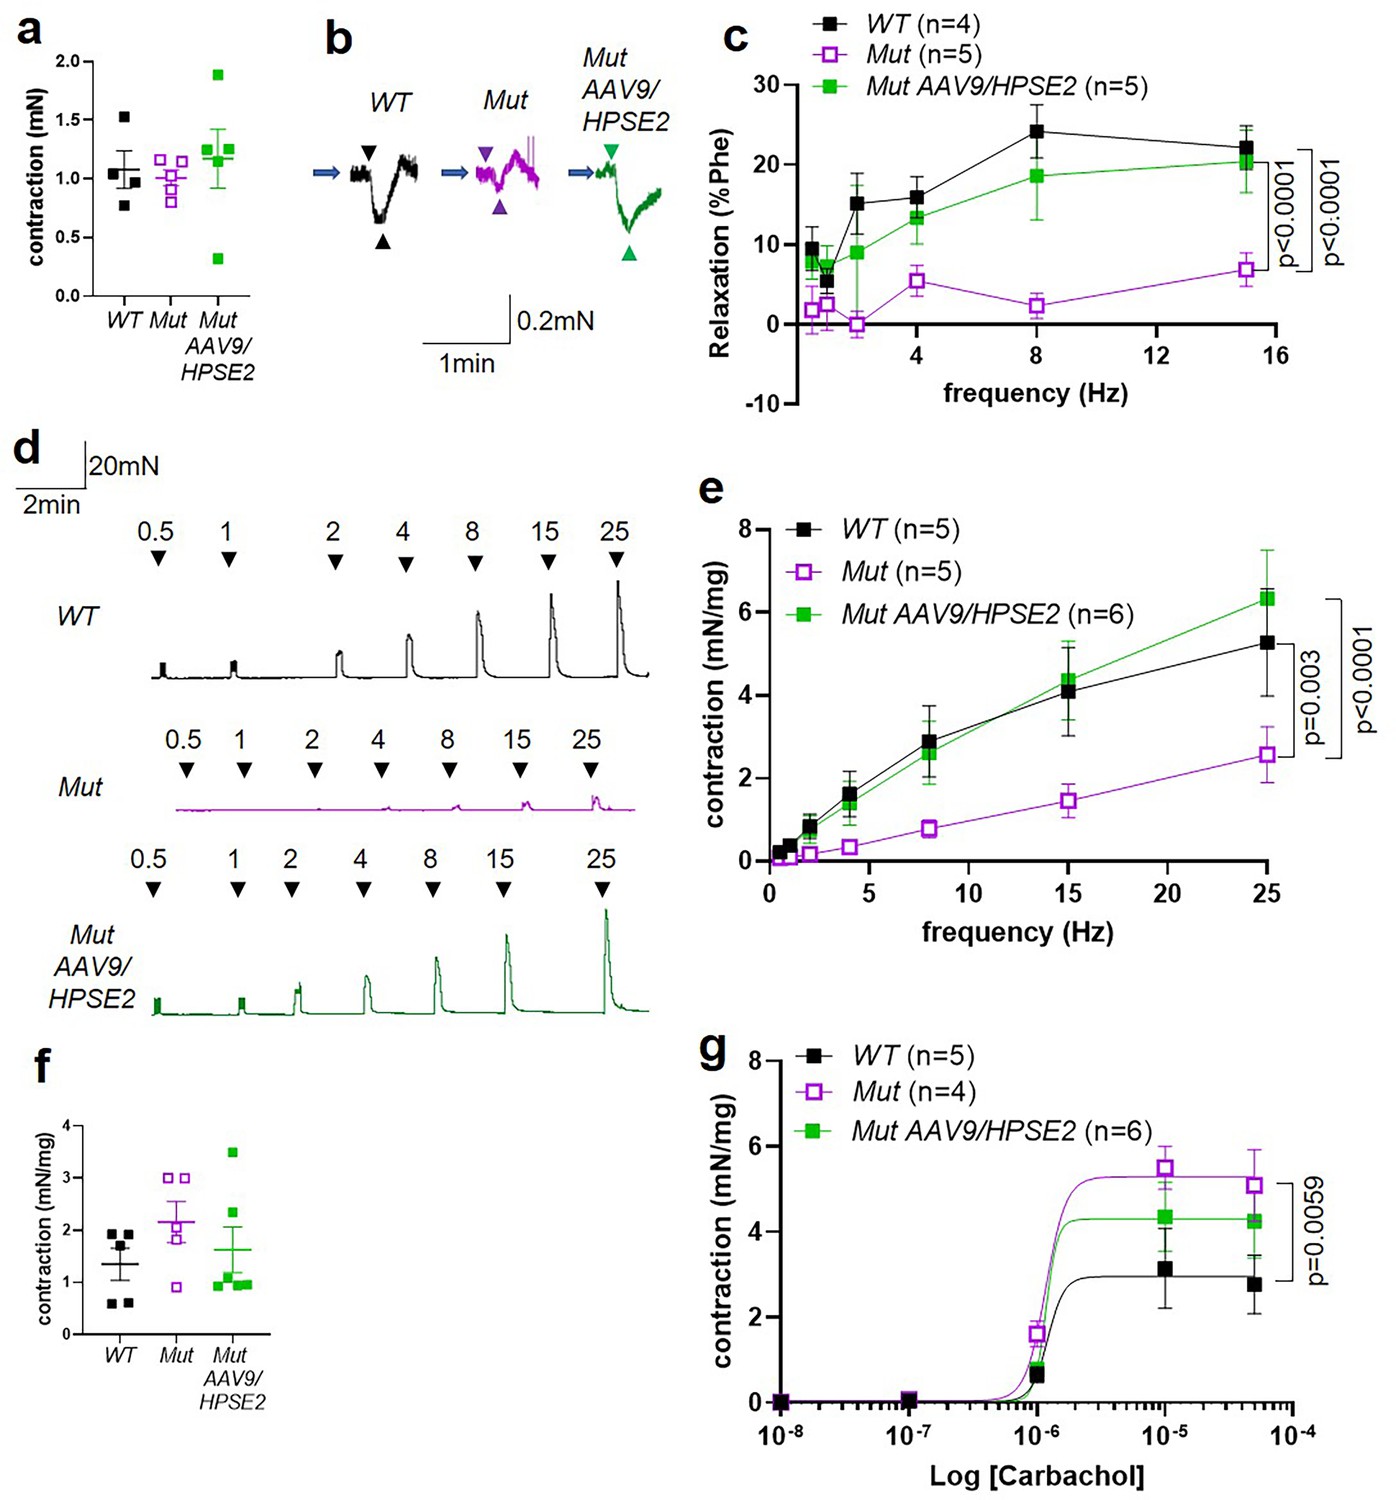
Ex vivo myography in males.
(a–c) are bladder outflow tracts and (d–g) are bladder body rings. (a) Amplitudes of contraction evoked by 50 mM KCl in male WT (n = 4), Mut (n = 5) and Mut AAV9/HPSE2 (n = 5) outflow tracts. (b) Representative traces of relaxation evoked in WT, Mut, and Mut AAV9/HPSE2 outflow tracts in response to electrical field stimulation (EFS) at 8 Hz, with arrowheads indicating the start and end of stimulation. (c) Relaxations (mean ± SEM) evoked by EFS, plotted as a function of frequency in WT (n = 4), Mut (n = 5), and Mut AAV9/HPSE2 (n = 5) outflow tracts. (d) Representative traces of contractions evoked in WT, Mut, and Mut AAV9/HPSE2 bladder body rings in response to EFS at the frequencies indicated. (e) Amplitude of contractions (mean ± SEM) evoked by EFS in bladders from WT (n = 5), Mut (n = 5), and Mut AAV9/HPSE2 (n = 6) mice plotted as a function of frequency. (f) Amplitudes of contraction evoked by 50 mM KCl in WT (n = 5), Mut (n = 5), and Mut AAV9/HPSE2 (n = 6) bladders. (g) Contraction (mean ± SEM) of bladder rings from WT (n = 5), Mut (n = 4), and Mut AAV9/HPSE2 (n = 6) mice in response to cumulative application of 10 nM to 50 µM carbachol, plotted as a function of carbachol concentration. Curves are the best fits of the Hill equation with EC50 = 1.21 µM and Emax = 2.96 mN/mg in WT mice compared with EC50 = 1.20 µM and Emax = 5.30 mN/mg for Mut mice and EC50 = 1.17 µM and Emax = 4.3 mN/mg in Mut AAV9/HPSE2 mice. comparing WT and Mut by two-way ANOVA with repeated measures.
Figure 9
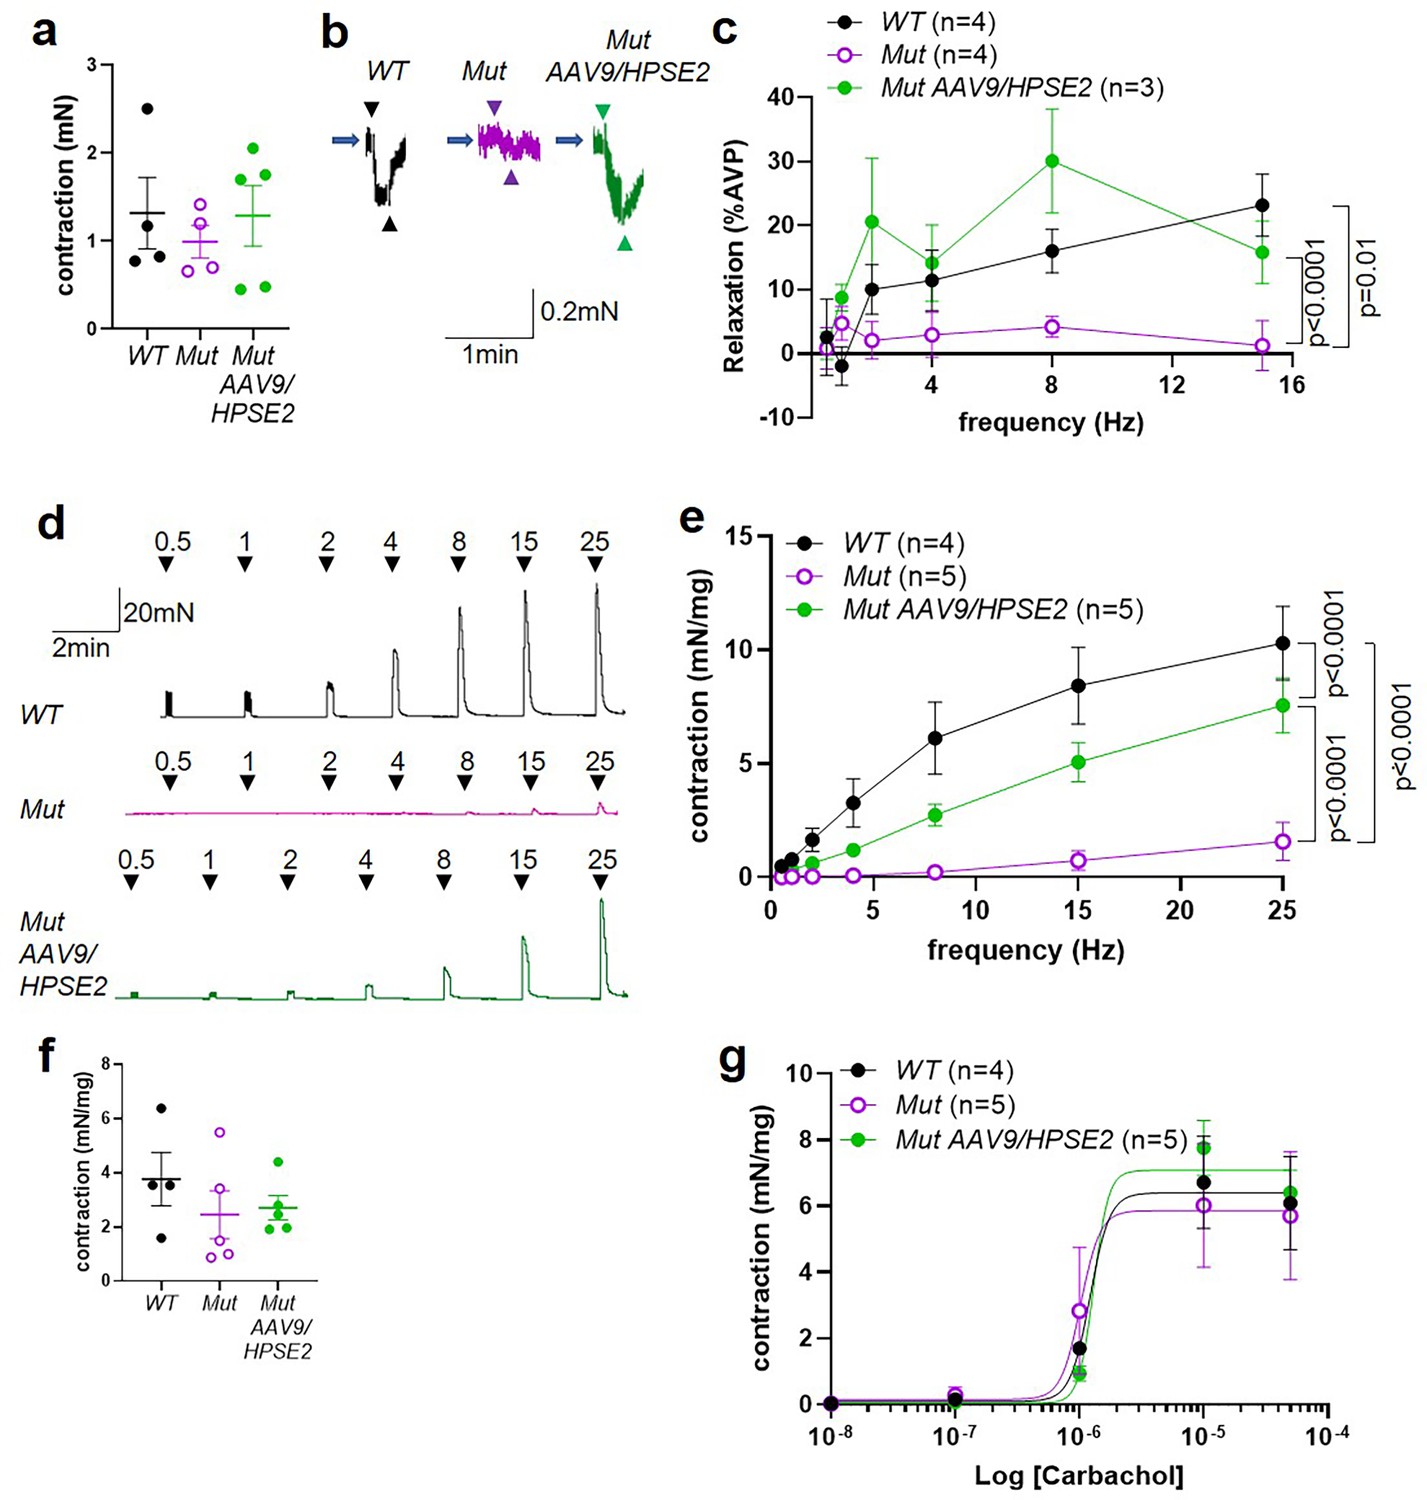
Ex vivo myography in females.
(a–c) are outflow tracts and (d–g) are bladder body rings. (a) Amplitudes of contraction (mean ± SEM) evoked by 50 mM KCl in female WT (n = 4), Mut (n = 4), and Mut AAV9/HPSE2 (n = 5) outflow tracts. (b) Representative traces of relaxation evoked in female WT, Mut, and Mut AAV9/HPSE2 vasopressin pre-contracted outflow tracts in response to electrical field stimulation (EFS) at 8 Hz. Arrowheads indicate the start and the end of stimulation. (c) Relaxations (mean ± SEM) evoked by EFS, plotted as a function of frequency in female WT (n = 4), Mut (n = 4), and Mut AAV9/HPSE2 (n = 3) outflows. (d) Representative traces of contraction evoked in female WT, Mut, and Mut AAV9/HPSE2 bladder body rings in response to EFS at the frequencies indicated. (e) Amplitude of contraction (mean ± SEM) evoked by EFS in bladder body rings from WT (n = 4), Mut (n = 5), and Mut AAV9/HPSE2 (n = 5) mice plotted as a function of frequency. (f) Amplitudes of contraction evoked by 50 mM KCl in female WT (n = 4), Mut (n = 5), and Mut AAV9/HPSE2 (n = 5) bladders. (g) Contraction of bladder rings (mean ± SEM) from WT (n = 4), Mut (n = 5), and Mut AAV9/HPSE2 (n = 5) mice in response to cumulative application of 10 nM to 50 µM carbachol, plotted as a function of carbachol concentration. Curves are the best fits of the Hill equation with EC50 = 1.22 µM and Emax = 6.40 mN/mg in WT mice compared with EC50 = 1.02 µM and Emax = 5.86 mN/mg for Mut mice and EC50 = 1.30 µM and Emax = 7.08 mN/mg in Mut AAV9/HPSE2 mice.
Additional files
Download links
A two-part list of links to download the article, or parts of the article, in various formats.
Downloads (link to download the article as PDF)
Open citations (links to open the citations from this article in various online reference manager services)
Cite this article (links to download the citations from this article in formats compatible with various reference manager tools)
Human HPSE2 gene transfer ameliorates bladder pathophysiology in a mutant mouse model of urofacial syndrome
eLife 13:RP91828.
https://doi.org/10.7554/eLife.91828.3


