Sensitization of meningeal afferents to locomotion-related meningeal deformations in a migraine model
- Department of Anesthesia, Critical Care and Pain Medicine, Beth Israel Deaconess Medical Center, Harvard Medical School, United States
- Division of Endocrinology, Diabetes, and Metabolism, Department of Medicine, Beth Israel Deaconess Medical Center, Harvard Medical School, United States
- Department of Neurobiology, Harvard Medical School, United States
Figures
Figure 1 with 3 supplements
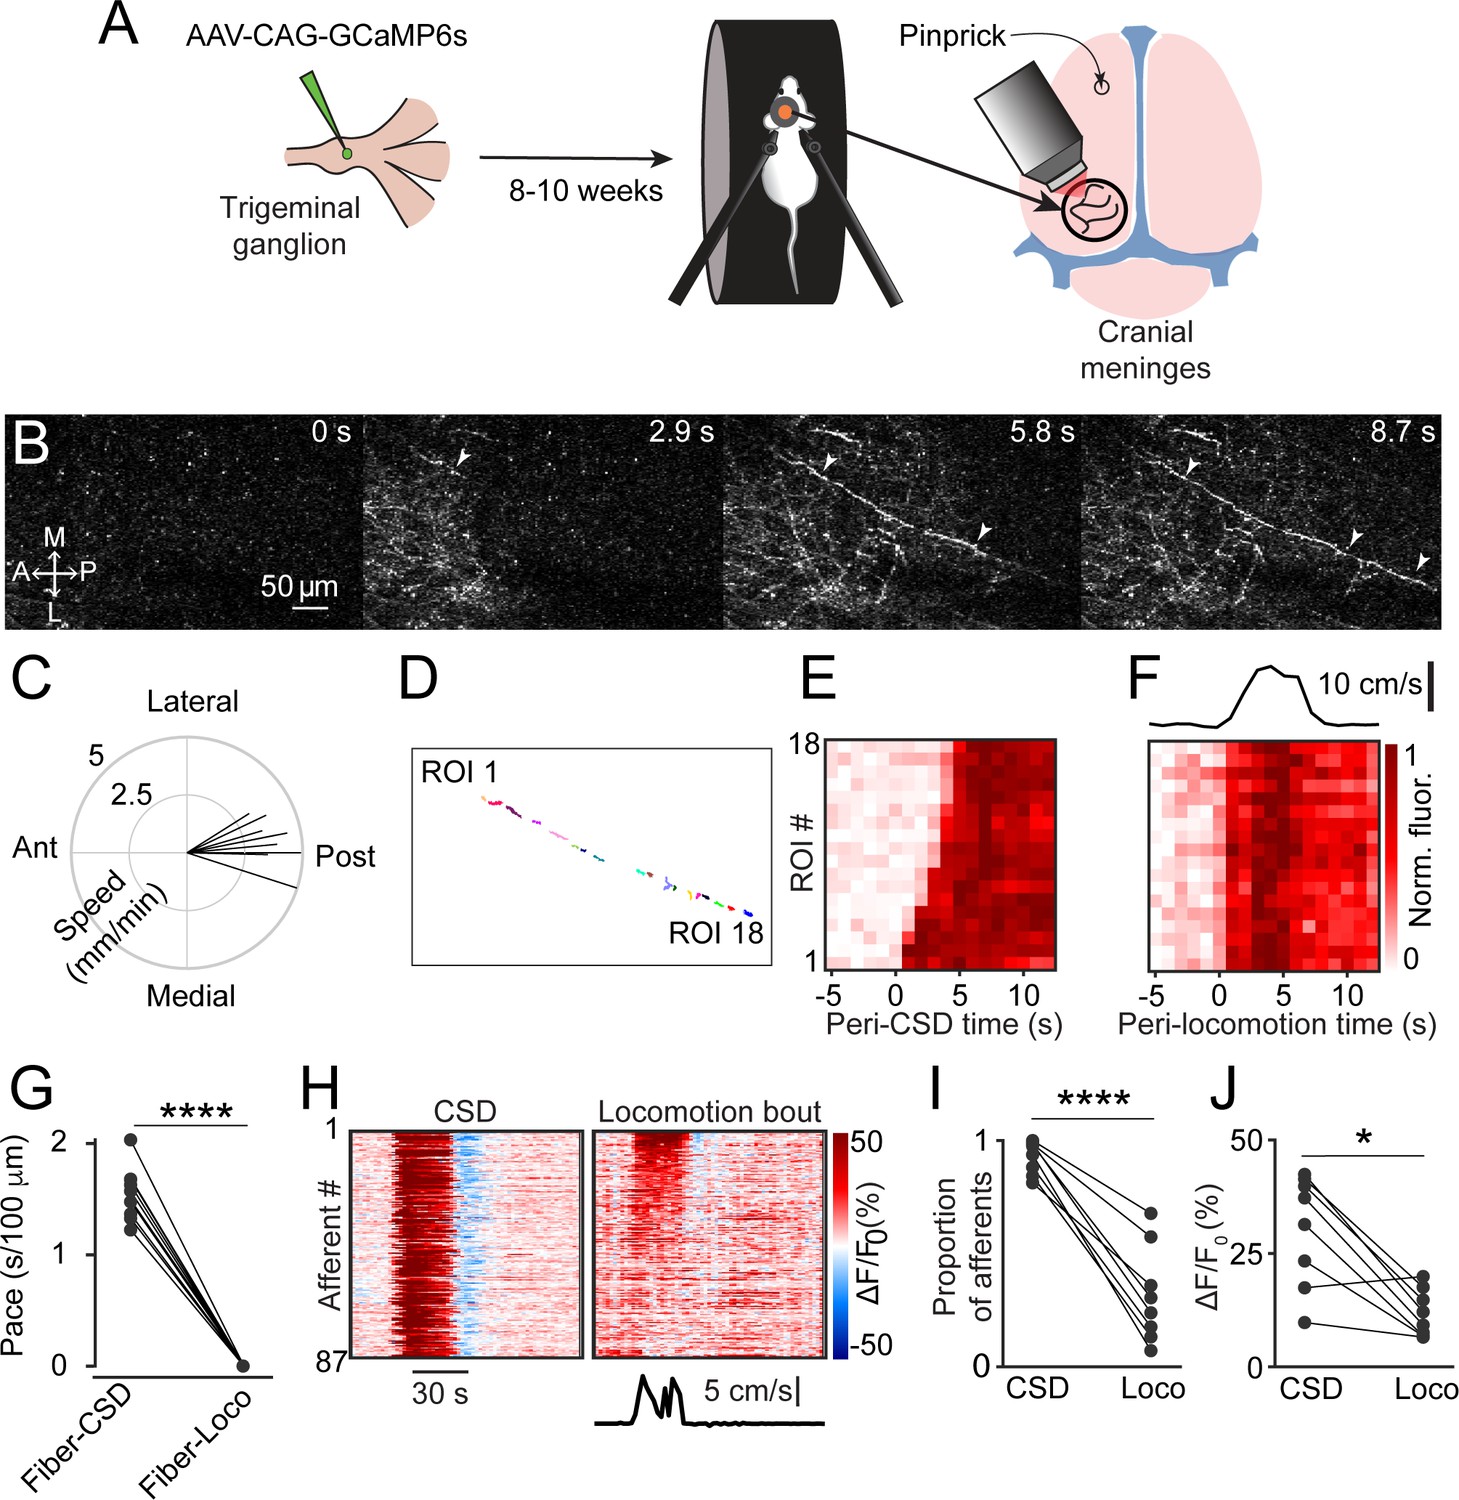
Cortical spreading depolarization (CSD) drives wave-like calcium activity in meningeal afferents.
(A) Mice received a trigeminal ganglion injection of an AAV to express GCaMP6s in trigeminal meningeal afferents. After 8–10 weeks, following the implantation of a headpost and a cranial window, mice were habituated to head restraint and subjected to two-photon calcium imaging while head-fixed on a running wheel to study the effect of pinprick-triggered CSD on the activity of meningeal afferents. (B) Example of a CSD-associated meningeal calcium wave that spreads across the field of view (FOV), with local segments of long afferent fibers becoming sequentially activated as the wave progresses (arrowheads). M: medial, L: lateral, A: anterior, P: posterior. (C) Summary of speed and direction of CSD-associated meningeal calcium waves, typically from anterior (‘Ant.’) (closer to where CSD was triggered anterior to the cranial window) to more posterior locations (‘Post.’). Speed estimates were obtained using the analysis method described in Figure 1—figure supplement 1. On average, the wave progressed at 3.8±0.2 mm/min. (D) Map of 18 regions of interest (ROIs) belonging to a single meningeal afferent fiber visible in B. (E) Activity heatmap of the afferent ROIs indicated in D illustrating progressive activation in response to CSD. (F) In contrast, the same afferent ROIs became activated simultaneously during a locomotion bout. Top trace depicts locomotion speed. (G) The pace of the CSD-associated afferent calcium wave was much slower than the spread of activity along the same afferent fibers during locomotion-evoked activity pre-CSD (****p<0.0001, paired, two-tailed t-test). (H) Example heatmaps of afferent activity observed during CSD showing different time course and magnitudes when compared to the activity observed during a locomotion bout. Bottom trace depicts locomotion speed. (I) Comparisons across all FOVs indicate a higher proportion of afferents exhibiting acute activation during the CSD vs. during locomotion (****p<0.0001, iterated bootstrap). (J) A higher proportion of afferents also displayed increased magnitudes of activation (*p<0.05, paired, two-tailed t-test). See also Figure 1—video 1.
Figure 1—figure supplement 1
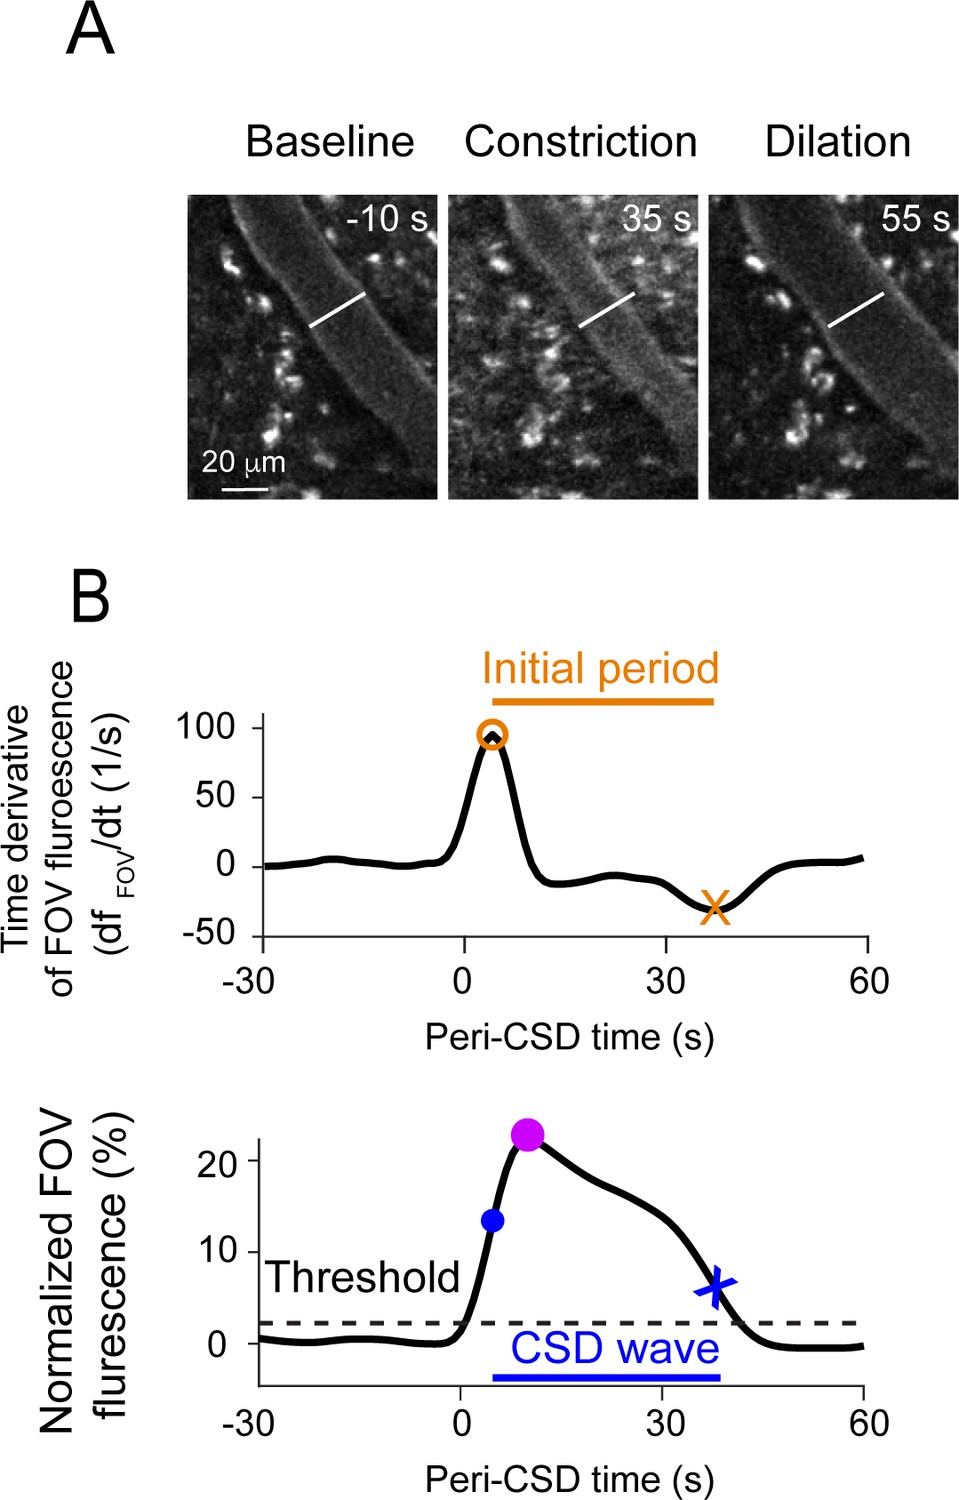
Further analyses of hemodynamics and calcium activity related to the cortical spreading depolarization (CSD) wave.
(A) Example cropped subregion of a field of view (FOV) demonstrating a typical pial vascular response to CSD, including an initial constriction (middle) followed by dilation (right). (B) Analysis approach used for detecting the CSD-associated meningeal calcium wave. Top: Time derivative of the FOV-averaged fluorescence signal over the first 90 s of imaging after the cortical pinprick. An initial period was defined between the derivative’s maximum (orange circle) and minimum (orange X) and was used to define the baseline fluorescence value (Fpre). Bottom: Normalized FOV fluorescence signal. The maximum within the initial period (purple circle) is taken as the peak of the CSD-associated wave, and a threshold value (dashed line) is defined as 10% of that peak value. The threshold crossings before (blue circle) and after (blue x) the peak define the wave’s onset and offset, respectively.
Figure 1—figure supplement 2
Cortical spreading depolarization (CSD)-associated wave deformation and acute afferent responses.
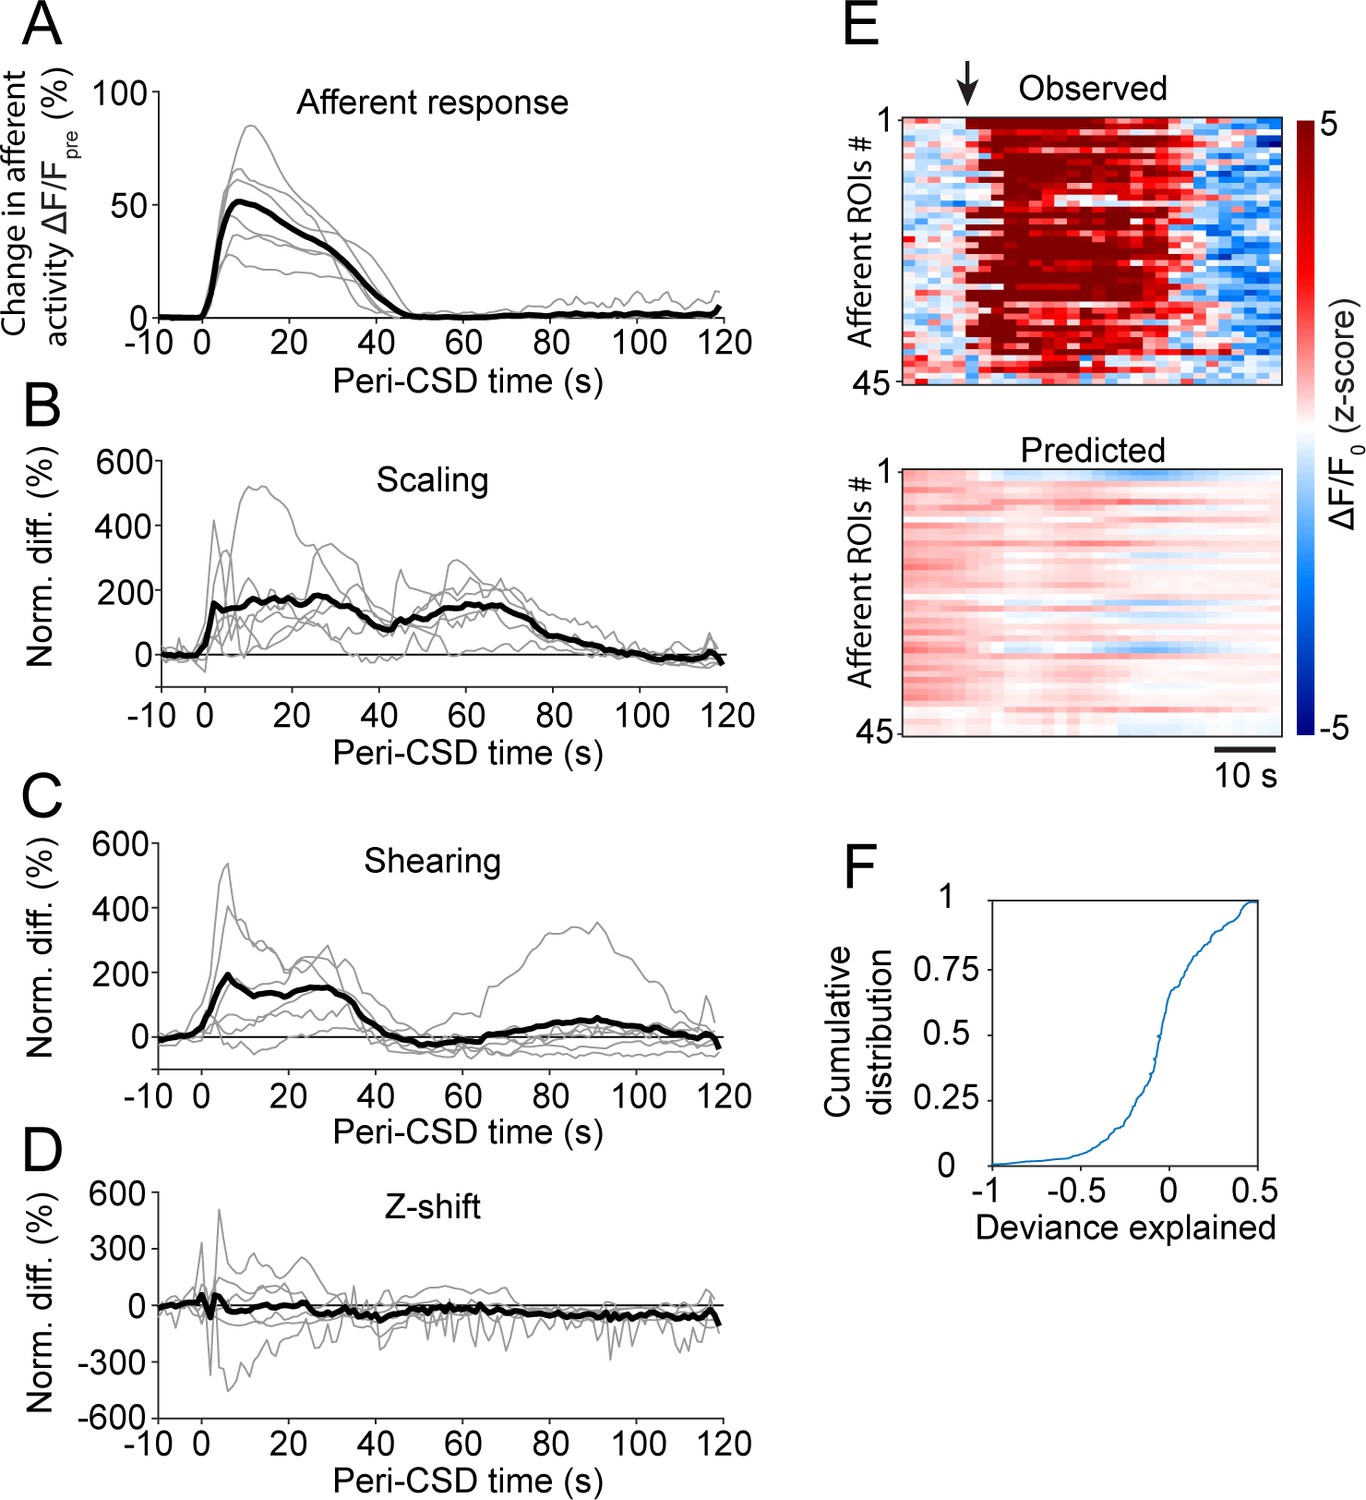
(A) Time course of peri-CSD afferent GCaMP fluorescence signals normalized to the 10 s pre-wave period. Gray traces represent the means of all afferent responses for a given CSD experiment. Black trace represents the average across all volumetric imaging experiments (6 CSDs in 6 mice). (B–D) Time courses of peri-CSD meningeal deformation signals normalized to the 10 s pre-wave period. Gray traces represent averages over all well-registered planes for a given field of view (FOV). Black traces represent the average across FOVs (6 CSDs in 6 mice). (E) Example comparison of the peri-CSD fluorescence signals observed (top) to those predicted by the general linear model (GLM) trained using pre-CSD meningeal deformation data. The arrow indicates the onset of the CSD-associated wave. (F) Cumulative distribution of the GLM deviance explained by the peri-CSD deformation predictors. Overall, the activity of only a small fraction of afferents was somewhat well fit by the model (based on threshold deviance explained >0.05), suggesting that the acute afferent response is mostly driven by other non-mechanical factors, such as the excitatory action of locally released mediators.
Figure 1—video 1
Cortical spreading depolarization (CSD)-associated afferent calcium wave.
Related to Figure 1 and Figure 1—figure supplement 1. CSD-associated calcium waves spread from anterior to posterior, as shown for two example waves from different mice. Note the spread of calcium activation along individual afferents in each movie. Scale bars: 50 µm.
Figure 2
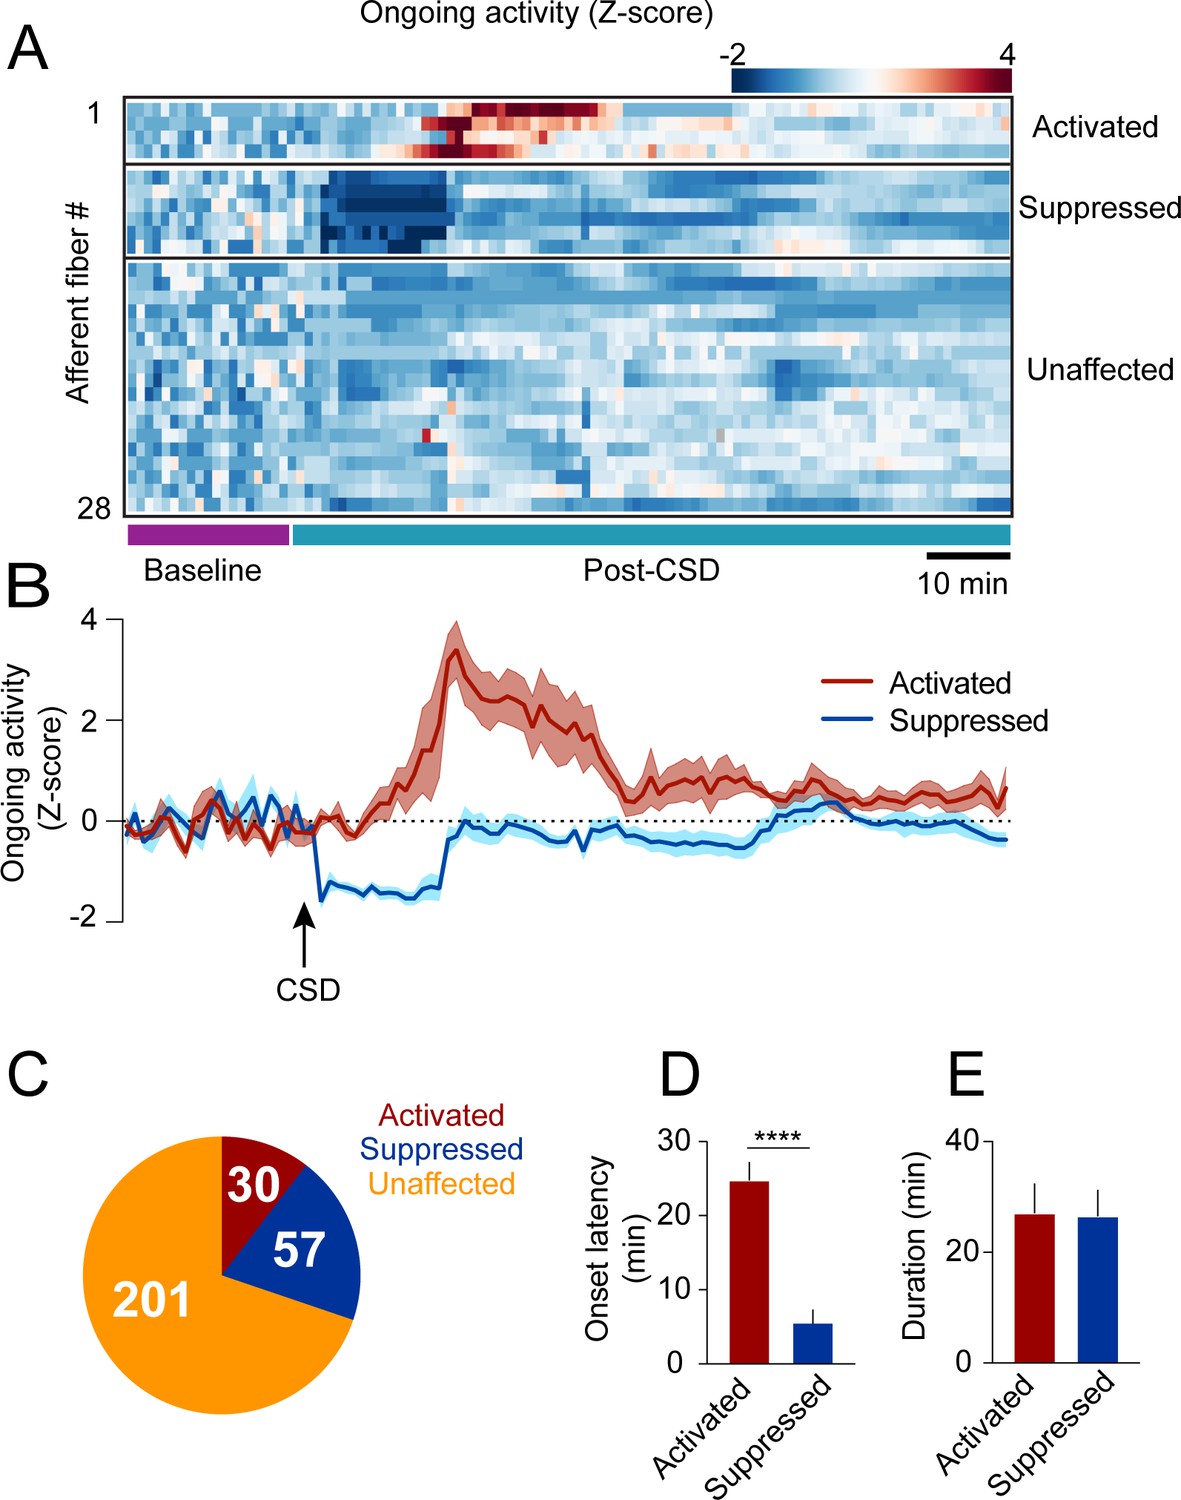
Cortical spreading depolarization (CSD)-related persistent changes in the ongoing activity of meningeal afferents.
(A) Example heatmap of normalized ongoing activity (fraction of time afferents exhibited calcium events when the mouse is not locomoting) for all afferent fibers from a single field of view (FOV) during baseline and up to 120 min following CSD (termed ‘“post-CSD’). Data shows concatenated 1-min bins of activity. Afferents were either activated, suppressed, or unaffected by CSD. Note the delayed activation and immediate suppression in two small subsets of fibers. (B) Mean activity time course of the activated and suppressed afferents from the same population depicted in A. (C) Pie chart depicting the breakdown of the afferent subpopulations based on their change in ongoing activity following CSD. Most afferents were not affected (orange), while two smaller populations either exhibited prolonged activation (maroon) or suppression (blue) of ongoing activity following CSD (8 CSDs in 7 mice). (D) Afferents exhibiting prolonged activation had a longer onset latency than those exhibiting suppression (****p<0.0001, Mann-Whitney U-test. Error bars: SEM). (E) The duration of increases in ongoing activity and suppressions in activity were similar (p=0.97, two-tailed t-test. Error bars: SEM).
Figure 3
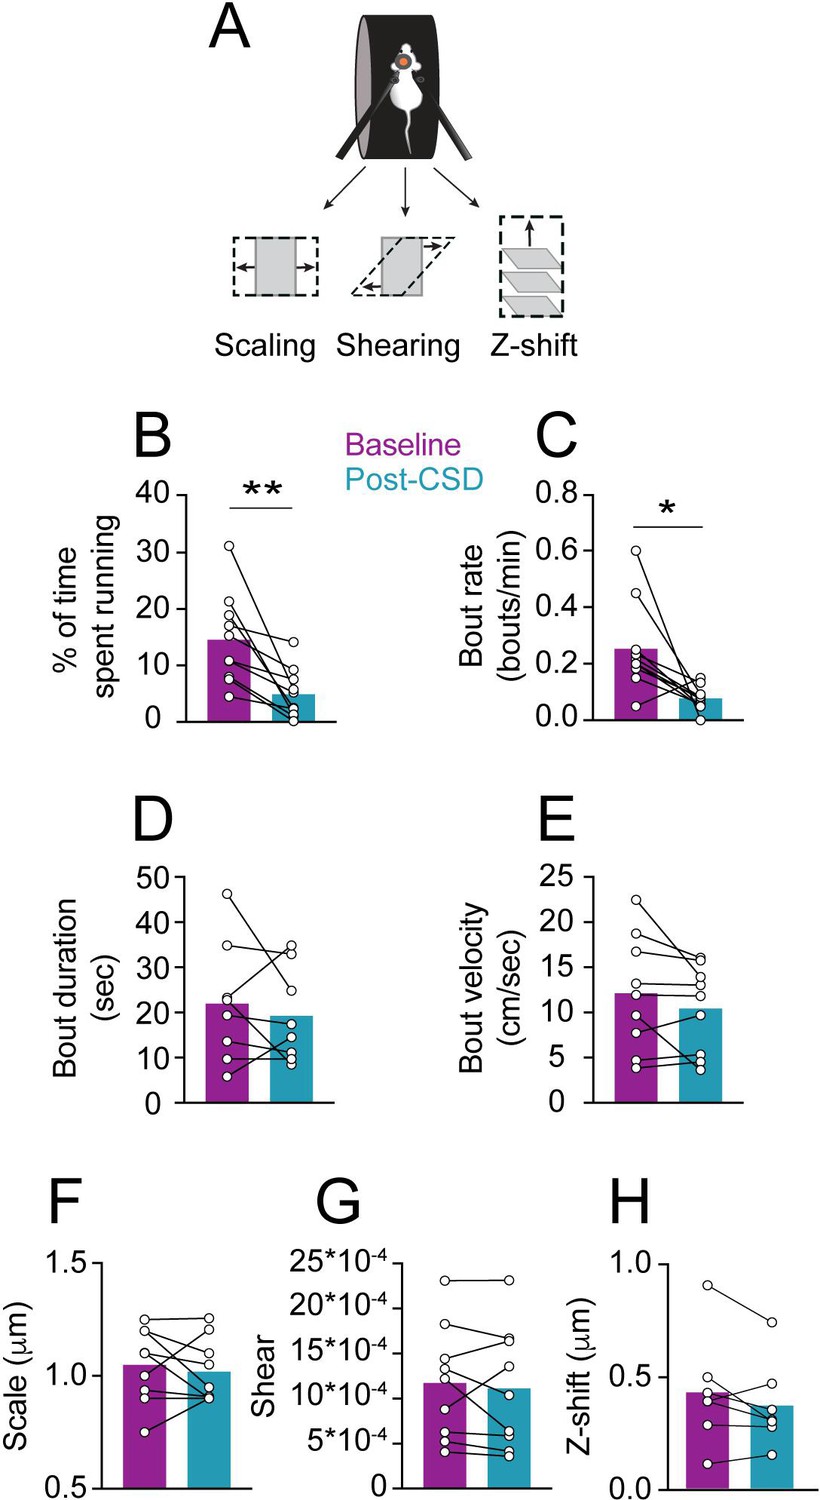
Locomotion and related meningeal deformations pre- and post-cortical spreading depolarization (CSD).
(A) In head-fixed mice, wheel running is associated with meningeal scaling, shearing, and positive Z-shift (i.e. meningeal movement toward the skull). (B) When compared to the baseline period, there was an overall reduction in the time mice spent running during the 2 hr post-CSD observation period (**p<0.01, paired t-test, 9 CSDs in 7 mice). (C) CSD also decreased locomotion bout rate (*p<0.05, Wilcoxon, signed rank test). (D, E) However, CSD did not affect bout duration (p=0.50, paired t-test) or bout peak velocity (p=0.18, paired t-test). (F, G, H) CSD also did not affect subsequent locomotion-evoked meningeal scaling, shearing, or Z-shift (p=0.56; p=0.55, p=0.18, paired t-tests, respectively, 9 CSDs, in 7 mice for scale and shear, 7 CSDs in 7 mice for Z-shift). Bars depict the mean.
Figure 4
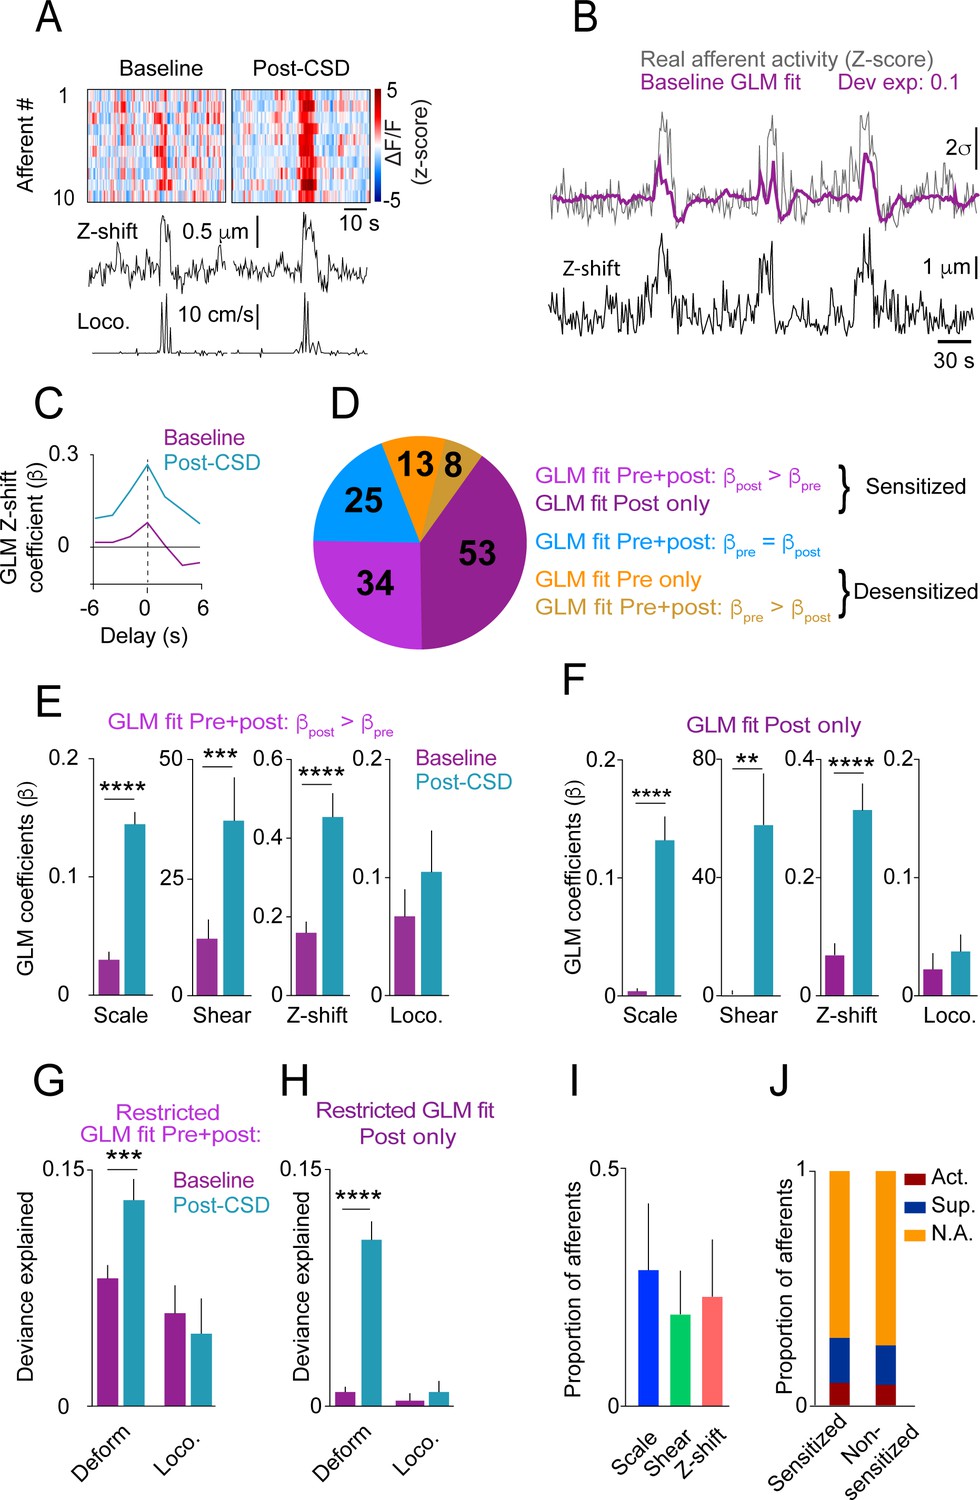
Cortical spreading depolarization (CSD) leads to sensitization of meningeal afferents to local deformation signals.
(A) Example of meningeal afferent sensitization following CSD. Locomotion and its related Z-shift (bottom traces) are comparable before (left) and after (right) CSD, but afferent fibers exhibit greater responses associated with the Z-shift after CSD (heatmaps, top panels). (B) Example general linear model (GLM) fit of afferent activity in response to Z-shifts before CSD. A raw calcium activity trace recorded pre-CSD (gray traces, Z-scored; σ: 1 standard deviation) is plotted along with the model fit (purple). The deviance explained (‘dev exp’) is a metric of GLM fit quality and is above the threshold (0.05) for classifying an afferent’s activity as reasonably well fit by the GLM. The activity of this example afferent could not be predicted by other deformation or locomotion variables (not shown), suggesting unique sensitivity to Z-shift. (C) GLM β coefficients used as a metric of the coupling between the Z-shift and the activity of the example afferent shown in b across different delays. A maximal coefficient at zero delay indicates the alignment of activity with Z-shifts. Note the greater afferent activation per unit Z-shift after CSD relative to baseline, indicative of an augmented or sensitized response. (D) Pie chart indicating the numbers and distribution of all afferents well fit by deformation and/or locomotion signals either before and/or after CSD. Afferents were categorized as sensitized if they (i) had significant GLM fits both pre- and post-CSD and higher coefficients for a given deformation and/or locomotion predictor post-CSD (purple) or (ii) were well fit only post-CSD (magenta). Two small subsets of afferents categorized as desensitized had worse GLM fits post-CSD (mustard) or were no longer well fit post-CSD (orange). The incidence of afferent sensitization exceeded that of desensitization (p<0.001, Χ2 test). (E, F) Comparisons of pre- and post-CSD GLM coefficients for the deformation and locomotion predictors. Data are shown for sensitized afferents with well-fit models pre- and post-CSD (corresponding to the purple population in d) and for afferents with well-fit models only post-CSD (i.e. silent pre-CSD, corresponding to the magenta population in d). Mouse velocity coefficients were close to 0 in all cases (not shown). In the two sensitized afferent populations, only coefficients related to deformation predictors increased post-CSD (**p<0.01, ***p<0.001, ****p<0.0001, Wilcoxon sign rank test with correction for multiple analyses). (G, H) The response bias of sensitized afferents to meningeal deformation was further observed when comparing these GLMs to restricted GLMs that included only the group of deformation predictors or the group of locomotion predictors. The deviance explained by the deformation response component (estimated as the difference between the full GLM and the GLM lacking deformation variables) was significantly greater than for the locomotion response component in sensitized afferents that were well fit pre- and post-CSD and for those that were well fit only post-CSD (***p<0.001 and ****p<0.0001, Wilcoxon test for g and h, respectively). Bars depict mean; error bars indicate SEM. (I) Among the sensitized afferents with enhanced sensitivity to deformation variables, we observed a similar sensitization to scale, shear, and Z-shift variables. Bars depict mean; error bars indicate SEM. (J) There was no difference in the incidence of sensitized afferents among afferents that showed prolonged activation, prolonged suppression, or no change in ongoing activity post-CSD (p=0.9, Χ2 test; Figure 2).
Additional files
Download links
A two-part list of links to download the article, or parts of the article, in various formats.
Downloads (link to download the article as PDF)
Open citations (links to open the citations from this article in various online reference manager services)
Cite this article (links to download the citations from this article in formats compatible with various reference manager tools)
Sensitization of meningeal afferents to locomotion-related meningeal deformations in a migraine model
eLife 12:RP91871.
https://doi.org/10.7554/eLife.91871.3


