Defective mesenchymal Bmpr1a-mediated BMP signaling causes congenital pulmonary cysts
- Department of Surgery, Children’s Hospital Los Angeles, Keck School of Medicine, University of Southern California, United States
- Division of Pulmonary, Critical Care & Sleep Medicine, Department of Internal Medicine, University of Cincinnati College of Medicine, United States
- Division of Maternal Fetal Medicine, Department of Obstetrics and Gynecology, Keck School of Medicine, University of Southern California, United States
- Department of Medicine, McMaster University, Canada
- Department of Medicine, Perelman School of Medicine, University of Pennsylvania, United States
- Department of Biologic and Material Sciences, University of Michigan-Ann Arbor, United States
Figures
Figure 1 with 1 supplement
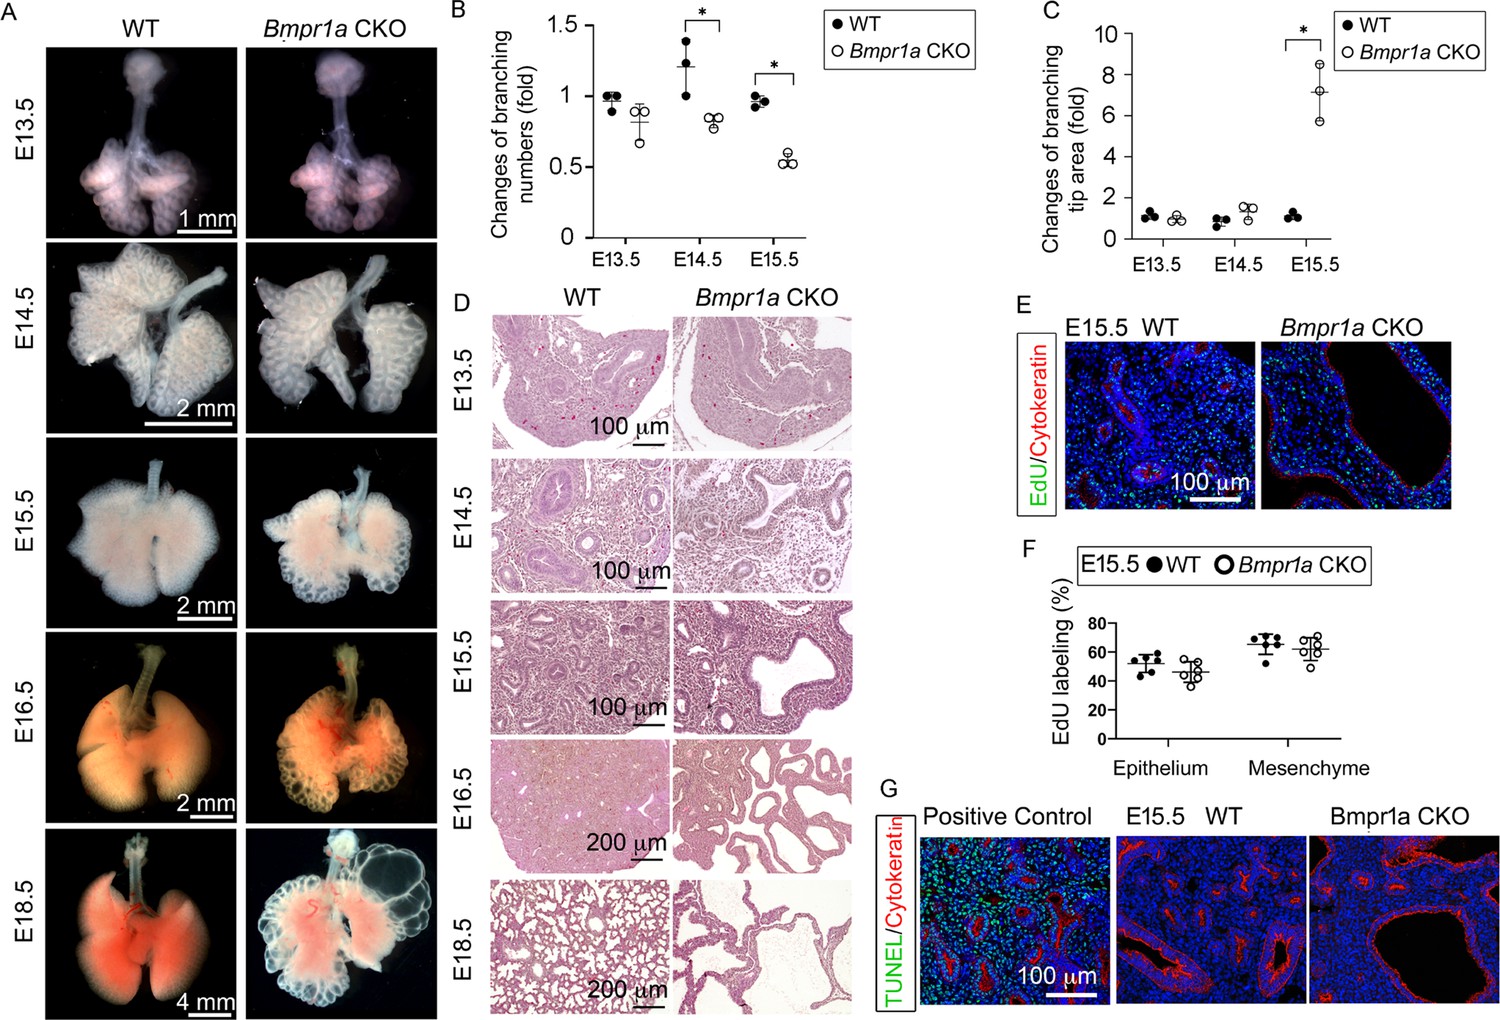
Lung mesenchyme-specific deletion of Bmpr1a caused abnormal lung morphogenesis and prenatal airway cystic lesions beginning in mid-gestation.
(A) Brightfield images of whole wildtype (WT) and Bmpr1a conditional knockout (CKO) mouse lungs at different embryonic stages. (B and C) Quantitative measurement and comparison of terminal airway branching numbers and sizes. (D) Hematoxylin and eosin (H&E)-stained Bmpr1a CKO lungs at different embryonic stages. (E and F) EdU incorporation study for cell proliferation analysis in lung mesenchymal and cytokeratin-positive epithelial cells (n=6). (G) Apoptosis analysis by TUNEL assay. The positive control slides for apoptosis were generated by treating the tissue sections with DNase I. Pictures are representative of at least five samples in each condition.
Figure 1—figure supplement 1
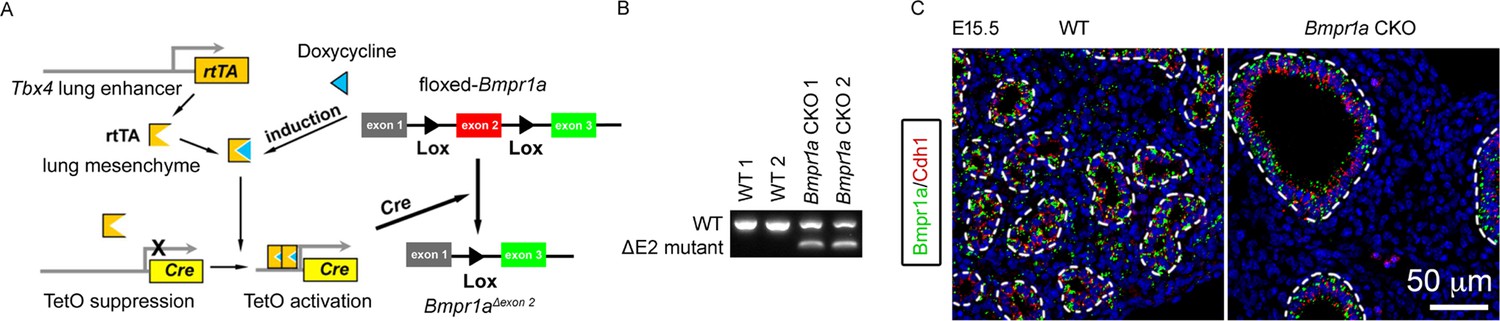
Bmpr1a was specifically deleted in lung mesenchymal cells.
(A) Schematic representation of the lung mesenchyme-specific knockout of Bmpr1a by Tbx4-rtTA/Teto-Cre driver line. (B) Verification of Bmpr1a genetic deletion at the mRNA level. △E2: exon 2 deletion. (C) Immunostaining of Bmpr1a (green) and Cdh1 (red). The airways are highlighted with dot lines.
-
Figure 1—figure supplement 1—source data 1
Original file for the mRNA analysis in Figure 1—figure supplement 1B (exon 2 deletion of Bmpr1a).
- https://cdn.elifesciences.org/articles/91876/elife-91876-fig1-figsupp1-data1-v1.zip
-
Figure 1—figure supplement 1—source data 2
PDF containing Figure 1—figure supplement 1B and original image of the relevant mRNA analysis (exon 2 deletion of Bmpr1a).
- https://cdn.elifesciences.org/articles/91876/elife-91876-fig1-figsupp1-data2-v1.zip
Figure 2
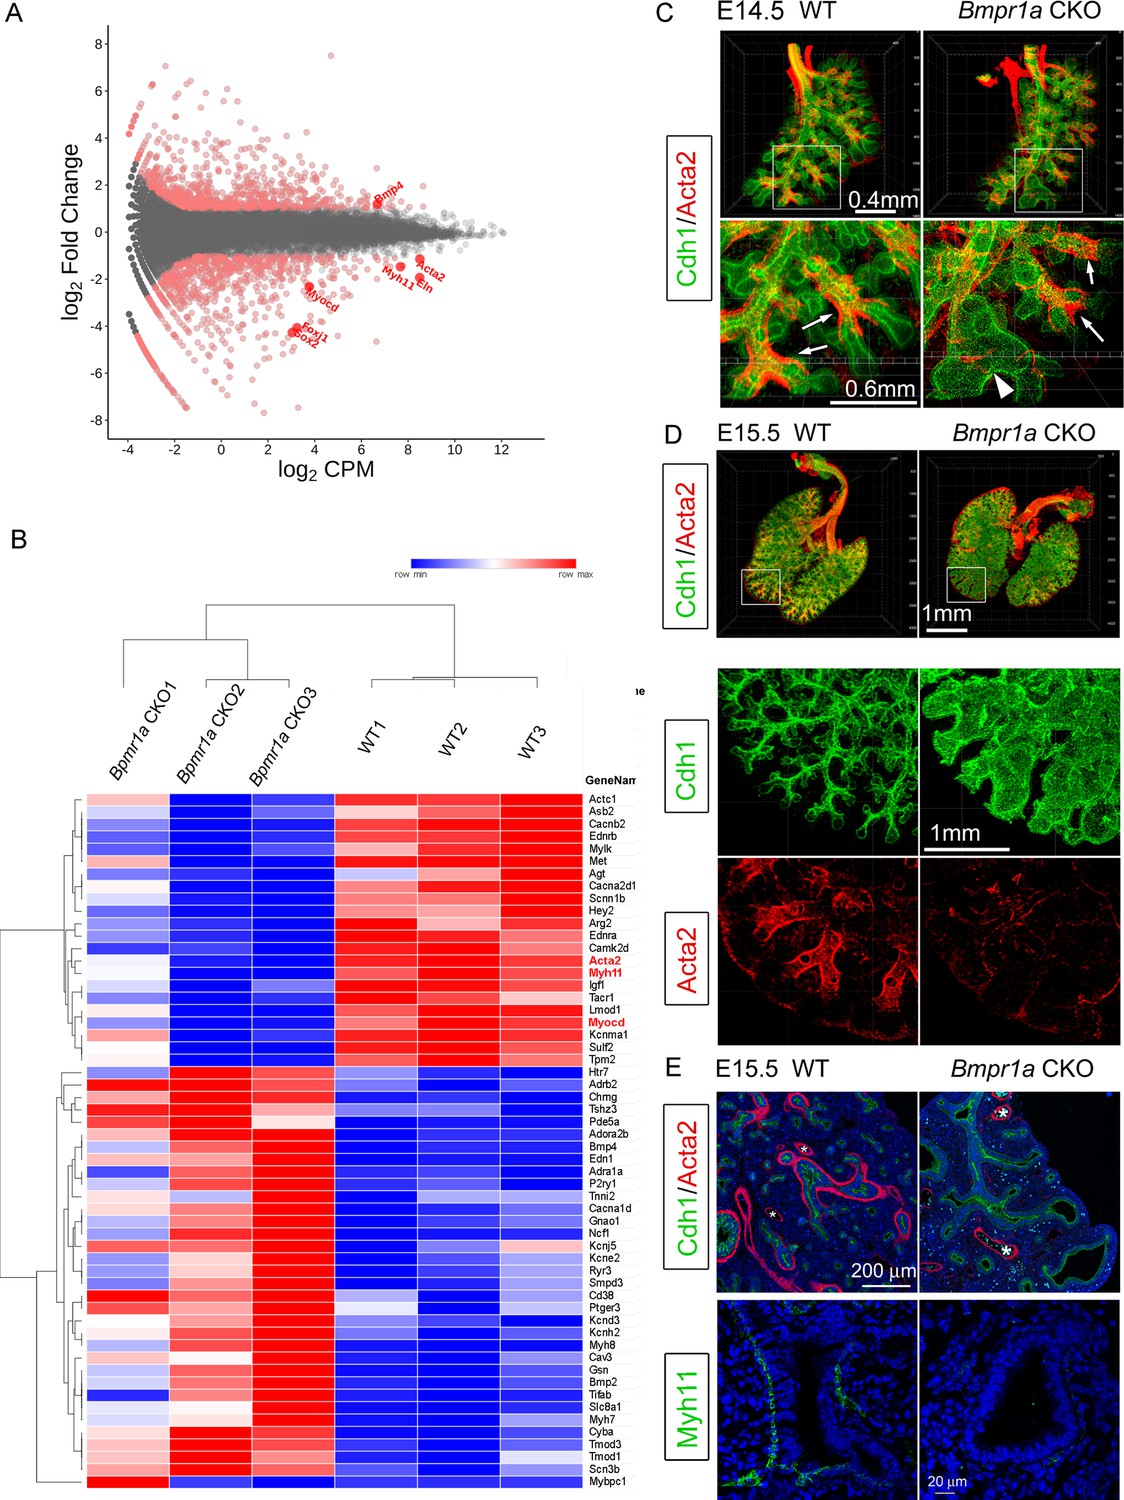
Airway smooth muscle was substantially reduced in Bmpr1a conditional knockout (CKO) lungs.
(A) Scatter plots of RNA-seq analysis for differentially expressed genes (DEGs) (n=3). (B) RPKM heatmap of Muscle System Process Genes (GO:0003012). Genes involved in the Muscle System Process with significant changes between Bmpr1a CKO and wildtype (WT) lungs are shown in the RNA-seq heatmap. The input data was RPKM values generated from the raw data using the R/Bioconductor program ‘edgeR’. (C and D) Whole mount immunostaining of Cdh1 and Acta2 in embryonic day (E)14.5 and E15.5 lungs. Excessive dilation of airway terminals and extensive reduction of airway smooth muscle were observed in E15.5 Bmpr1a CKO lungs. The normal-looking airways are marked by arrows and the enlarged epithelial bud accompanied with compromised smooth muscle are marked by arrowheads. (E) E15.5 lung section stained with Cdh1& Acta2 or Myh11. *Vascular structures.
Figure 3
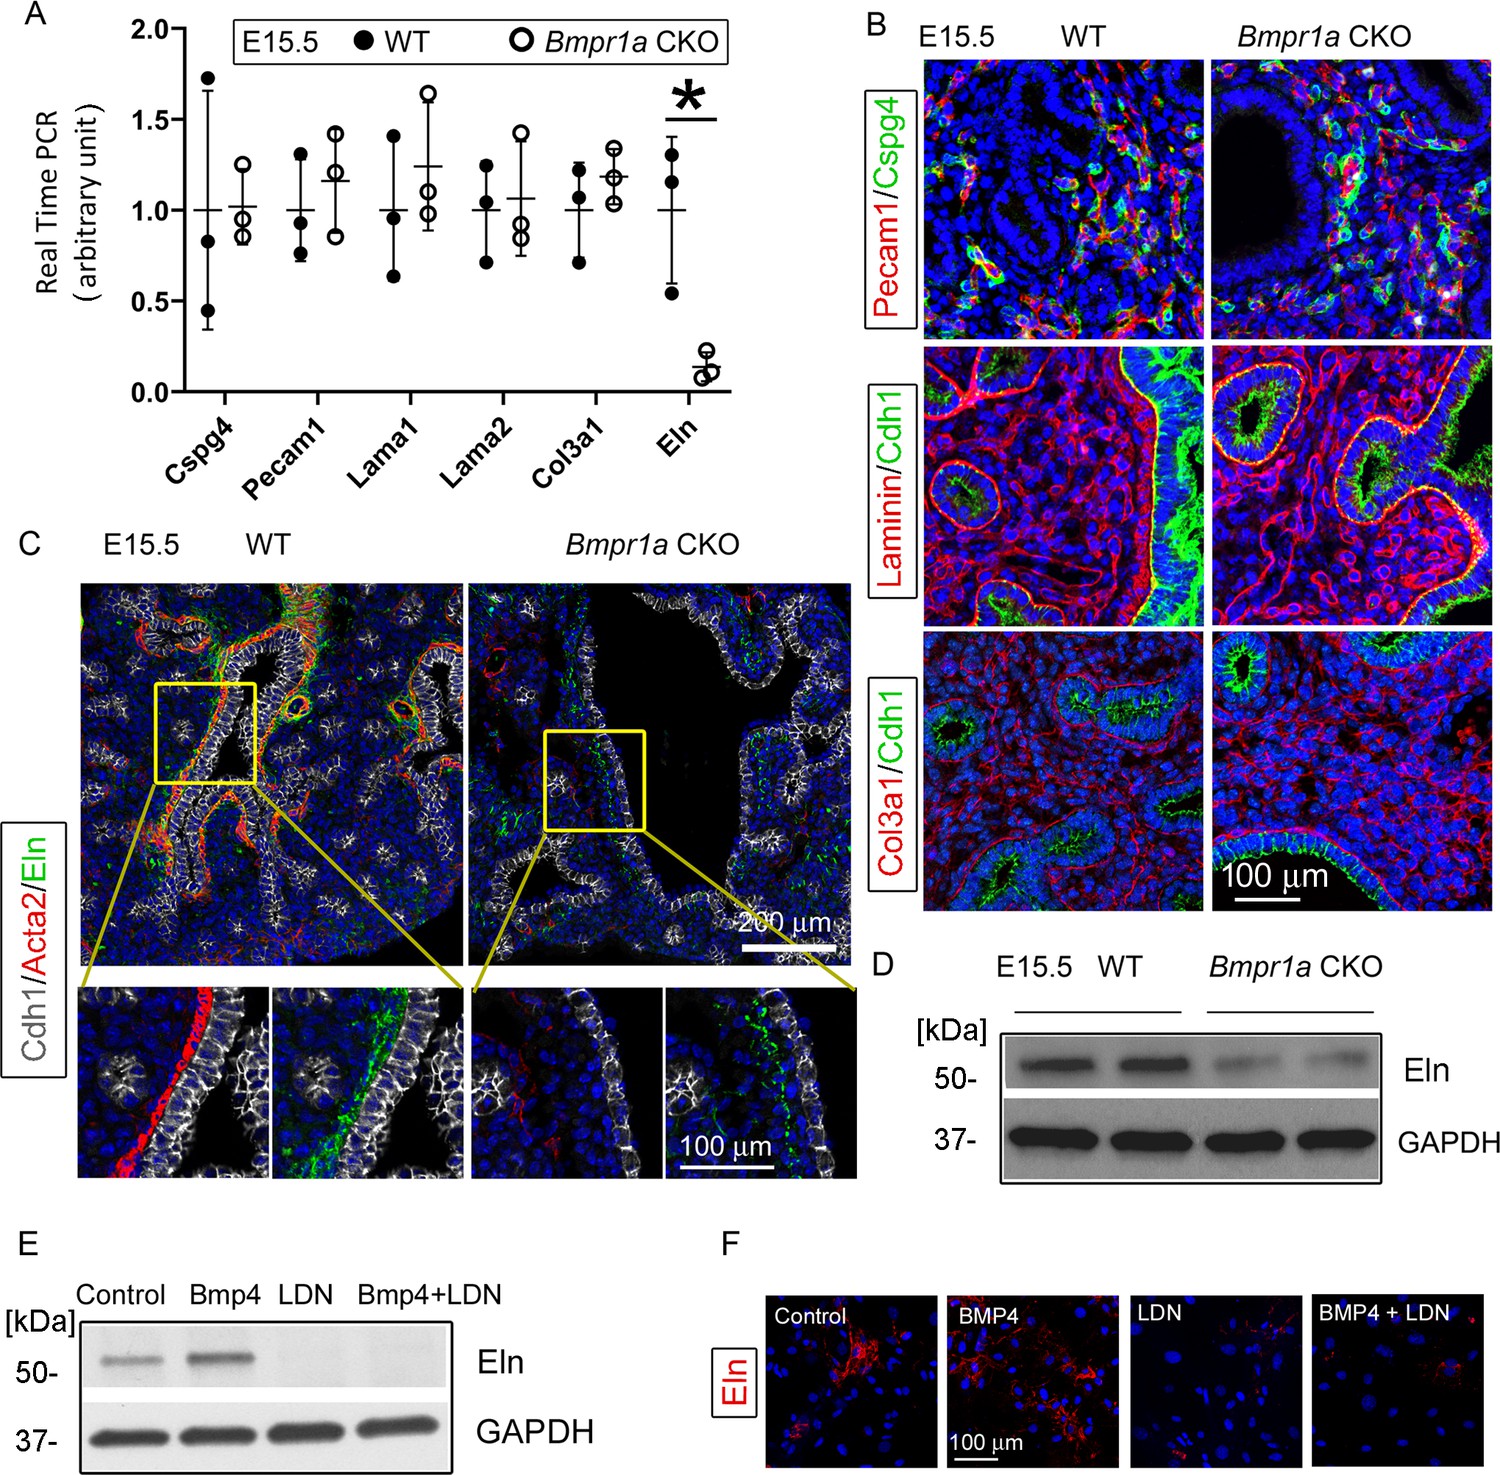
Bmpr1a conditional knockout (CKO) resulted in a significant reduction in elastin expression underneath the airway epithelia of embryonic day (E)15.5 lungs, but not in the pericytes, vasculature, and basement membrane.
(A) Expression of Cspg4, Pecam1, Lama1, Lama2, Col3a1, and Eln at the mRNA level was measured by real-time PCR, *p<0.05. (B) E15.5 lung section stained with Cspg4, Pecam1, laminin, and Col3a1. (C) E15.5 lung section stained with Cdh1, Acta2, and elastin. (D) Reduced elastin expression of Bmpr1a CKO lungs at the protein level was detected by western blot (WB). (E and F) Elastin expression in E15.5 lung mesenchymal cells was upregulated by BMP4 and downregulated by BMP type 1 receptor-specific inhibitor LDN193189 (LDN), as detected by WB and immunofluorescence staining.
-
Figure 3—source data 1
Original file for the western blot (WB) analysis in Figure 3D (anti-Eln and anti-GAPDH).
- https://cdn.elifesciences.org/articles/91876/elife-91876-fig3-data1-v1.zip
-
Figure 3—source data 2
PDF containing Figure 3D and original scans of the relevant western blot (WB) analysis (anti-Eln and anti-GAPDH) with highlighted bands and sample labels.
- https://cdn.elifesciences.org/articles/91876/elife-91876-fig3-data2-v1.zip
-
Figure 3—source data 3
Original file for the western blot (WB) analysis in Figure 3E (anti-Eln).
- https://cdn.elifesciences.org/articles/91876/elife-91876-fig3-data3-v1.zip
-
Figure 3—source data 4
Original file for the western blot (WB) analysis in Figure 3E (anti-GAPDH).
- https://cdn.elifesciences.org/articles/91876/elife-91876-fig3-data4-v1.zip
-
Figure 3—source data 5
PDF containing Figure 3E and original scans of the relevant western blot (WB) analysis (anti-Eln and anti-GAPDH) with highlighted bands and sample labels.
- https://cdn.elifesciences.org/articles/91876/elife-91876-fig3-data5-v1.zip
Figure 4
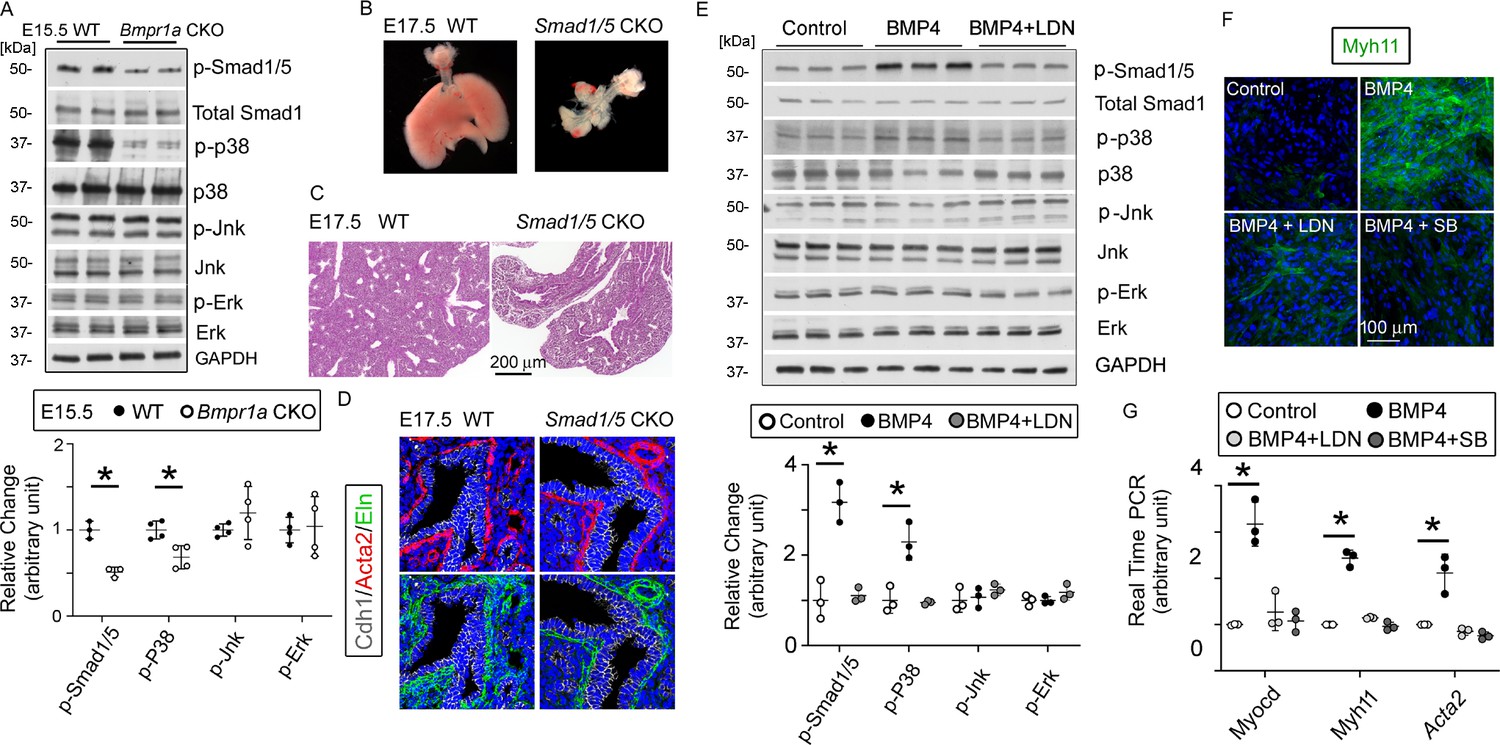
The bone morphogenetic protein (BMP) pathway regulates the myogenesis of lung mesenchymal cells via the Smad-independent pathway.
(A) Activation of the intracellular downstream Smad1, p38, Jnk, and Erk signaling pathways in wildtype (WT) and Bmpr1a conditional knockout (CKO) lung tissues was detected by the western blot (WB) and quantified by densitometry. The levels of protein phosphorylation were normalized by the corresponding total protein and is presented as a relative change to the WT, *p<0.05. (B) Gross view of whole lungs from Smad1/5 double conditional knockout mice (Smad1/5 CKO) and WT littermates showed that simultaneous deletion of Smad1 and Smad5 in lung mesenchyme completely disrupted lung development. (C) No airway dilation or cysts were observed in the hematoxylin and eosin (H&E)-stained tissue sections of the Smad1/5 CKO lungs at embryonic day (E)17.5. (D) Expression of airway smooth muscle cells (SMCs) and elastin was not altered in E17.5 Smad1/5 CKO lungs, as shown by immunostaining of Cdh1, Acta2, and elastin. (E) Changes of intracellular signaling pathways in cultured fetal lung mesenchymal cells upon treatment with BMP4 (50 ng/ml) and/or LDN193189 (200 nM) were detected by WB and quantified by densitometry. The relative change to the control condition is presented, *p<0.05. (F and G) Altered expression of SMC genes at the protein level (Myh11) and the mRNA level (Myocd, Myh11, and Acta2) was respectively analyzed by immunostaining and real-time PCR for the primary culture of E15.5 WT lung mesenchymal cells treated with BMP4 (50 ng/ml), LDN (200 nM), and SB (1 µM), *p<0.05.
-
Figure 4—source data 1
Original file for the western blot (WB) analysis in Figure 4A (anti-p-Smad1/5).
- https://cdn.elifesciences.org/articles/91876/elife-91876-fig4-data1-v1.zip
-
Figure 4—source data 2
Original file for the western blot (WB) analysis in Figure 4A (anti-total Smad1, anti-Jnk, and anti-Erk).
- https://cdn.elifesciences.org/articles/91876/elife-91876-fig4-data2-v1.zip
-
Figure 4—source data 3
Original file for the western blot (WB) analysis in Figure 4A (anti-p-p38).
- https://cdn.elifesciences.org/articles/91876/elife-91876-fig4-data3-v1.zip
-
Figure 4—source data 4
Original file for the western blot (WB) analysis in Figure 4A (anti-p38).
- https://cdn.elifesciences.org/articles/91876/elife-91876-fig4-data4-v1.zip
-
Figure 4—source data 5
Original file for the western blot (WB) analysis in Figure 4A (anti-p-Jnk).
- https://cdn.elifesciences.org/articles/91876/elife-91876-fig4-data5-v1.zip
-
Figure 4—source data 6
Original file for the western blot (WB) analysis in Figure 4A (anti-p-Erk).
- https://cdn.elifesciences.org/articles/91876/elife-91876-fig4-data6-v1.zip
-
Figure 4—source data 7
Original file for the western blot (WB) analysis in Figure 4A (anti-GAPDH).
- https://cdn.elifesciences.org/articles/91876/elife-91876-fig4-data7-v1.zip
-
Figure 4—source data 8
PDF containing Figure 4A and original scans of the relevant western blot (WB) analysis (anti-p-Smad1/5, anti-total Smad1/5, anti-p-p38, anti-p38, anti-p-Jnk, anti-Jnk, anti-p-Erk, anti-Erk, and anti-GAPDH) with highlighted bands and sample labels.
- https://cdn.elifesciences.org/articles/91876/elife-91876-fig4-data8-v1.zip
-
Figure 4—source data 9
Original file for the western blot (WB) analysis in Figure 4E (anti-p-Smad1/5).
- https://cdn.elifesciences.org/articles/91876/elife-91876-fig4-data9-v1.zip
-
Figure 4—source data 10
Original file for the western blot (WB) analysis in Figure 4E (anti-total Smad1).
- https://cdn.elifesciences.org/articles/91876/elife-91876-fig4-data10-v1.zip
-
Figure 4—source data 11
Original file for the western blot (WB) analysis in Figure 4E (anti-p-p38).
- https://cdn.elifesciences.org/articles/91876/elife-91876-fig4-data11-v1.zip
-
Figure 4—source data 12
Original file for the western blot (WB) analysis in Figure 4E (anti-p38).
- https://cdn.elifesciences.org/articles/91876/elife-91876-fig4-data12-v1.zip
-
Figure 4—source data 13
Original file for the western blot (WB) analysis in Figure 4E (anti-p-Jnk).
- https://cdn.elifesciences.org/articles/91876/elife-91876-fig4-data13-v1.zip
-
Figure 4—source data 14
Original file for the western blot (WB) analysis in Figure 4E (anti-Jnk).
- https://cdn.elifesciences.org/articles/91876/elife-91876-fig4-data14-v1.zip
-
Figure 4—source data 15
Original file for the western blot (WB) analysis in Figure 4E (anti-p-Erk).
- https://cdn.elifesciences.org/articles/91876/elife-91876-fig4-data15-v1.zip
-
Figure 4—source data 16
Original file for the western blot (WB) analysis in Figure 4E (anti-Erk).
- https://cdn.elifesciences.org/articles/91876/elife-91876-fig4-data16-v1.zip
-
Figure 4—source data 17
Original file for the western blot (WB) analysis in Figure 4E (anti-GAPDH).
- https://cdn.elifesciences.org/articles/91876/elife-91876-fig4-data17-v1.zip
-
Figure 4—source data 18
PDF containing Figure 4E and original scans of the relevant western blot (WB) analysis (anti-p-Smad1/5, anti-total Smad1/5, anti-p-p38, anti-p38, anti-p-Jnk, anti-Jnk, anti-p-Erk, anti-Erk, and anti-GAPDH) with highlighted bands and sample labels.
- https://cdn.elifesciences.org/articles/91876/elife-91876-fig4-data18-v1.zip
Figure 5
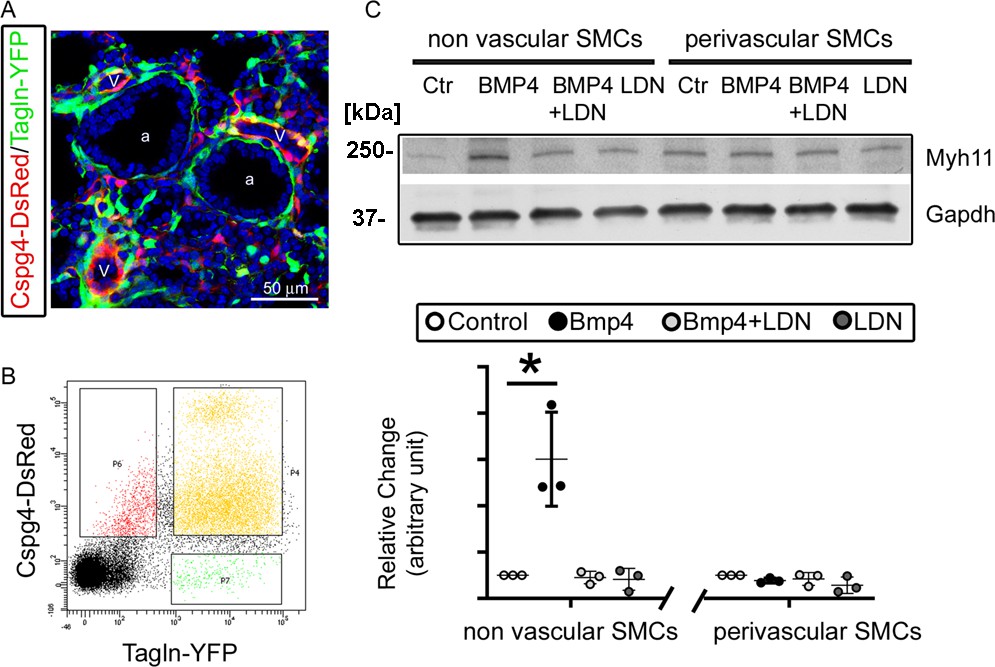
Bmpr1a-mediated signaling played different roles in the differentiation of airway versus vascular smooth muscle cells (SMCs).
(A) YFP and DsRed expression patterns in the fetal lungs of Tagln-YFP/Cspg4-DsRed mice. a: airway, v: vessel. (B) Airway SMCs (YFP+) and vascular SMCs (YFP+/DsRed+) were isolated by fluorescence-activated cell sorting (FACS). (C) The differential effect of Bmp4 treatment (50 ng/ml) on contractile protein Myh11 expression was analyzed in SMCs of non-vascular origin (YFP+) versus vascular origin (YFP+/DsRed+), and the role of Bmpr1a in mediating this effect was tested by adding its specific inhibitor LDN193189 (200 nM). The western blot (WB) data of Myh11 expression was normalized to GAPDH (loading control) and is represented as a relative change to the control condition, *p<0.05.
-
Figure 5—source data 1
Original file for the western blot (WB) analysis in Figure 5C (anti-Myh11).
- https://cdn.elifesciences.org/articles/91876/elife-91876-fig5-data1-v1.zip
-
Figure 5—source data 2
Original file for the western blot (WB) analysis in Figure 5C (anti-GAPDH).
- https://cdn.elifesciences.org/articles/91876/elife-91876-fig5-data2-v1.zip
-
Figure 5—source data 3
PDF containing Figure 5C and original scans of the relevant western blot (WB) analysis (anti-Myh11 and anti-GAPDH) with highlighted bands and sample labels.
- https://cdn.elifesciences.org/articles/91876/elife-91876-fig5-data3-v1.zip
Figure 6 with 1 supplement
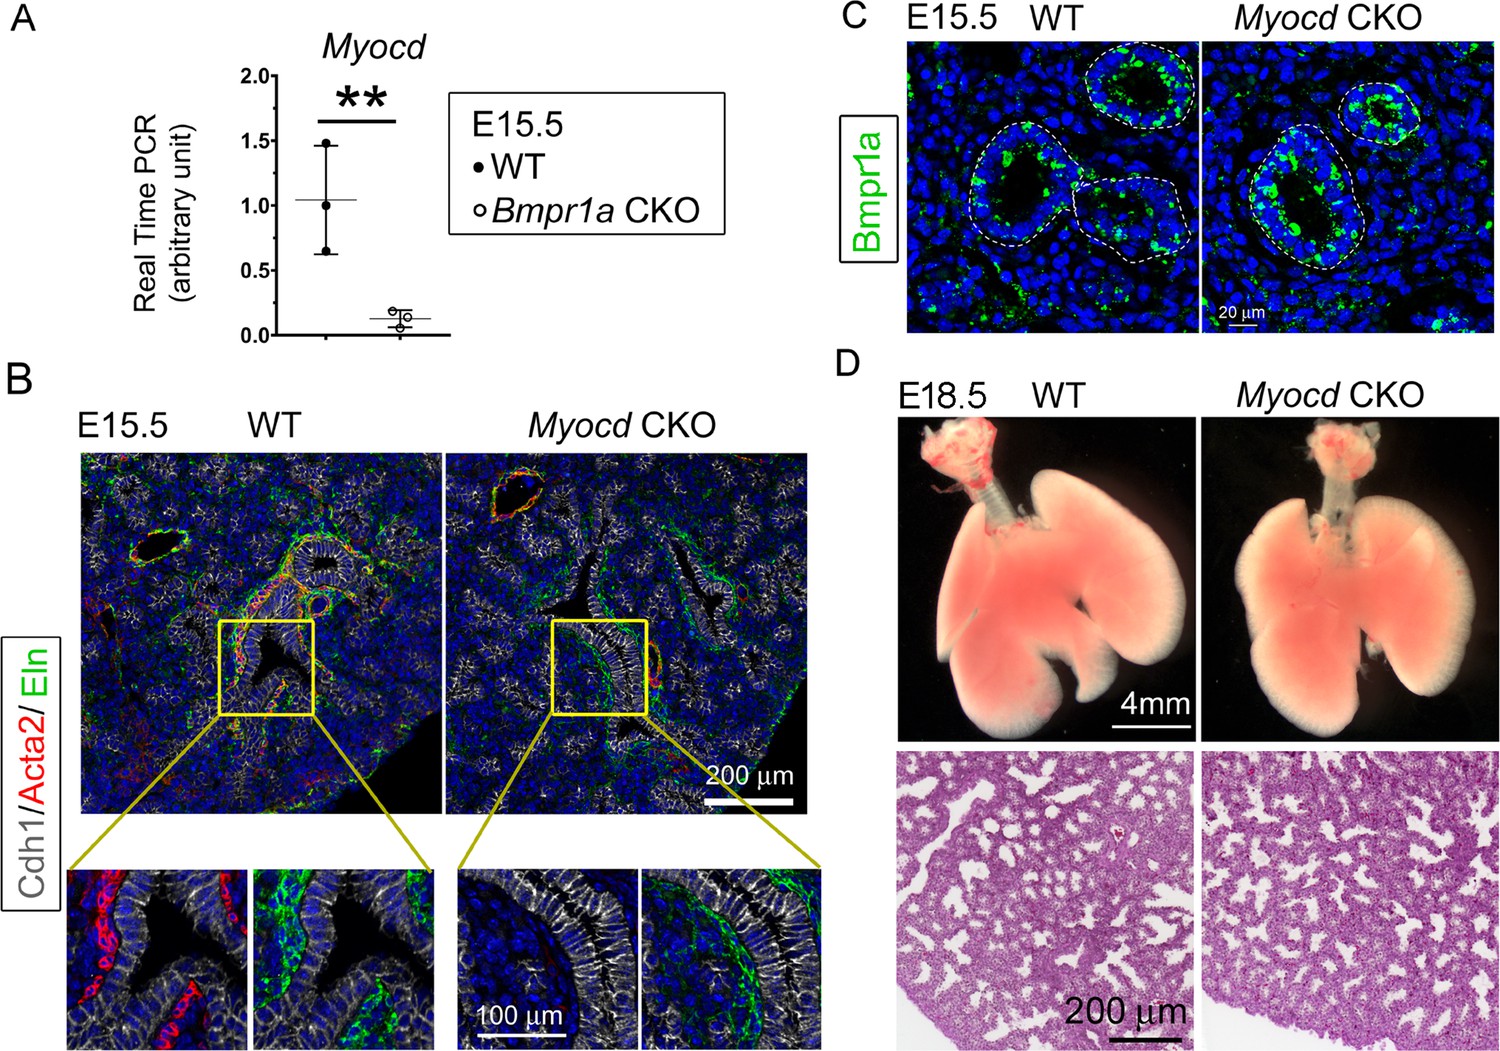
Lung mesenchymal knockout of Myocd did not cause any branching abnormalities or lung cysts.
(A) The expression of Myocd in Bmpr1a conditional knockout (CKO) lungs was substantially decreased, as measured by real-time PCR, **p<0.01. (B) Deficiency in airway smooth muscle cells (SMCs) was observed in embryonic day (E)15.5 mesenchyme-specific Myocd CKO lungs, as shown by co-immunofluorescence staining of Cdh1, Acta2, and elastin. (C) Comparison of Bmpr1a expression between E15.5 Myocd CKO and wildtype (WT) control lungs by immunofluorescence staining. (D) Comparison of the lungs between WT and Myocd CKO mice at the end of gestation (E18.5) did not reveal any significant morphological changes by gross view. No histological difference was found between the WT and the Myocd CKO lungs by examining their hematoxylin and eosin (H&E)-stained lung tissue sections.
Figure 6—figure supplement 1
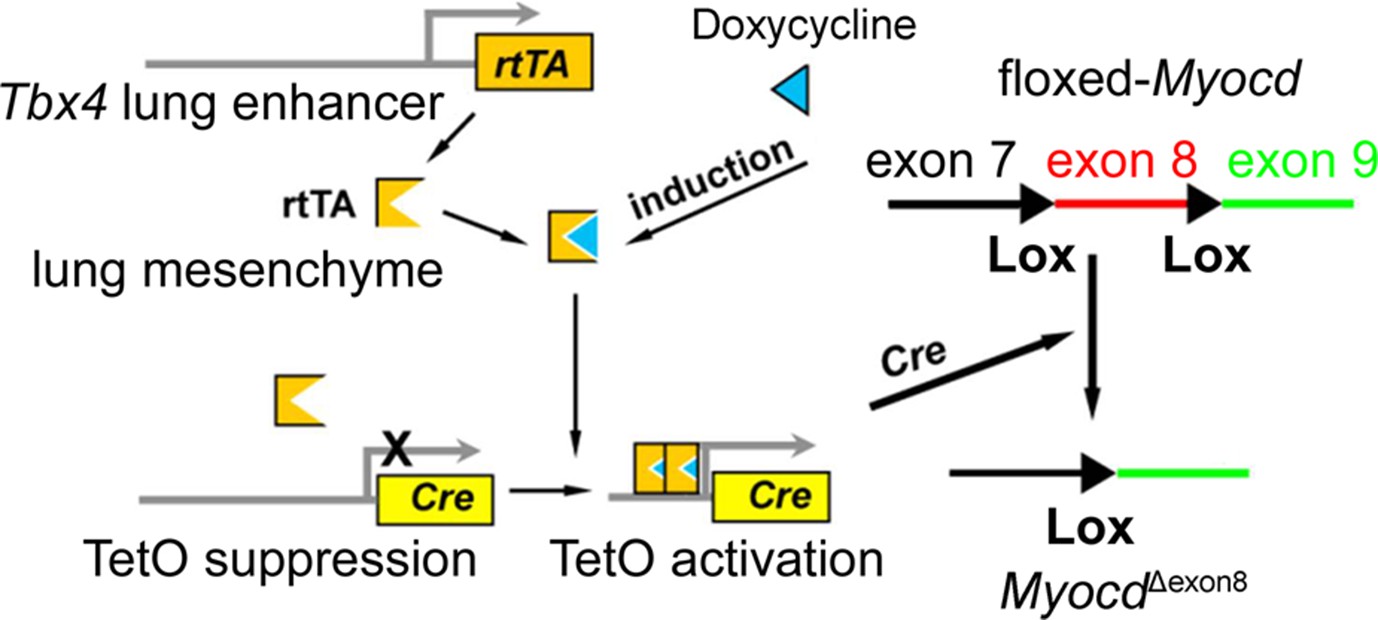
Schematic representation of the lung mesenchyme-specific knockout of Myocd by Tbx4-rtTA/Teto-Cre driver line.
Figure 7
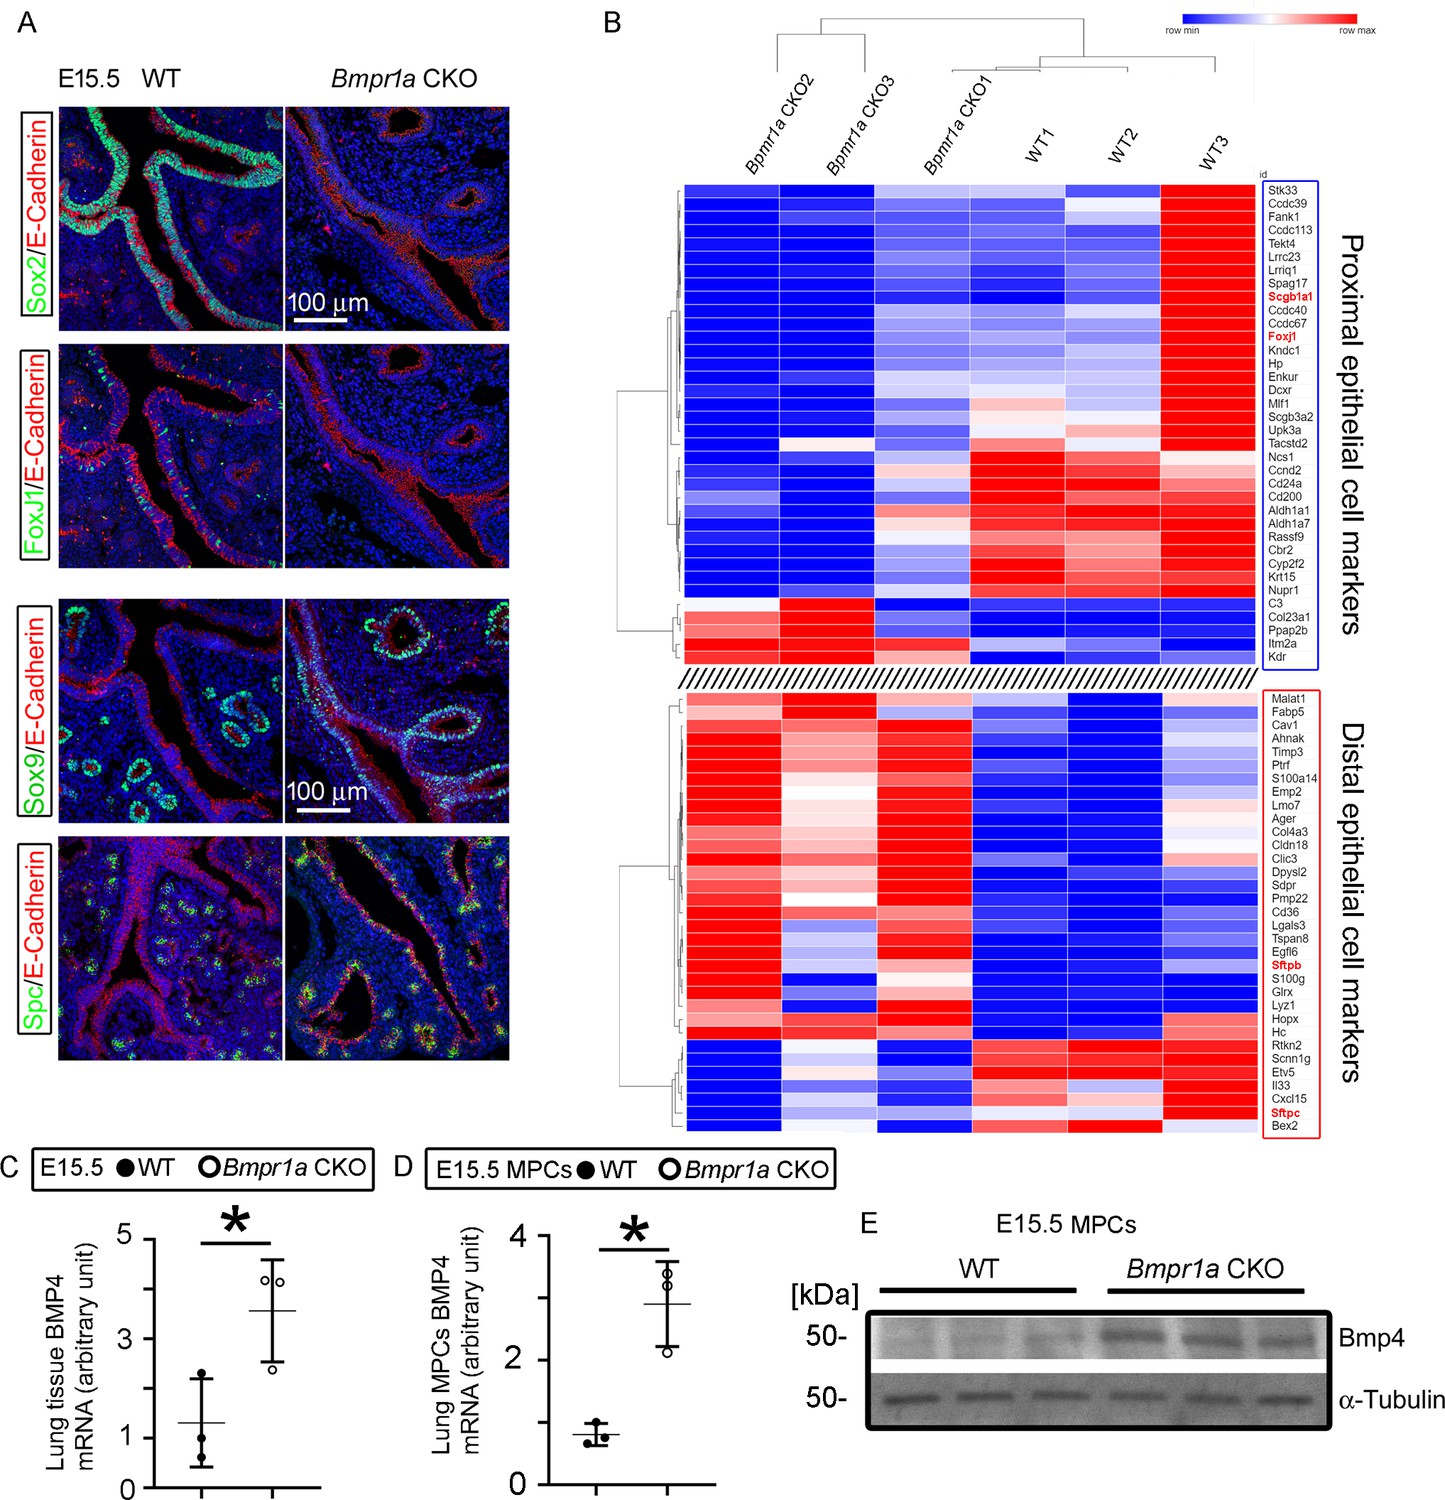
Mesenchymal Bmpr1a deletion disrupted airway epithelial proximal-distal differentiation and development.
(A) Proximal epithelial cells, marked by Sox2 and Foxj1 staining, were significantly decreased in the proximal portion of the airways in embryonic day (E)15.5 Bmpr1a conditional knockout (CKO) lungs. Ectopic distribution of distal epithelial cells marked by Sox9 and Spc staining was detected in the proximal airways of E15.5 Bmpr1a CKO lungs. (B) Heatmap of RNA-seq data showing significant changes in the marker genes of proximal and distal epithelial cells. (C) Increased Bmp4 expression at the mRNA level was detected in E15.5 Bmpr1a CKO lung tissue by RT-PCR. (D and E) Bmp4 expression in isolated fetal lung mesenchymal cells with genotypes of wildtype (WT) vs. Bmpr1a CKO was analyzed at both the mRNA and protein levels by RT-PCR and western blot (WB) respectively.
-
Figure 7—source data 1
Original file for the western blot (WB) analysis in Figure 7E (anti-Bmp4).
- https://cdn.elifesciences.org/articles/91876/elife-91876-fig7-data1-v1.zip
-
Figure 7—source data 2
Original file for the western blot (WB) analysis in Figure 7E (anti-α-tubulin).
- https://cdn.elifesciences.org/articles/91876/elife-91876-fig7-data2-v1.zip
-
Figure 7—source data 3
PDF containing Figure 7E and original scans of the relevant western blot (WB) analysis (anti-Bmp4 and anti-α-tubulin) with highlighted bands and sample labels.
- https://cdn.elifesciences.org/articles/91876/elife-91876-fig7-data3-v1.zip
Additional files
-
MDAR checklist
- https://cdn.elifesciences.org/articles/91876/elife-91876-mdarchecklist1-v1.pdf
-
Supplementary file 1
Antibody and Primer Resources.
- https://cdn.elifesciences.org/articles/91876/elife-91876-supp1-v1.docx
Download links
A two-part list of links to download the article, or parts of the article, in various formats.
Downloads (link to download the article as PDF)
Open citations (links to open the citations from this article in various online reference manager services)
Cite this article (links to download the citations from this article in formats compatible with various reference manager tools)
Defective mesenchymal Bmpr1a-mediated BMP signaling causes congenital pulmonary cysts
eLife 12:RP91876.
https://doi.org/10.7554/eLife.91876.3


