BMP signaling maintains auricular chondrocyte identity and prevents microtia development by inhibiting protein kinase A
- Bio-X Institutes, Key Laboratory for the Genetics of Developmental and Neuropsychiatric Disorders, Ministry of Education, Shanghai Jiao Tong University, China
- Department of Osteoporosis and Bone Diseases, Shanghai Clinical Research Center of Bone Disease, Shanghai Jiao Tong University Affiliated Sixth People's Hospital, China
- Department of Biologic and Materials & Prosthodontics, University of Michigan School of Dentistry, United States
- Shanghai Institute of Stem Cell Research and Clinical Translation, China
Figures
Figure 1 with 1 supplement

Prrx1 marks auricle chondrocytes but few epiphyseal or articular chondrocytes.
(A) Genetic tracing experiments showed that Prrx1 marks all chondrocytes in the auricle. Upper panel: a diagram showing the schedule for Tamoxifen (TAM) administration and mouse euthanasia. Scale bars=50 μm. (B) Genetic tracing experiments showed that Prrx1 marks few cells in the articular cartilage or the growth plates of femurs and the growth plates of tibias in adult mice. Scale bars (femur)=100 μm. Scale bars (tibia)=50 μm. (C) Representative immunostaining results for Vimentin, αSMA, Col1α1, and Col1α2 in ear sections of Prrx1CreERT; Rosa26LSL-tdTomato mice. Scale bars=50 μm.
Figure 1—figure supplement 1
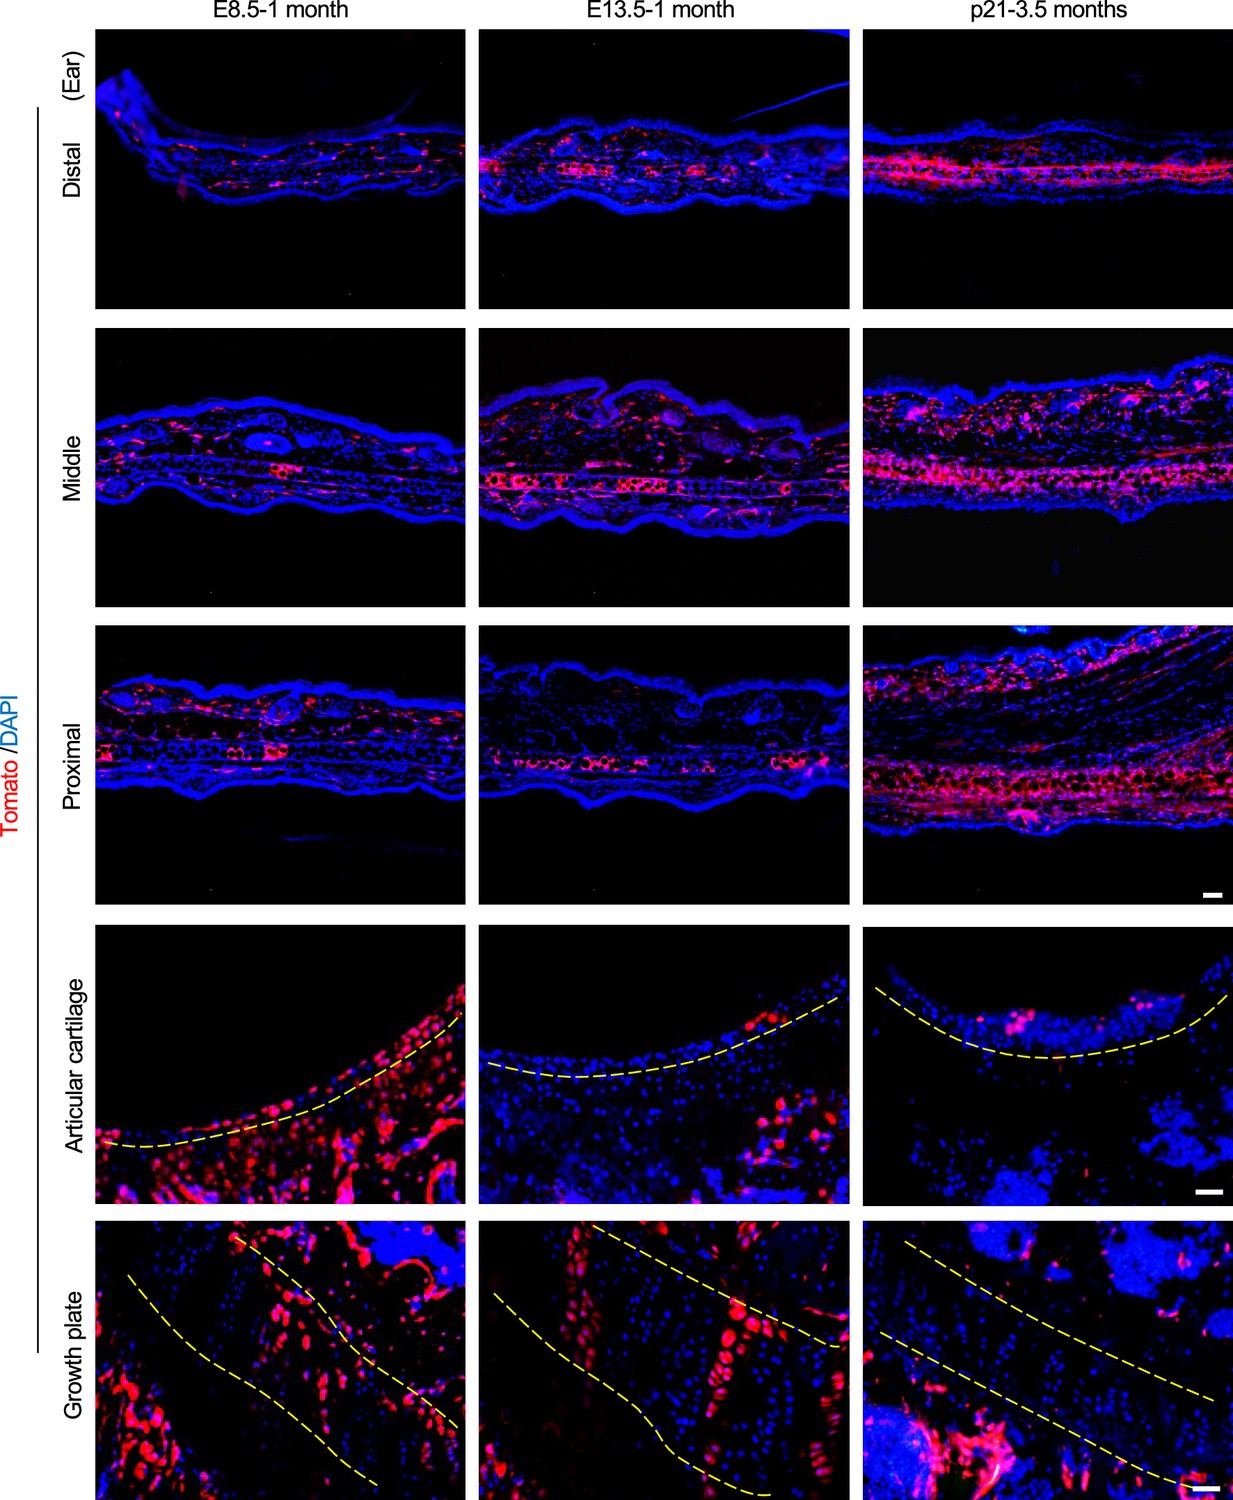
Tracing of chondrocytes in auricle, articular cartilage, and growth plate in Prrx1CreERT; Rosa26LSL-tdTomato mice.
The mice received Tamoxifen (TAM) at E8.5, E13.5, or p21 and the tissues were collected at 1 month or 3.5 months of age. Scale bars (ear)=100 μm. Scale bars (articular cartilage and growth plate)=50 μm.
Figure 2 with 6 supplements

Ablation of Bmpr1a in Prrx1+ in adult mice led to microtia.
(A) A decrease in p-Smad1/5/9 on the ear sections of the Prrx1CreERT; Bmpr1af/f mice. Upper panel: Schedule for Tamoxifen (TAM) administration and mouse euthanasia. Scale bars=20 μm. Arrows: positive signals. Smad1/5/9 staining results. (B) qPCR analysis of Bmpr1a mRNA in the ear samples of the Prrx1CreERT; Bmpr1af/f and control mice. n=3. (C) The ear phenotypes of the Prrx1CreERT; Bmpr1af/f mice 2 months after TAM administration to adult male mice. Right panel: quantitation data. n=4. (D) H/E staining of ear sections from the mutant and control mice. Right panels: The thickness of the cartilage and the size of the chondrocytes in the ears of the mutant and control mice. Scale bars=50 μm. n=3. Unpaired two-tailed Student’s t-test were applied to evaluate the correlation data in (B and C). Two-way ANOVA (or mixed model) multiple comparisons were applied to evaluate the correlation data in (D), p<0.05 was considered as statistically significant.
Figure 2—figure supplement 1
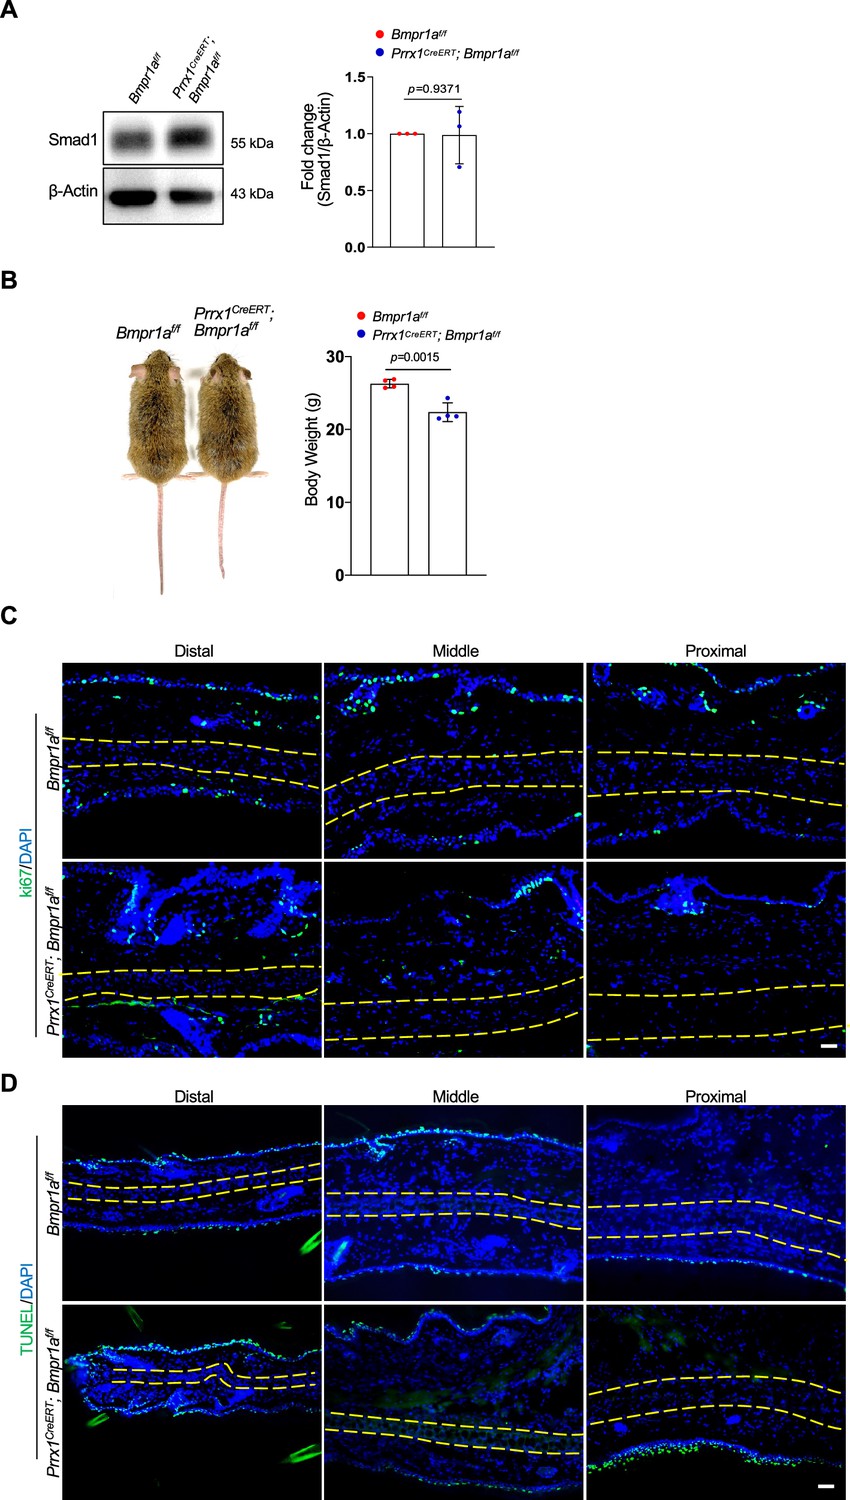
The body weight and cell proliferation and apoptosis in the auricle of Prrx1CreERT; Bmpr1af/f mice.
(A) Representative Western blot results of Smad1 expression in the auricle of Prrx1CreERT; Bmpr1af/f and control mice. (B) The size and body weight of Prrx1CreERT; Bmpr1af/f and control mice. n=4. (C) The Ki67 staining results of the ear sections of the mutant and control mice. Scale bars=50 μm. (D) The TUNEL results of the ear sections of the mutant and control mice. Scale bars=50 μm. Unpaired two-tailed Student’s t-test were applied to evaluate the correlation data in (A and B). p<0.05 was considered as statistically significant.
Figure 2—figure supplement 2
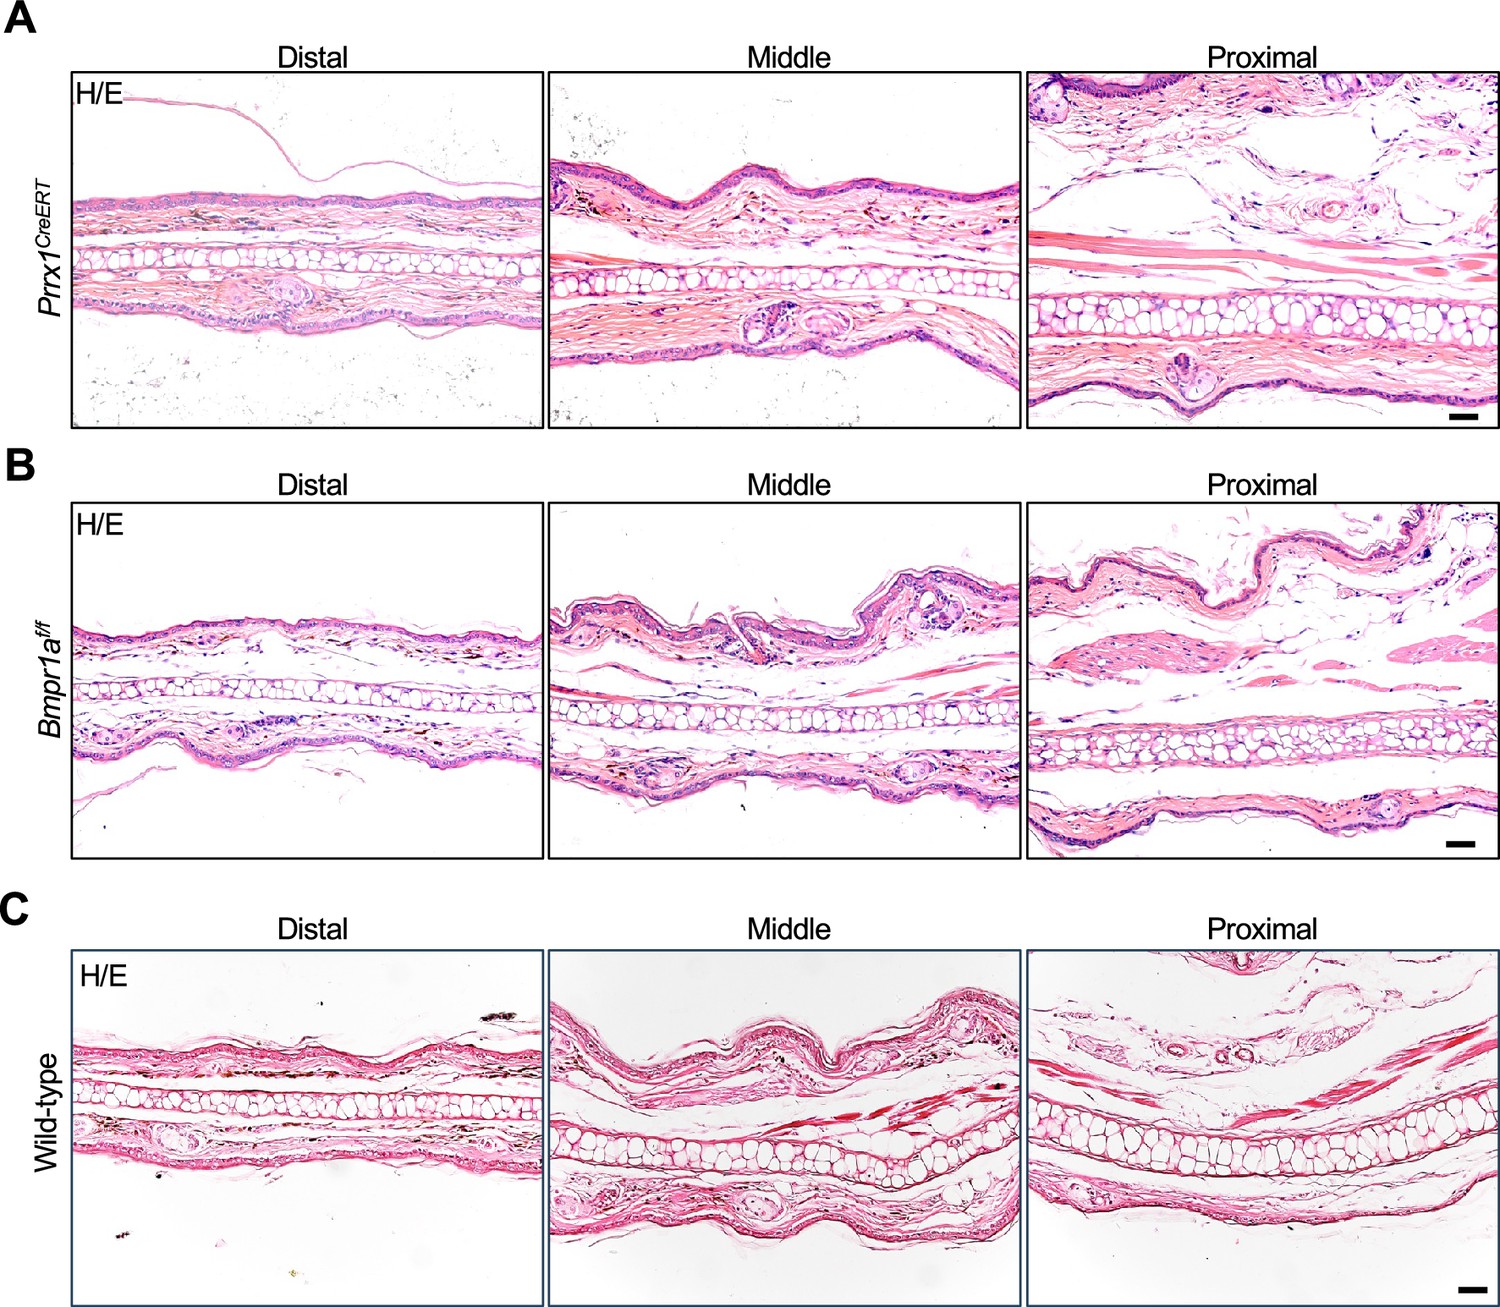
No ear phenotype in Prrx1CreERT or Bmpr1af/f mice.
(A) No ear phenotype was observed in the Prrx1CreERT (with one Prrx1 allele deleted) mice. Scale bars=50 μm. (B) No ear phenotype was observed in the Bmpr1af/f mice. Scale bars=50 μm. (C) H/E staining results of normal mice. Scale bars=50 μm.
Figure 2—figure supplement 3
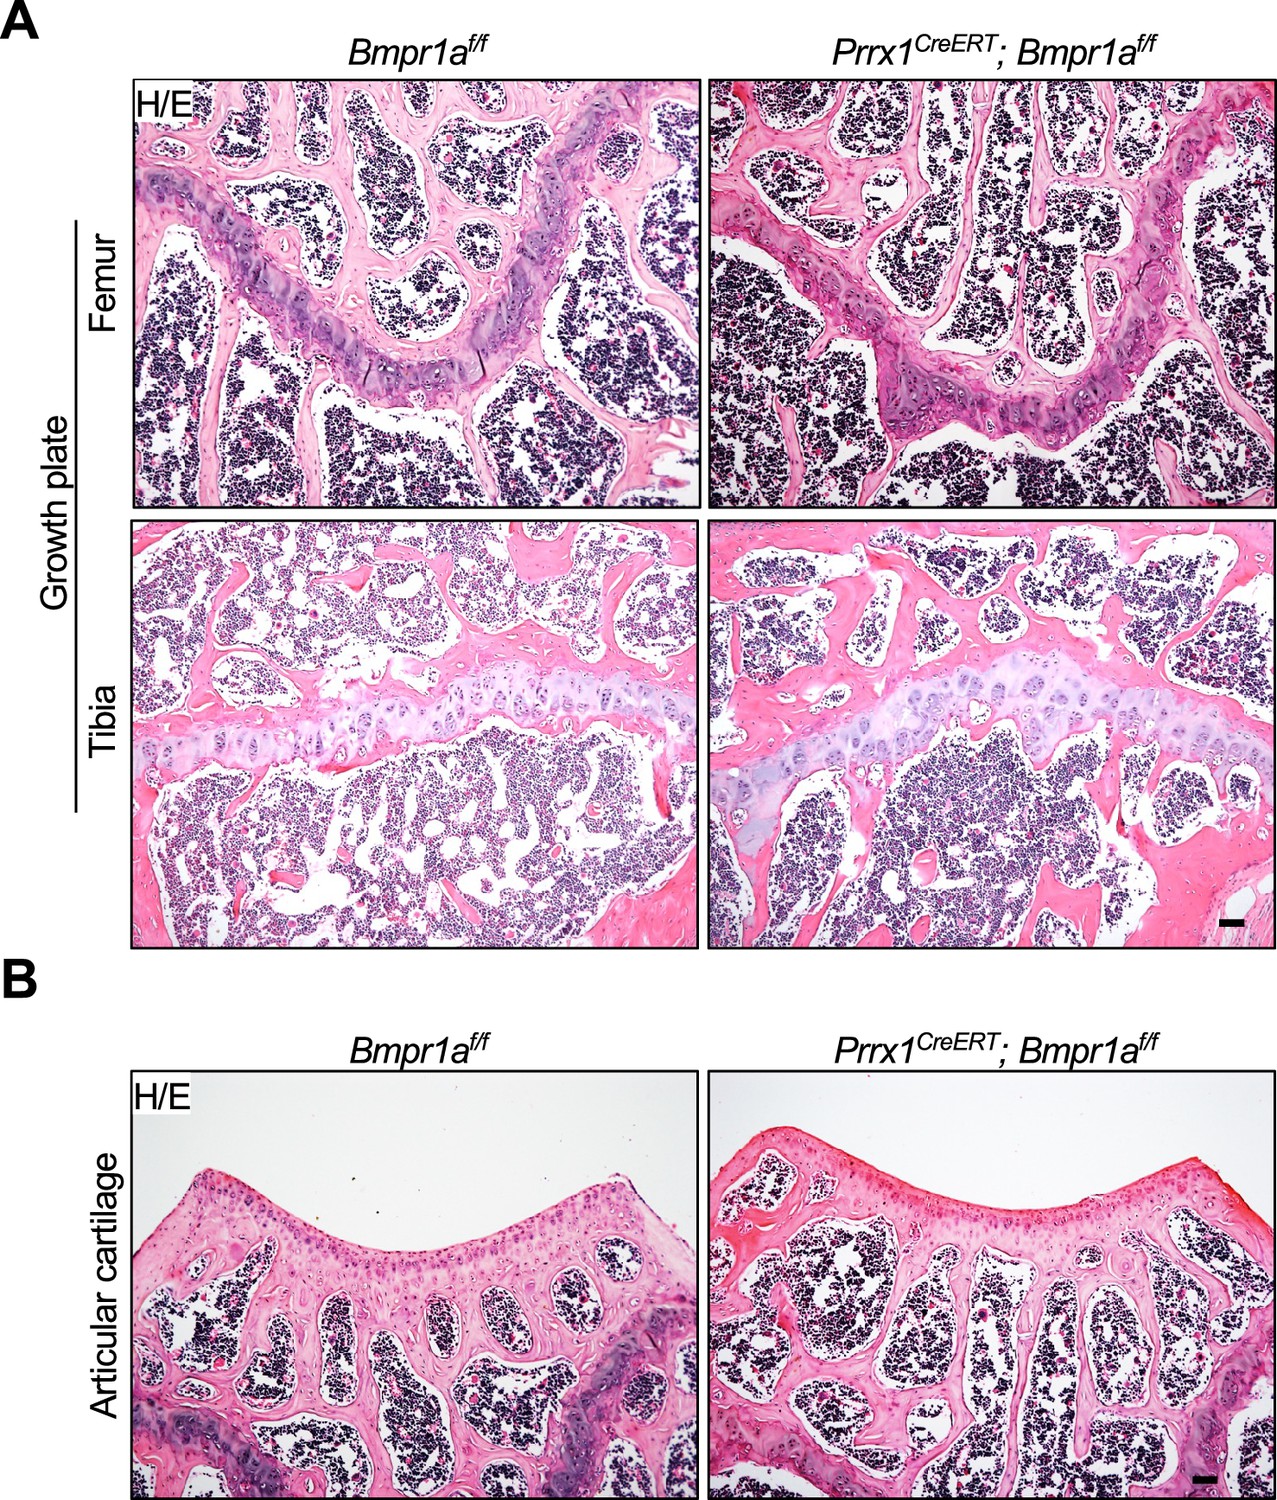
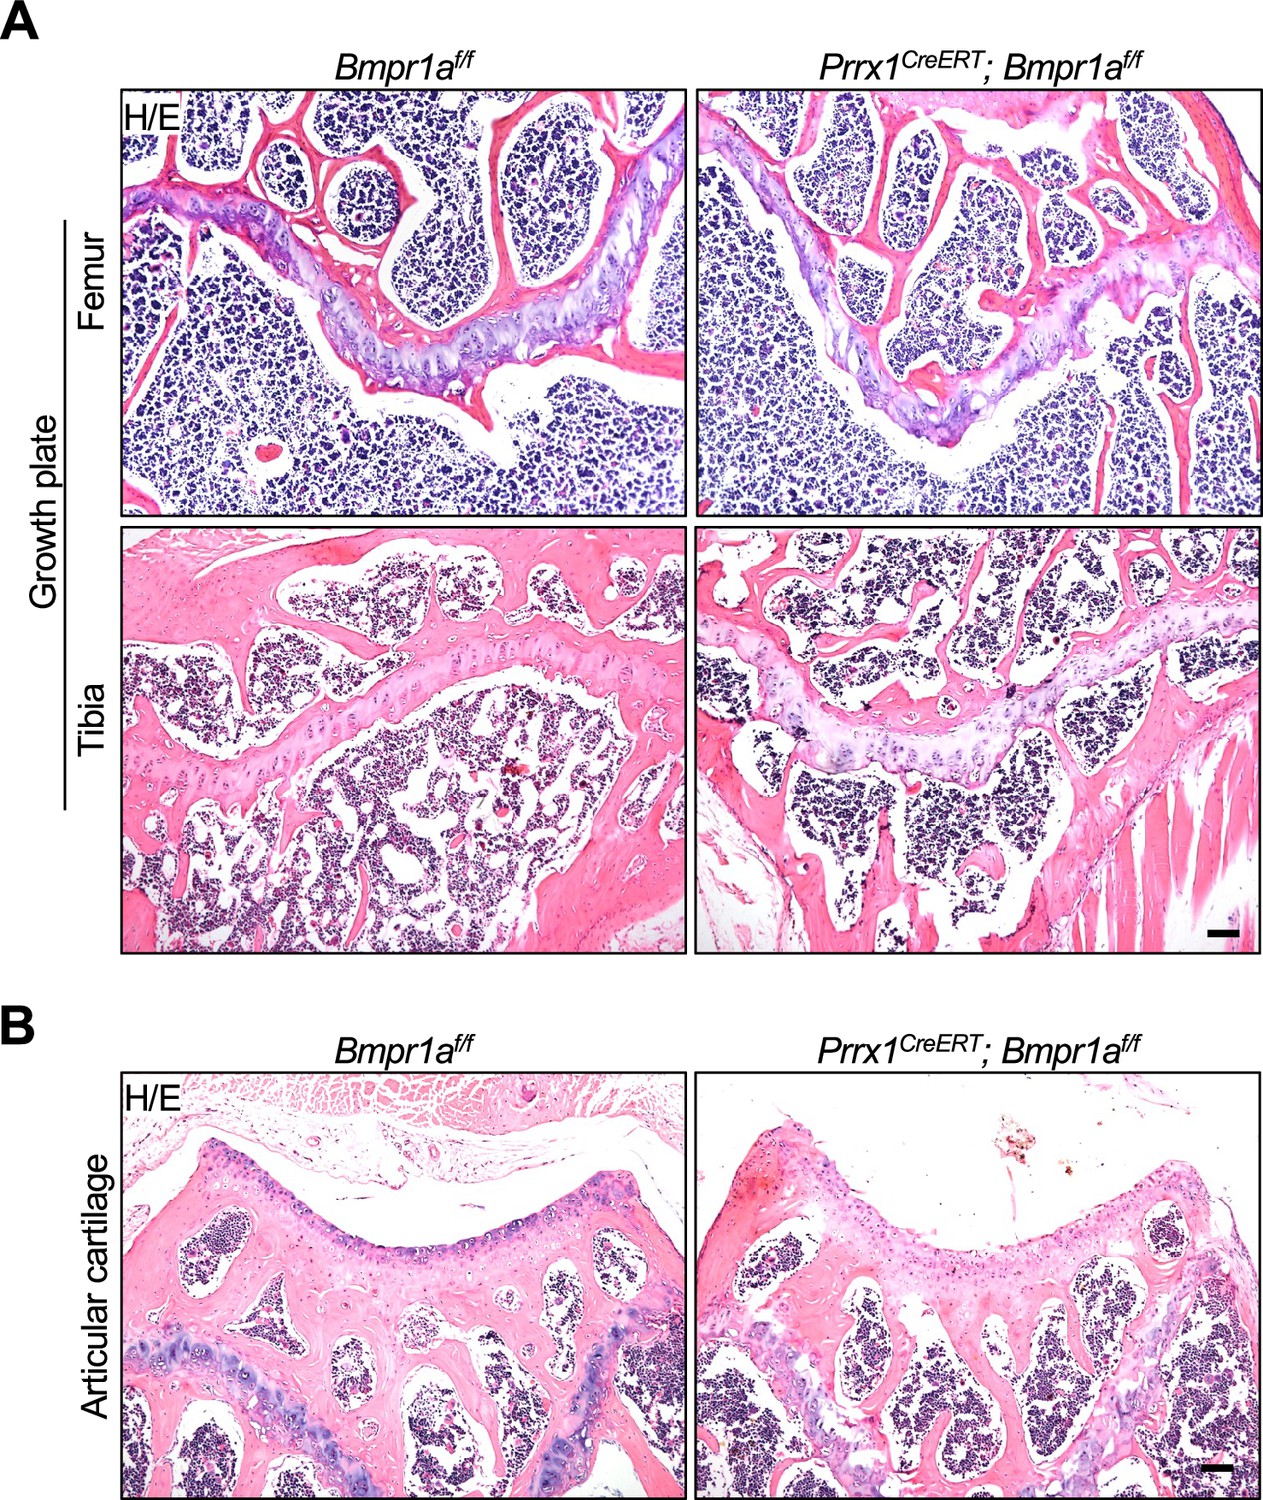
Normal growth plate and articular cartilage in adult Prrx1CreERT; Bmpr1af/f mice receiving Tamoxifen (TAM).
(A) The epiphysial section of the Prrx1CreERT; Bmpr1af/f and control mice. Scale bars=100 μm. (B) Articular sections of the Prrx1CreERT; Bmpr1af/f and control mice. Scale bars=100 μm.
Figure 2—figure supplement 4
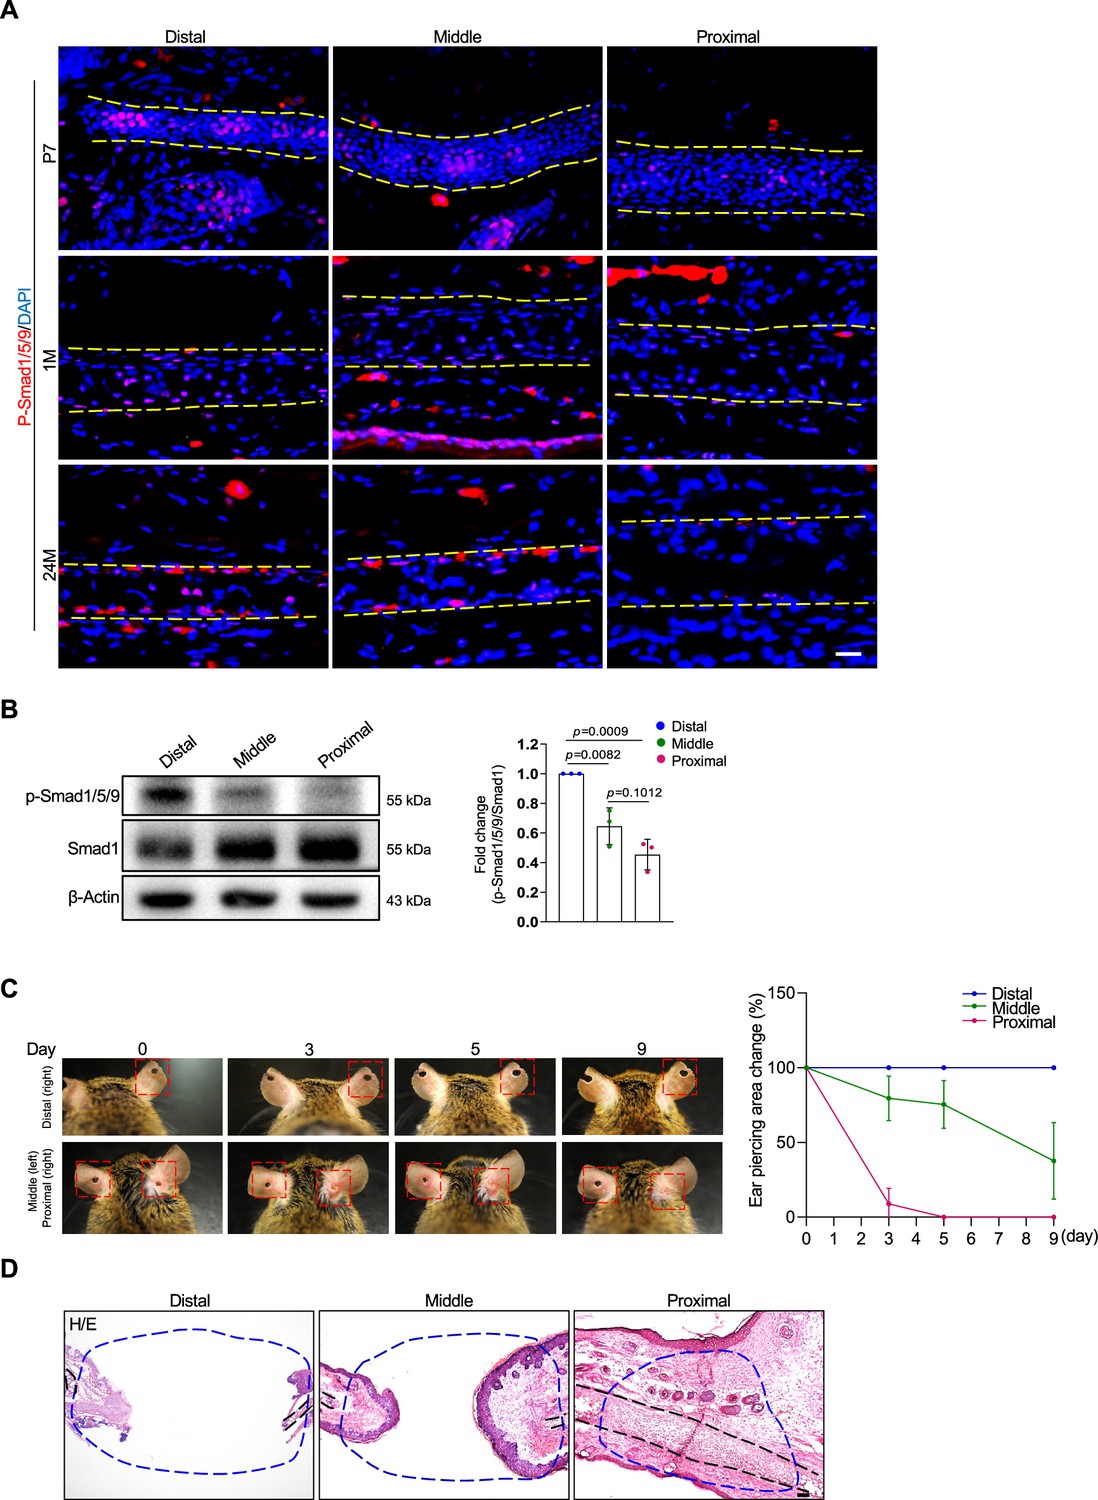
Differences in the regenerative activity of the proximal, middle, and distal auricle.
(A) Representative immunostaining results for p-Smad1/5/9 on the proximal, middle, and distal segments of young or adult mice. (B) Western blot analysis of p-Smad1/5/9 in different segments of the auricle. Right panel: quantitation data. n=3. (C) Regeneration of cartilage in different segments of the auricle. Right panel: quantitation data for the diameter of the wounds. n=4. (D) H/E staining results of the regenerative area. Scale bars=100 μm. One-way ANOVA (and nonparametric or mixed) multiple comparisons were applied to evaluate the correlation data in (B and C). p<0.05 was considered as statistically significant.
Figure 2—figure supplement 5
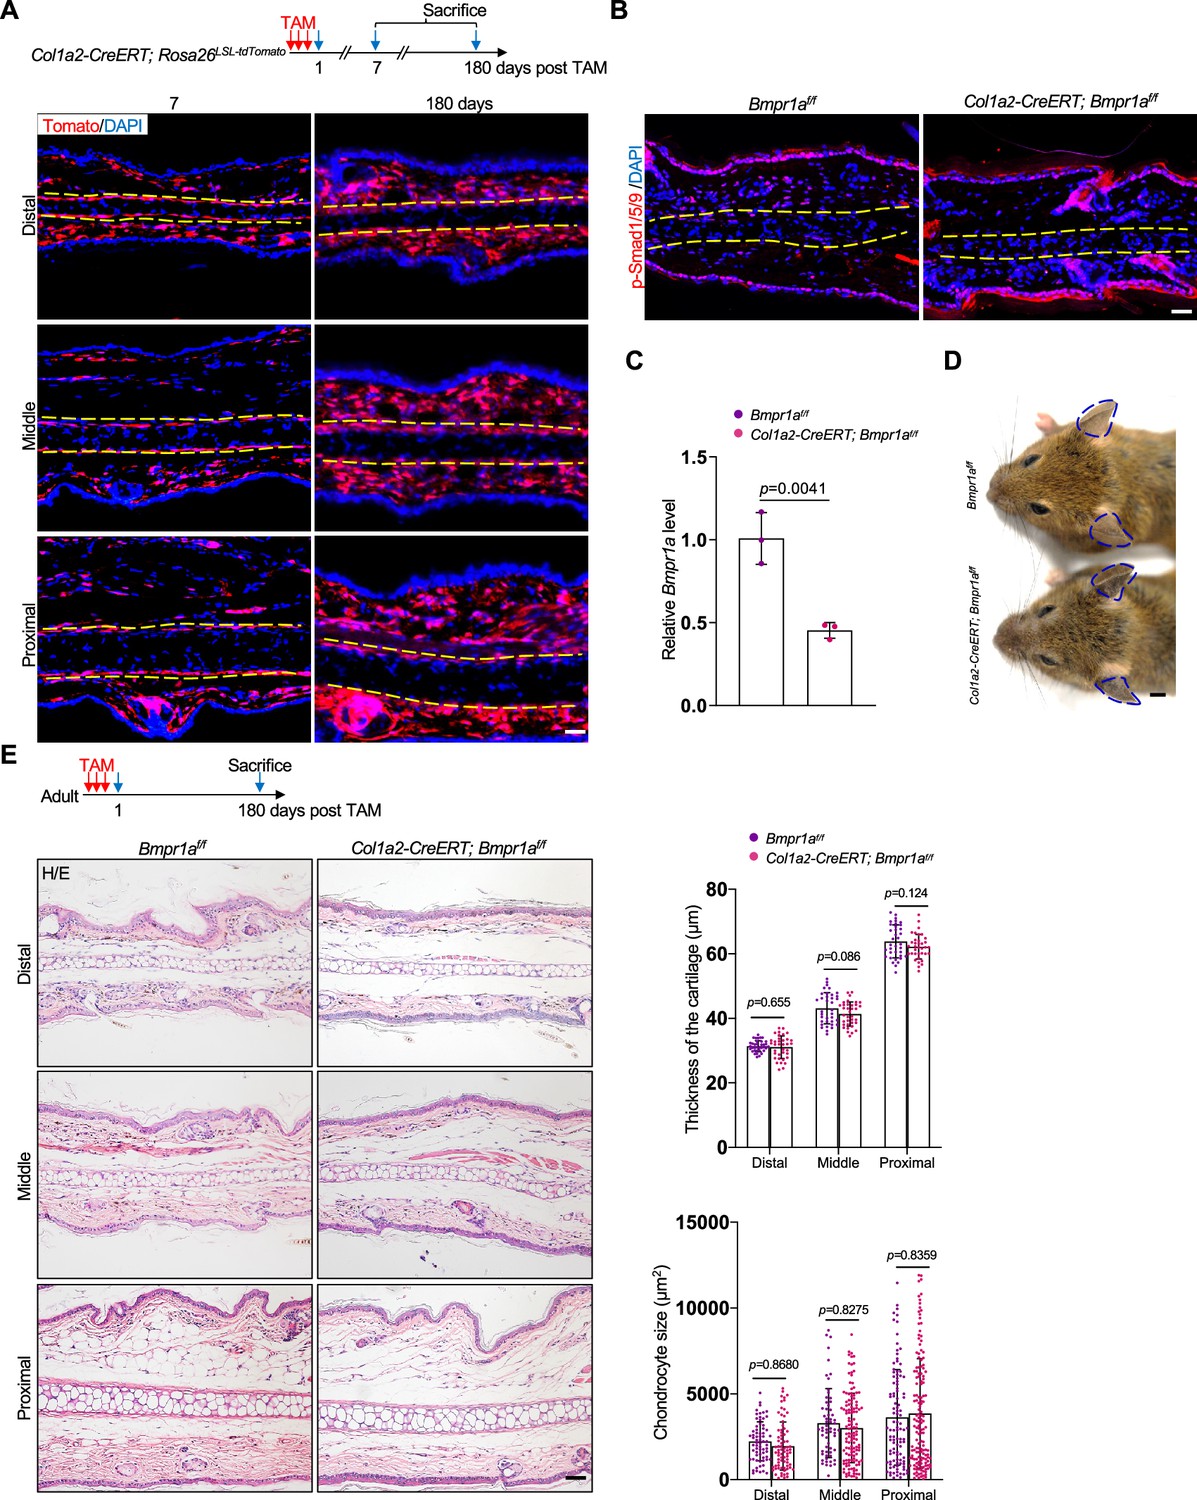
Ablation of Bmpr1a in dermal cells does not cause microtia.
(A) Genetic tracing experiments showed that Col1a2 marks all dermal cells on the ear in adult mice. Scale bars=50 μm. (B) Immunostaining of p-Smad1/5/9 on the ear sections of the mutant and control mice. Scale bars=50 μm. (C) qPCR results for Bmpr1a. n=3. (D) No ear phenotypes in the Col1a2-CreERT; Bmpr1af/f mice. (E) H/E staining of the ear sections of the Col1a2-CreERT; Bmpr1af/f mice 180 days after Tamoxifen (TAM) injection. Upper panel: a diagram showing TAM administration and mouse euthanization. Right panels: The thickness of the cartilage and the size of the chondrocytes in the ear of mutant and control mice. Scale bars=50 μm. n=3. Unpaired two-tailed Student’s t-test were applied to evaluate the correlation data in (C). Two-way ANOVA (or mixed model) multiple comparisons were applied to evaluate the correlation data in (E), p<0.05 was considered as statistically significant.
Figure 2—figure supplement 6
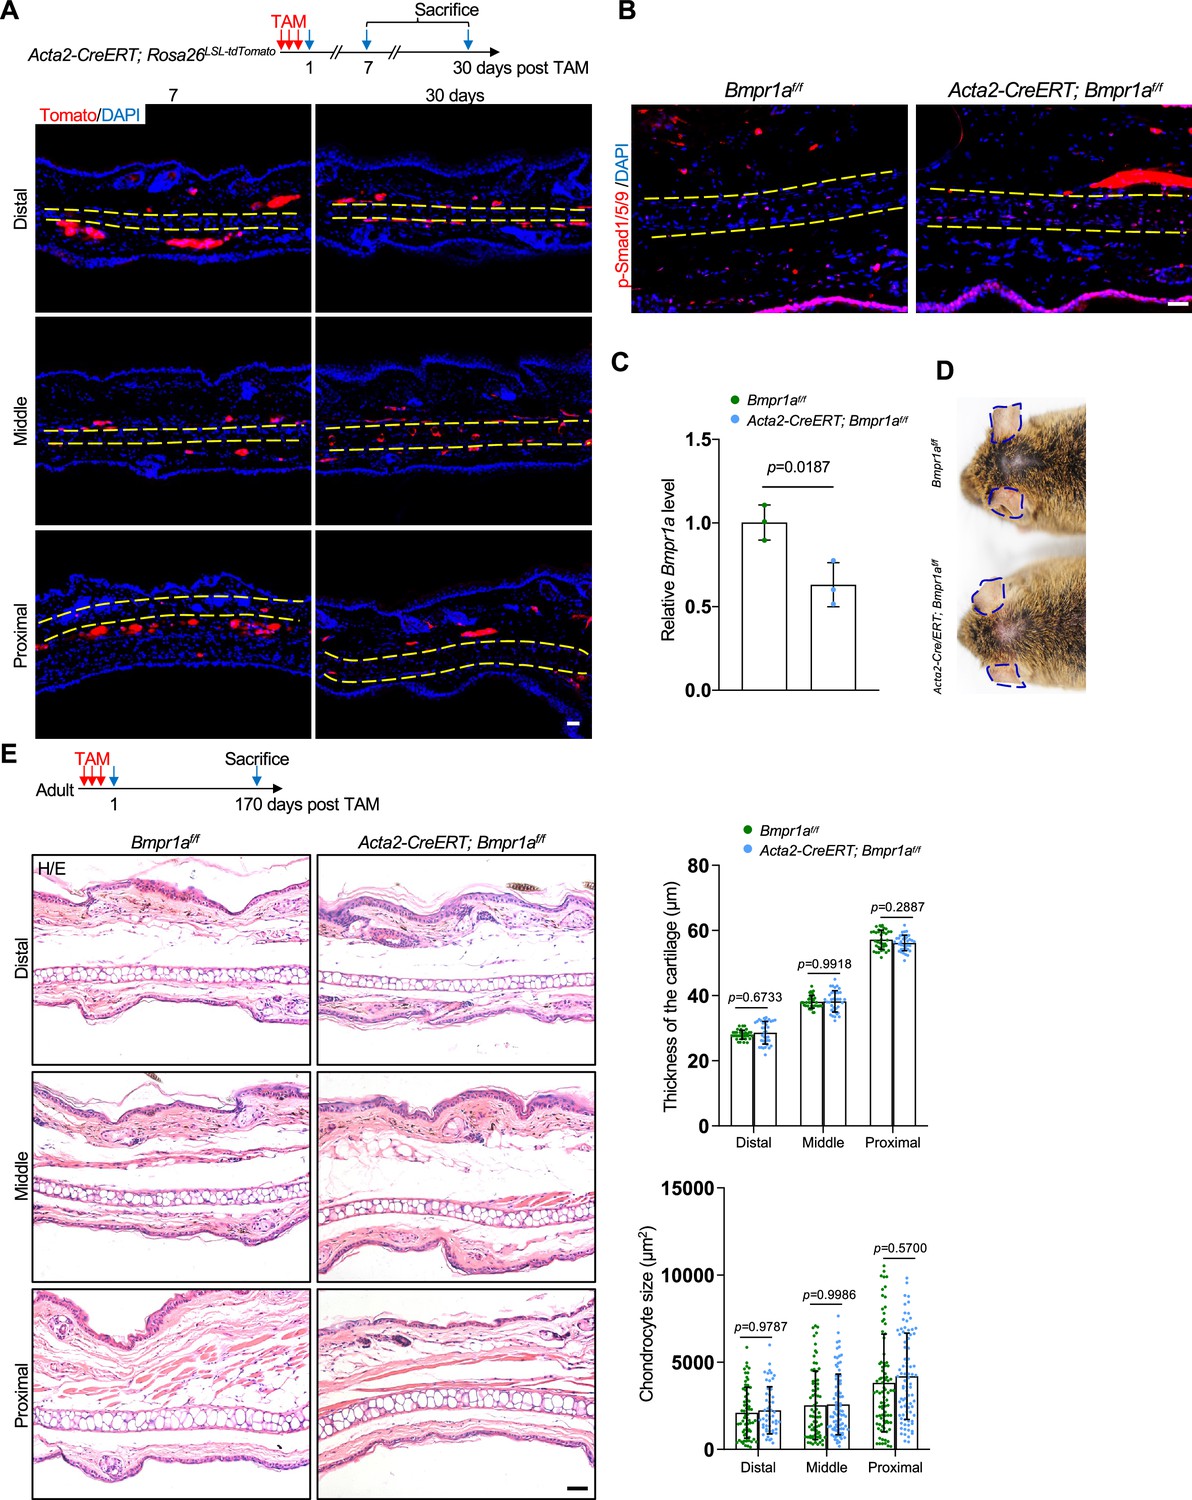
Ablation of Bmpr1a in smooth muscle cells does not cause microtia.
(A) Genetic tracing experiments showed that Acta2 marks smooth muscle cells and a small portion of chondrocytes in the middle segment of the ear in adult mice. upper panel: a diagram showing Tamoxifen (TAM) administration and mouse euthanization. Scale bars=50 μm. (B) Immunostaining of p-Smad1/5/9 in ear sections of the mutant and control mice. Scale bars=100 μm. (C) qPCR results for Bmpr1a. n=3. (D) No ear phenotypes in the Acta2-CreERT; Bmpr1af/f mice. (E) H/E staining of the ear sections of Acta2-CreERT; Bmpr1af/f mice 170 days after TAM injection. Upper panel: a diagram showing TAM administration and mouse euthanization. Right panels: The thickness of the cartilage and the size of the chondrocytes in the ear of mutant and control mice. Scale bars=50 μm. n=3. Unpaired two-tailed Student’s t-test were applied to evaluate the correlation data in (C). Two-way ANOVA (or mixed model) multiple comparisons were applied to evaluate the correlation data in (E), p<0.05 was considered as statistically significant.
Figure 3 with 1 supplement

Ablation of Bmpr1a in Prrx1+ in young mice led to microtia.
(A) A decrease in p-Smad1/5/9 on the ear sections of the Prrx1CreERT; Bmpr1af/f mice that received Tamoxifen (TAM) at P21. Upper panel: Schedule for TAM administration and mouse euthanasia. Scale bars=20 μm. Arrows: positive signals. (B) qPCR analysis of Bmpr1a mRNA in the ear samples of the Prrx1CreERT; Bmpr1af/f and control mice. n=3. (C) The ear phenotypes of the adult Prrx1CreERT; Bmpr1af/f mice that received TAM at P21. Right panel: quantitation data. n=4. (D) H/E staining of ear sections from the mutant and control mice. Right panels: The thickness of the cartilage and the size of the chondrocytes in the ears of the mutant and control mice. Scale bars=50 μm. n=3. Unpaired two-tailed Student’s t-test were applied to evaluate the correlation data in (B and C). Two-way ANOVA (or mixed model) multiple comparisons were applied to evaluate the correlation data in (D), p<0.05 was considered as statistically significant.
Figure 3—figure supplement 1
Normal growth plate and articular cartilage in Prrx1CreERT; Bmpr1af/f mice receiving Tamoxifen (TAM) at P21.
(A) Epiphysial sections of the Prrx1CreERT; Bmpr1af/f and control mice. Scale bars=100 μm. (B) Articular sections of the Prrx1CreERT; Bmpr1af/f and control mice. Scale bars=100 μm.
Figure 4 with 1 supplement
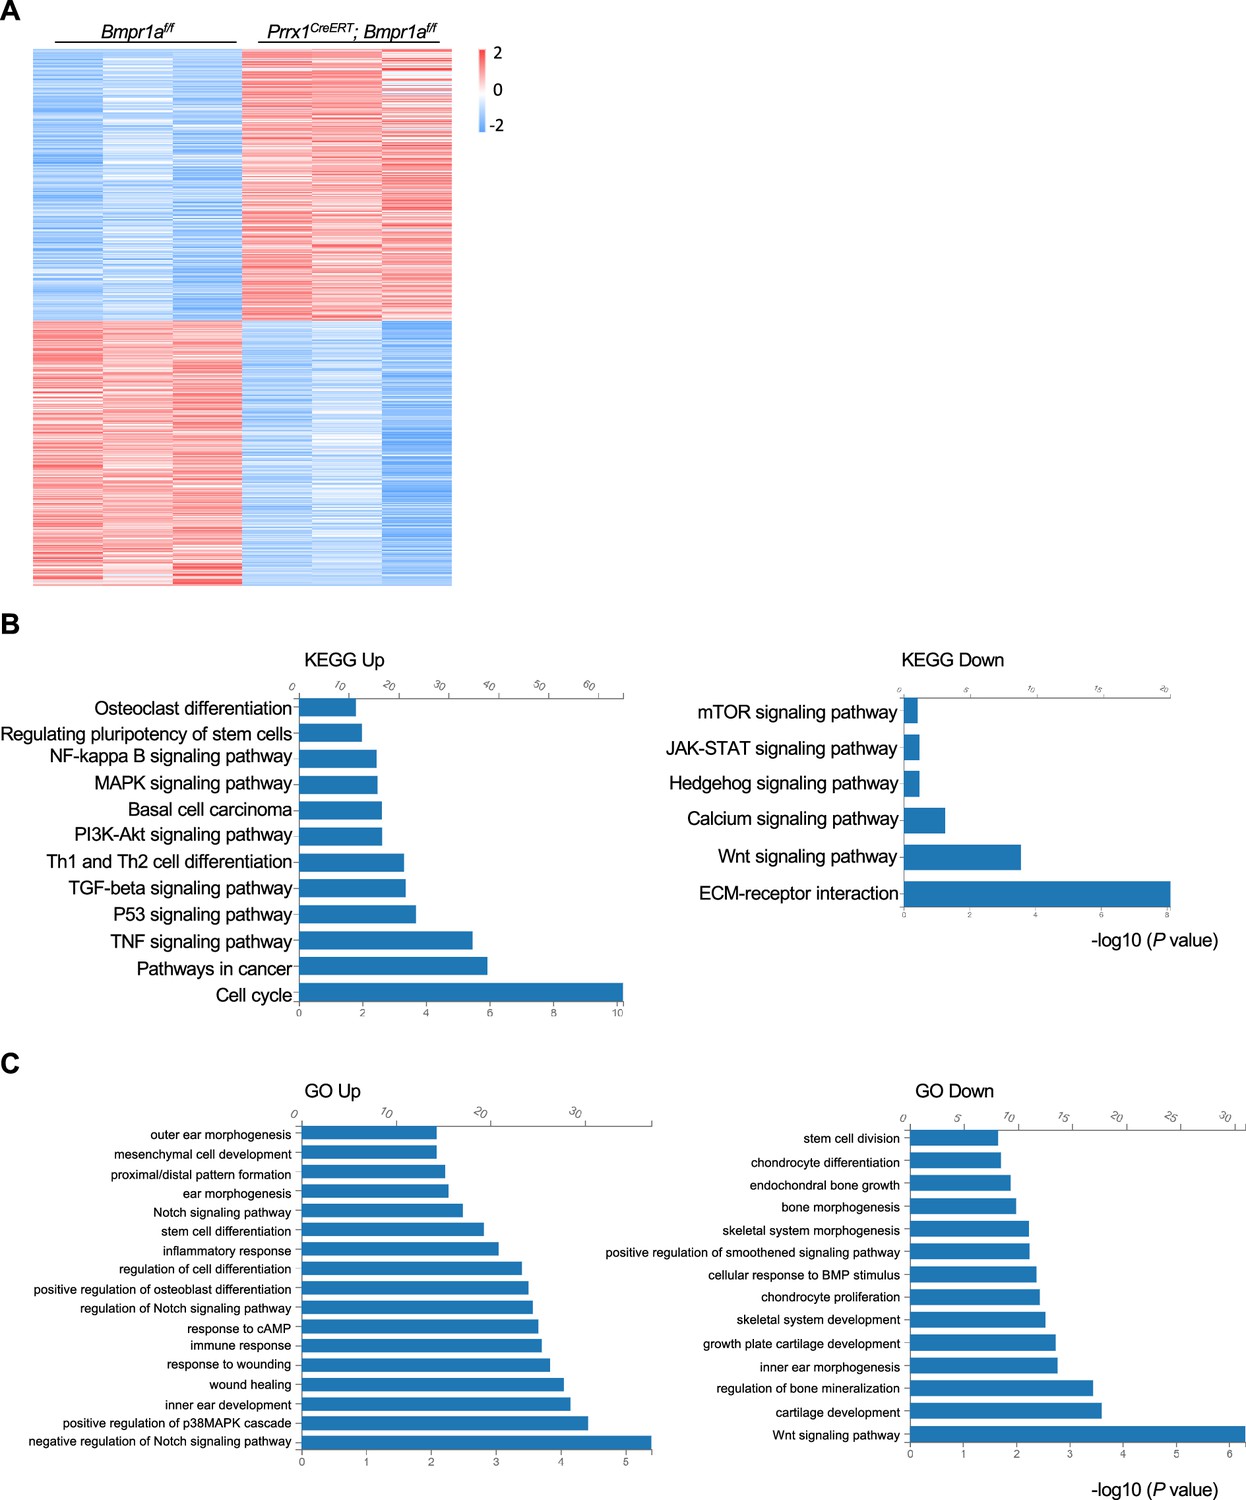
Alteration of transcription profiles in Bmpr1a-deficient chondrocytes.
(A) Heatmaps of the top 500 genes expressed in the distal part of the auricle of the Prrx1CreERT; Bmpr1af/f and age- and gender-matched control mice. n=3. (B) KEGG analysis results of the pathways affected by Bmpr1a ablation. (C) Gene Ontology (GO) analysis results of the modules affected by Bmpr1a ablation.
Figure 4—figure supplement 1
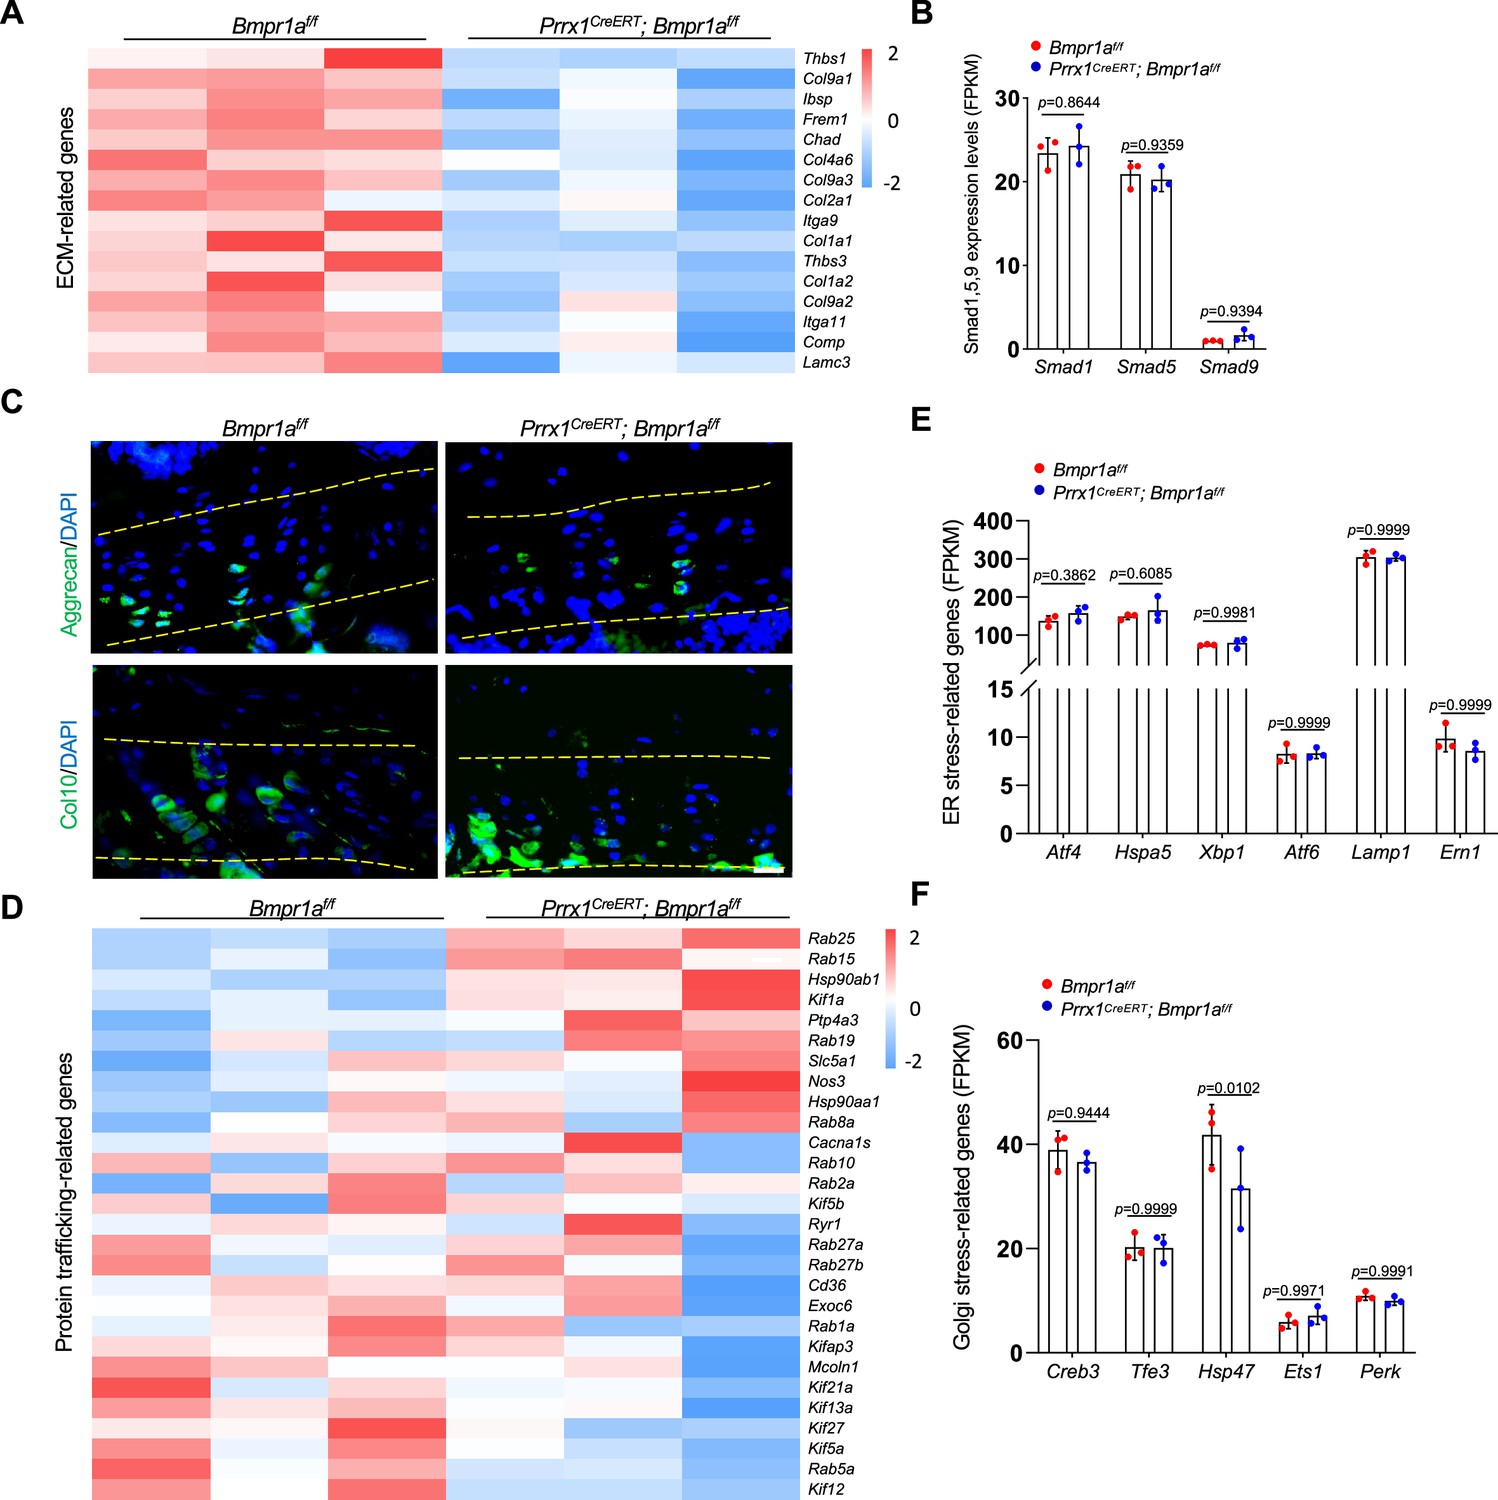
Expression of extracellular matrix (ECM) and protein trafficking-related genes in the auricle of control and Bmpr1a-deficient mice.
(A) Heatmap of ECM-related genes. (B) FKPM values of Smad1/5/9 genes. (C) Representative immunostaining results for Aggrecan and Col10 in growth plates of the mutant and control mice. Scale bars=20 μm. (D) Heatmap of protein trafficking-related genes. (E) FKPM values of ER stress-related genes. F. FKPM values of Golgi stress-related genes.
Figure 5 with 1 supplement
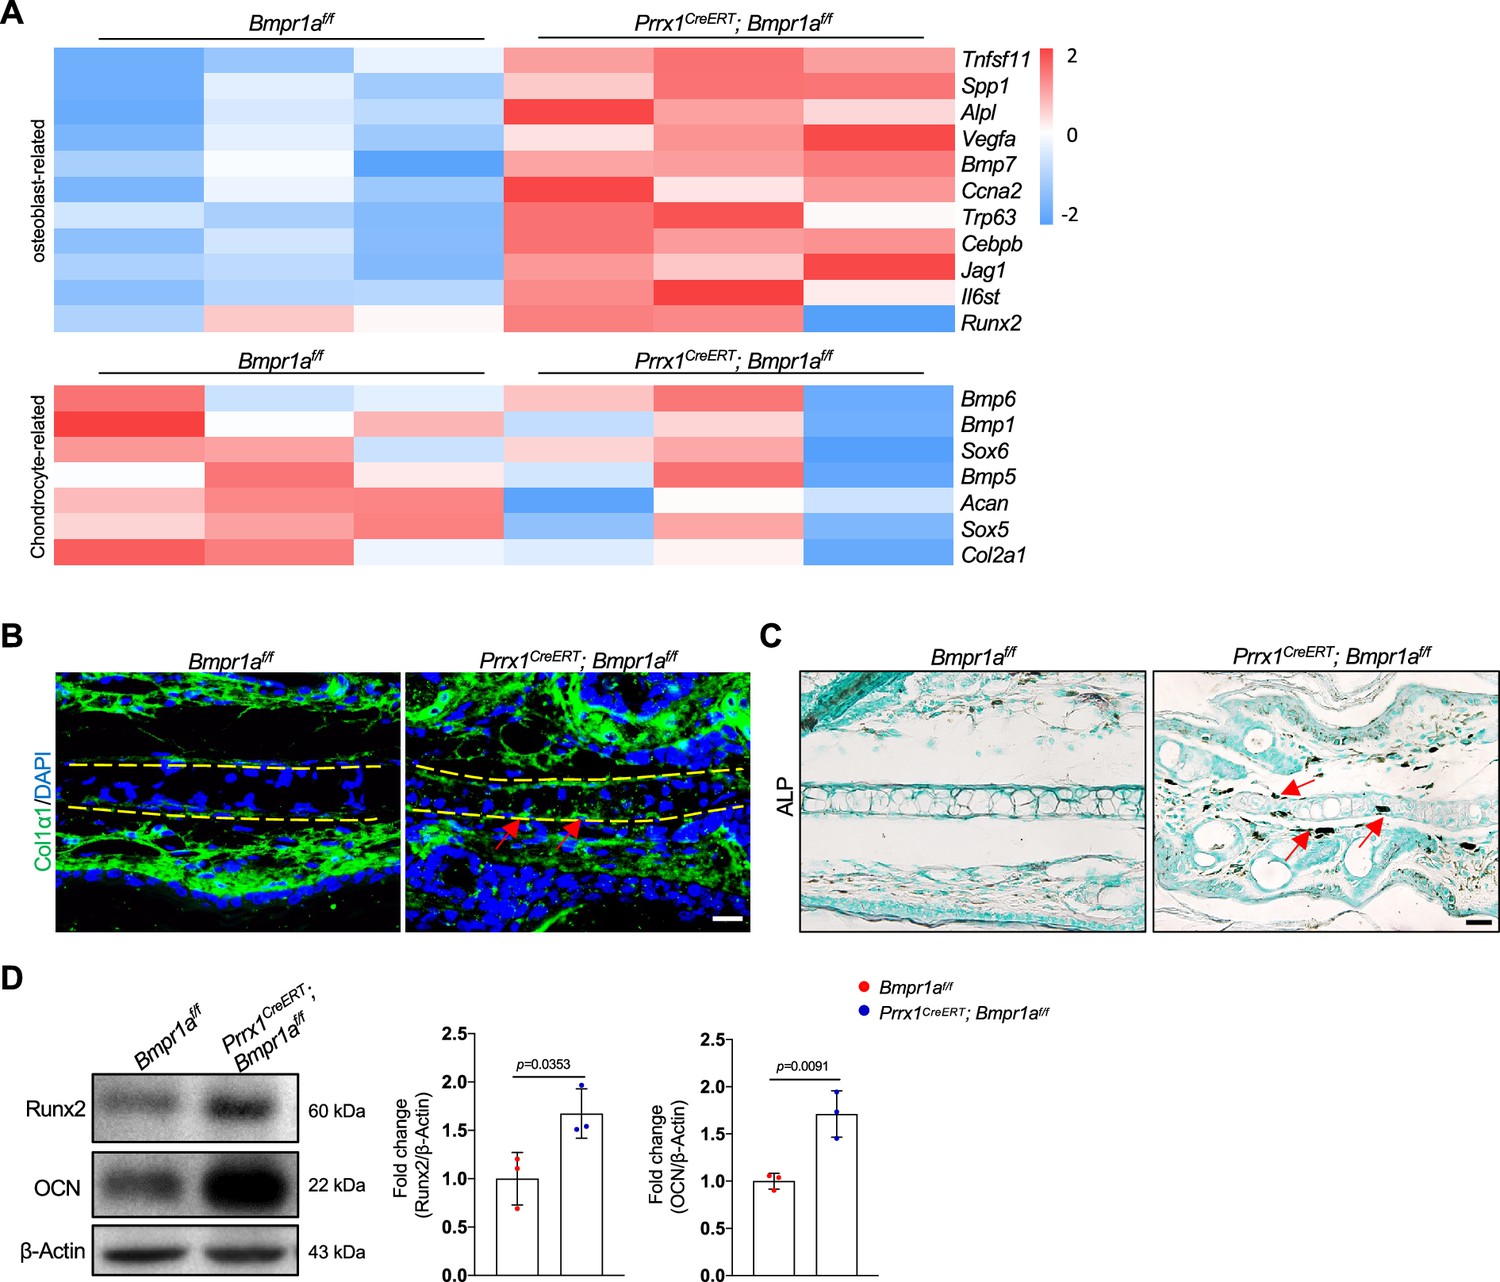
Bmpr1a deficiency leads to an auricle chondrocyte fate switch to osteoblasts.
(A) Heatmaps of osteoblast-related genes and chondrocyte-related genes differentially expressed in the Bmpr1a-deficient and control mice. n=3. (B). Immunostaining results for Col1α1 in ear sections of the Bmpr1a-deficient and control mice. Scale bars=20 μm. Arrows: positive signals. (C) Alkaline phosphatase (ALP) activity was greatly increased in the auricle of the Prrx1CreERT; Bmpr1af/f mice compared to the control mice. Scale bars=50 μm. Arrows: positive signals. (D) WB results showed that the expression of the osteoblast marker genes Runx2 and osteocalcin was increased in the mutant samples. Right panel: quantitation data. n=3. Unpaired two-tailed Student’s t-test were applied to evaluate the correlation data in (D), p<0.05 was considered as statistically significant.
-
Figure 5—source data 1
Original file for the western blot in Figure 5D.
- https://cdn.elifesciences.org/articles/91883/elife-91883-fig5-data1-v1.pdf
Figure 5—figure supplement 1
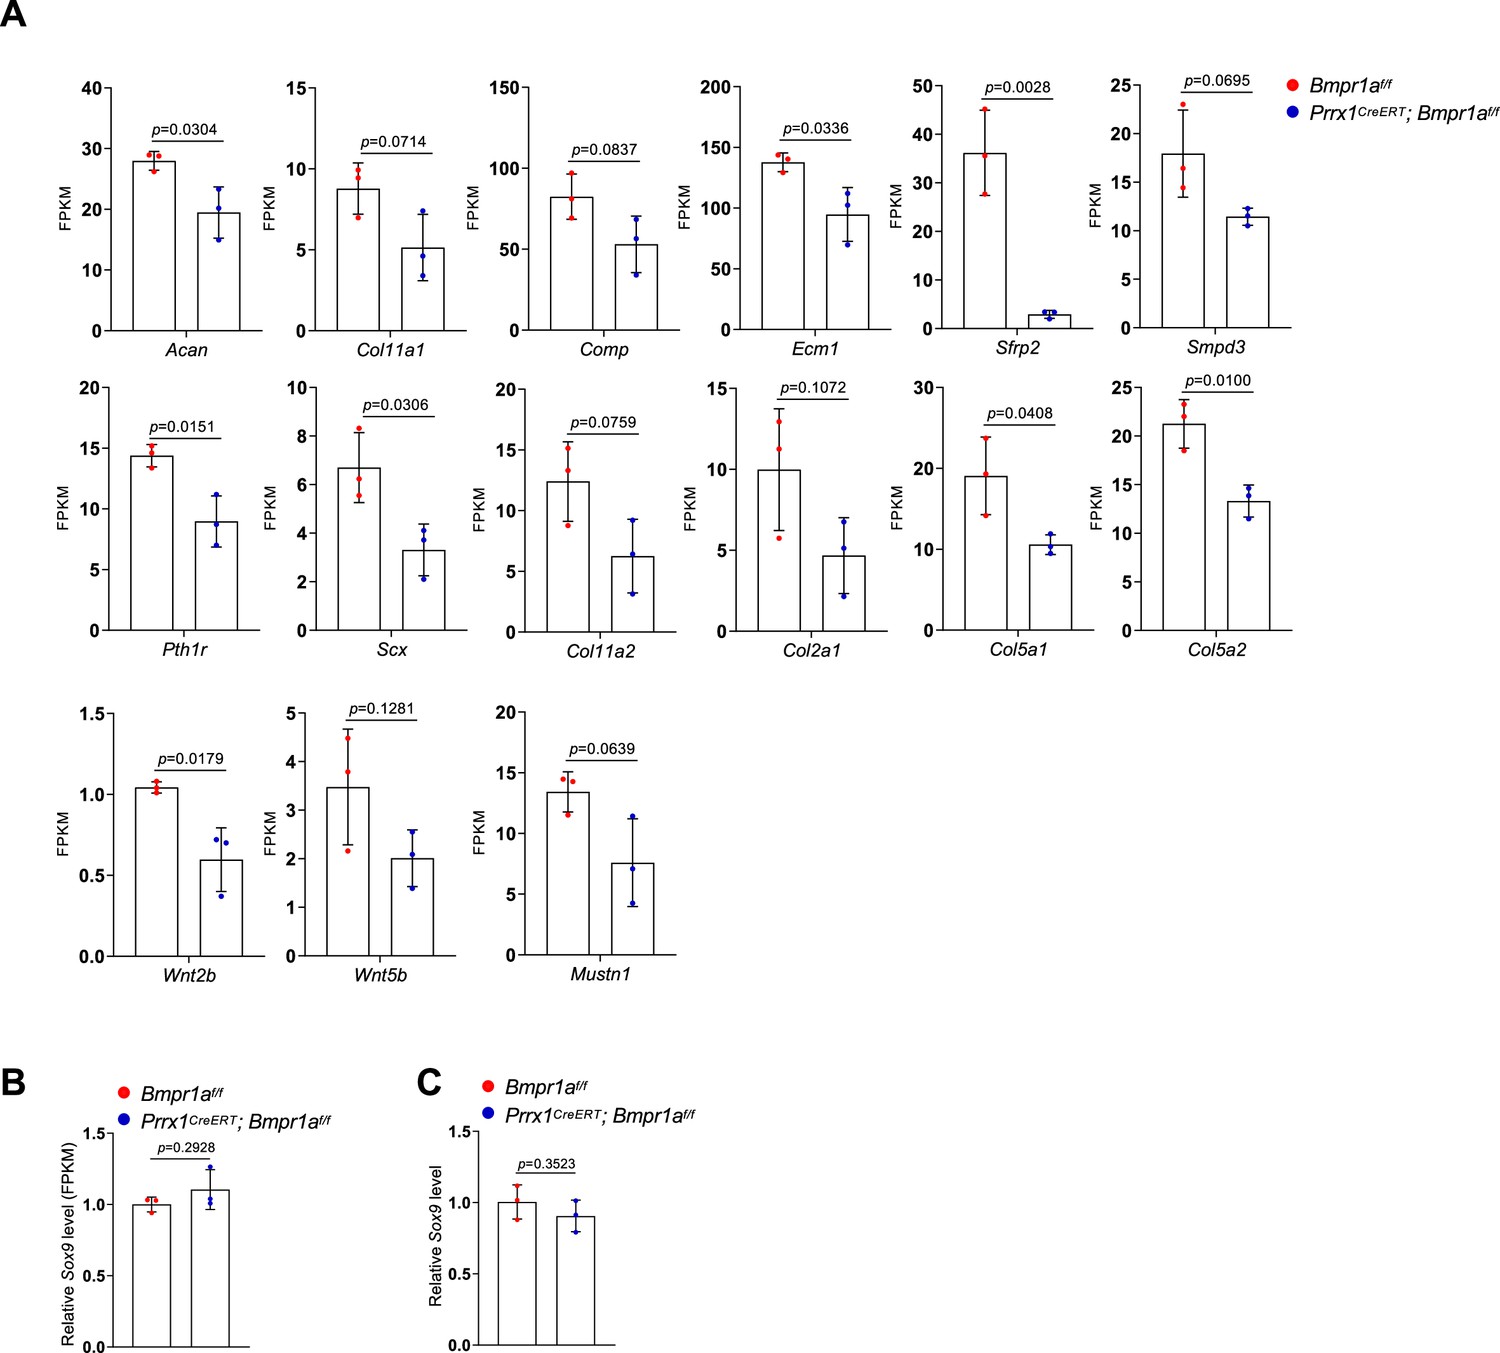
Expression of chondrocyte-related genes and Sox9 in the auricle of control and Bmpr1a-deficient mice.
(A) FKPM values for chondrocyte-related genes. (B) FKPM values for Sox9. (C) qPCR results for Sox9.
Figure 6
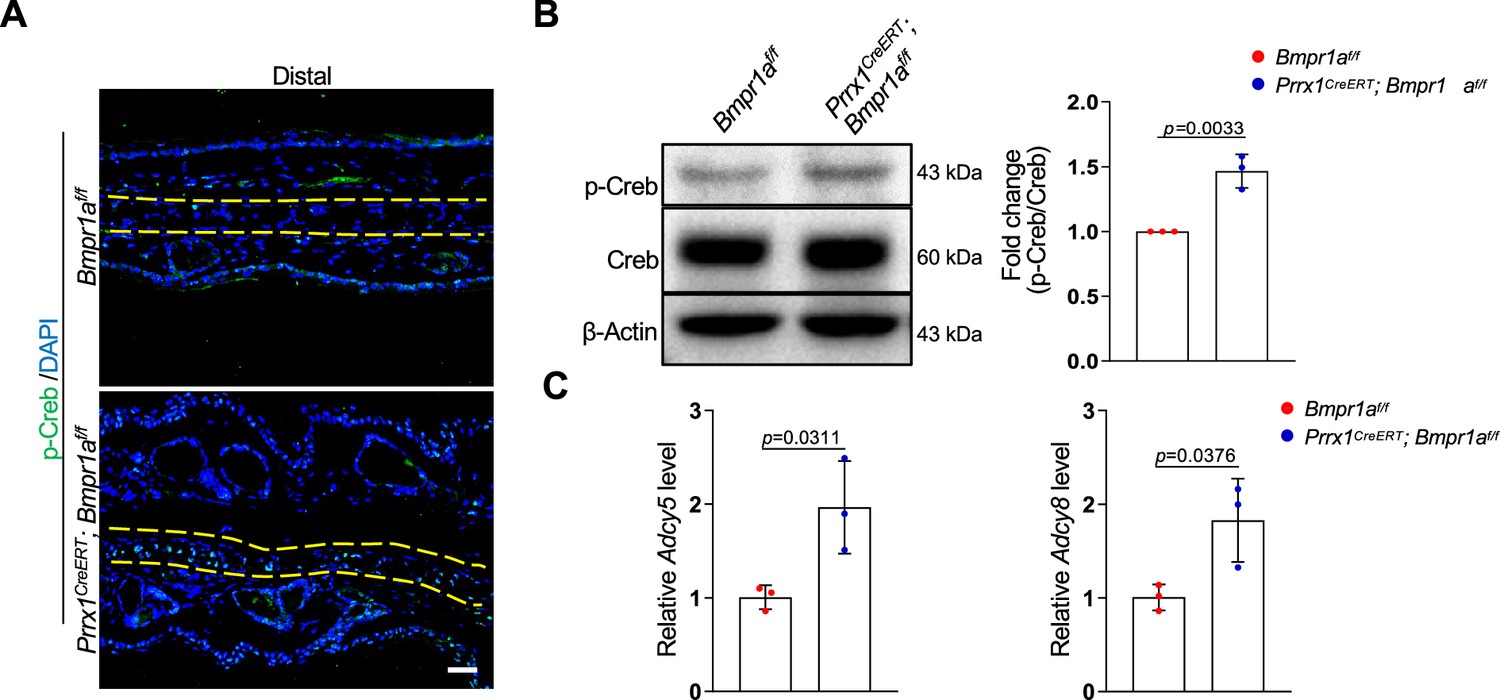
Bmpr1a deficiency led to hyperactivation of PKA signaling.
(A) Immunoassaying for p-Creb in the ear sections of the Bmpr1a-deficient and control mice. (B) Western blot analysis of p-Creb in auricle samples of the Bmpr1a-deficient and control mice. Right panel: quantitation data. N=3. (C) qPCR results for Adcy5 and Adcy8 in auricle samples of the Bmpr1a-deficient and control mice. n=3. Unpaired two-tailed Student’s t-test were applied to evaluate the correlation data in (B and C), p<0.05 was considered as statistically significant.
-
Figure 6—source data 1
Original file for the western blot in Figure 6B.
- https://cdn.elifesciences.org/articles/91883/elife-91883-fig6-data1-v1.pdf
Figure 7 with 1 supplement
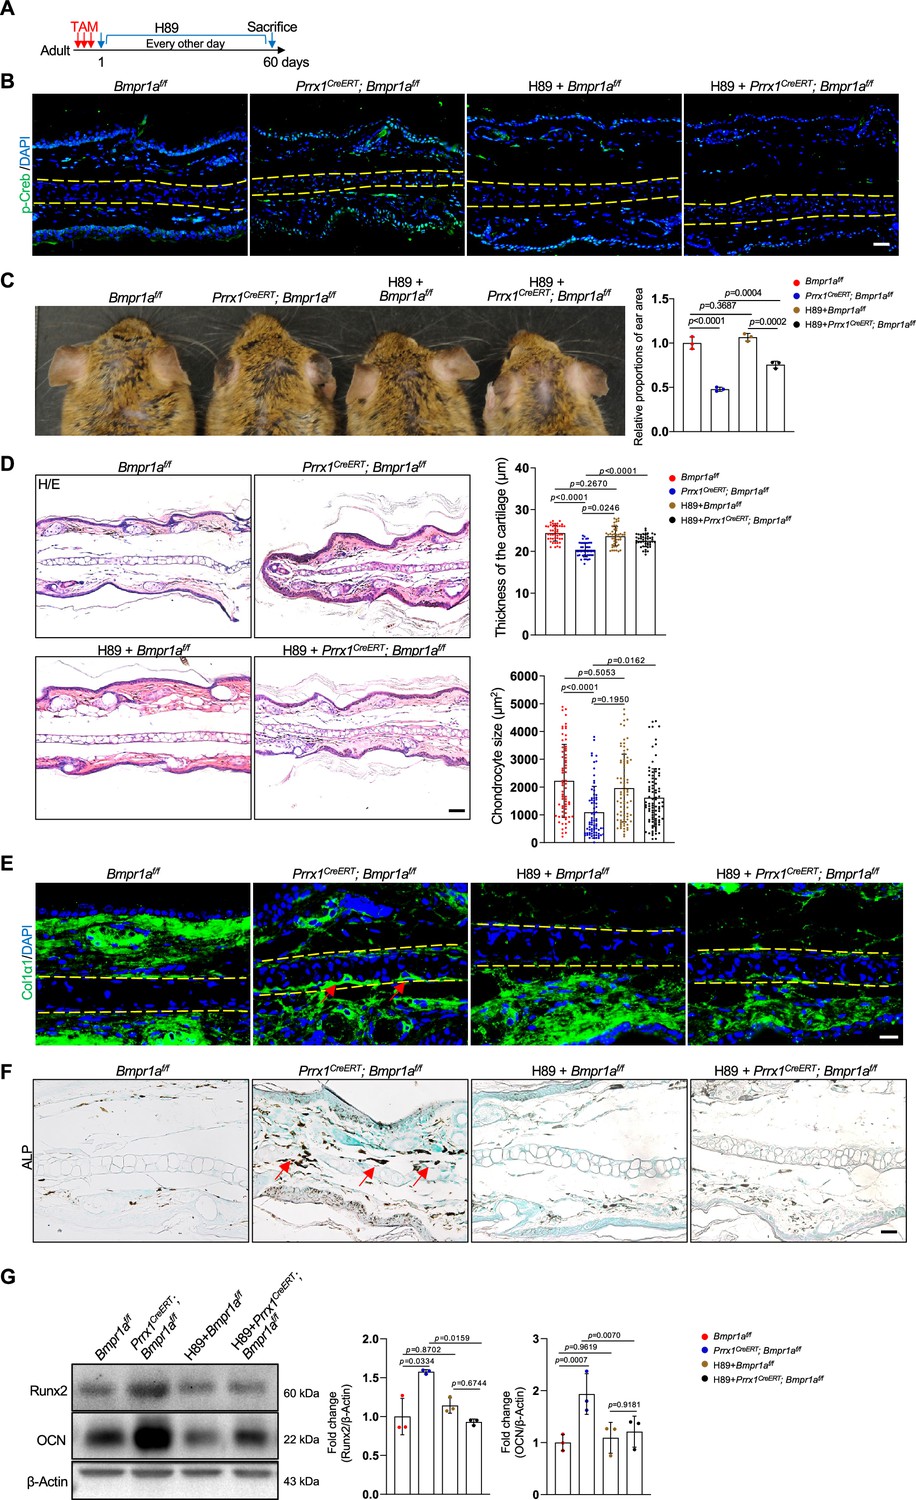
Inhibition of PKA signaling blocks microtia development in Bmpr1a-deficient mice.
(A) Diagram showing the schedule of Tamoxifen (TAM) and H89 administration. (B) Immunostaining results of p-Creb in ear sections of the H89-treated mutant and control mice. Scale bars=50 μm. (C) The rescue of the microtia phenotype in the mutant mice by H89. Right panels: Quantitation data. n=3. (D) H/E staining results. Right panels: the thickness of the cartilage and the size of the chondrocytes in the ear of the mutant and control mice. n=3. Right panels: Quantitation data. Scale bars=50 μm. n=3. (E) Immunostaining results for Col1α1 in the ear sections of the H89-treated mutant and control mice. Scale bars=20 μm. Arrows: positive signals. (F) Alkaline phosphatase (ALP) activity was greatly suppressed by H89 in the auricle of the Prrx1CreERT; Bmpr1af/f mice compared to the control mice. Scale bars=50 μm. Arrows: positive signals. G. WB blot also showed that H89 rescued the expression of the osteoblast marker genes Runx2 and osteocalcin in the mutant mice. Right panel: quantitation data. n=3. One-way ANOVA (and nonparametric or mixed) multiple comparisons were applied to evaluate the correlation data in (C, D, and G). p<0.05 was considered as statistically significant.
-
Figure 7—source data 1
Original file for the western blot in Figure 7G.
- https://cdn.elifesciences.org/articles/91883/elife-91883-fig7-data1-v1.pdf
Figure 7—figure supplement 1
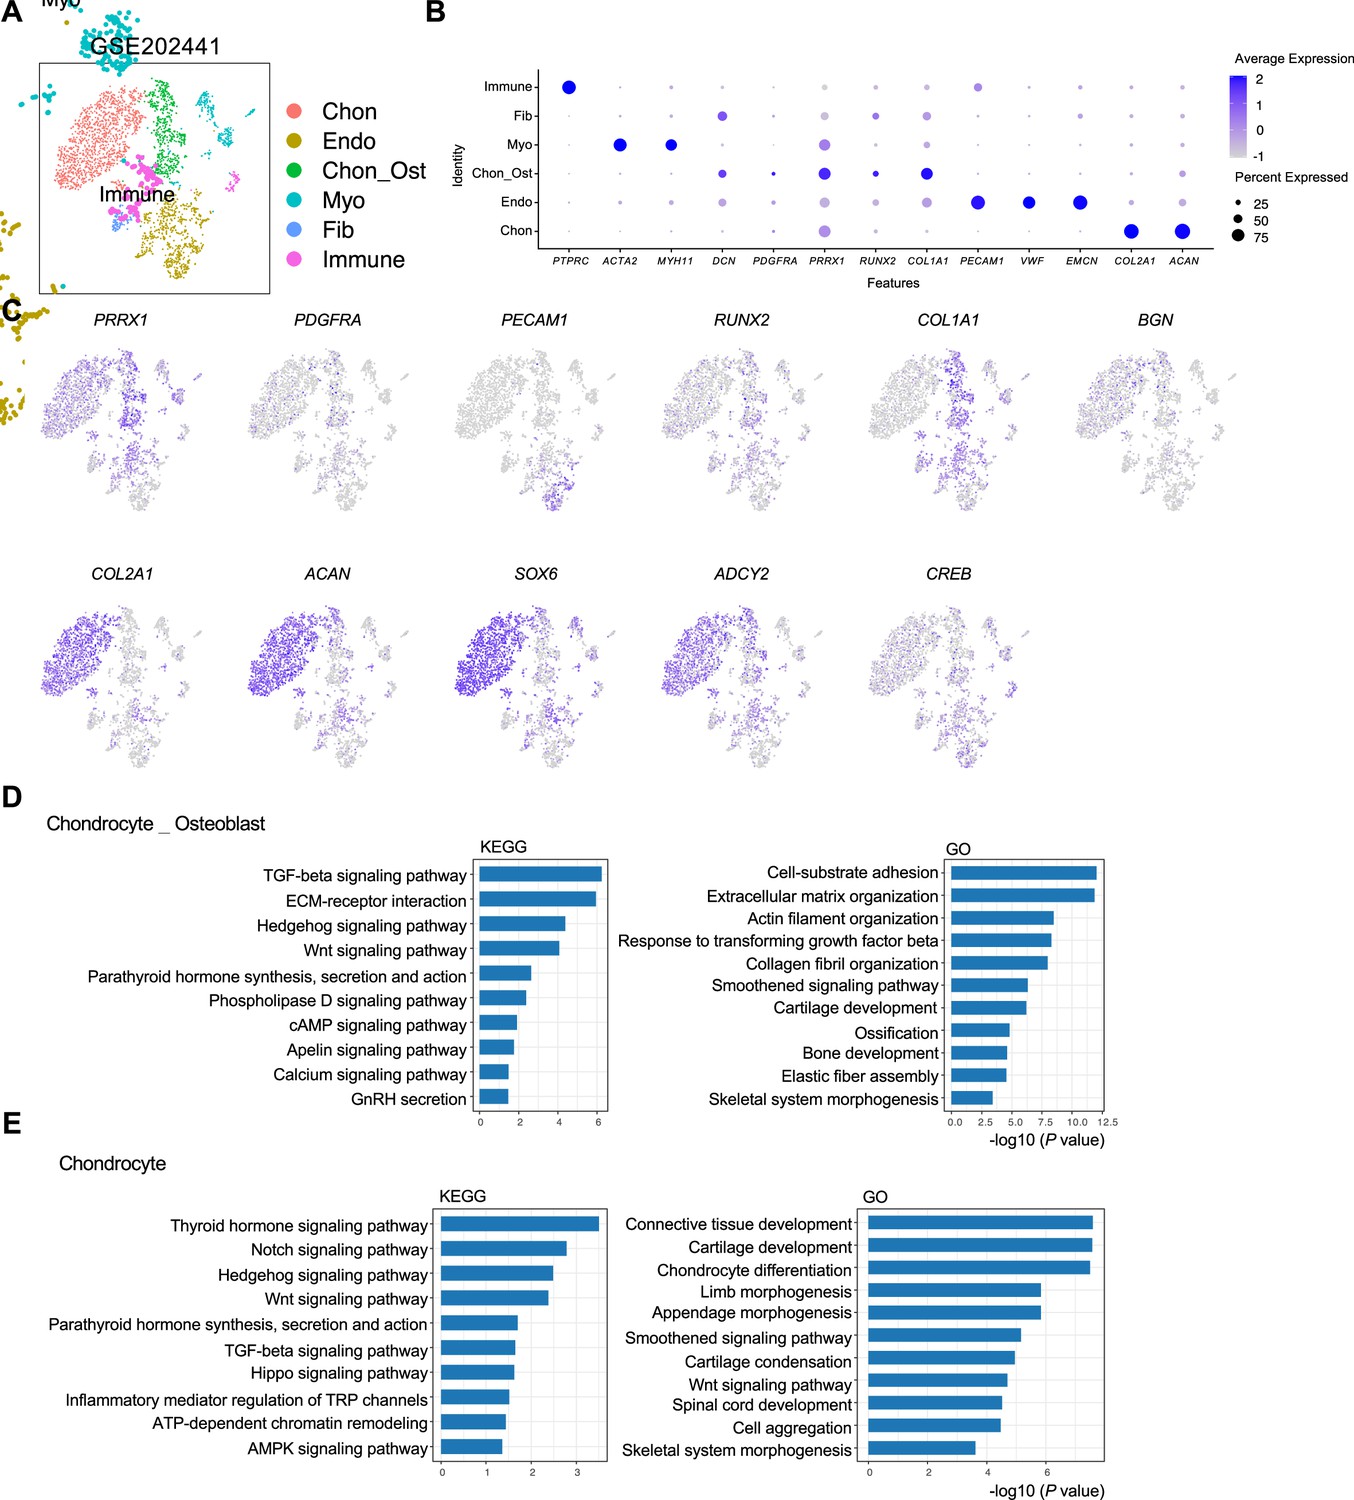
Analysis of scRNA-seq data of human microtia pinna samples.
(A) tSNE results of the cell populations in the pinna samples of microtia patients. (B) The expression of marker genes in various cell populations. (C) Analysis of osteoblast and chondrocyte signature genes. (D) KEGG and Gene Ontology (GO) analysis of the osteoblast (Chon_Ost) population. (E) KEGG and GO analysis of the chondrocyte population.
Tables
Key resources table
| Reagent type (species) or resource | Designation | Source or reference | Identifiers | Additional information |
|---|---|---|---|---|
| Strain, strain background (Mus musculus) | Prrx1CreERT2 | Shanghai Biomodel Organism Science & Technology Development Co., Ltd | (8 weeks to 5 months of age) | |
| Strain, strain background (Mus musculus) | Acta2-CreERT2 | The Jackson Laboratory | Strain #:032758 RRID:IMSR_JAX:032758 | (8 weeks to 5 months of age) |
| Strain, strain background (Mus musculus) | Col1a2-CreERT2 | The Jackson Laboratory | Strain #:029567 RRID:IMSR_JAX:029567 | (8 weeks to 5 months of age) |
| Strain, strain background (Mus musculus) | Rosa26LSL-tdTomato | The Jackson Laboratory | Strain #:007909 RRID:IMSR_JAX:007909 | (8 weeks to 5 months of age) |
| Strain, strain background (Mus musculus) | Bmpr1a flox | Yuji Mishina’s Lab | (8 weeks to 5 months of age) | |
| Antibody | anti-Ki67 (Rabbit polyclonal) | Abcam | Cat# ab15580, RRID: AB_443209 | IF(1:200) |
| Antibody | anti-Vimentin (Rabbit monoclonal) | Abcam | Cat#: ab92547; RRID:AB_10562134 | IF(1:500) |
| Antibody | anti-Col1α1 (Rabbit polyclonal) | Abcam | Cat#: ab21286; RRID:AB_446161 | IF(1:100) |
| Antibody | anti-Col1α2 (Mouse monoclonal) | Santa Cruz | Cat#: sc-393573; RRID:AB_2716872 | IF(1:100) |
| Antibody | anti-phospho-CREB (Rabbit polyclonal) | UPSTATE | Cat#: 06–519; RRID:AB_9310153 | IF(1:100) |
| Antibody | Anti-phospho-Smad1/5/9 (Rabbit polyclonal) | Millopore | Cat#: AB3848-I | IF(1:100) WB(1:1000) |
| Antibody | anti-RUNX2 (Rabbit monoclonal) | Cell Signaling Technology | Cat#: 12556; RRID:AB_2732805 | WB(1:1000) |
| Antibody | anti-Osteocalcin (Rabbit polyclonal) | Abcam | Cat#: ab93876; RRID:AB_ 10675660 | WB(1:1000) |
| Commercial assay or kit | TRACP & ALP double-stain kit | TaKaRa | Cat# MK300 | Used to label Osteoclast or Osteoblast |
| Commercial assay or kit | In Situ Cell Death Detection Kit | Roche | REF11684795910 | Used to label apoptotic cells |
| Chemical compound, drug | H89 | Selleck | S1582 | 10 mg/kg |
Additional files
-
Supplementary file 1
The original statistical data of this article.
- https://cdn.elifesciences.org/articles/91883/elife-91883-supp1-v1.xlsx
-
MDAR checklist
- https://cdn.elifesciences.org/articles/91883/elife-91883-mdarchecklist1-v1.docx
Download links
A two-part list of links to download the article, or parts of the article, in various formats.
Downloads (link to download the article as PDF)
Open citations (links to open the citations from this article in various online reference manager services)
Cite this article (links to download the citations from this article in formats compatible with various reference manager tools)
BMP signaling maintains auricular chondrocyte identity and prevents microtia development by inhibiting protein kinase A
eLife 12:RP91883.
https://doi.org/10.7554/eLife.91883.3


