Serotonergic amplification of odor-evoked neural responses maps onto flexible behavioral outcomes
- Department of Biomedical Engineering, Washington University in St. Louis, United States
Figures
Figure 1 with 4 supplements
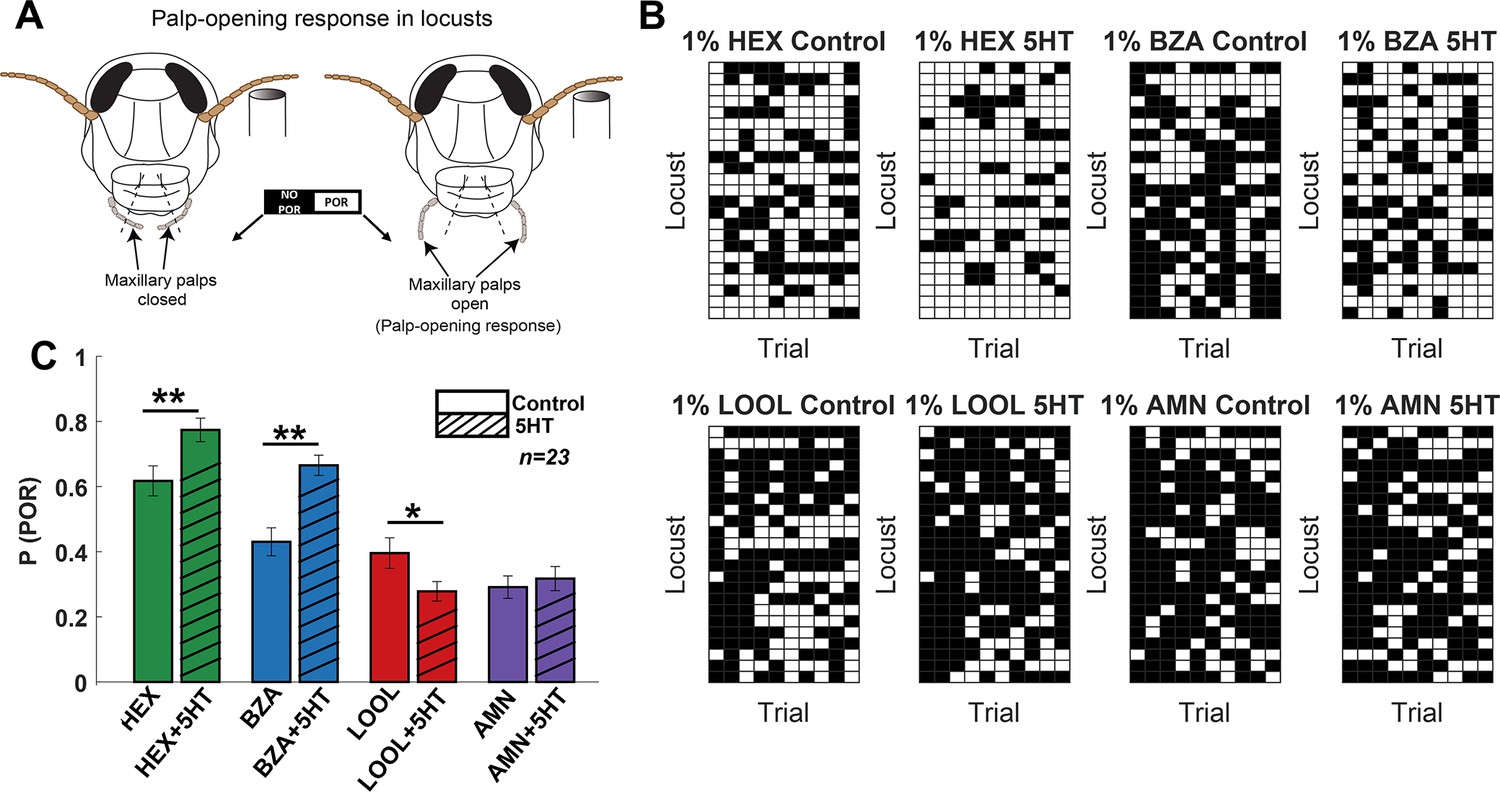
Serotonin modulates innate appetitive behavioral responses in an odor-specific manner.
(A) A schematic of the locust palp-opening response (POR) is shown. Starved locusts (>24 hr) were presented with a panel of four odorants (hexanol [HEX]; benzaldehyde [BZA]; linalool [LOOL]; ammonium [AMN]) at 1% v/v dilution. Each locust was presented with 10 trials of each odorant. The odor pulse duration was 4 s, and the time between two consecutive odor exposures (inter-trial interval [ITI]) was 56 s. Movement of the palps during the odor presentation was identified as a positive POR. The presence or absence of a POR was noted for each trial. (B) A summary of trial-by-trial PORs for each locust is shown. Each trial was categorized by the presence (white box) or absence (black box) of a POR. Each row represents the PORs recorded from a single locust, and each column indicates a specific trial. PORs of 23 locusts were recorded and summarized as a response matrix. The POR matrix for the same set of locusts before and after 5HT injection is shown to allow comparison. (C) The PORs before and after (5HT) serotonin injection are summarized and shown as a bar plot for all four odorants in the panel. Striped bars signify the data collected after the 5HT injection. Significant differences are identified in the plot (one-tailed paired-sample t-test; *p<0.05; **p<0.01; standard paired-sample t-test).
Figure 1—figure supplement 1

Saline injection control experiments.
Benzaldehyde at 1% concentration by volume (v/v) was used in these experiments. On the left, the raw palp-opening response (POR) response matrix is shown. Same color convention as Figure 1. Each row represents PORs recorded from a single locust (n = 11 for saline injection (top panel) and n = 18 locusts when the injection was absent (bottom panel)) over 10 consecutive trials (columns). The probability of POR is shown as a bar plot on the right side. The results before and after the injection of locust saline are presented in (A). (B) shows the results from a second control experiment. We compared PORs to BZA before and after 3 hr wait (without any injection). This time period is comparable to the time lag between before and after 5HT injections. Significance in POR differences tested using standard paired-sample t-test. (**p<0.05, n.s. – not significant).
Figure 1—figure supplement 2

Serotonin does not alter the palp-opening responses (PORs) evoked by paraffin oil (i.e., the solvent used to dilute odorants).
The PORs before and after (5HT) serotonin injection are summarized and shown as a bar plot for hexanol and paraffin oil. Striped bars signify the data collected after 5HT injection. Significant differences are identified in the plot (one-tailed paired-sample t-test; *p<0.05).
Figure 1—figure supplement 3

Pictures showing the behavioral experiment setup and representative palp-opening responses in a locust.
Figure 1—figure supplement 4

Palp-opening responses (PORs) patterns to different odorants remain consistent following serotonin introduction.
Probability of PORs are shown as a bar plot for four different odorants; hexanol (green), benzaldehyde (blue), linalool (red), and ammonium (purple). PORs before serotonin injection (solid bars) are compared against response levels after serotonin injection (striped bars). As can be noted, PORs to the four odorants remain consistent when tested 15 min and 3 hr after (5HT) serotonin injection.
Figure 2
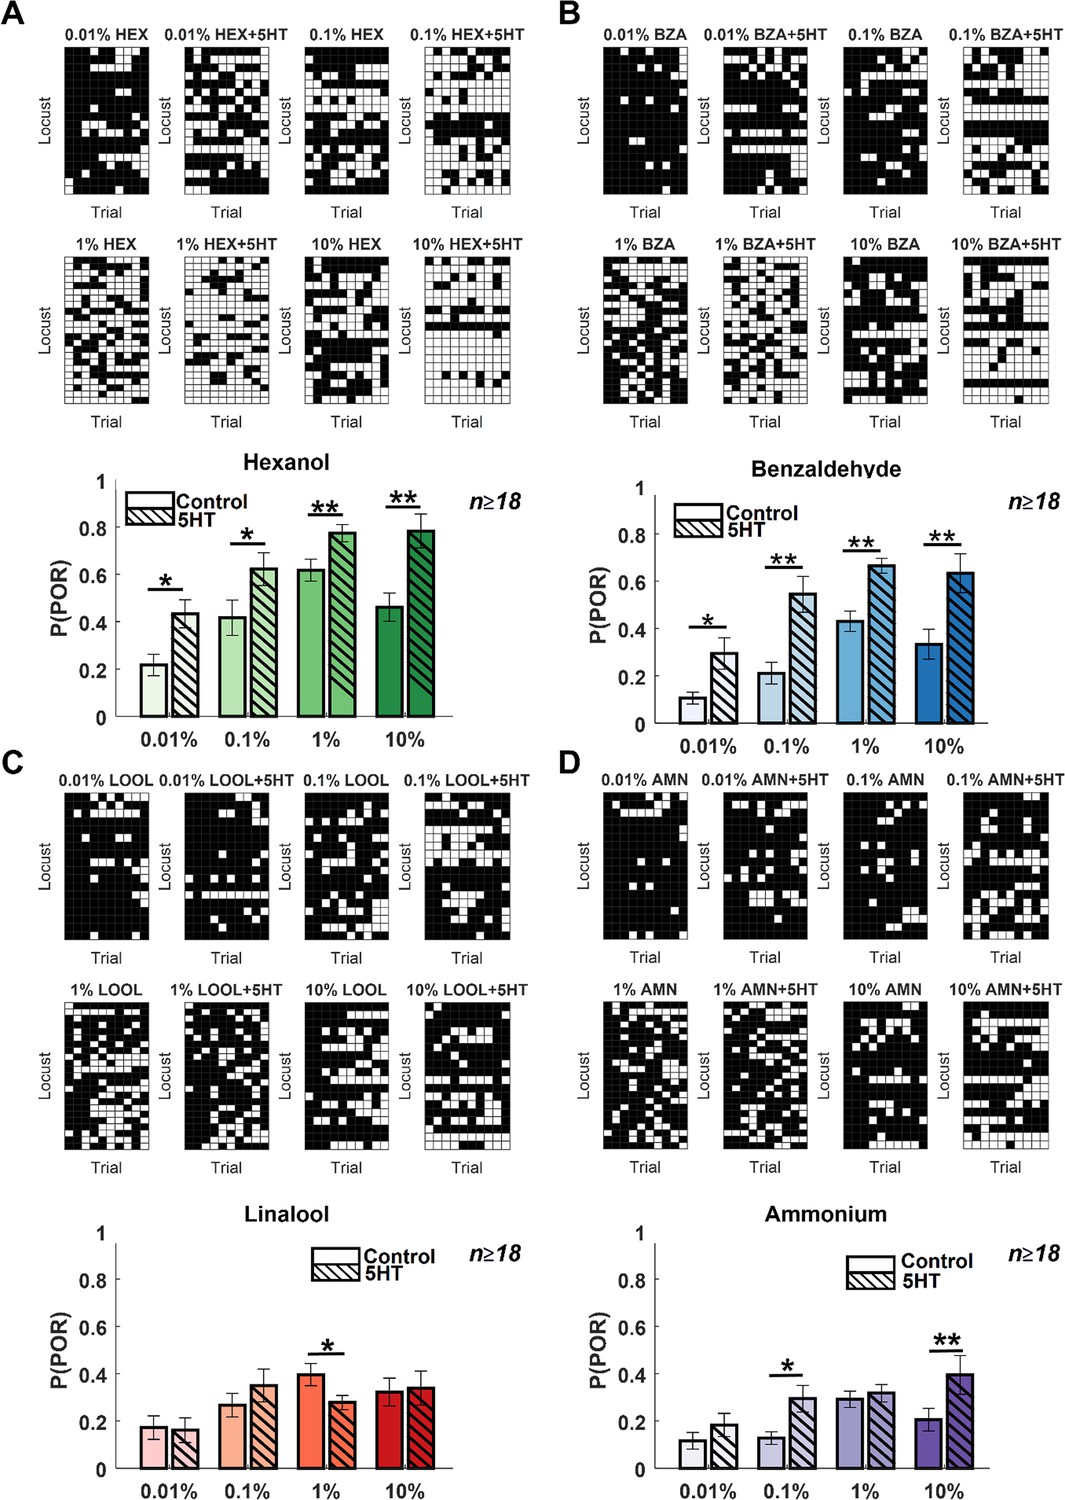
Serotonin alters the dose–response relationship for select odorants.
(A). POR responses as a function of varying odor concentrations for hexanol are shown. Responses before and after 5HT introduction are shown for each odor concentration. Each trial was categorized by the presence (white box) or absence (black box) of a POR. Each row represents the PORs recorded from a single locust, and each column indicates a specific trial. (Bottom panel) The left solid bar shows the p(POR) for each odorant as a function of concentration before serotonin injection. The right striped bar summarizes p(POR) after serotonin injection for the same set of locusts (*p<0.05; ** p<0.01 standard one-tailed paired-sample t-test). (B) Similar plots as in panel A but showing POR responses to various concentrations of benzaldehyde before and after 5HT introduction. (C) Similar plots as in panel A but showing POR responses to various concentrations of linalool before and after 5HT introduction. (D) Similar plots as in panel A but showing POR responses to various concentrations of ammonium before and after 5HT introduction.
Figure 3
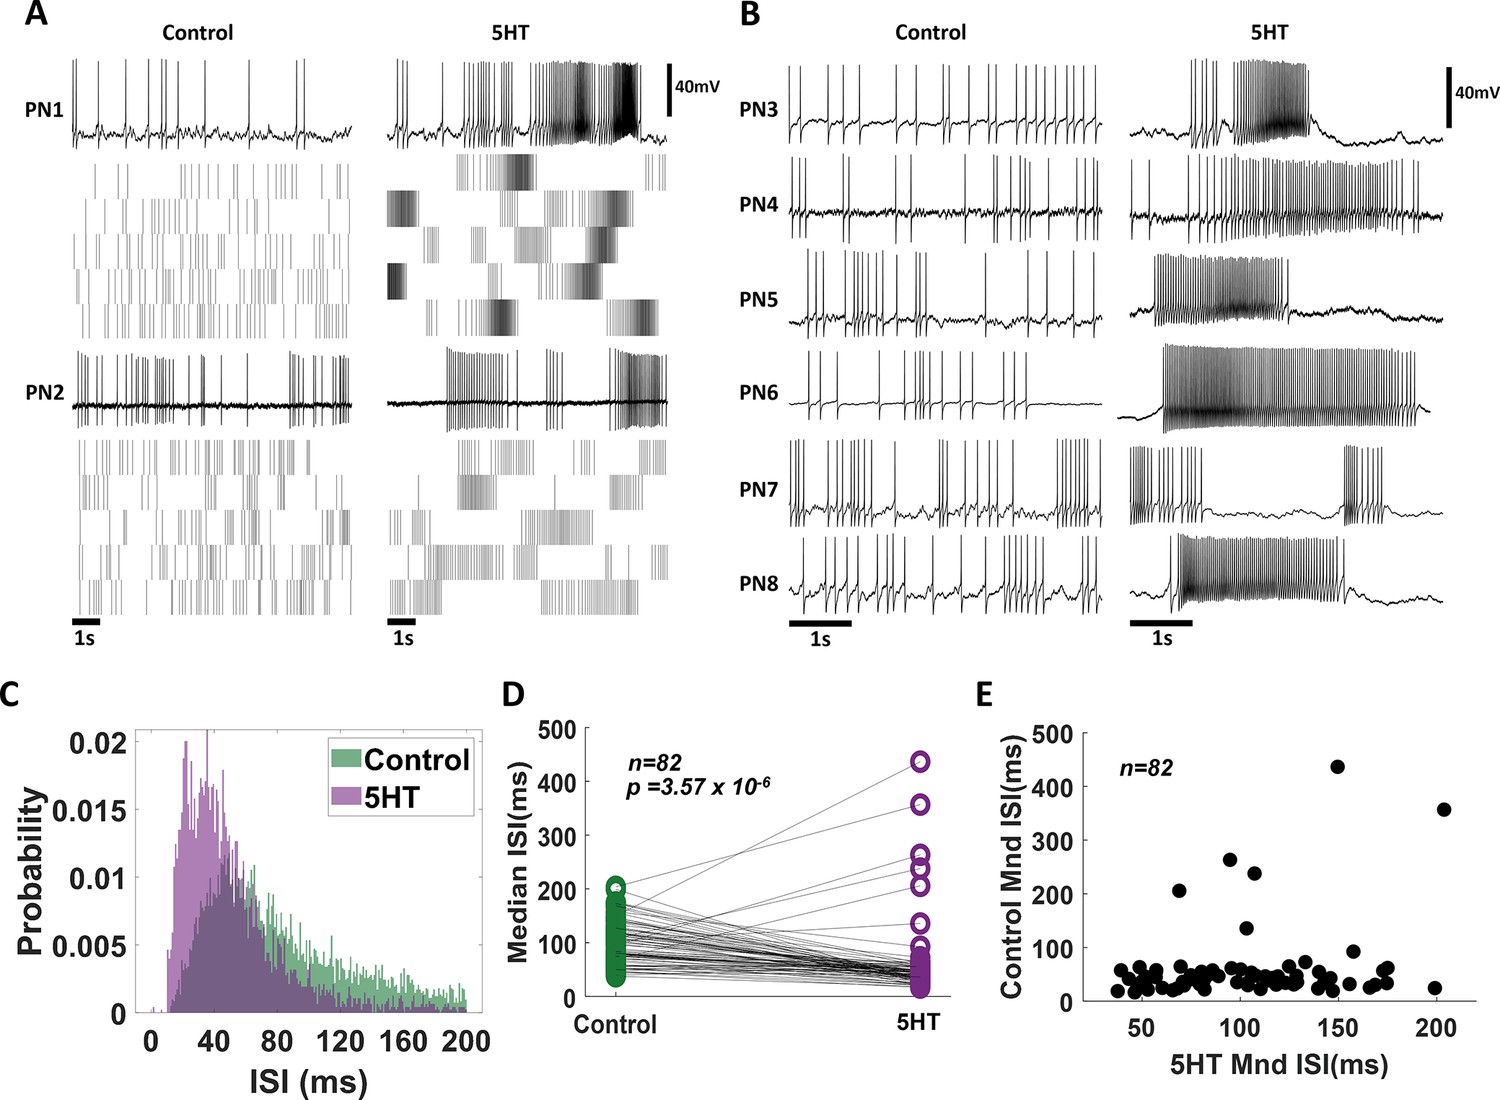
Exogenous serotonin induces bursting behavior in antennal lobe projection neurons (PNs).
(A) Representative intracellular recordings showing membrane potential fluctuations as a function of time for two separate PNs in the locust antennal lobe. A 10 s window when no odorant was presented is shown. Raw voltage traces are shown during the first trial, and spiking rasters are shown for the subsequent trials. Firing patterns before (left) and after (right) serotonin application are shown for comparison. Note, that the spiking activity becomes more bursty after the 5HT application. (B) Firing patterns for a larger set of PNs are compared before (control) and after (5HT) serotonin. Changes in PN excitability are observed in all recorded PNs. (C) The distribution of Inter-spike intervals (ISIs) across PNs is shown before serotonin application (control; in green) and after serotonin application (purple). Note that the purple histogram is taller and shifted to the left, indicating shorter gaps between consecutive action potentials. (D) Comparison of the median ISIs for each individual PN before (control) and after 5HT application. The black line connects median ISI values for a single PN in control and 5HT conditions. Note the majority of the black lines are tilted downward, indicating a reduction in the gap between spikes. (E) Median ISI values before and after the 5HT application are plotted for each PN.
Figure 4 with 3 supplements
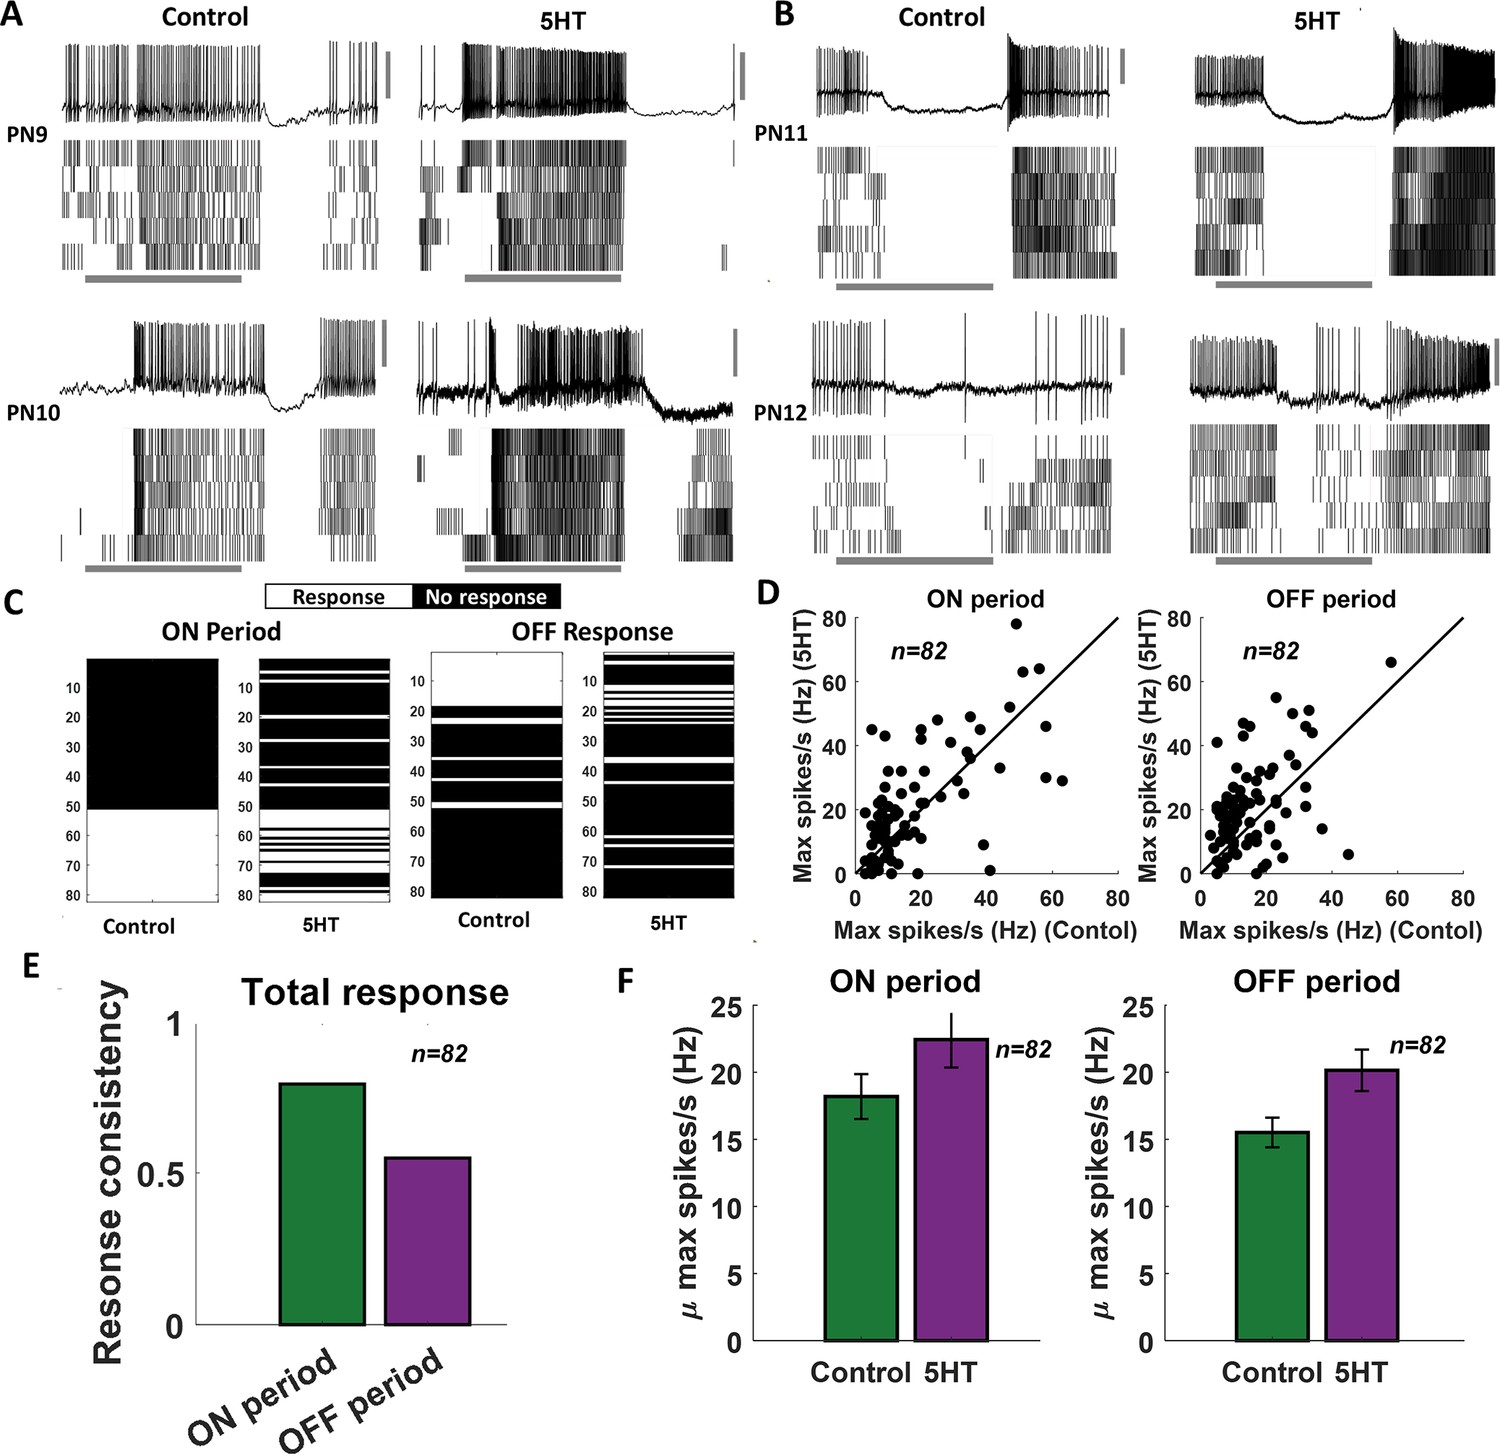
Serotonin alters the magnitude of odor-evoked spiking activity but not its timing.
(A, B) Representative plots of the odor-evoked ON responses (PN9-10) and OFF responses (PN11-12) for five trials are shown. The first trial is shown as a raw voltage trace. Spiking activities during all five trials are shown as a raster plot. The horizontal gray bar indicates the 4 s odor delivery period. The vertical gray scale bar identifies 40 mV. (C) A binary plot categorizing projection neuron (PN) activity as responsive or nonresponsive during odor presentation (ON responses) or after odor termination (OFF responses). Response categorization before and after 5HT application is shown for each PN to examine response robustness. (D) Left panel: peak spiking activity for each PN during odor presentation in the control condition and after 5HT application. Right panel: comparing peak spiking activity observed during the OFF period. (E) Fraction of PNs that maintain their response or lack of response to an odorant before and after 5HT application are quantified during ON and OFF periods. (F) Left panel: mean odor-evoked spiking activity across PNs during odor presentation in the control condition and after 5HT application is compared. Error bars indicate SEM. Right panel: similar plot comparing mean spiking activity across cells during the OFF period.
Figure 4—figure supplement 1

Electrophysiology control experiments.
(A, B) Representative voltage signals and rasters showing spontaneous and odor-evoked responses before and after saline injection. Saline with the addition of HCl (Saline + HCl) was used as an additional control because HCl is the solvent used to dilute serotonin. (C) Inter-spike interval (ISI) distribution is shown for the unmanipulated and the two control cases shown in panels (A) and (B).
Figure 4—figure supplement 2

Current-injection-induced spiking activity in individual projection neurons (PNs) is altered after serotonin application.
(A) Representative intracellular recordings showing membrane potential fluctuations as a function of time for one PNs in the locust antennal lobe. A 2 s window when a positive current pulse (200–1000 pA range; 2 s duration) was applied is shown. Firing patterns before (left) and after (right) serotonin application are shown for comparison. Note the spiking activity induced by current injection changed after the 5HT application. The black bar represents the 20 mV scale. (B) Dose–response curves showing the total number of action potentials for each recorded PN during the 2 s current pulse before (green) and after (purple) serotonin application. Note that the current intensity was systematically increased from 200 pA to 1000 pA. (C) The mean number of spikes across the four recorded cells during current injection is shown. The color progression represents the intensity of applied current ranging 200 pA (leftmost bar) to 1000 pA (rightmost bar). The dose–response trends before (green) and after (purple) 5HT application are shown for comparison. The error bars represent SEM across the four cells.
Figure 4—figure supplement 3

Odor-evoked activity in the antennal lobe local neurons versus projection neurons.
Left: representative raw voltage traces recorded from a local neuron before, during, and after a 4 s odor pulse are shown. Note that the local neurons in the locust antennal lobe do not fire full-blown sodium spikes but only fire small calcium spikelets. Right: a representative raw voltage trace recorded from a representative projection neuron is shown for comparison. Clear sodium spikes are clearly visible during spontaneous and odor-evoked periods. The gray bar represents 4 s of odor pulse. The vertical black bar represents 40 mV.
Figure 5
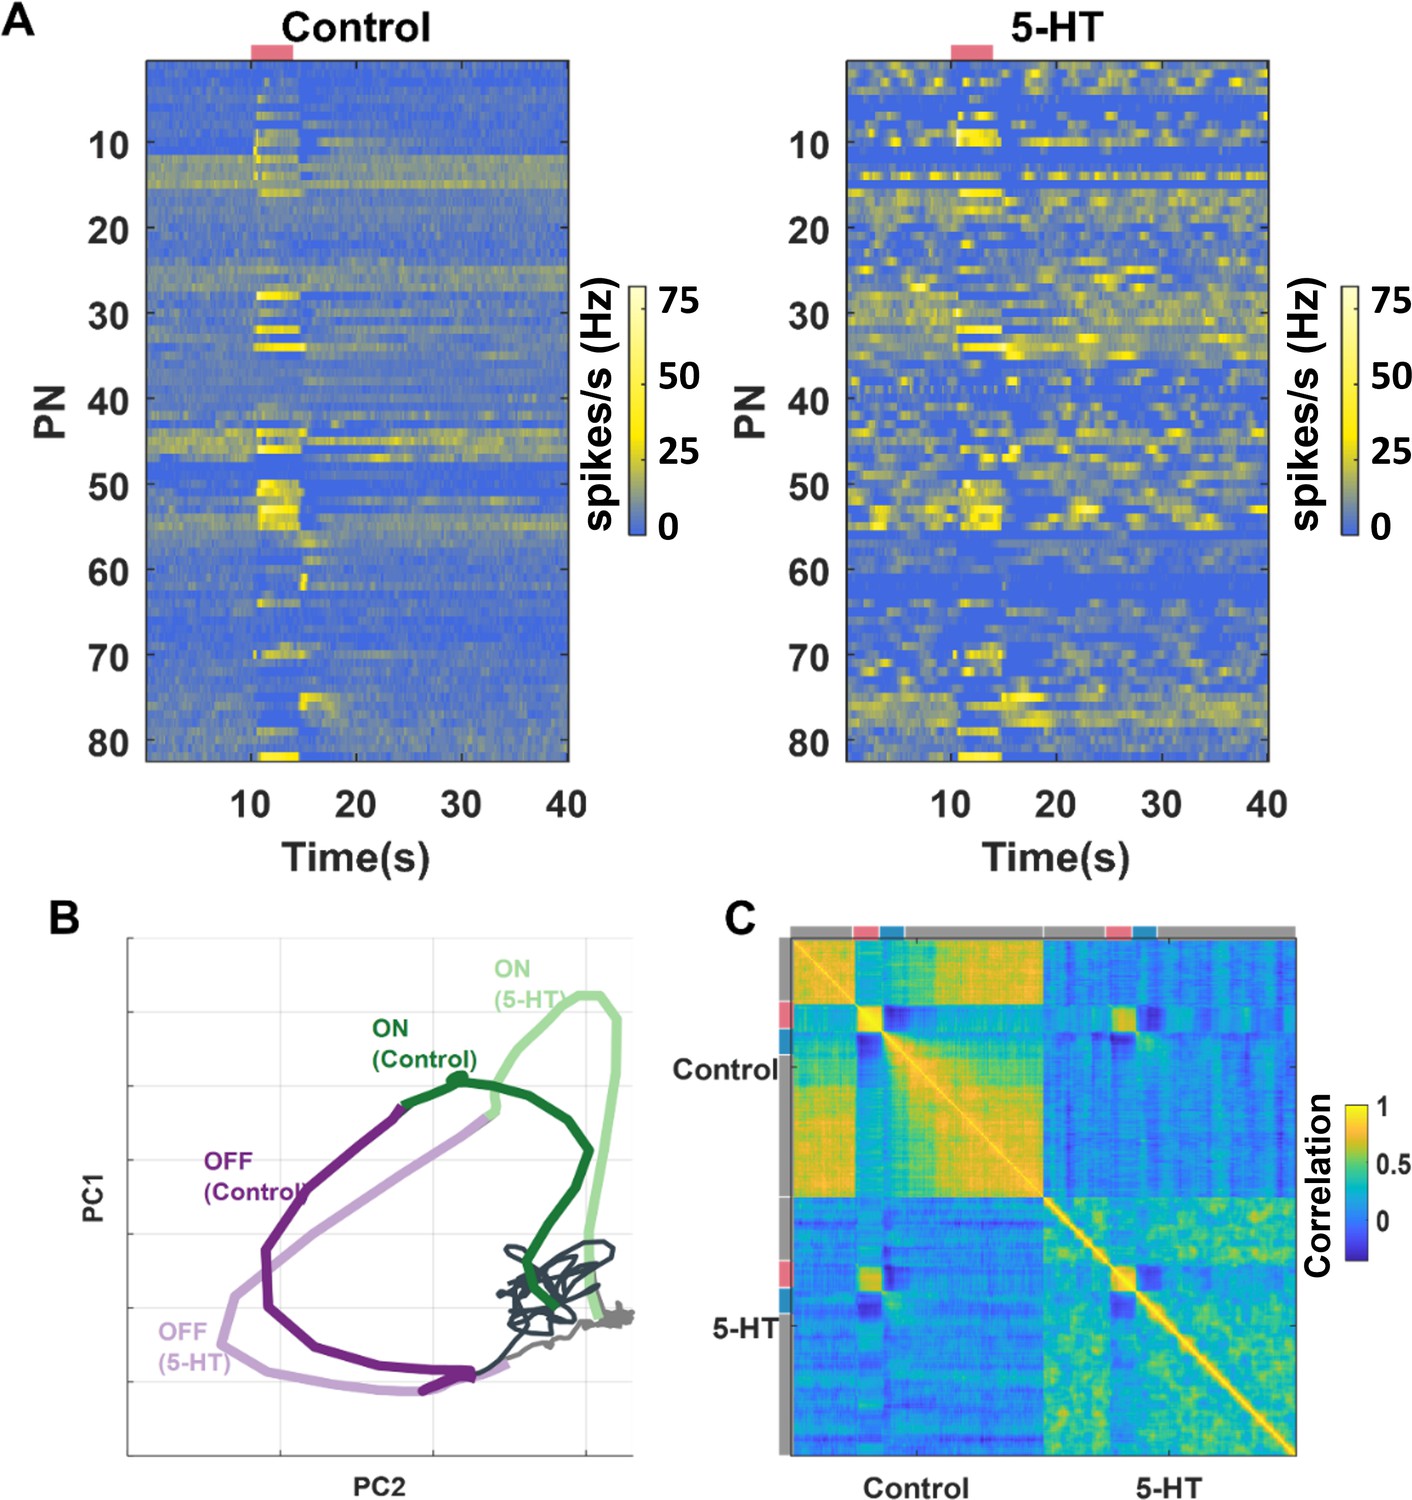
Ensemble-level odor-evoked response patterns robustly maintain odor identity after 5HT treatment.
(A) Trial-averaged spiking activity as a function of time is shown for 82 neurons. The hotter color identifies the higher average firing rates per bin (200 ms). Each row represents one projection neuron (PN), each column represents one-time bin. The red bar identifies the odor presentation time period. The heatmap on the left shows the PN activity matrix before 5HT application, and the heatmap on the right shows the PN activity matrix (neurons sorted in the same order) after (5HT) exposure. (B) PN odor-evoked responses (n = 82 PN-odor combinations) are visualized after dimensionality reduction using principal component analysis (PCA). The neural responses were binned in 50 ms windows and projected onto the top two eigenvectors of the response covariance matrix and connected in the order of occurrence to generate the response trajectory shown. Neural response trajectories evoked during the OFF period are shown in purple, and ON response trajectories are shown in green. Darker colors indicate response trajectories before 5HT treatment, and lighter shades show neural trajectories after 5HT treatment. (C) A correlation matrix summarizing the similarity between each 82-dimensional PN activity vector with all other response vectors is shown. Different time segments (spontaneous [gray], odor ON [red], and odor OFF [blue]) are indicated along the x- and y-axes. The hotter color indicates a higher correlation.
Figure 6 with 1 supplement
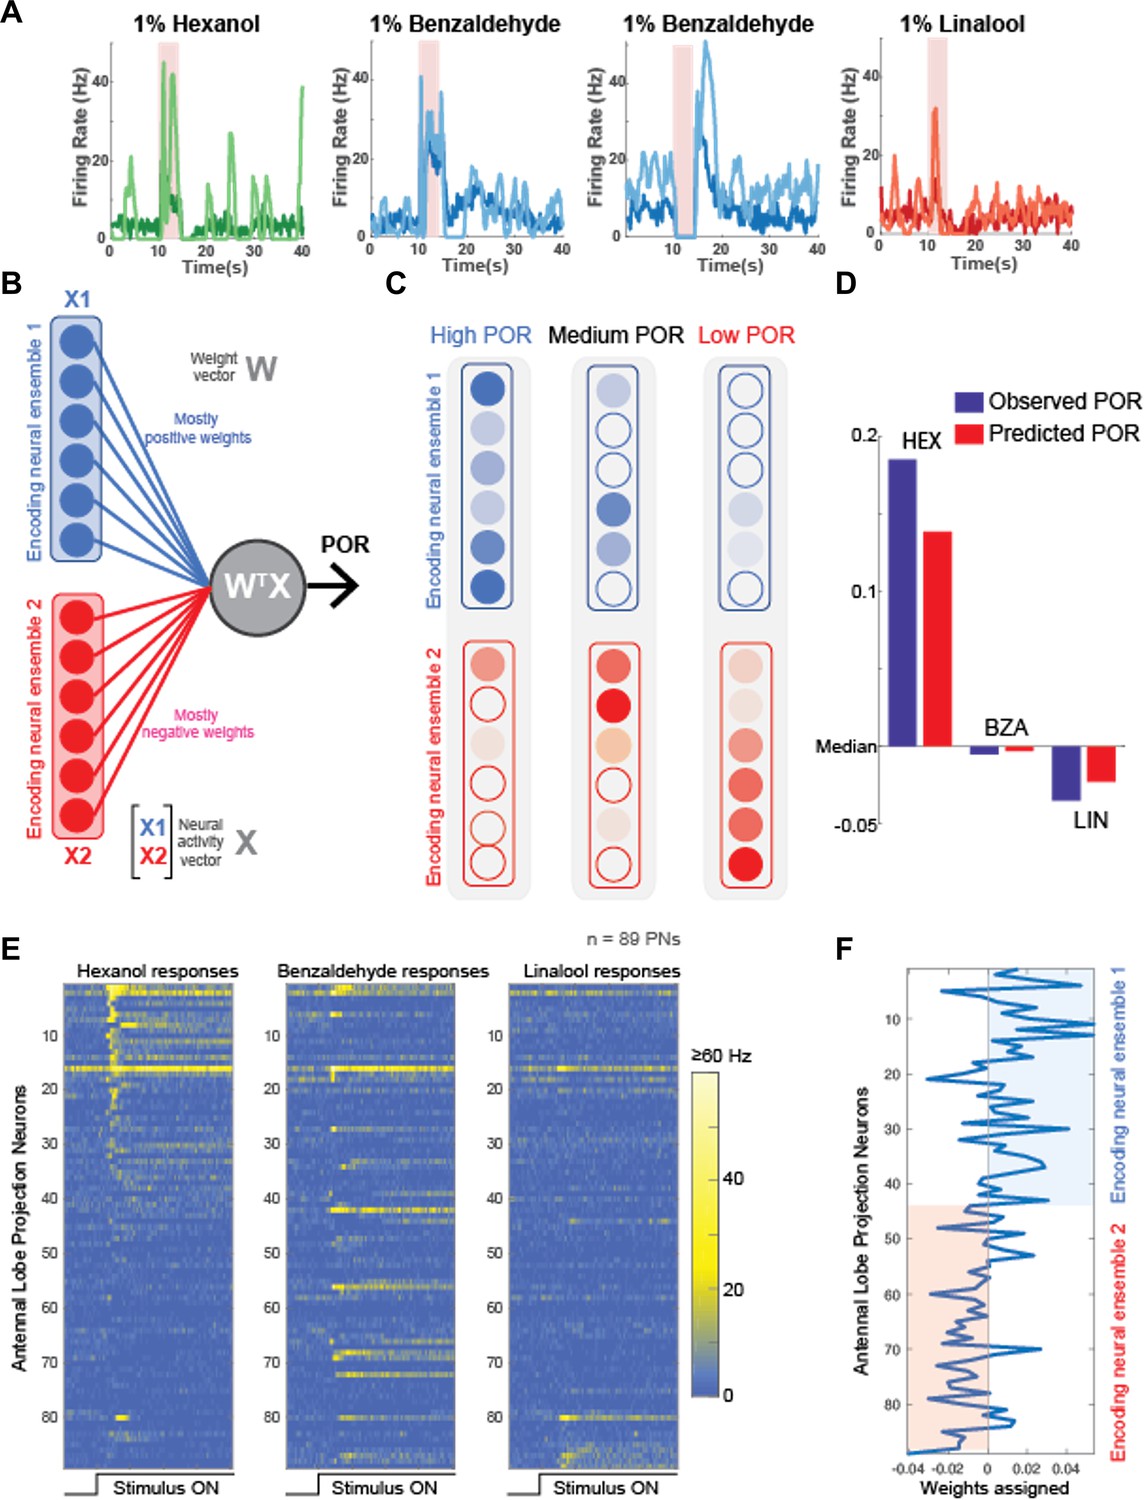
Neural data maps onto the behavioral results.
(A) Peristimulus time histograms (PSTHs) of four representative projection neurons (PNs) are shown before (darker shade color) and after 5HT (lighter shade color) application. Note that 5HT increased overall response amplitudes to all odorants in the panel. (B) A schematic of the linear model used for predicting palp-opening responses (PORs) given neural data. Each neuron is assigned a weight. The weighted sum of PN activity is fit to POR values for hexanol (HEX), benzaldehyde (BZA), and linalool (LOOL) (see ‘Methods’). The neurons were split into two ensembles based on their assigned weights. (C) Odorants that evoke stronger PORs are expected to activate more PNs that receive positive weights. In contrast, odorants that reduce POR output compared to the mean response are expected to activate more PNs that received negative weights. (D) Comparison of observed versus predicted POR values across locusts for the three odorants used in the model. (E) Odor-evoked responses of 89 PNs to HEX, BZA, and LOOL are shown. The PNs are ordered based on the difference in peak responses to HEX and LOOL (i.e., HEX-activated PNs are at the top and LOOL-activated neurons are at the bottom). (F) Weights assigned to each PN are shown. PNs are ordered the same as in panel (E).
Figure 6—figure supplement 1

Testing the generality of the proposed computational model.
To test the generality of the model proposed, we used a published dataset (Chandak and Raman, 2021): neural dataset – 89 projection neuron (PN) responses to a panel of 22 odorants; behavioral dataset – probability of palp-opening response (POR) responses to the same 22 odorants. We built the model using just the three odorants overlapping between the two datasets: hexanol, benzaldehyde, and linalool. The true probability of POR values of the 20 odorants and the POR probability predicted by the model are shown for all 22 odorants as a scatter plot. As can be noted, there is a high correlation (0.79) between the true and the predicted values.
Figure 7 with 1 supplement
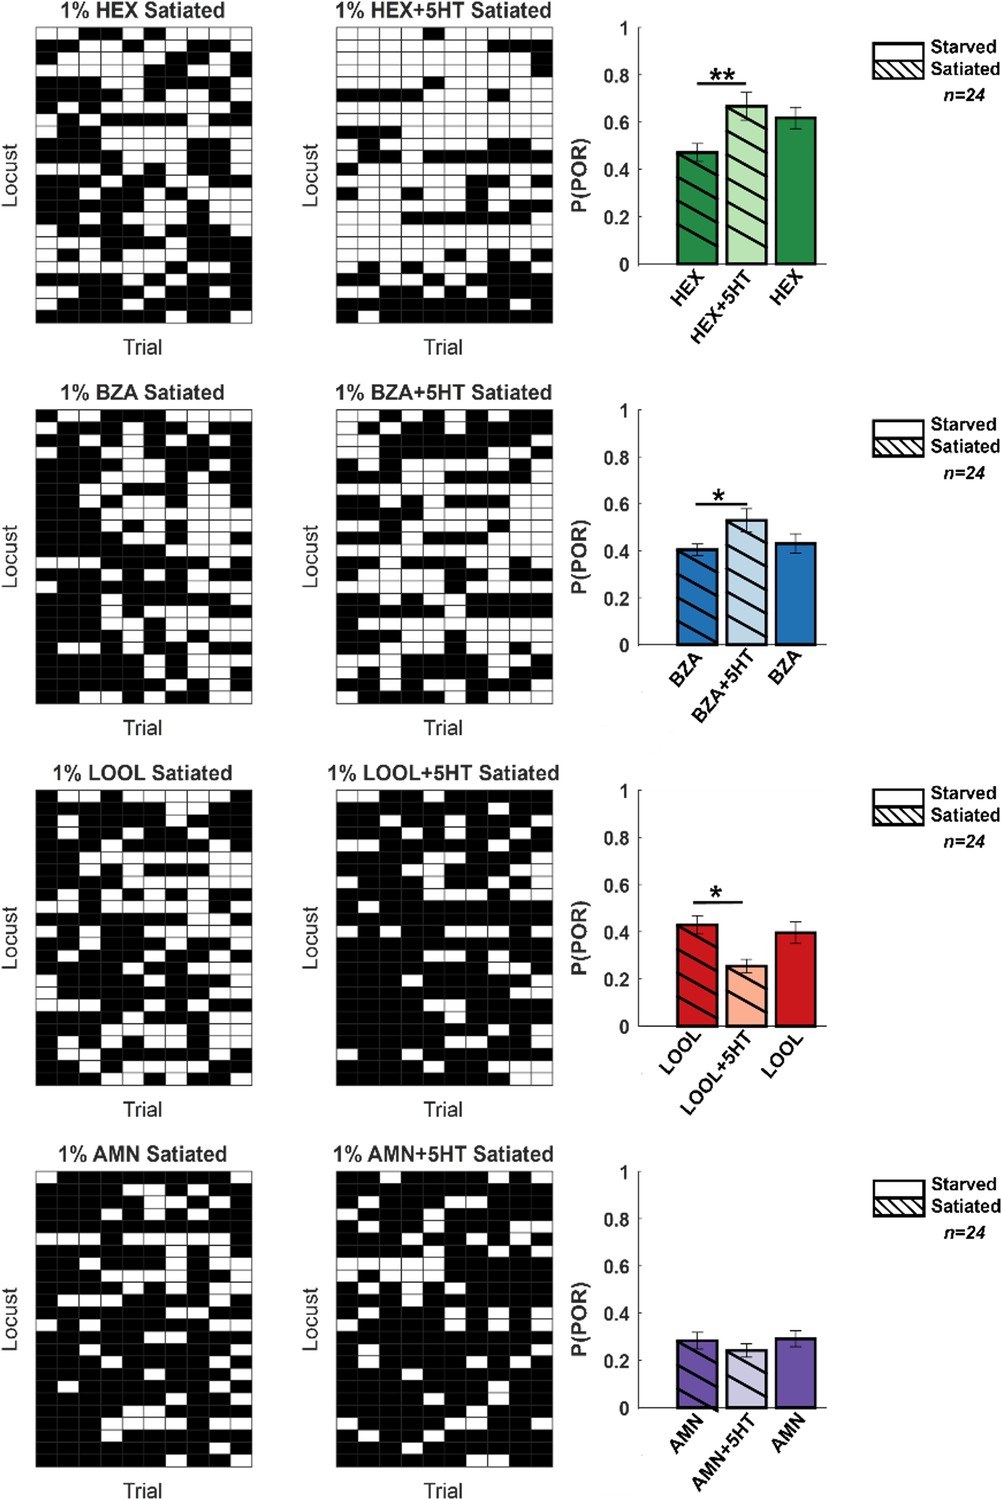
Hunger-state-dependent serotonergic modulation of appetitive behavioral responses.
Left: a summary of trial-by-trial palp-opening responses (PORs) to the same four odorants used in Figure 1. The same convention was used in Figure 1 (POR – white; no POR – black). Each row represents PORs recorded across a single locust in 10 trials. Twenty-four locusts were used. Each column represents a trial. Each odorant was presented at 1% v/v concentration. The POR matrix for the same set of locusts before and after 5HT injection is shown to allow comparison. Right: PORs are summarized and shown as a bar plot for all four odors for satiated locust (highlighted with lines), before (dark shade), and after 5HT injection (lighter shade). To allow comparison with POR in starved locust, results from Figure 1 are re-plotted in solid bars without stripes Significant differences are identified in the plot (one-tailed paired-sample t-test; *p<0.05; **p<0.01; standard paired-sample t-test).
Figure 7—figure supplement 1

Summarized palp-opening responses (PORs) and shown as a bar plot for all four odors for satiated locust (highlighted with lines), before (dark shade), and after 5HT injection (lighter shade).
To allow comparison before 5HT injection for starved locust plotted as well (dark shade plain).
Author response image 1

Palp-opening response (POR) patterns to different odorants remain consistent following serotonin introduction.
The probability of PORs is shown as a bar plot for four different odorants; hexanol (green), benzaldehyde (blue), linalool (red), and ammonium (purple). PORs before serotonin injection (solid bars) are compared against response levels after serotonin injection (striped bars). As can be noted, PORs to the four odorants remain consistent when tested 15 minutes and 3 hours after (5HT) serotonin injection.
Author response image 2

Spontaneous and odor-evoked responses in individual PNs remain consistent for three hours after serotonin introduction into the recording chamber/bath.
(A) Representative intracellular recording showing membrane potential fluctuations in a projection neuron (PN) in the antennal lobe. Spontaneous and odor-evoked responses to four odorants (pink color bars, 4 s duration) are shown before (control) and after serotonin application (5HT). Voltage traces 30 minutes (30min), 1 hour (1h), 2 hours (2h), and 3 hours (3h) after 5HT application are shown to illustrate the persisting effect of serotonin during spontaneous and odor-evoked activity periods. (B) Rasterized spiking activities in two recorded PNs are shown. Spontaneous and odor-evoked responses are shown in all 5 consecutive trials. Note that the odor-evoked response patterns are maintained, but the spontaneous activity patterns are altered after serotonin introduction.
Author response image 3

PN activity before and after 5HT application are compared for different cellodor combinations.
As can be noted, the changes are qualitatively similar in all cases. After 5HT application, the baseline activity became more bursty, but the odor-evoked response patterns were robustly maintained for all odorants.
Author response image 4

Testing the generality of the proposed computational model.
To test the generality of the model proposed we used a published dataset (Chandak and Raman, 2023): Neural dataset – 89 PN responses to a panel of twenty-two odorants; Behavioral dataset – probability of POR responses to the same twenty-two odorants. We built the model using just the three odorants overlapping between the two datasets: hexanol, benzaldehyde and linalool. The true probability of POR values of the twenty odorants and the POR probability predicted by the model are shown for all twenty-two odorants as a scatter plot. As can be noted, there is a high correlation (0.79) between the true and the predicted values.
Author response image 5

Representative traces showing intracellular recording from a local neuron in the antennal lobe.
Five consecutive trials are shown. Note that LNs in the locust antennal lobe are non-spiking. The LN activity before, during, and after the presentation of benzaldehyde and hexanol (colored bar; 4s) are shown. The Left and Right panels show LN activity before and after the application of 5HT. As can be noted, 5HT did not shut down odor-evoked activity in this local neuron.
Author response image 6

Current-injection induced spiking activity in individual PNs is altered after serotonin application.
(A) Representative intracellular recordings showing membrane potential fluctuations as a function of time for one projection neuron (PNs) in the locust antennal lobe. A two-second window when a positive 200-1000pA current was applied is shown. Firing patterns before (left) and after (right) serotonin application are shown for comparison. Note, the spiking activity changes after the 5HT application. The black bar represents the 20mV scale. (B) Dose-response curves showing the average number of action potentials (across 5 trials) during the 2second current pulse before (green) and after (purple) serotonin for each recorded PN. Note that the current intensity was systematically increased from 200 pA to 1000 pA. The (C) The mean number of spikes across the four recorded cells during current injection is shown. The color progression represents the intensity of applied current ranging 200pA (leftmost bar) to 1000pA (rightmost bar). The dose-response trends before (green) and after (purple) 5HT application are shown for comparison.. The error bars represent SEM across the four cells.
Author response image 7

Pictures showing the behavior experiment setup and representative palp-opening responses in a locust.
Author response image 8

Serotonin does not alter the palp-opening responses evoked by paraffin oil.
The PORs before and after (5HT) serotonin injection are summarized and shown as a bar plot for hexanol and paraffin oil. Striped bars signify the data collected after 5HT injection. Significant differences are identified in the plot one-tailed paired-sample t-test; (*p<0.05).
Author response image 9

PN vs LN physiological differences: Left: A representative raw voltage traces recorded from a local neuron before, during, and after a 4-second odor pulse are shown.
Note that the local neurons in the locust antennal lobe do not fire full-blown sodium spikes but only fire small calcium spikelets. On the right: A representative raw voltage trace recorded from a representative projection neuron is shown for comparison. Clear sodium spikes are clearly visible during spontaneous and odor-evoked periods. The gray bar represents 4 seconds of odor pulse. The vertical black bar represents the 40mV.
Author response image 10

Odor-evoked responses of four PNs that received positive weights in the model (top panel), and four PNs that were assigned negative weights in the model (bottom).
Author response image 11

A bar plot summarizing PORs to all four odors for satiated locust (highlighted with stripes), before (dark shade), and after 5HT injection (lighter shade).
To allow comparison before 5HT injection for starved locust plotted as well (without stripes). The significance was determined using a one-tailed paired-sample ttest(*p<0.05).
Author response image 12

Comparison of the distribution of odor-evoked PN responses before (green) and after (purple) 5HT introduction.
One-tailed paired sample t-test was used to compare the two distributions.
Additional files
Download links
A two-part list of links to download the article, or parts of the article, in various formats.
Downloads (link to download the article as PDF)
Open citations (links to open the citations from this article in various online reference manager services)
Cite this article (links to download the citations from this article in formats compatible with various reference manager tools)
Serotonergic amplification of odor-evoked neural responses maps onto flexible behavioral outcomes
eLife 12:RP91890.
https://doi.org/10.7554/eLife.91890.3


