Heron, a Knowledge Graph editor for intuitive implementation of Python-based experimental pipelines
Figures
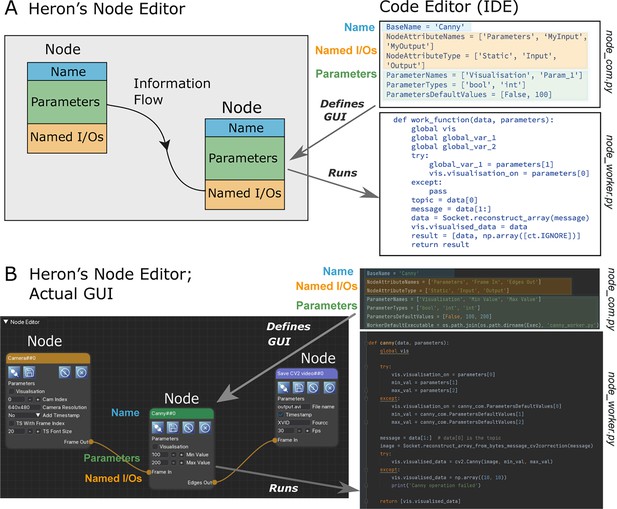
Heron’s combination of graphical and text-based code development.
(A) Schematic of Heron’s two levels of operation. Left shows a Knowledge Graph made of Nodes with Names, named Parameters and named Input/Output points. Nodes are connected with links (Edges) that define the flow of information. Right shows a piece of textual code that fully defines both the Node’s Graphical User Interface (GUI) appearance and the processes run by the machine. (B) Heron’s implementation of A, where the Knowledge Graph is generated in Heron’s Node Editor window while the code that each Node needs to be defined and the code that each Node is running is written in a separate Integrated Development Environment (IDE, in this case PyCharm).
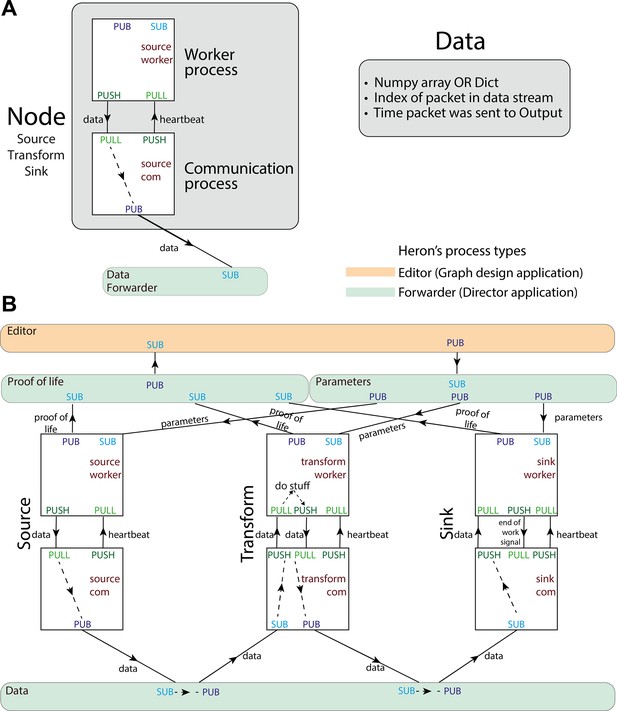
Heron’s design principles.
(A) On the left, Heron’s Node structure showing the two processes that define a running Node and how messages are passed between them. The design of the special message defined as ‘data’ is shown on the right. (B) Heron’s processes and message passing diagram. Each rectangle represents a process. The top orange rectangle is the Heron’s Editor process, while the other three green rectangles are the three Forwarders. The Proof-of-life forwarder deals with messages relating to whether a process has initialised correctly. The parameters forwarder deals with messages that pass the different parameter values from the editor process (the Graphical User Interface [GUI]) to the individual Nodes. Finally, the data forwarder deals with the passing of the data messages between the com processes of the Nodes. The squares represent the worker (top) and com (bottom) process of three Nodes (a Source, a Transform, and a Sink from left to right). Solid arrows represent message passing between processes using either the PUB SUB or the PUSH PULL type of sockets as defined in the 0MQ protocol. Dashed line arrows represent data passing within a single process.
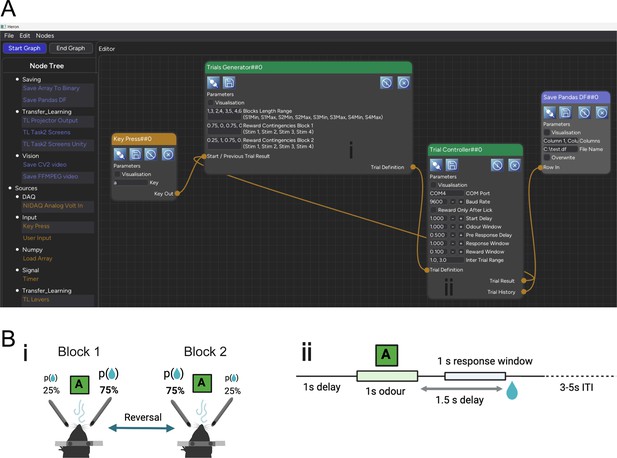
The Knowledge Graph of the Probabilistic Reversal Learning experiment.
(A) The Knowledge Graph of the Probabilistic Reversal Learning experiment showing four Nodes comprising the task, two of which (Trial Generator and Trial Controller) are connected in a loop (the output of one is fed into the input of the other). (B) The schematic or mental schema of the experiment. Notice the direct correspondence (i, ii) between the Heron Nodes and the two main components of the experiment’s mental schema, as well as the Node’s parameters and the schema components’ basic variables.
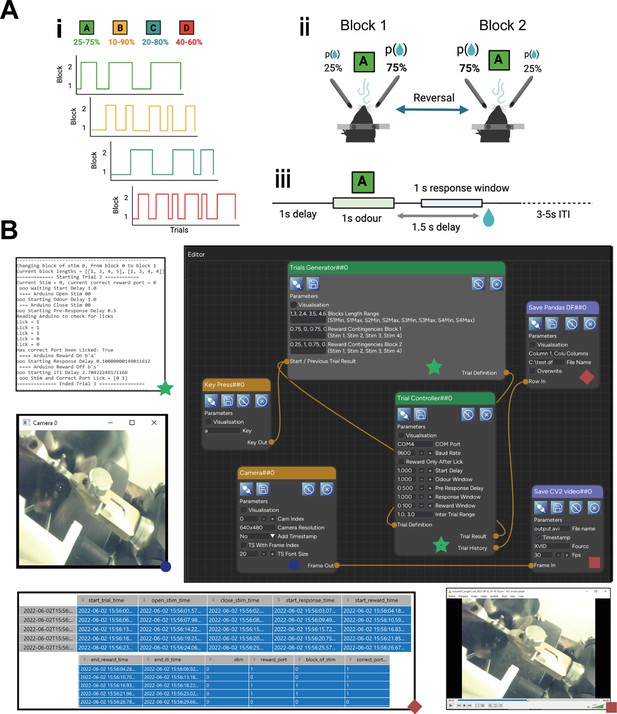
The Probabilistic Reversal Learning experiment.
(A) A schematic of the task. (i) The block structure for the four odours (stimuli) showing the transitions over trials between blocks 1 and 2 for each odour. These can also be seen (and set for each session) in the ‘Reward Contingency Block 1’ and ‘Reward Contingency Block 2’ parameters of the ‘Trials Generator’ Node (see B). (ii) A diagrammatic description of what a block transition for one odour (in this case, odour A) means. (iii) The dynamics of a single trial. All the timings can be seen (and set) in the parameters of the ‘Trial Controller’ Node. (B) A snapshot of the experiment running. Top right image is Heron showing the full Knowledge Graph. Images to the left of the Heron Graphical User Interface (GUI) are the outputs of the different Node visualisations showing live while Heron is running. The images below the GUI are snapshots of the saved results for the two Sinks (‘Save Pandas DF’ and ‘Save FFMPEG Video’). Which output is generated by which Node is marked with green stars, blue circles, and red squares and diamonds at the bottom of the Node and the corresponding image.
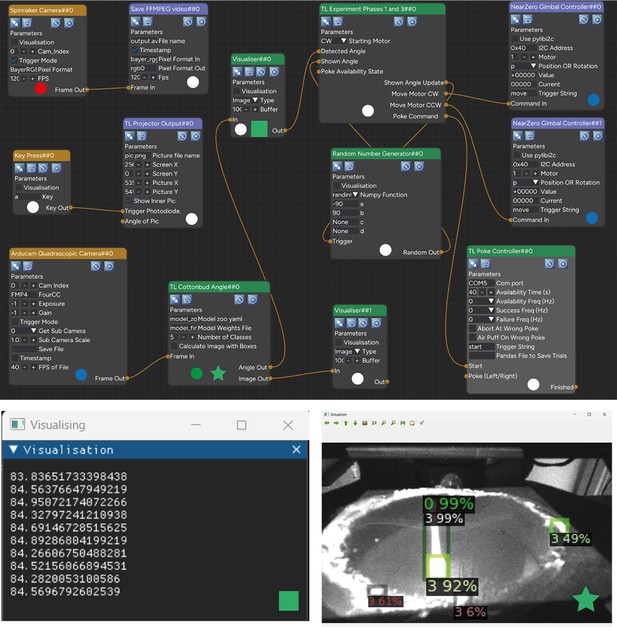
The Knowledge Graph of the Fetching the cotton bud experiment.
The coloured circles at the bottom middle of each Node and the coloured star and square (where shown) are not part of the Heron Graphical User Interface (GUI) but are used in the figure to indicate in which Machine/OS/Python configuration each Node is running its worker script (circles) and which visualisation image at the bottom corresponds to which Node. For the circle, the colour code is: White = PC/Windows 11/Python 3.9, Red = PC/Windows 11/Python 3.8, Blue = Nvidia Jetson Nano/Ubuntu Linux/Python 3.9, Green = PC/Ubuntu Linux in WSL/Python 3.9. The two smaller windows below Heron’s GUI are visualisations created by the two Visualiser Nodes. The right visualisation (coming from Node Visualiser##1) is the output of the Detectron2 algorithm showing how well it is detecting the whole cotton bud (detection box 0) and the cotton bud’s tips (detection boxes 3). The left visualisation box (output of the Visualiser##0 Node) is showing the angle of the cotton bud (in an arbitrary frame of reference where the 0 degrees would be almost horizontal on the screen and the 90 almost vertical). This angle is calculated in the TL Cottonbud Angle Node, which is responsible for running the deep learning algorithm and using its inference results to calculate the angle of the cotton bud. As shown, the TL Cottonbud Angle Node is running on a Linux virtual machine (since Detectron 2 cannot run on Windows machines).
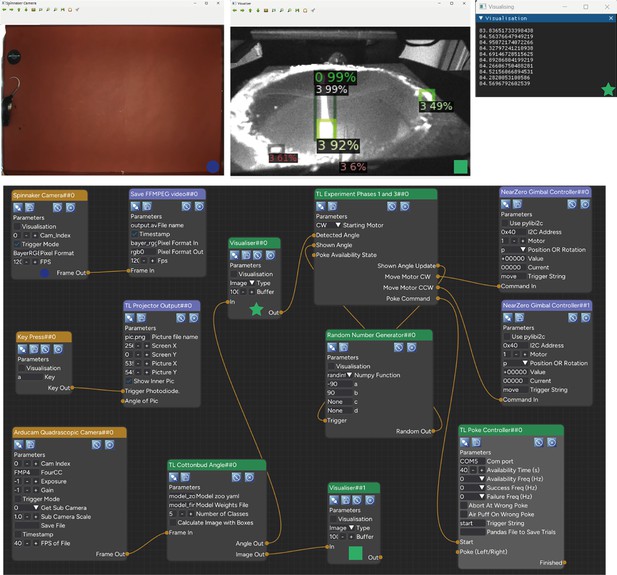
Fetching the cotton bud experiment as controlled by Heron.
The bottom image is the Heron Knowledge Graph. The top three images are the visualisations of Nodes ‘Spinnaker Camera’, ‘Visualiser##0’, and ‘Visualiser##1’. Which visualisation belongs to which Node is marked by a green star, a blue circle, and a green square at the bottom of the Nodes and its corresponding visualisation image. Visualiser##0 is receiving its values from the Angle Out output of the ‘TL Cottonbud Angle’ Node, while ‘Visualiser##1’ is receiving its frames from the Image Out output of the ‘TL Cottonbud Angle’ Node. The ‘TL Cottonbud Angle’ Node is receiving frames of the bottom of the cotton bud receptacle from the Frame Out output of the ‘Arducam Quadrascope Camera’ Node and is using one of the algorithms in the Detectron2 package (which one is defined in the ‘Model zoo yaml’ parameter of the ‘TL Cottonbud Angle’ Node) to both calculate the angle of the cotton bud and to superimpose on the receiving frame the detected boxes of the cotton bud’s tips and of the cotton bud itself. The frame of the cotton bud is captured on a Jetson Nano computer, is passed onto the Windows machine where the Heron Graphical User Interface (GUI) is running, to be then passed to the WSL virtual machine inside the Windows machine for the deep learning algorithm to use it as input. The output of the algorithm (the angle and the boxes superimposed image) is then passed back to the Windows machine to be used by the logic of the experiment running in the ‘TL Experiment Phases 1 and 3’ Node.
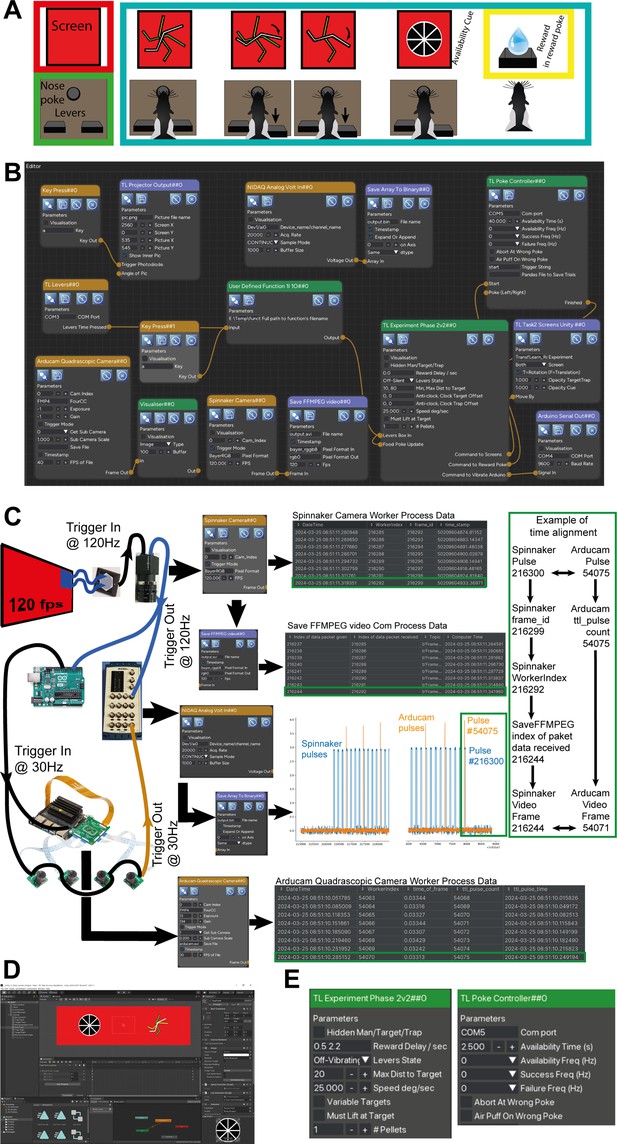
Computer game for rats.
(A) The experimental design (see Figure 5—figure supplement 1 for a detailed explanation). (B) The Heron Knowledge Graph. (C) An overview of some of the hardware connectivity of the experimental setup and the way Heron deals with the time alignment of the data packets from different Nodes. The green rectangle to the right shows how one can use Heron’s data recording facilities to correlate the frames of the Spinnaker Camera saved video (the example here highlights the last frame #216244) with the video frames of the Arducam cameras (#54071 in this example) which are generated and saved by a separate Node running on a different machine. (D) The Unity project used to create the visuals and their reactions to the commands sent by the TL Experiment Phase 2v2##0, logic Node. (E) A zoom of the parameters of the two logic Nodes in the experiment (TL Experiment Phase2v2##0 and TL Poke Controller##0). Updating those parameters during an experiment, an experimenter can control the way the arena interacts with the subject and allows Heron’s Graphical User Interface (GUI) to act as a control panel for the experiment while a Graph is running.
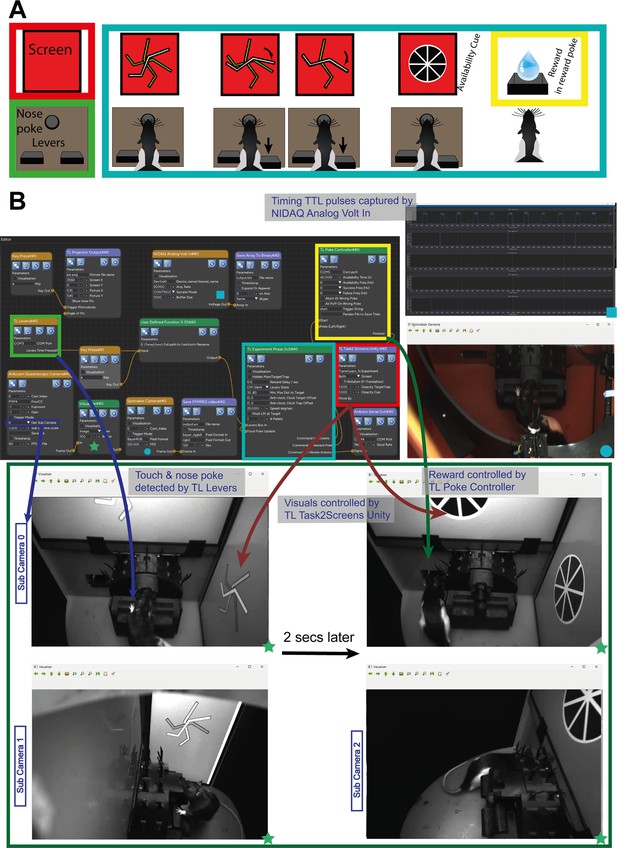
Heron running the ‘computer game for rats’ experiment.
(A) The experimental design. The animal can access a nose poke with two levers box (left bottom, Light Green box) and can see two screens (represented here as one rectangle, left top, Red box). The experiment detects the animal’s nose poke and presents three lines (white, yellow, and green) on a red background. If the animal presses any of the two levers, the white line rotates either clockwise or counter-clockwise. If the white line is rotated to reach the green line, then a reward availability cue (black wheel with spokes) is presented and animated, indicating to the animal that reward is available in a separate reward port. The detection of the nose poke and the levers is controlled by the ‘TL Levers##0’ Node (the joystick of the game). The timing of the availability period, the detection of the animal at the reward port, and the dispensing of reward is controlled by the ‘TL Poke Controller##0’ Node. The logic of the game is controlled by the ‘TL Experiment Phase 2v2##0’ Node which receives the input from the ‘joystick’ and decides what to show the animal and whether to reward it. Finally, the visuals of the game are controlled by the ‘TL Task2 Screens Unity##0’ Node which receives commands from the logic Node and passes them to a Unity executable which deals with the proper presentation of the sprites and their animations. (B) Heron with its live visualisations of the FLIR camera, the TTL pulses used for timing of the different events (as captured by a NIDAQ board (National Instruments)) and the different ‘sub cameras’ parts of the Arducam 4 camera system. The four coloured boxed surrounding the Nodes ‘TL Levers##0’ (Light Green), ‘TL Experiment Phase 2v2##0’ (Light Blue), ‘TL Poke Controller##0’ (Yellow), and ‘TL Task2 Screens Unity##0’ (Red) are not shown on the Heron Graphical User Interface (GUI) but are used here to indicate which Node controls which part of the experimental design shown in A. The arrows show which Node is responsible for which aspect of the experiment as it appears on the captured video streams. The correspondence between the Nodes and their visualisation is marked with green stars, a blue circle and a blue square at the bottom of the Nodes and their corresponding visualisation windows. The green window shows two time points as seen by two of the three sub cameras used in the system. In the first time point (left column of bottom green rectangle, showing sub cameras 4 and 2), the animals are pressing the left lever, making the white jagged line on the screens go towards the darker line (green on the coloured monitors). A couple of seconds later, the animals had rotated the white line to touch the green one, and the reward availability cue (dark spoked disk) was animating on the screens. The animal then rushes to receive its reward from the reward tray as shown on the second column of the sub camera captures.
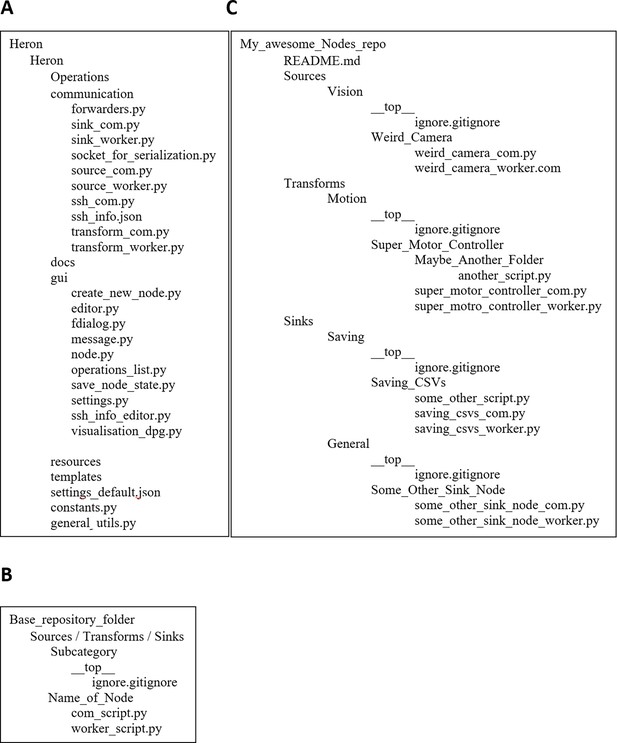
Heron’s folder structures.
(A) The Heron folder structure together with the basic scripts that comprise Heron’s core functionality. (B) The Heron Node repository folder structure (to be found in the Operations folder for each group of Nodes in the same repository). (C) An example of a repository with four Nodes: the Weird_Camera Source in subcategory Vision, the Super_Motion_Controller Transform in subcategory Motion and the Sinks Saving_CSVs in Saving and Some_Other_Sink_Node in General. The __top__ folder with the file ignore.ignore git file is required to allow Heron to create the list of Nodes presented to the users live as its folder structure is updated with new Node folders.
