Auxin exposure disrupts feeding behavior and fatty acid metabolism in adult Drosophila
- Department of Biology, Indiana University, United States
- Department of Cellular and Physiological Sciences, Life Sciences Institute, The University of British Columbia, Canada
- Department of Biochemistry and Molecular Genetics, Anschutz Medical Campus, University of Colorado School of Medicine, United States
Figures
Figure 1 with 2 supplements
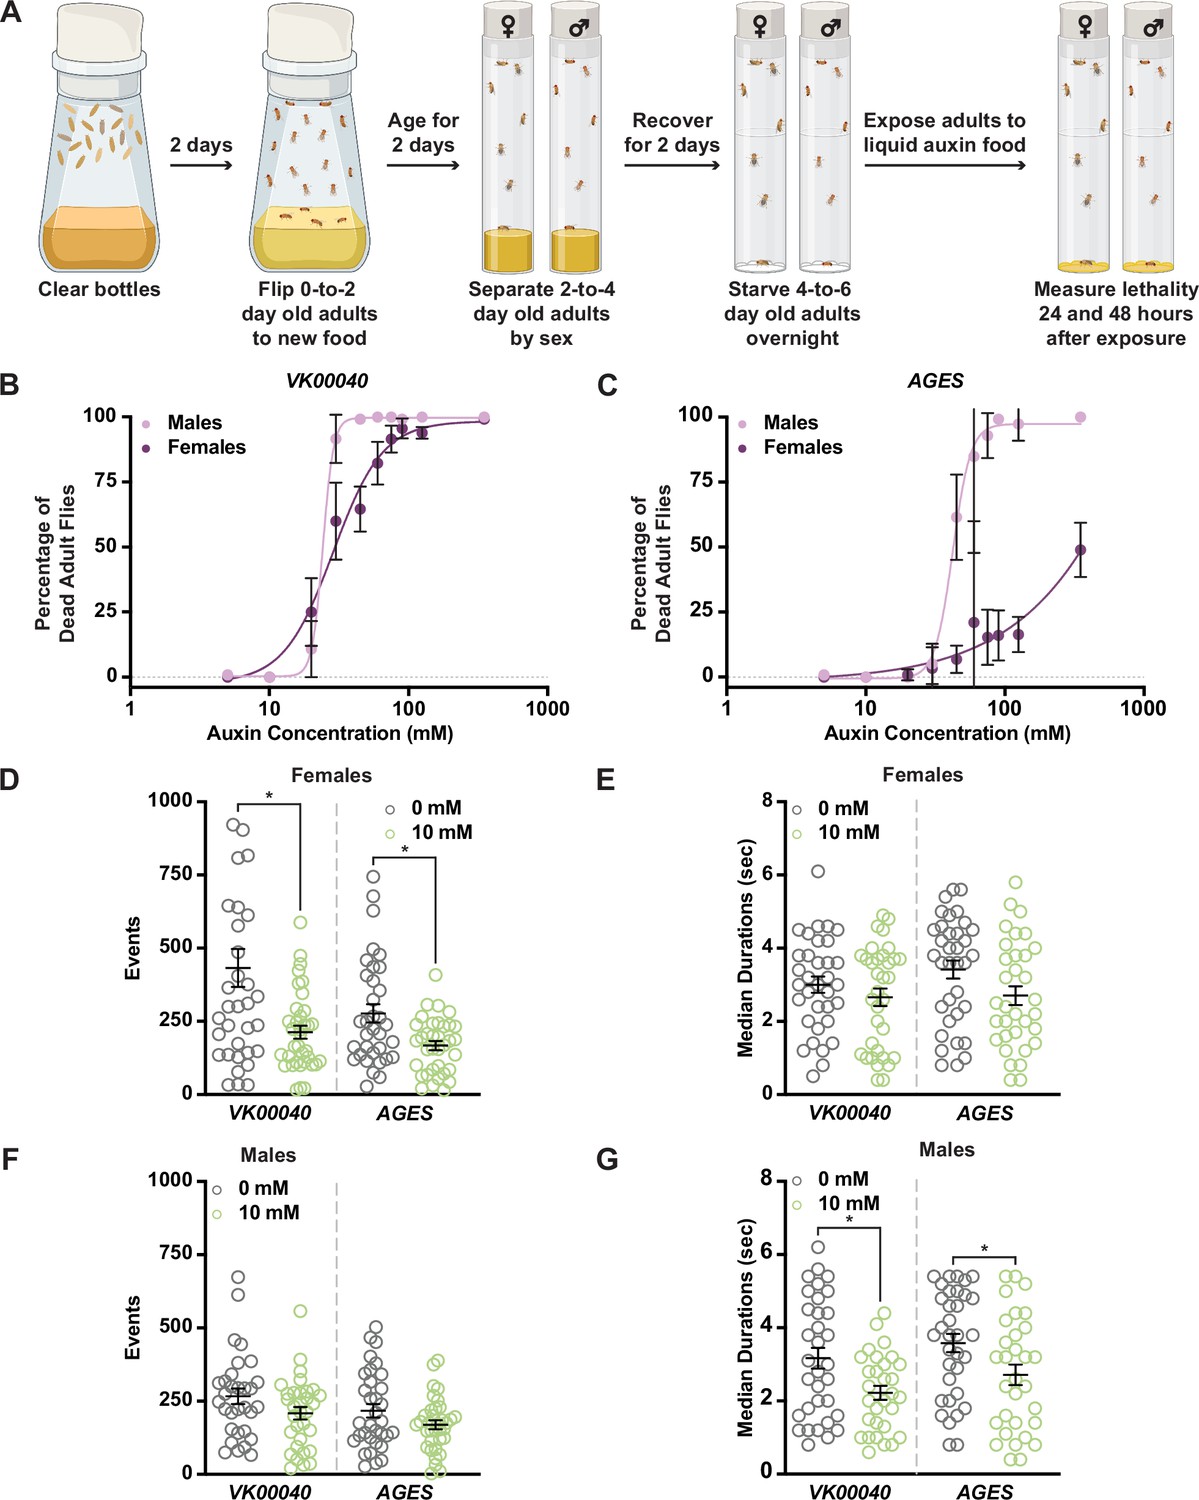
Increased auxin exposure in adult Drosophila decreases survival and alters feeding behavior.
(A) Cartoon schematic of auxin exposure feeding protocol. Cartoon was created using BioRender. Dose–response curves for males and females exposed to increasing concentrations of auxin in the VK00040 transgene injection line (B) or the AGES transgenic line (C). Twenty flies per sex and genotype were analyzed. Data shown as mean ± standard deviation (SD). (D) The total number of feeding events for females in the VK00040 or AGES fly line exposed to 0 or 10 mM auxin. (E) The median time of feeding activity of females in the VK00040 or AGES fly lines exposed to 0 or 10 mM auxin. (F) The total number of events for males in the VK00040 or AGES fly lines exposed to 0 or 10 mM auxin. (G) The median time of feeding activity of males in the VK00040 or AGES fly lines exposed to 0 or 10 mM auxin. At least 30 flies per sex were analyzed. Data shown as mean ± standard error of the mean (SEM). *p < 0.05, Mann–Whitney U-test.
-
Figure 1—source data 1
Lethality analysis for VK00040 males and females.
- https://cdn.elifesciences.org/articles/91953/elife-91953-fig1-data1-v1.xlsx
-
Figure 1—source data 2
Lethality analysis for AGES males and females.
- https://cdn.elifesciences.org/articles/91953/elife-91953-fig1-data2-v1.xlsx
-
Figure 1—source data 3
FLIC data for VK00040 and AGES females.
- https://cdn.elifesciences.org/articles/91953/elife-91953-fig1-data3-v1.xlsx
-
Figure 1—source data 4
FLIC data for VK00040 and AGES males.
- https://cdn.elifesciences.org/articles/91953/elife-91953-fig1-data4-v1.xlsx
Figure 1—figure supplement 1
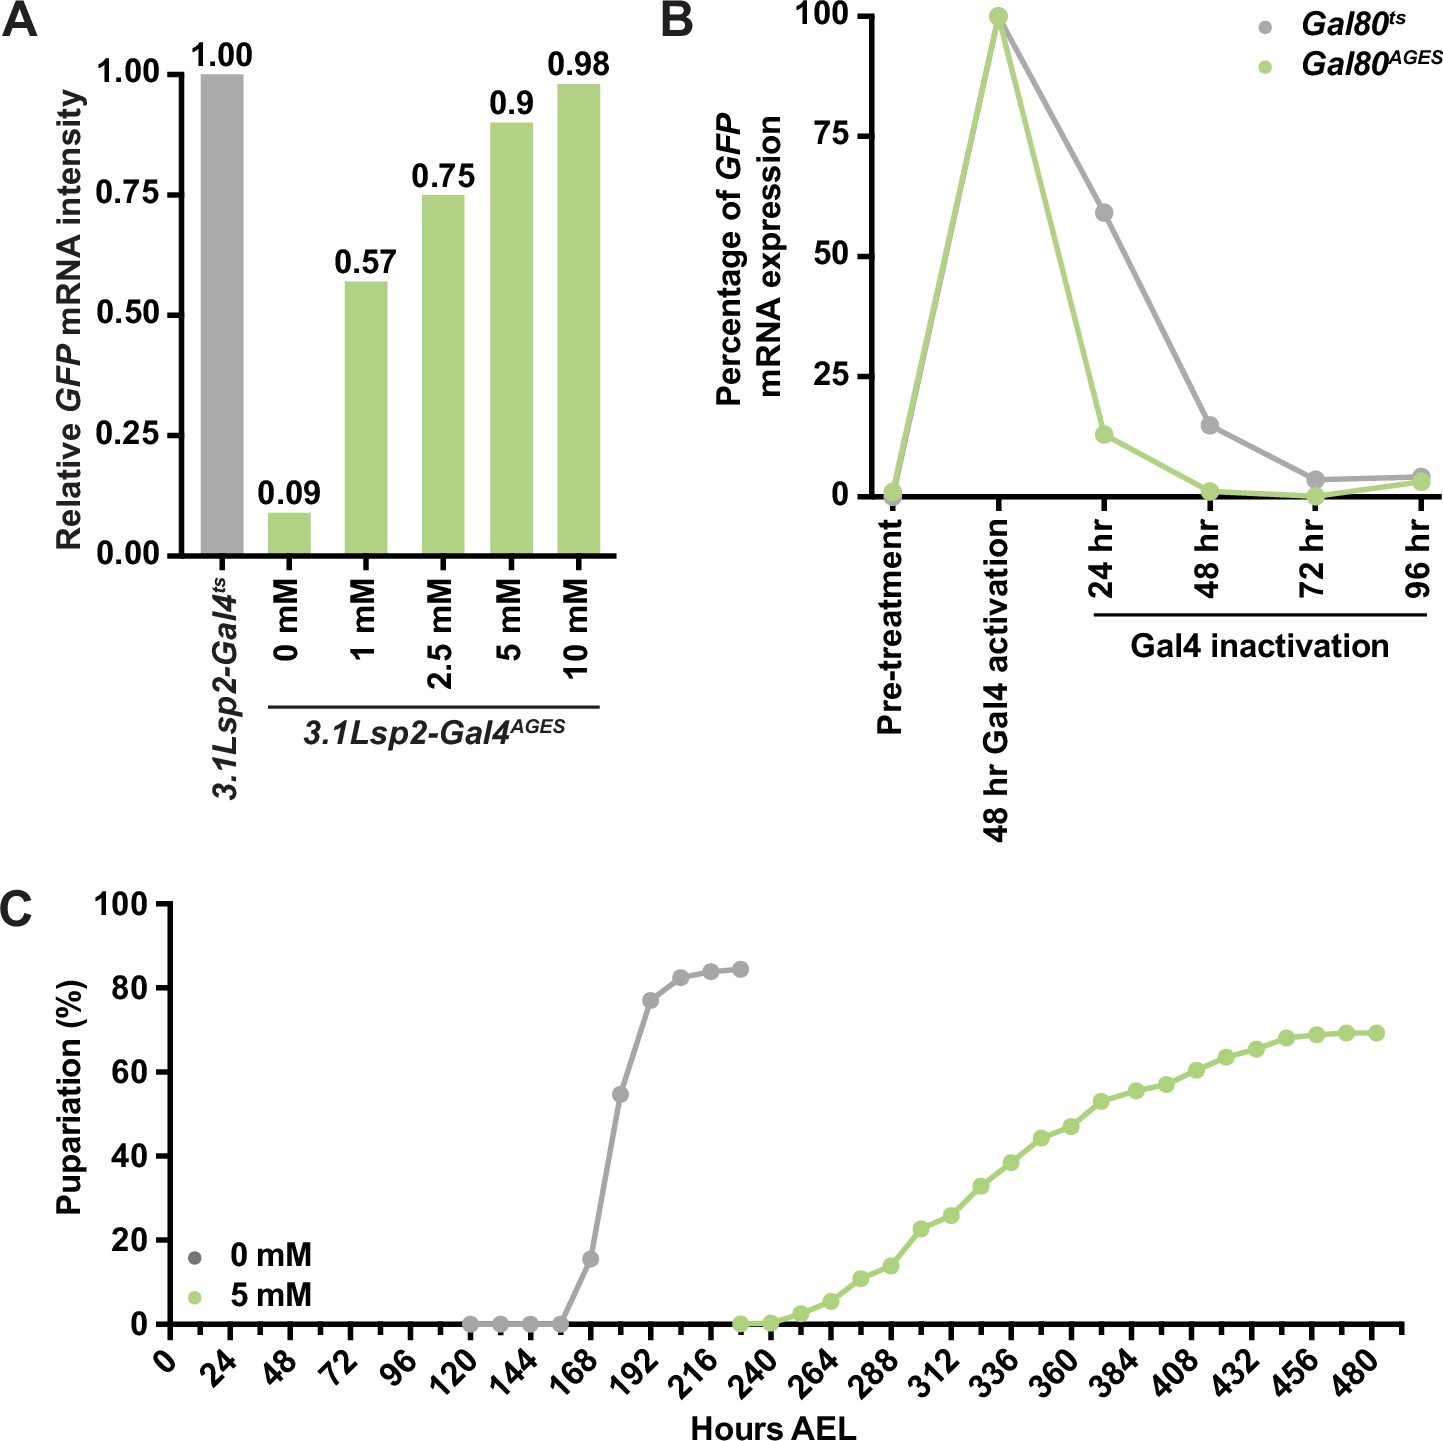
Auxin exposure increases the time of development.
(A) Relative mRNA intensity of GFP transcripts from 3.1Lsp2-Gal4ts or 3.1Lsp2-Gal4AGES to induce Gal4-mediated transgene expression. (B) Relative GFP transcript amount from 3.1Lsp2-Gal4ts or 3.1Lsp2-Gal4AGES during Gal4 activation and suppression. (C) Time to pupariation indicated in mixed-sex group of w1118 larvae reared on yeast–sugar–cornmeal food supplemented with 0 or 5 mM auxin. Time to pupariation was longer in w1118 auxin-exposed larvae than in larvae reared on a diet without auxin.
-
Figure 1—figure supplement 1—source data 1
Analysis of Gal4 expression in 3.1Lsp2-Gal4ts and 3.1Lsp2-Gal4AGES females.
- https://cdn.elifesciences.org/articles/91953/elife-91953-fig1-figsupp1-data1-v1.xlsx
-
Figure 1—figure supplement 1—source data 2
Analysis of Gal4 expression in 3.1Lsp2-Gal4ts and 3.1Lsp2-Gal4AGES females over time.
- https://cdn.elifesciences.org/articles/91953/elife-91953-fig1-figsupp1-data2-v1.xlsx
-
Figure 1—figure supplement 1—source data 3
Larval developmental time in the presence or absence of auxin.
- https://cdn.elifesciences.org/articles/91953/elife-91953-fig1-figsupp1-data3-v1.xlsx
Figure 1—figure supplement 2
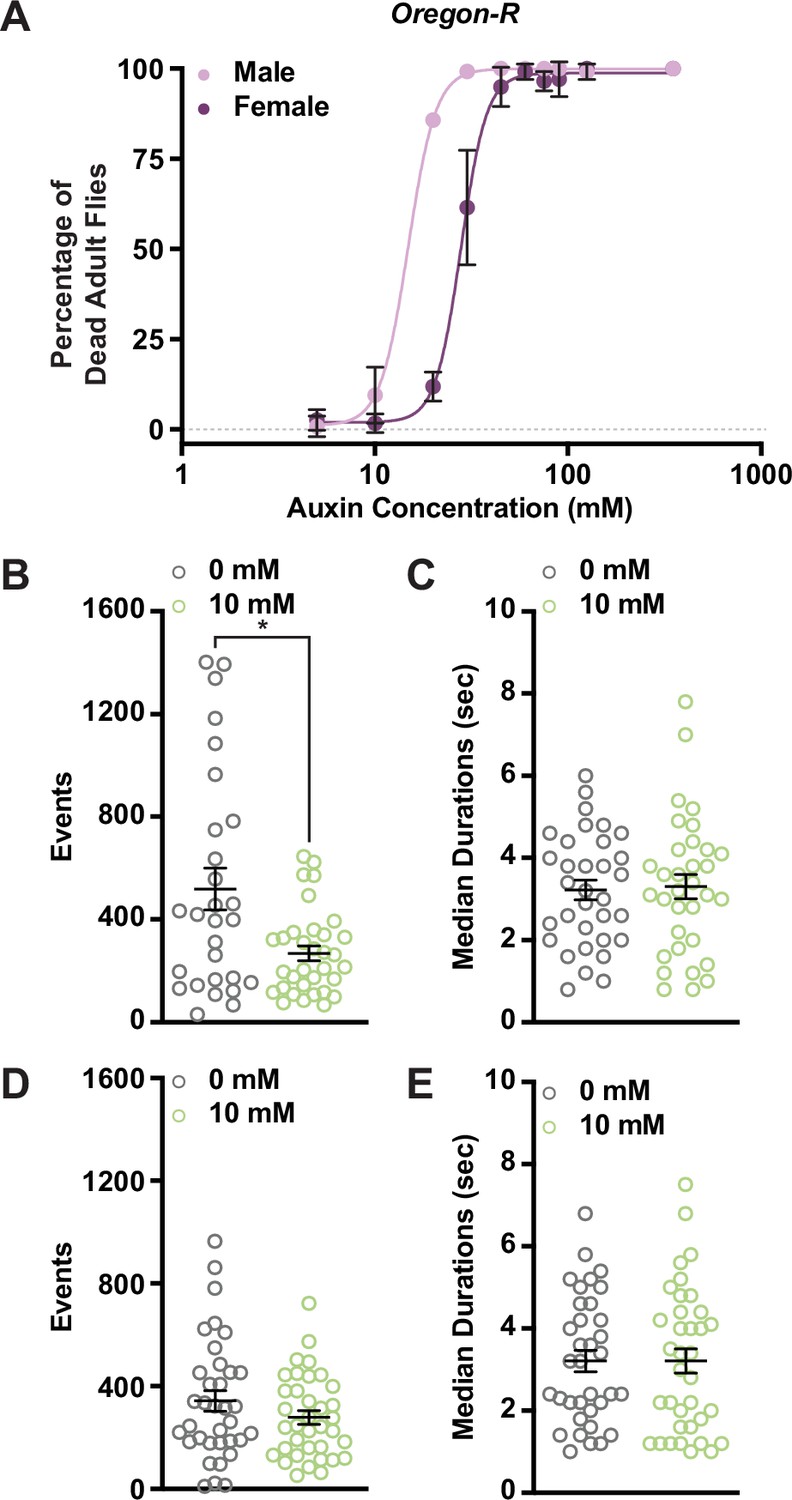
Auxin exposure in Oregon-R adults increases lethality and alters female feeding behavior.
(A) Lethality curves for adult Oregon-R males and females exposed to increasing concentrations of auxin. Twenty flies per sex and genotype were analyzed. Data shown as mean ± standard deviation (SD). (B) The total number of feeding events in Oregon-R females exposed to 0 or 10 mM auxin. (C) The median time of feeding activity in Oregon-R females exposed to 0 or 5 mM auxin. (D) The total number of events in Oregon-R males exposed to 0 or 10 mM auxin. (E) The median time of feeding activity in Oregon-R males exposed to 0 or 10 mM auxin. At least 30 animals analyzed per condition and sex. Data shown as mean ± standard error of the mean (SEM). *p < 0.05, Mann–Whitney U-test.
-
Figure 1—figure supplement 2—source data 1
Lethality analysis for Oregon-R males and females.
- https://cdn.elifesciences.org/articles/91953/elife-91953-fig1-figsupp2-data1-v1.xlsx
-
Figure 1—figure supplement 2—source data 2
FLIC analysis for Oregon-R females.
- https://cdn.elifesciences.org/articles/91953/elife-91953-fig1-figsupp2-data2-v1.xlsx
-
Figure 1—figure supplement 2—source data 3
FLIC analysis for Oregon-R males.
- https://cdn.elifesciences.org/articles/91953/elife-91953-fig1-figsupp2-data3-v1.xlsx
Figure 2 with 4 supplements
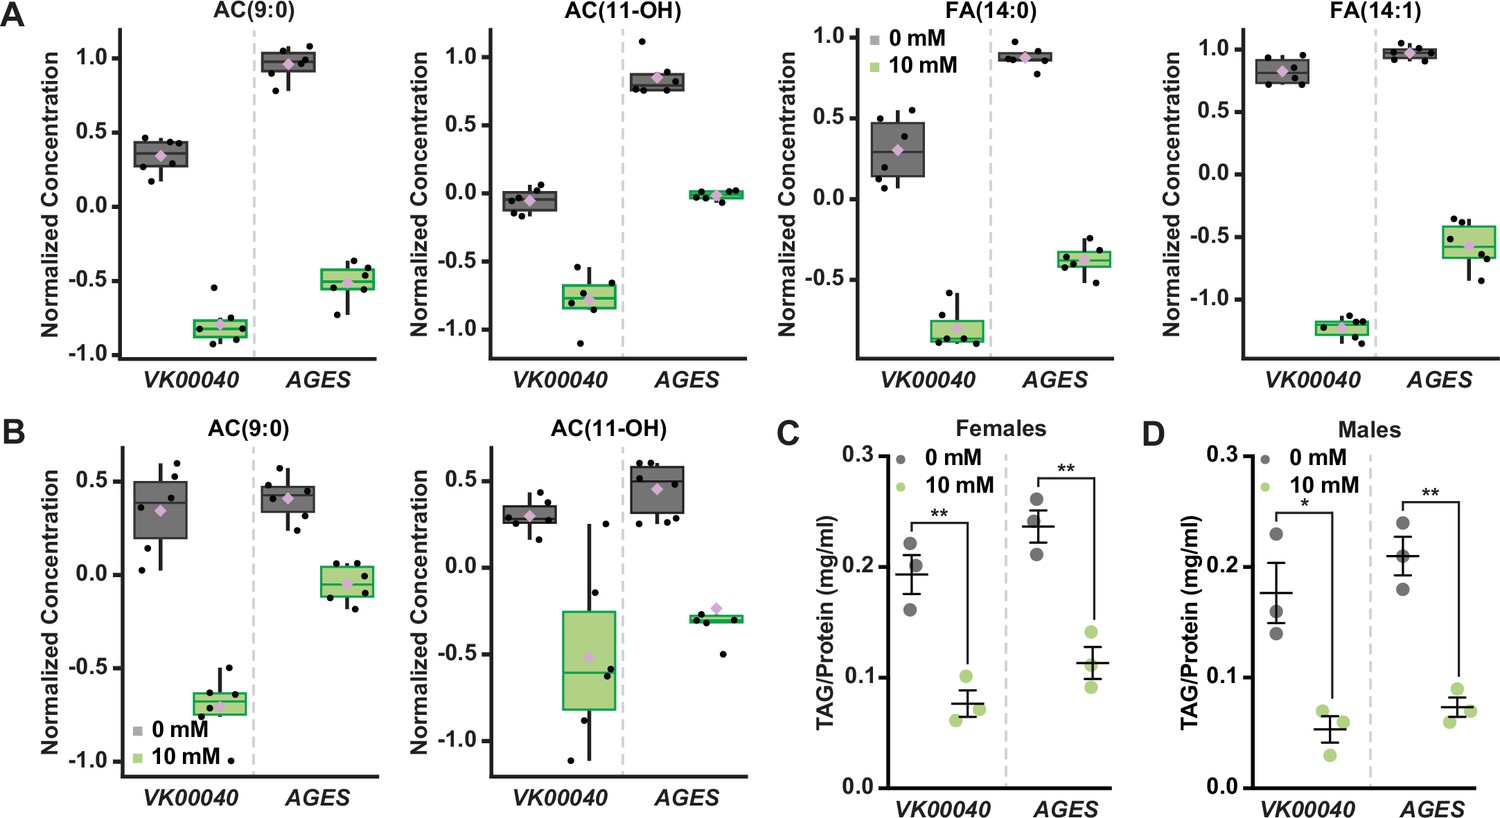
Auxin exposure decreases acylcarnitine, fatty acid, and triglyceride levels in adult Drosophila.
Box plots illustrating the relative abundance of acylcarnitine or fatty acid metabolites in adult females (A) or males (B) exposed to 0 or 10 mM auxin. All box plots were generated using MetaboAnalyst 5.0 as described in the methods. Black dots represent individual samples, the horizontal bar in the middle represents the median, and the purple diamond represents the mean concentration. For all box plots, the metabolite fold change was >twofold and p < 0.05. Triacylglycerol (TAG) contents (mg TAG/mg protein) in whole adult females (C) or males (D) in the VK00040 or AGES fly lines exposed to 0 or 10 mM auxin. Data shown as mean ± standard error of the mean (SEM). *p < 0.05, **p < 0.01, two-tailed Student’s t-test.
-
Figure 2—source data 1
Metabolomics raw data for Oregon-R, VK00040, and AGES males and females.
- https://cdn.elifesciences.org/articles/91953/elife-91953-fig2-data1-v1.xlsx
-
Figure 2—source data 2
Triacylglycerol (TAG) analysis for Oregon-R, VK00040, and AGES males and females.
- https://cdn.elifesciences.org/articles/91953/elife-91953-fig2-data2-v1.xlsx
Figure 2—figure supplement 1
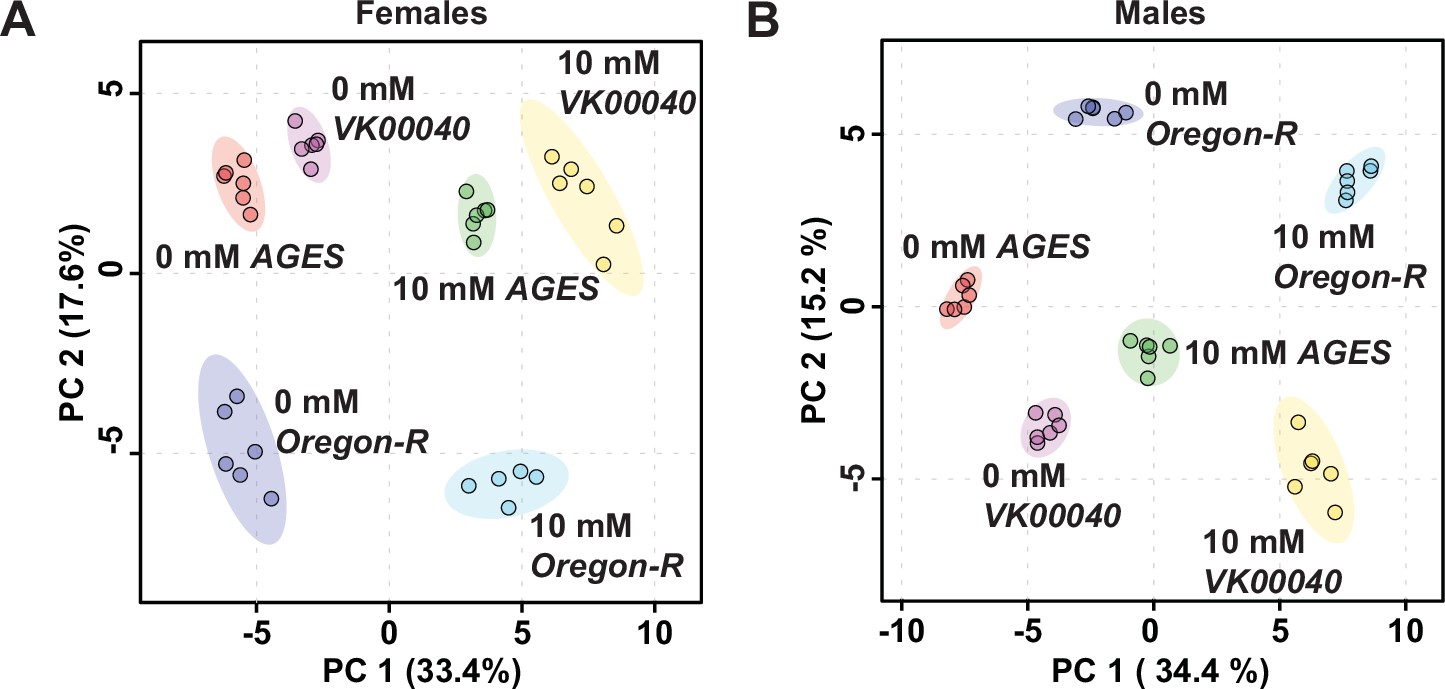
Auxin exposure alters metabolism in adult Drosophila males and females.
Comparison of the metabolomic profile from adult females (A) or males (B) exposed to 0 or 10 mM auxin in the Oregon-R, VK00040, or AGES background. Metabolomics data from Figure 2—source data 1 were analyzed using principal component analysis conducted by MetaboAnalyst 5.0.
Figure 2—figure supplement 2
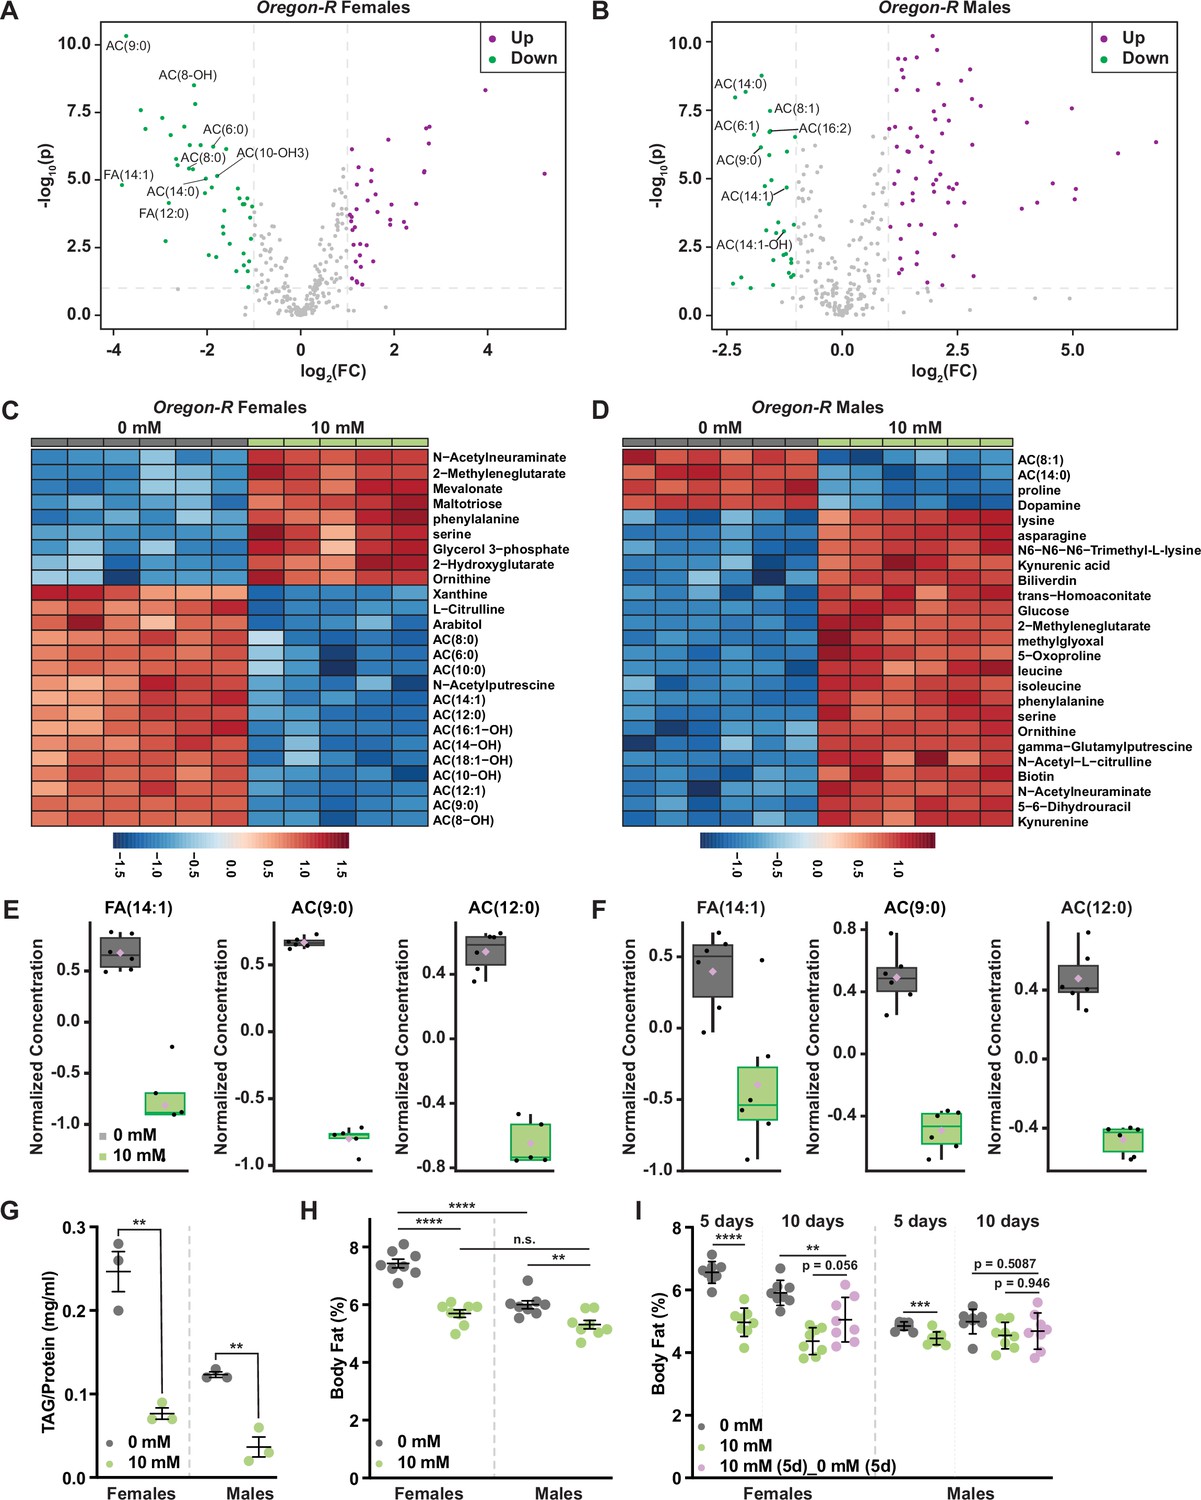
Acylcarnitine and fatty acid levels decrease in Oregon-R adult males and females exposed to auxin.
Volcano plot showing the differences in metabolite abundance in Oregon-R females (A) or Oregon-R males (B) exposed to 10 mM auxin and compared to the 0 mM auxin control as determined from MetaboAnalyst 5.0 analysis. Dashed vertical lines represent a log2 fold change (FC) greater than 1.5. The horizontal dashed line represents p < 0.01. Heat maps illustrating the top 25 most significantly altered compounds in Oregon-R females (C) or Oregon-R males (D) exposed to 10 mM auxin compared to 0 mM auxin controls as determined from MetaboAnalyst 5.0 analysis. Box plots illustrating the relative abundance of acylcarnitine or fatty acid metabolites in adult Oregon-R females (E) or males (F) exposed to 0 or 10 mM auxin. Black dots represent individual samples, the horizontal bar in the middle represents the median, and the purple diamond represents the mean concentration. For all box plots, plots were generated using MetaboAnalyst 5.0 as described in the methods, the metabolite fold change was >twofold, and p < 0.01. (G) Triacylglycerol (TAG) contents (mg TAG/mg protein) in whole adult Oregon-R females or males exposed to 0 or 10 mM auxin. Data shown as mean ± standard error of the mean (SEM). **p < 0.01, two-tailed Student’s t-test. (H) Percent body fat in virgin 5-day-old w1118 male and female flies. Larvae were reared on sugar–yeast–cornmeal food and transferred to food supplemented with 0 or 10 mM auxin at eclosion. Both females and males showed a significant decrease in percent body fat when maintained on a diet supplemented with the recommended auxin concentration (p < 0.0001 and p = 0.01, respectively; two-way analysis of variance [ANOVA]). Adult females showed a greater reduction in body fat compared with males in response to auxin exposure (sex:diet interaction p = 0.001; two-way ANOVA). (I) Percent body fat in virgin w1118 male and female flies. Larvae were reared on sugar–yeast–cornmeal food, and transferred to three different diets at eclosion: (1) sugar–yeast–cornmeal diet with no auxin, (2) sugar–yeast–cornmeal diet supplemented with 10 mM auxin for 5 days then shifted to sugar–yeast–cornmeal food with 0 mM auxin for 5 days, (3) sugar–yeast–cornmeal diet supplemented with 10 mM auxin for 10 days. Flies were collected for analysis at 5 and 10 days post-eclosion. Adult females showed a greater reduction in body fat compared with males in response to auxin exposure (sex:diet interaction p < 0.0001; two-way ANOVA). While percent body fat showed a strong trend toward recovery from 5 days of auxin treatment in females (p = 0.056; one-way ANOVA), body fat was still lower than in control females that had not been exposed to auxin (p = 0.0095, one-way ANOVA). This trend toward recovery in body fat was not observed in males (p = 0.946, one-way ANOVA). Prolonged (10-day) exposure to 10 mM auxin caused no further decrease in body fat compared with a shorter (5-day) exposure in either females or males (p = 0.1156 and 0.9890, respectively; one-way ANOVA). **p < 0.01, ***p < 0.01, ****p < 0.0001, two-tailed Student’s t-test.
-
Figure 2—figure supplement 2—source data 1
Body fat analysis for w1118 males and females.
- https://cdn.elifesciences.org/articles/91953/elife-91953-fig2-figsupp2-data1-v1.xlsx
-
Figure 2—figure supplement 2—source data 2
Body fat analysis for w1118 males and females after auxin withdrawal.
- https://cdn.elifesciences.org/articles/91953/elife-91953-fig2-figsupp2-data2-v1.xlsx
Figure 2—figure supplement 3
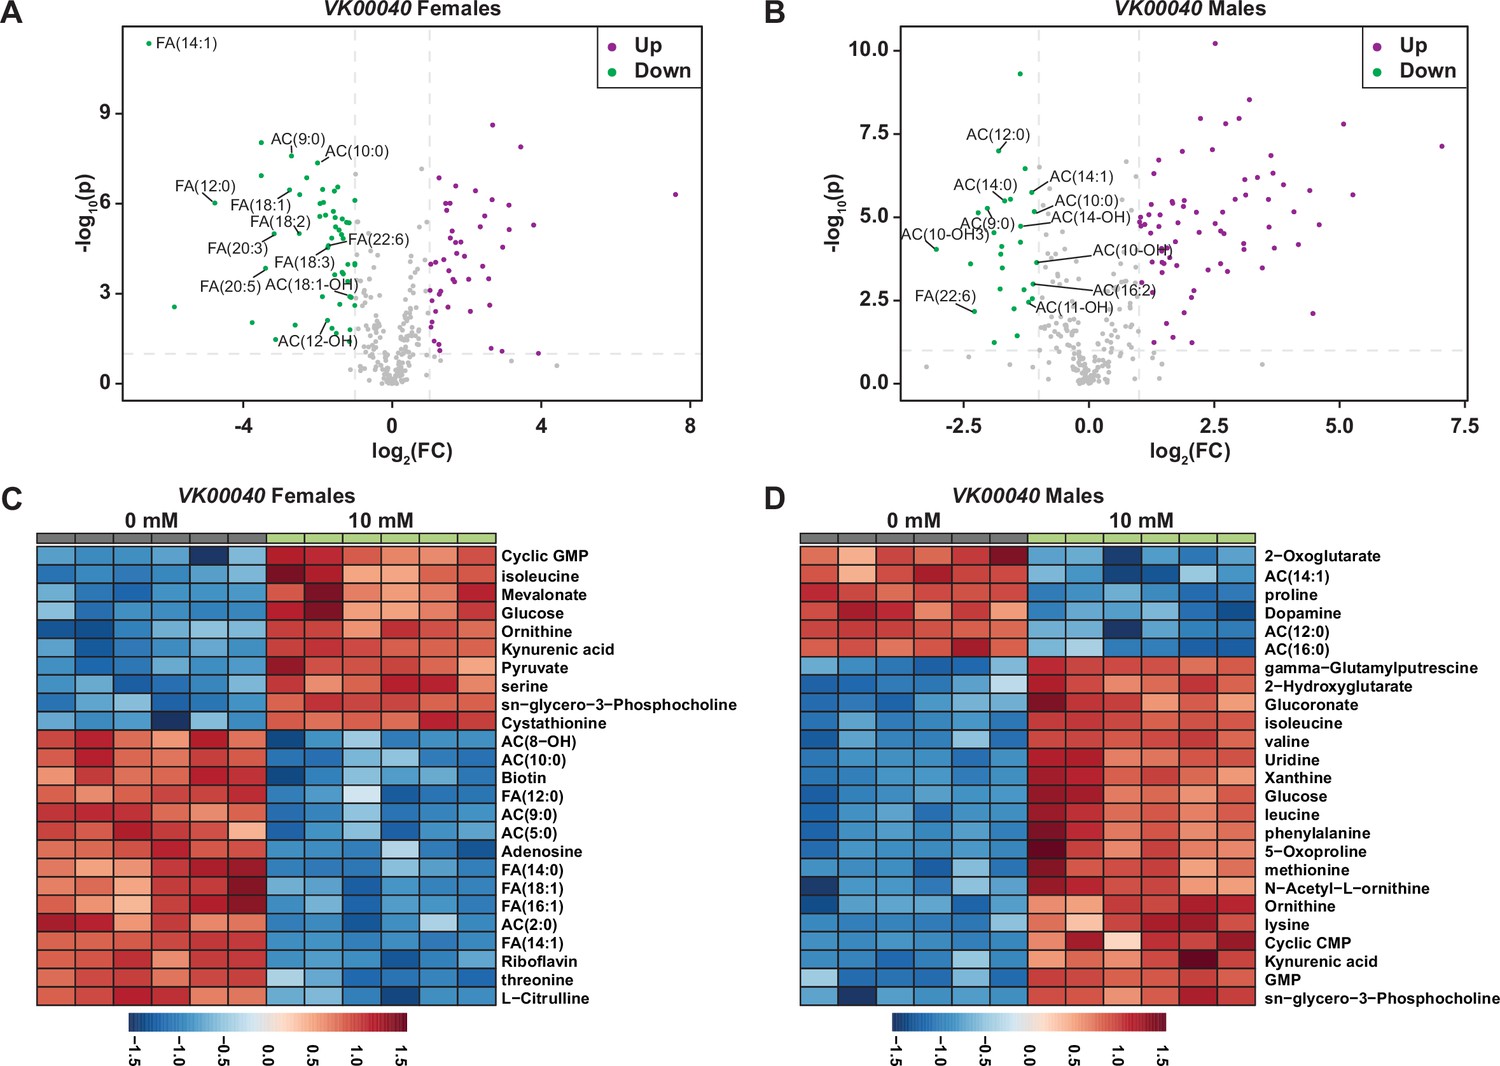
Auxin exposure decreases acylcarnitine and fatty acid metabolites in VK00040 adult males and females exposed to auxin.
Volcano plot showing the differences in metabolite abundance in VK00040 females (A) or VK00040 males (B) exposed to 10 mM auxin and compared to the 0 mM auxin control as determined from MetaboAnalyst 5.0 analysis. Dashed vertical lines represent a log2 fold change (FC) greater than 1.5. The horizontal dashed line represents p < 0.01. Heat maps illustrating the top 25 most significantly altered compounds in VK00040 females (C) or VK00040 males (D) exposed to 10 mM auxin compared to 0 mM auxin controls as determined from MetaboAnalyst 5.0 analysis.
Figure 2—figure supplement 4
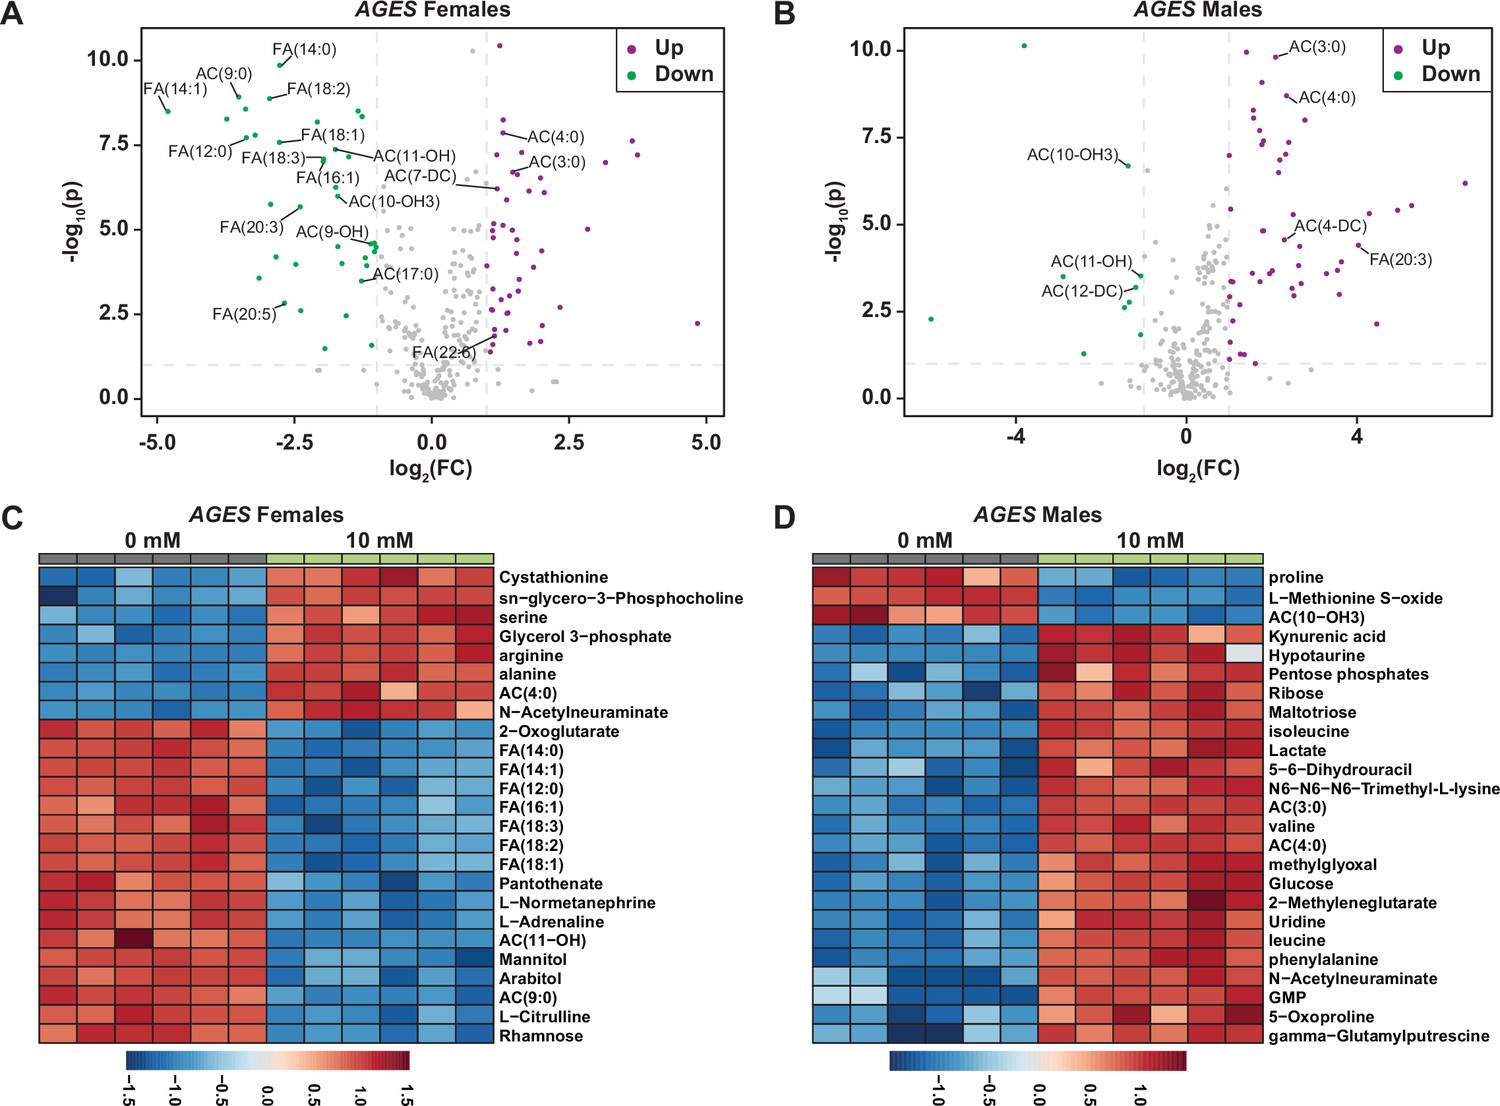
Acylcarnitine and fatty acid levels decrease in AGES adult males and females exposed to auxin.
Volcano plot showing the differences in metabolite abundance in AGES females (A) or AGES males (B) exposed to 10 mM auxin and compared to the 0 mM auxin control as determined from MetaboAnalyst 5.0 analysis. Dashed vertical lines represent a log2 fold change (FC) greater than 1.5. The horizontal dashed line represents p < 0.01. Heat maps illustrating the top 25 most significantly altered compounds in AGES females (C) or AGES males (D) exposed to 10 mM auxin compared to 0 mM auxin controls as determined from MetaboAnalyst 5.0 analysis.
Figure 3 with 2 supplements
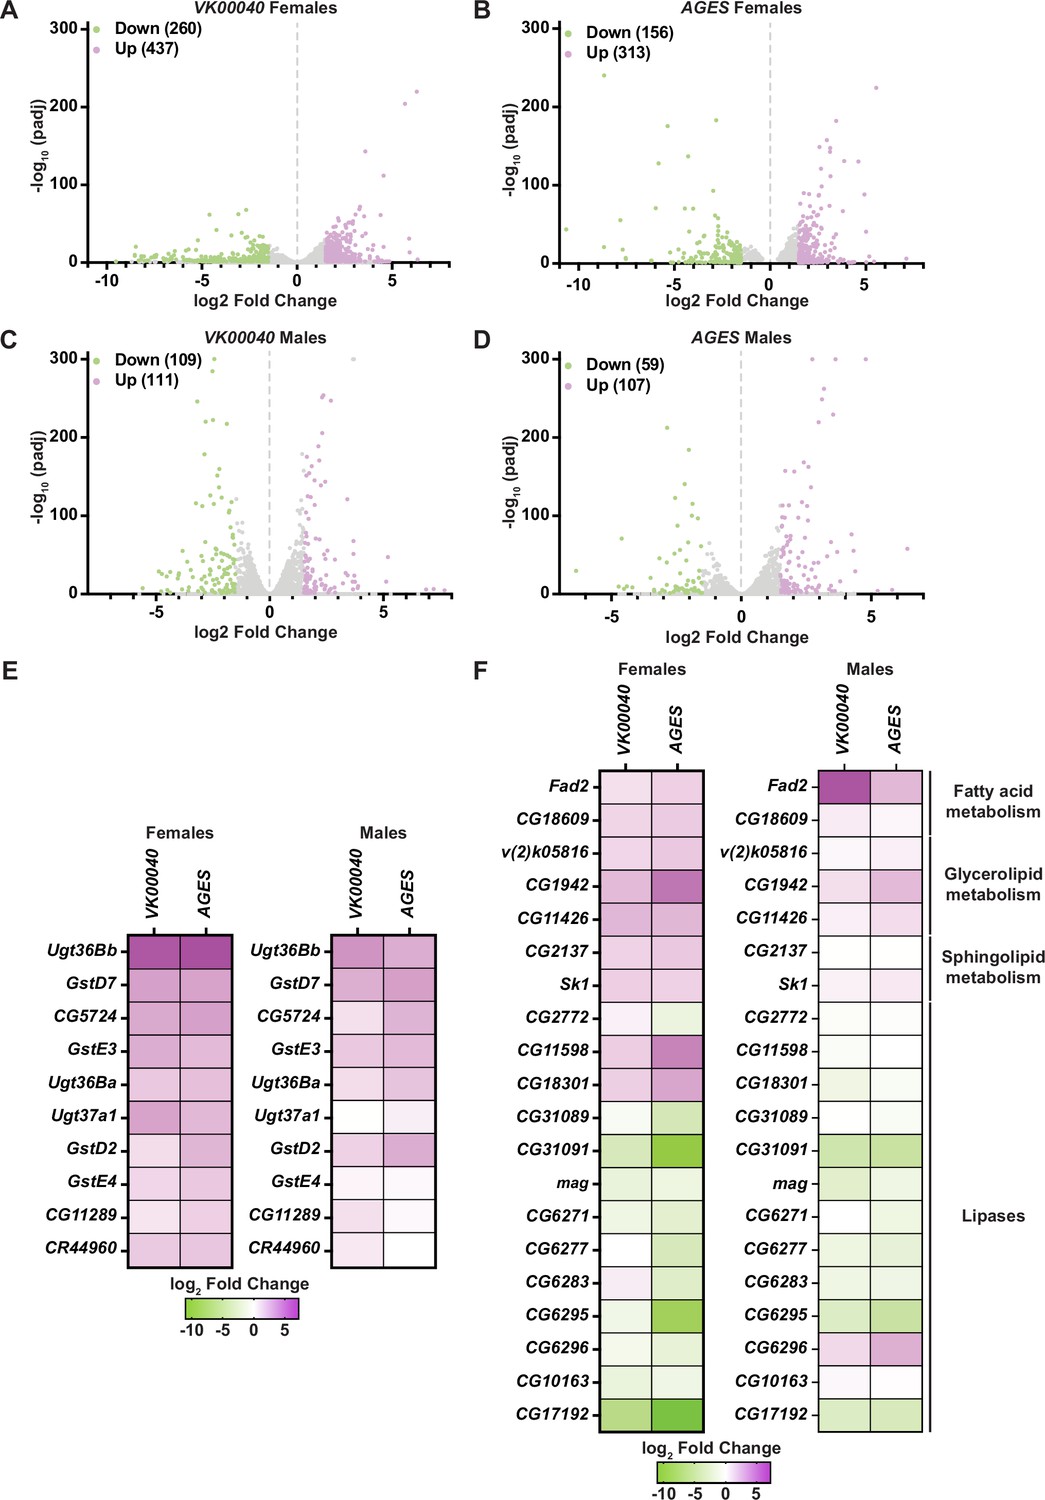
Lipid metabolism and detoxification transcripts are significantly altered in adult Drosophila in response to auxin exposure.
Volcano plots of differentially expressed genes graphing the statistical significance [−log10(padj)] against the magnitude of differential expression (log2 fold change) in females (A, B) or males (C, D) of the VK00040 or AGES line. (E) Significantly upregulated genes involved in ‘drug metabolism’ in adult females or males of the VK00040 or AGES lines exposed to 10 mM auxin and compared to the 0 mM control. (F) Significantly up- (purple) and downregulated (green) genes involved in fatty acid metabolism in adult females or males of the VK00040 or AGES lines exposed to 10 mM auxin and compared to the 0 mM control.
-
Figure 3—source data 1
RNA sequencing raw data from VK00040 females.
- https://cdn.elifesciences.org/articles/91953/elife-91953-fig3-data1-v1.xlsx
-
Figure 3—source data 2
RNA sequencing raw data from AGES females.
- https://cdn.elifesciences.org/articles/91953/elife-91953-fig3-data2-v1.xlsx
-
Figure 3—source data 3
RNA sequencing raw data from VK00040 males.
- https://cdn.elifesciences.org/articles/91953/elife-91953-fig3-data3-v1.xlsx
-
Figure 3—source data 4
RNA sequencing raw data from AGES males.
- https://cdn.elifesciences.org/articles/91953/elife-91953-fig3-data4-v1.xlsx
Figure 3—figure supplement 1
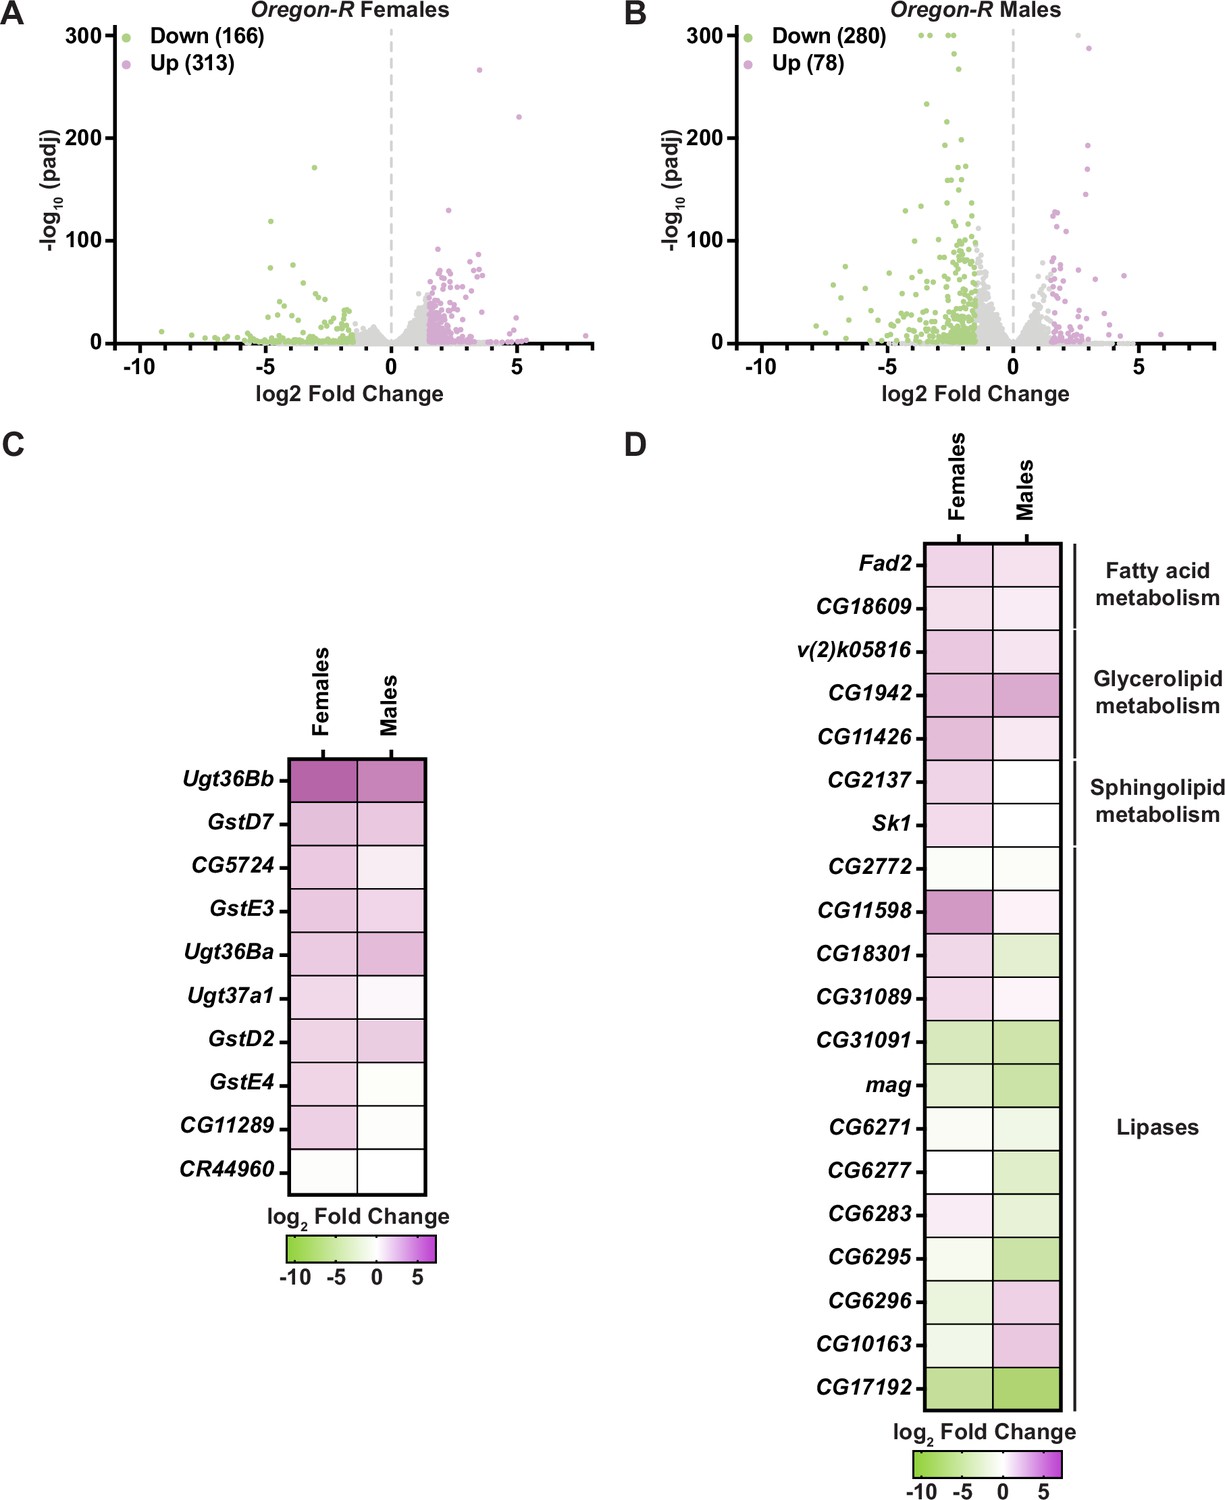
Transcripts of genes that regulate fatty acid metabolism and drug detoxification are altered in Oregon-R males and females exposed to auxin.
Volcano plots of differentially expressed genes graphing the statistical significance [−log10(padj)] against the magnitude of differential expression (log2 fold change) in Oregon-R females (A) or Oregon-R males (B) exposed to 10 mM auxin and compared to 0 mM control. (C) Significantly upregulated genes involved in ‘drug metabolism’ in adult Oregon-R females or males exposed to 10 mM auxin and compared to the 0 mM control. (D) Significantly up- (purple) and downregulated (green) genes involved in fatty acid metabolism in adult Oregon-R males or females exposed to 10 mM auxin and compared to the 0 mM control.
-
Figure 3—figure supplement 1—source data 1
RNA sequencing raw data from Oregon-R females.
- https://cdn.elifesciences.org/articles/91953/elife-91953-fig3-figsupp1-data1-v1.xlsx
-
Figure 3—figure supplement 1—source data 2
RNA sequencing raw data from Oregon-R males.
- https://cdn.elifesciences.org/articles/91953/elife-91953-fig3-figsupp1-data2-v1.xlsx
Figure 3—figure supplement 2
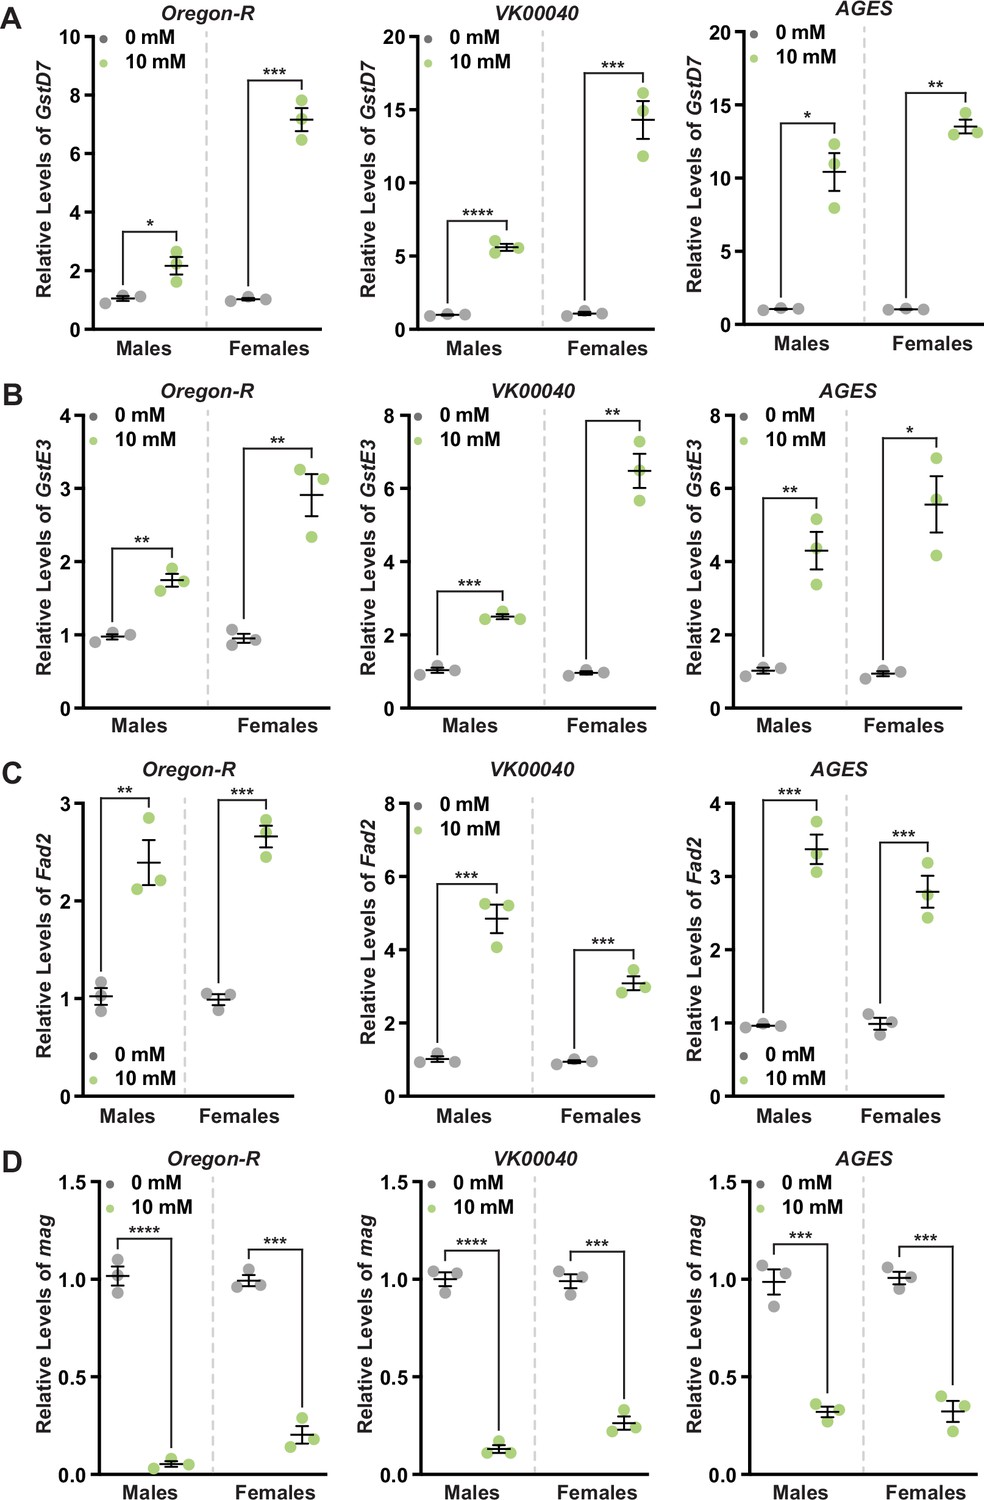
Auxin exposure differentially regulates detoxification and fatty acid metabolism genes.
Quantitative reverse-transcriptase polymerase chain reaction (qRT-PCR) analysis of GstD7 (A), GstE3 (B), Fad2 (C), and mag (D) transcripts from whole-body males and females fed 10 mM auxin for 2 days compared to 0 mM control in Oregon-R, VK00040, and AGES backgrounds. Experiments were performed in triplicate. Data shown as mean ± standard error of the mean (SEM). *p < 0.05, **p < 0.01, ***p < 0.001, ****p < 0.0001, Student’s t-test.
-
Figure 3—figure supplement 2—source data 1
Quantitative reverse-transcriptase polymerase chain reaction (qRT-PCR) analysis from Oregon-R, VK00040, and AGES males and females.
- https://cdn.elifesciences.org/articles/91953/elife-91953-fig3-figsupp2-data1-v1.xlsx
Figure 4 with 3 supplements
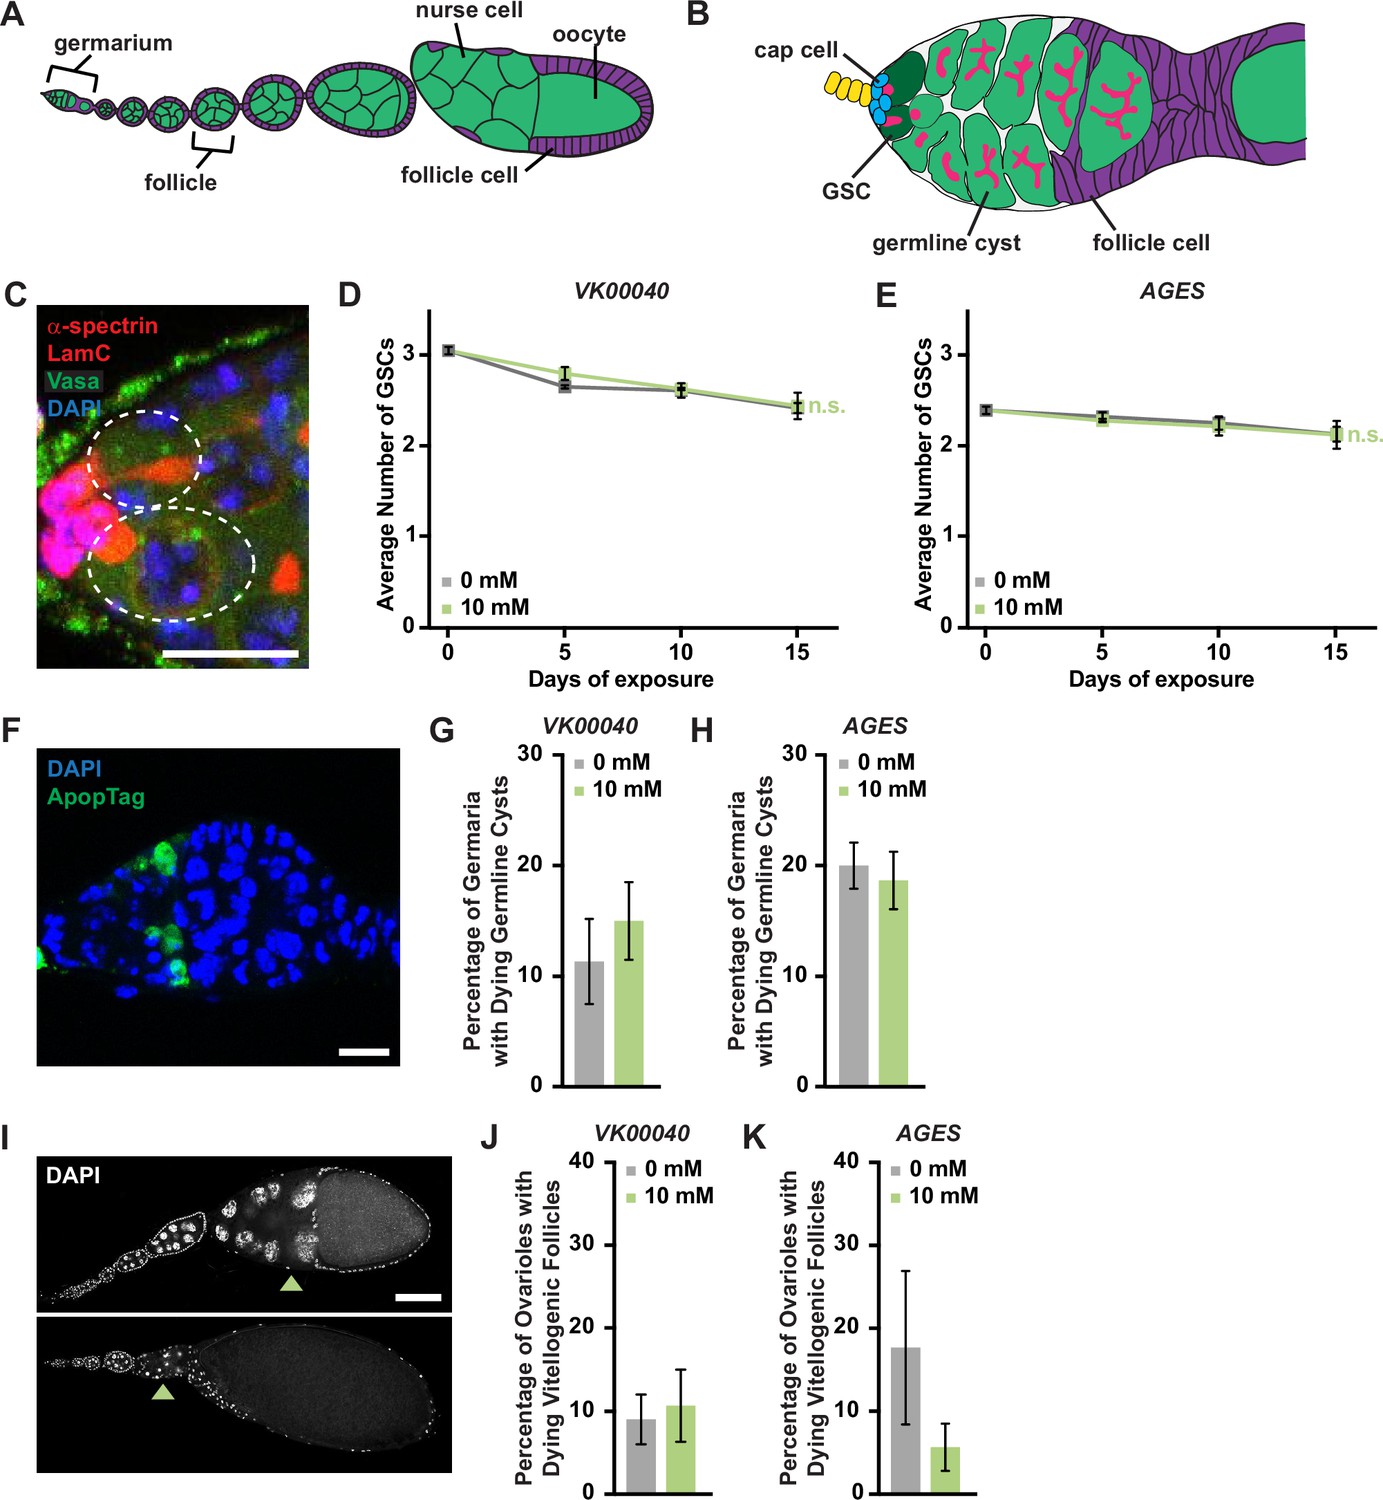
Auxin exposure does not significantly influence processes of oogenesis.
(A) Cartoon schematic of the adult Drosophila ovariole showing the anterior germarium followed by developing egg chambers, which consist of 16 germ cells (15 nurse cells and 1 oocyte; green) that are surrounded by follicle cells (purple). (B) Schematic of the germarium, which contains two to three germline stem cells (GSCs, dark green) and somatic cells (gray and purple). Each GSC divides asymmetrically to self-renew and generate a cystoblast that divides to form a 16-cell cyst. Early germline cysts are surrounded by follicle cells (purple) to bud a new egg chamber. GSCs and their progeny are identified based on the position and morphology of the fusome (pink), a germline-specific organelle. (C) Germaria from adult females exposed to 10 mM auxin for 10 days. α-Spectrin (magenta), fusome; LamC (red), cap cell nuclear lamina; Vasa (green), germ cells; 4′,6-diamidino-2-phenylindole (DAPI; blue), nuclei. GSCs are outlined. Scale bar, 10 µm. Average number of GSCs per germarium over time in females exposed to 0 or 10 mM auxin in the VK00040 (D) AGES (E) lines. At least 100 germaria were analyzed per time point and condition. Data shown as mean ± standard error of the mean (SEM). No statistically significant differences, two-way analysis of variance (ANOVA) with interaction. (F) Germaria from adult females exposed to 10 mM auxin. ApopTag (green), dying cells; DAPI (blue, nuclei). Average percentage of germaria containing ApopTag-positive germline cysts in adult females in the VK00040 (G) or AGES (H) lines exposed to 0 or 10 mM auxin. Data shown as mean ± SEM; Student’s t-test. 100 germaria were analyzed for each genotype and condition. (I) Ovarioles exposed to 10 mM auxin for 10 days showing a healthy ovariole (top) and an ovariole with a dying vitellogenic egg chamber (bottom). Arrowheads point to healthy or dying vitellogenic egg chambers. DAPI (white), nuclei. Scale bar, 100 µm. Average percentages of ovarioles containing dying vitellogenic egg chambers in females exposed to 0 or 10 mM auxin in the VK00040 (J) or AGES (K) lines. Data shown as mean ± SEM, Student’s t-test. 100 ovarioles were analyzed for each genotype and condition.
-
Figure 4—source data 1
Germline stem cell (GSC) and cap cell analysis from Oregon-R, VK00040, and AGES females.
- https://cdn.elifesciences.org/articles/91953/elife-91953-fig4-data1-v1.xlsx
-
Figure 4—source data 2
ApopTag analysis from VK00040 females.
- https://cdn.elifesciences.org/articles/91953/elife-91953-fig4-data2-v1.xlsx
-
Figure 4—source data 3
ApopTag analysis from AGES females.
- https://cdn.elifesciences.org/articles/91953/elife-91953-fig4-data3-v1.xlsx
-
Figure 4—source data 4
Dying vitellogenic egg chamber analysis from VK00040 females.
- https://cdn.elifesciences.org/articles/91953/elife-91953-fig4-data4-v1.xlsx
-
Figure 4—source data 5
Dying vitellogenic egg chamber analysis from AGES females.
- https://cdn.elifesciences.org/articles/91953/elife-91953-fig4-data5-v1.xlsx
Figure 4—figure supplement 1
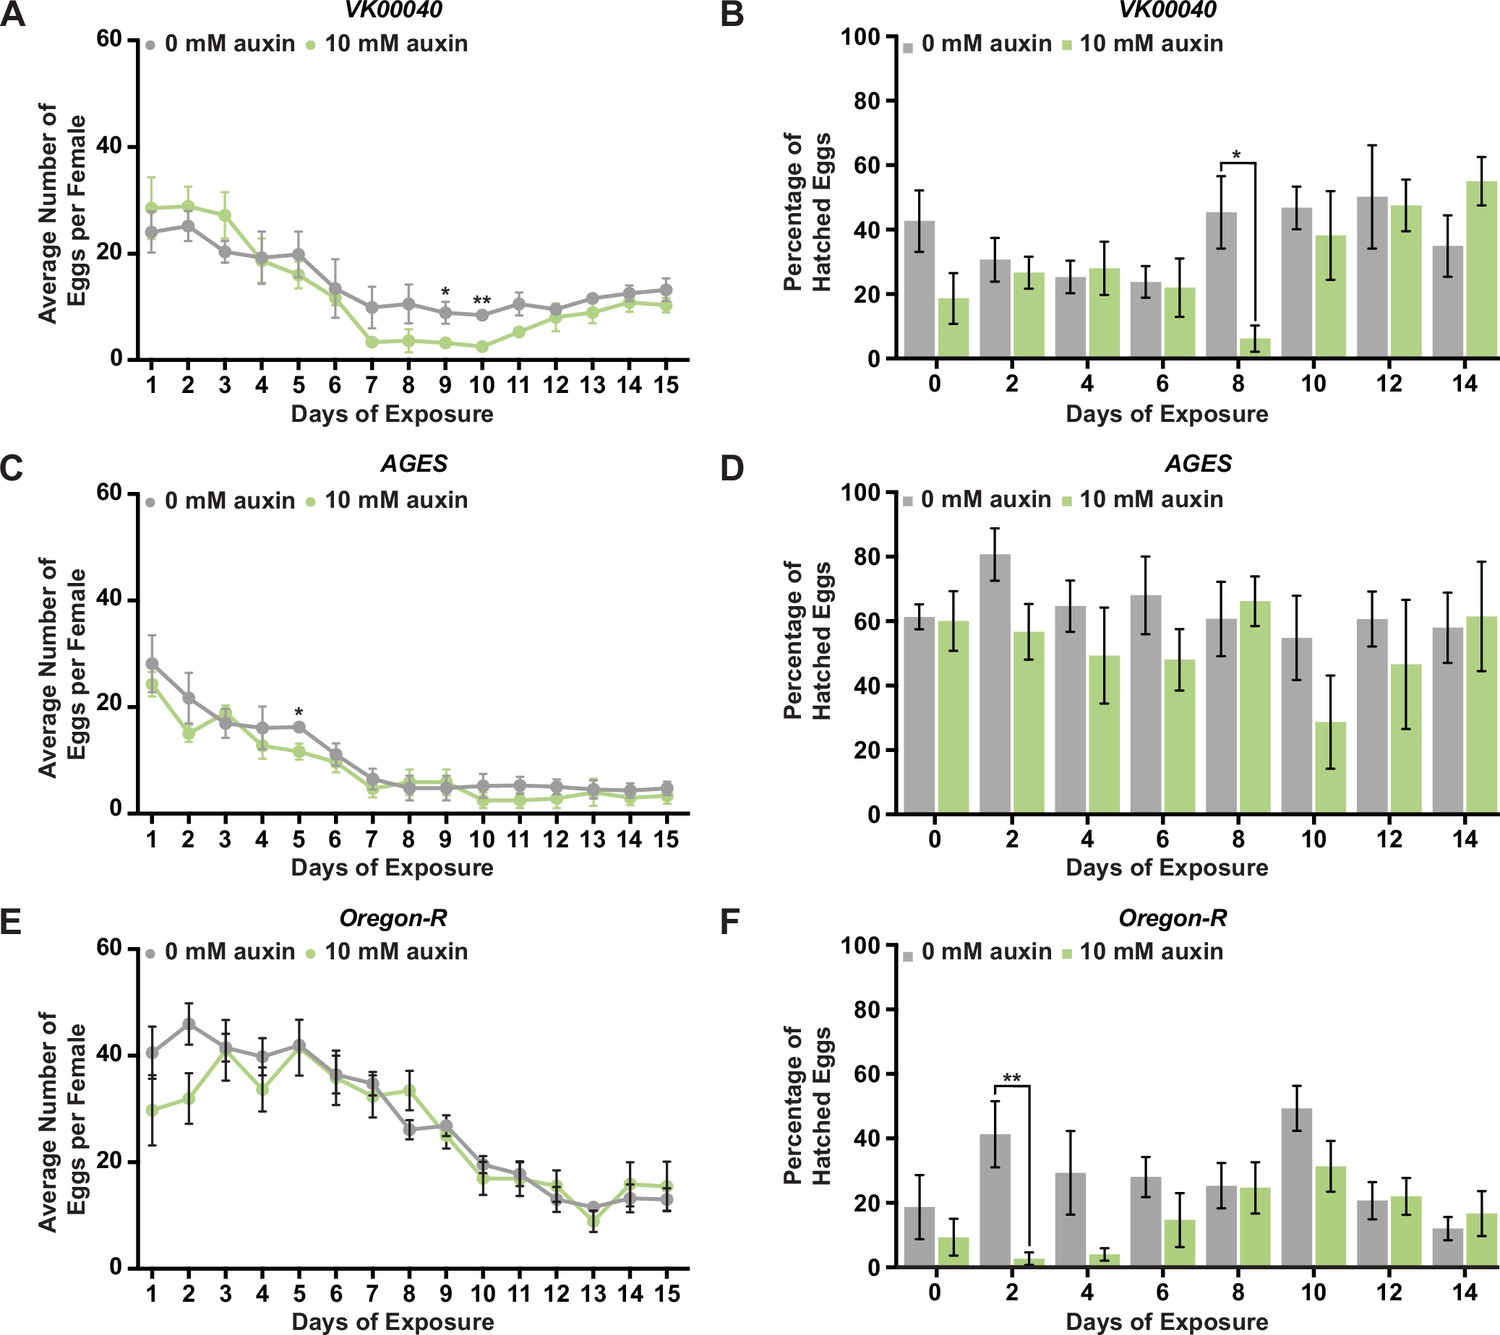
Auxin exposure does not significantly alter egg laying or progeny survival.
(A) Females of the VK00040 line were incubated at 25°C and fed 0 or 10 mM auxin. The average number of eggs laid per female under each condition. (B) The average number of eggs that hatched from adult females exposed to either 0 or 10 mM auxin of the VK00040 line. (C) Females of the AGES line were incubated at 25°C and fed 0 or 10 mM auxin. The average number of eggs laid per female under each condition. (D) The average number of eggs that hatched from adult females exposed to either 0 or 10 mM auxin of the AGES line. (E) Females of the Oregon-R line were incubated at 25°C and fed 0 or 10 mM auxin. The average number of eggs laid per female under each condition. (F) The average number of eggs that hatched from adult females exposed to either 0 or 10 mM auxin of the Oregon-R line. Data are plotted as the mean ± standard error of the mean (SEM). *p < 0.05, **p < 0.01, Student’s t-test.
-
Figure 4—figure supplement 1—source data 1
Egg count analysis from Oregon-R, VK00040, and AGES females.
- https://cdn.elifesciences.org/articles/91953/elife-91953-fig4-figsupp1-data1-v1.xlsx
-
Figure 4—figure supplement 1—source data 2
Hatching percentage analysis from Oregon-R, VK00040, and AGES females.
- https://cdn.elifesciences.org/articles/91953/elife-91953-fig4-figsupp1-data2-v1.xlsx
Figure 4—figure supplement 2
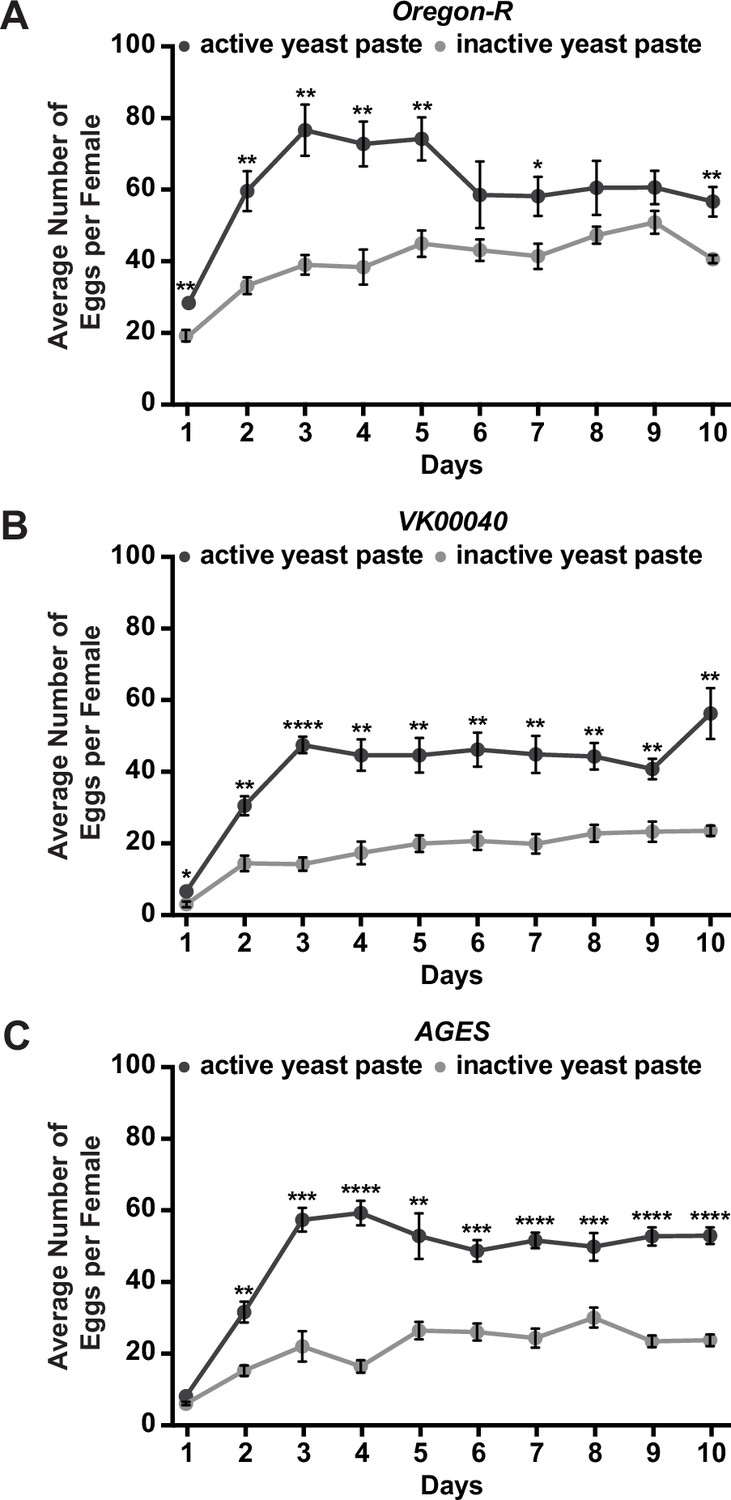
Inactive yeast paste decreases egg laying in adult females.
The average number of eggs laid per female per day exposed to either active or inactive yeast paste in adult females from Oregon-R (A), VK00040 (B), or AGES (C) backgrounds. Data shown as the mean ± standard error of the mean (SEM). *p < 0.05, **p < 0.01, ***p < 0.001, ****p < 0.0001, Student’s t-test.
-
Figure 4—figure supplement 2—source data 1
Egg count analysis from Oregon-R, VK00040, and AGES females treated with active or inactive yeast paste.
- https://cdn.elifesciences.org/articles/91953/elife-91953-fig4-figsupp2-data1-v1.xlsx
Figure 4—figure supplement 3
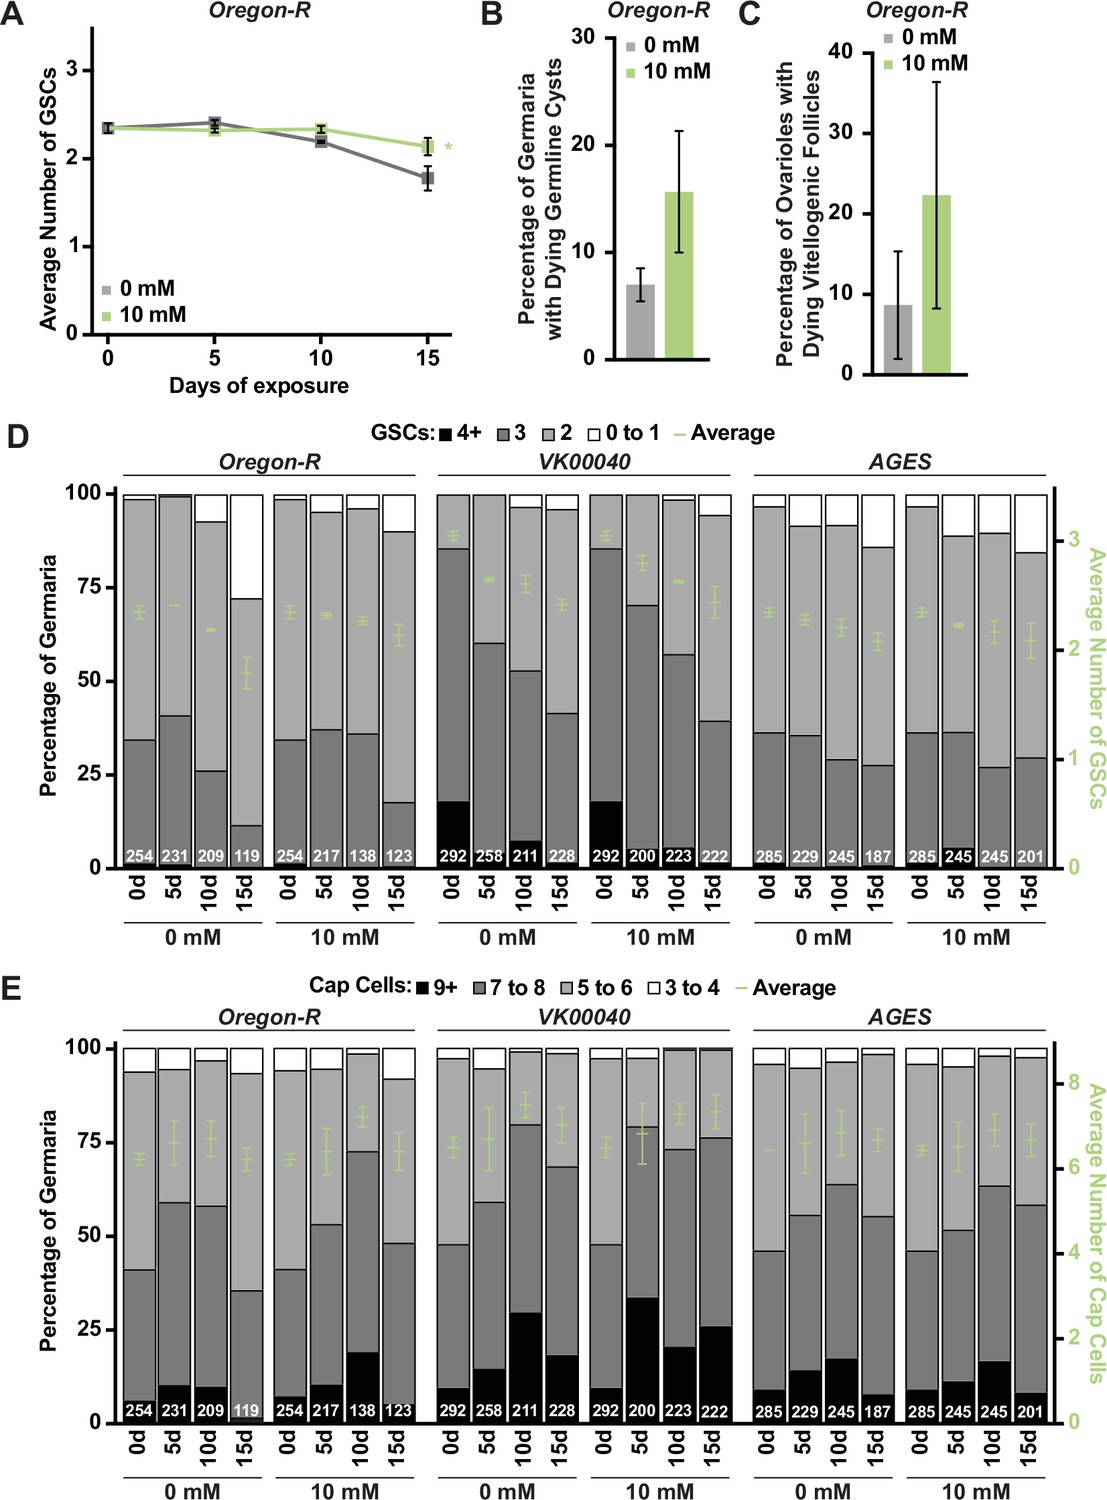
Processes of oogenesis are not significantly influenced by exposure to auxin.
(A) Average number of germline stem cells (GSCs) per germarium over time in Oregon-R females exposed to 0 or 10 mM auxin. Data shown as mean ± standard error of the mean (SEM). *p < 0.05, two-way analysis of variance (ANOVA) with interaction. At least 100 germaria per condition were analyzed. (B) Average percentage of germaria containing ApopTag-positive germline cysts in adult Oregon-R females exposed to 0 or 10 mM auxin. Data shown as mean ± SEM; Student’s t-test. 100 germaria were analyzed for each condition. (C) Average percentages of ovarioles containing dying vitellogenic egg chambers in Oregon-R females exposed to 0 or 10 mM auxin. Data shown as mean ± SEM, Student’s t-test. 100 ovarioles were analyzed for each condition. (D) Bars represent the percentage of germaria containing zero, one, two, three, or four-or-more GSCs at different days of females exposed to 0 or 10 mM auxin in Oregon-R, VK00040, or AGES backgrounds. GSC number averages shown as mean ± SEM (right y-axis) are also plotted in Figure 4—figure supplement 3. No statistically significant differences, two-way ANOVA with interaction. Numbers of germaria analyzed are shown inside bars. (E) Bars represent the percentage of germaria containing three-to-four, five-to-six, seven-to-eight, or greater or equal to nine cap cells at different times of 0 or 10 mM auxin exposure in Oregon-R, VK00040, or AGES backgrounds (left y-axis). Average number of cap cells per germarium shown as mean ± SEM (right y-axis) are plotted. No statistically significant differences, two-way ANOVA with interaction. Numbers of germaria analyzed are shown inside bars.
-
Figure 4—figure supplement 3—source data 1
ApopTag analysis from Oregon-R females.
- https://cdn.elifesciences.org/articles/91953/elife-91953-fig4-figsupp3-data1-v1.xlsx
-
Figure 4—figure supplement 3—source data 2
Dying vitellogenic egg chamber analysis from Oregon-R females.
- https://cdn.elifesciences.org/articles/91953/elife-91953-fig4-figsupp3-data2-v1.xlsx
Tables
Table 1
Benchmark dose of male and female Drosophila exposed to auxin.
| Genotype | Male | Female |
|---|---|---|
| Oregon-R | 8.89 mM | 19.97 mM |
| VK00040 | 17.446 mM | 14.208 mM |
| AGES | 32.449 mM | 57.291 mM |
Table 2
Average feeding events and durations in male and female Drosophila.
| Genotype | Male | Female | ||
|---|---|---|---|---|
| 0 mM | 10 mM | 0 mM | 10 mM | |
| Oregon-R | 342.8 ± 39.85 events 3.21 ± 0.26 s duration | 278.72 ± 26.64 events 3.21 ± 0.3 s duration | 519.14 ± 81.52 events 3.22 ± 0.24 s duration | 268.82 ± 28.65 events 3.3 ± 0.29 s duration |
| VK00040 | 266.42 ± 26.27 events 3.17 ± 0.29 s duration | 208.56 ± 21.15 events 2.22 ± 0.19 s duration | 432.23 ± 64.82 events 3.0 ± 0.22 s duration | 213.03 ± 22.54 events 2.66 ± 0.24 s duration |
| AGES | 217.15 ± 23.09 events 3.58 ± 0.25 s duration | 169.63 ± 15.25 events 2.71 ± 0.28 s duration | 277.44 ± 31.19 events 3.42 ± 0.25 s duration | 167.49 ± 15.9 events 2.71 ± 0.26 s duration |
Key resources table
| Reagent type (species) or resource | Designation | Source or reference | Identifiers | Additional information |
|---|---|---|---|---|
| Genetic reagent (D. melanogaster) | Oregon-R | Bloomington Drosophila Stock Center | BDSC:25211 | |
| Genetic reagent (D. melanogaster) | w1118 | Bloomington Drosophila Stock Center | BDSC:3605 | |
| Genetic reagent (D. melanogaster) | w1118; tubP-TIR1-T2A-Gal80.AID | Bloomington Drosophila Stock Center | BDSC:92470 | |
| Genetic reagent (D. melanogaster) | y1 w1118; VK00040/TM6B | Bloomington Drosophila Stock Center | BDSC:9755 | |
| Genetic reagent (D. melanogaster) | 3.1Lsp2-Gal4ts | Armstrong et al., 2014 | ||
| Genetic reagent (D. melanogaster) | 3.1Lsp2-Gal4AGES | This paper | Fly line maintained in L. Weaver lab | |
| Antibody | anti-alpha-spectrin (Mouse monoclonal) | Developmental Studies Hybridoma Bank | 3A9 (323 or M10-2) | IF (3 µg/ml) |
| Antibody | anti-LamC (Mouse monoclonal) | Developmental Studies Hybridoma Bank | LC28.26 | IF (0.8 µg/ml) |
| Antibody | anti-Vasa (Rat monoclonal) | Developmental Studies Hybridoma Bank | IF (2.15 µg/ml) | |
| Sequence-based reagent | Rp49_F1 | Weaver and Drummond-Barbosa, 2018 | PCR primer | CAGTCGGATCGATATGCTAAGC |
| Sequence-based reagent | Rp49_R1 | Weaver and Drummond-Barbosa, 2018 | PCR primer | AATCTCCTTGCGCTTCTTGG |
| Sequence-based reagent | Act5C_F1 | This paper | PCR primer | AGGCCAACCGTGAGAAGATG |
| Sequence-based reagent | Act5C_R1 | This paper | PCR primer | ACATACATGGCGGGTGTGTT |
| Sequence-based reagent | GstD7_F1 | This paper | PCR primer | TATCCACCGTAGAATGGTTTTCG |
| Sequence-based reagent | GstD7_R1 | This paper | PCR primer | CCCATCCAGGAGTTACTTTTGG |
| Sequence-based reagent | GstE3_F1 | This paper | PCR primer | ATGGGAAAACTTACGCTTTACGG |
| Sequence-based reagent | GstE3_R1 | This paper | PCR primer | ACGATCTTGTAGTCGAAGTCCA |
| Sequence-based reagent | Fad2_F1 | This paper | PCR primer | ACCGGAGTGCTTTACGAATCC |
| Sequence-based reagent | Fad2_R1 | This paper | PCR primer | GTGGTCTTCCGATTGCTTAGC |
| Sequence-based reagent | mag_F1 | This paper | PCR primer | GCATCCCGTACTCCCACAAG |
| Sequence-based reagent | mag_R1 | This paper | PCR primer | AGTTACTGAACAATCCGTGCTG |
| Commercial assay or kit | Stanbio Triglyceride Liquicolor kit | Thermo Fisher Scientific | Cat#SB-2100-430 | |
| Commercial assay or kit | Invitrogen RNAqueous-4PCR DNA-free RNA isolation for RT-PCR kit | Thermo Fisher Scientific | Cat#AM1914 | |
| Commercial assay or kit | NEBNext Ultra II RNA Library Prep Kit for Illumina | New England Biolabs | Cat# E7770L | |
| Commercial assay or kit | ApopTag Indirect In Situ Apoptosis Detection Kit | Thermo Fisher Scientific | Cat#S7110 | |
| Chemical compound, drug | 1-Naphthaleneacetic acid | Santa Cruz Biotechnology | Cat#15165-79-4 | Dissolved in 1 mM NaOH |
| Software, algorithm | Benchmark Dose Software (BMDS) | U.S. Environmental Protection Agency | https://www.epa.gov/bmds | |
| Software, algorithm | FLIC source code | Ro et al., 2014; Ro et al., 2020 | https://github.com/PletcherLab/FLIC_R_Code | |
| Software, algorithm | MetaboAnalyst 5.0 | Pang et al., 2021 | https://www.metaboanalyst.ca/ | |
| Other | Superscript II Reverse Transcriptase | Thermo Fisher Scientific | Cat# 18064014 | Reverse transcriptase used for cDNA synthesis |
| Other | PowerUp SYBR Green Master Mix | Thermo Fisher Scientific | Cat# A25742 | Master mix used for qPCR reactions |
| Other | VECTASHIELD (Antifade Mounting Medium with DAPI) | Thermo Fisher Scientific | Cat# NC9524612 | Anti-fade mounting media with DAPI included |
Additional files
Download links
A two-part list of links to download the article, or parts of the article, in various formats.
Downloads (link to download the article as PDF)
Open citations (links to open the citations from this article in various online reference manager services)
Cite this article (links to download the citations from this article in formats compatible with various reference manager tools)
Auxin exposure disrupts feeding behavior and fatty acid metabolism in adult Drosophila
eLife 12:RP91953.
https://doi.org/10.7554/eLife.91953.3


