Divergent downstream biosynthetic pathways are supported by L-cysteine synthases of Mycobacterium tuberculosis
- National Institute of Immunology, India
- CSIR-Centre for Cellular and Molecular Biology, India
- The Francis Crick Institute, United Kingdom
- Academy of Scientific and Innovative Research (AcSIR), India
- Department of Pharmacy, Birla Institute of Technology and Science-Pilani, India
- Department of Chemistry, The Herbert Wertheim UF Scripps Institute for Biomedical Innovation & Technology, United States
Figures
Figure 1 with 5 supplements
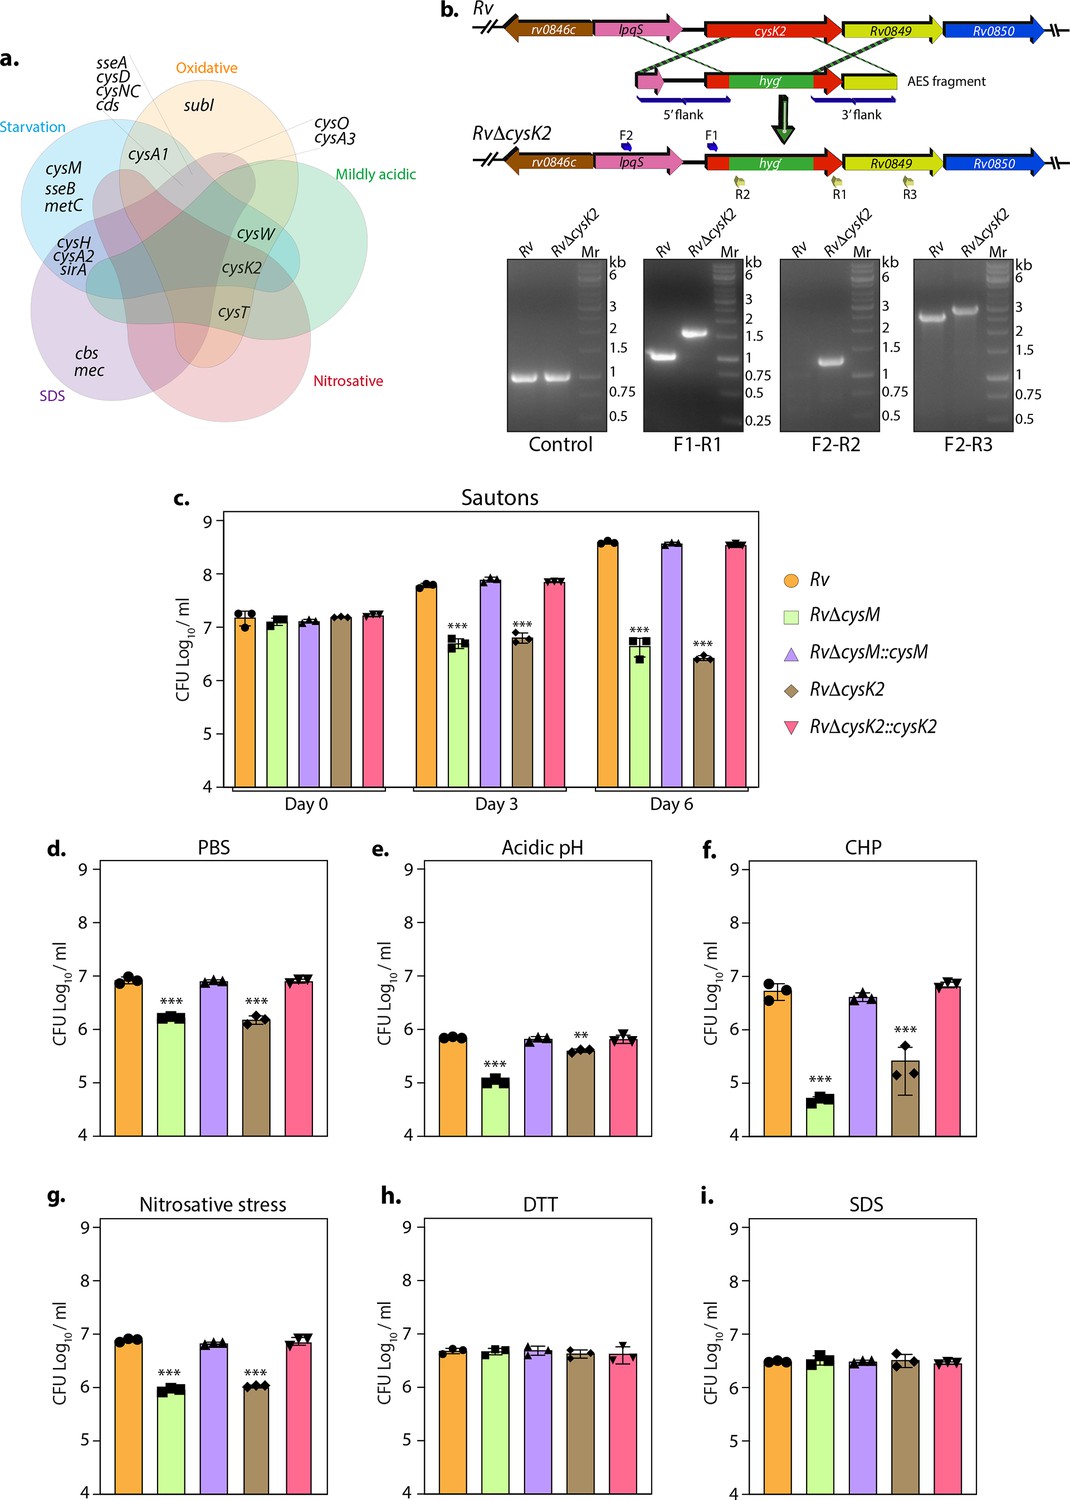
Non-canonical L-cysteine synthases facilitate mycobacterial survival upon host-like induced stresses in vitro.
(a) Five-way Venn diagram highlighting differentially expressed genes (DEGs) belonging to sulfur metabolism pathway under indicated stress conditions (absolute log2 Fold change >0.5 and padj value <0.05). (b) Line diagram illustrating the cysK2 loci in Rv and RvΔcysK2 and the strategy employed for the replacement of cysK2 with hygr. Primer sets used for confirming the generation of RvΔcysK2 are indicated as arrows. The first agarose gel image shows PCR (Polymerase chain reaction) amplicons with a control (sigB) gene-specific primer indicating the presence of nearly equivalent amount of genomic DNA isolated from Rv and RvΔcysK2. The second panel shows PCR amplicons with gene-specific primer set (F1–R1) in Rv and RvΔcysK2 mutant, the third panel shows amplicons (F2–R2) expected only in RvΔcysK2 mutant, and the fourth panel shows amplicons (F2–R3) in Rv and RvΔcysK2 mutant confirming legitimate recombination at native loci. Mr represents 1 kb gene ruler ladder. Rv, RvΔcysM, RvΔcysK2, RvΔcysM::cysM, and RvΔcysK2::cysK2 strains were inoculated in Sauton’s (c), PBS (Phosphate-Buffered Saline) (d), or acidic (e), oxidative 50 µM cumene hydroperoxide (CHP) for 24 hr (f), nitrosative (g), reductive (h), and sodium dodecyl sulfate (SDS) (i). Bar graphs represent the bacillary survival with data point indicating values CFU log10/ml ± standard deviations (SDs) from individual replicate (n = 3). Statistical significance was drawn in comparison with Rv using one-way analysis of variance (ANOVA) followed by a post hoc test (Tukey test; GraphPad prism). **p < 0.005; ***p < 0.0005.
-
Figure 1—source data 1
Raw CFU/ml values for Figure 1c–i.
- https://cdn.elifesciences.org/articles/91970/elife-91970-fig1-data1-v1.xlsx
-
Figure 1—source data 2
Raw unedited gel images for Figure 1b.
- https://cdn.elifesciences.org/articles/91970/elife-91970-fig1-data2-v1.pdf
-
Figure 1—source data 3
Uncropped and labelled images for Figure 1b.
- https://cdn.elifesciences.org/articles/91970/elife-91970-fig1-data3-v1.pdf
Figure 1—figure supplement 1

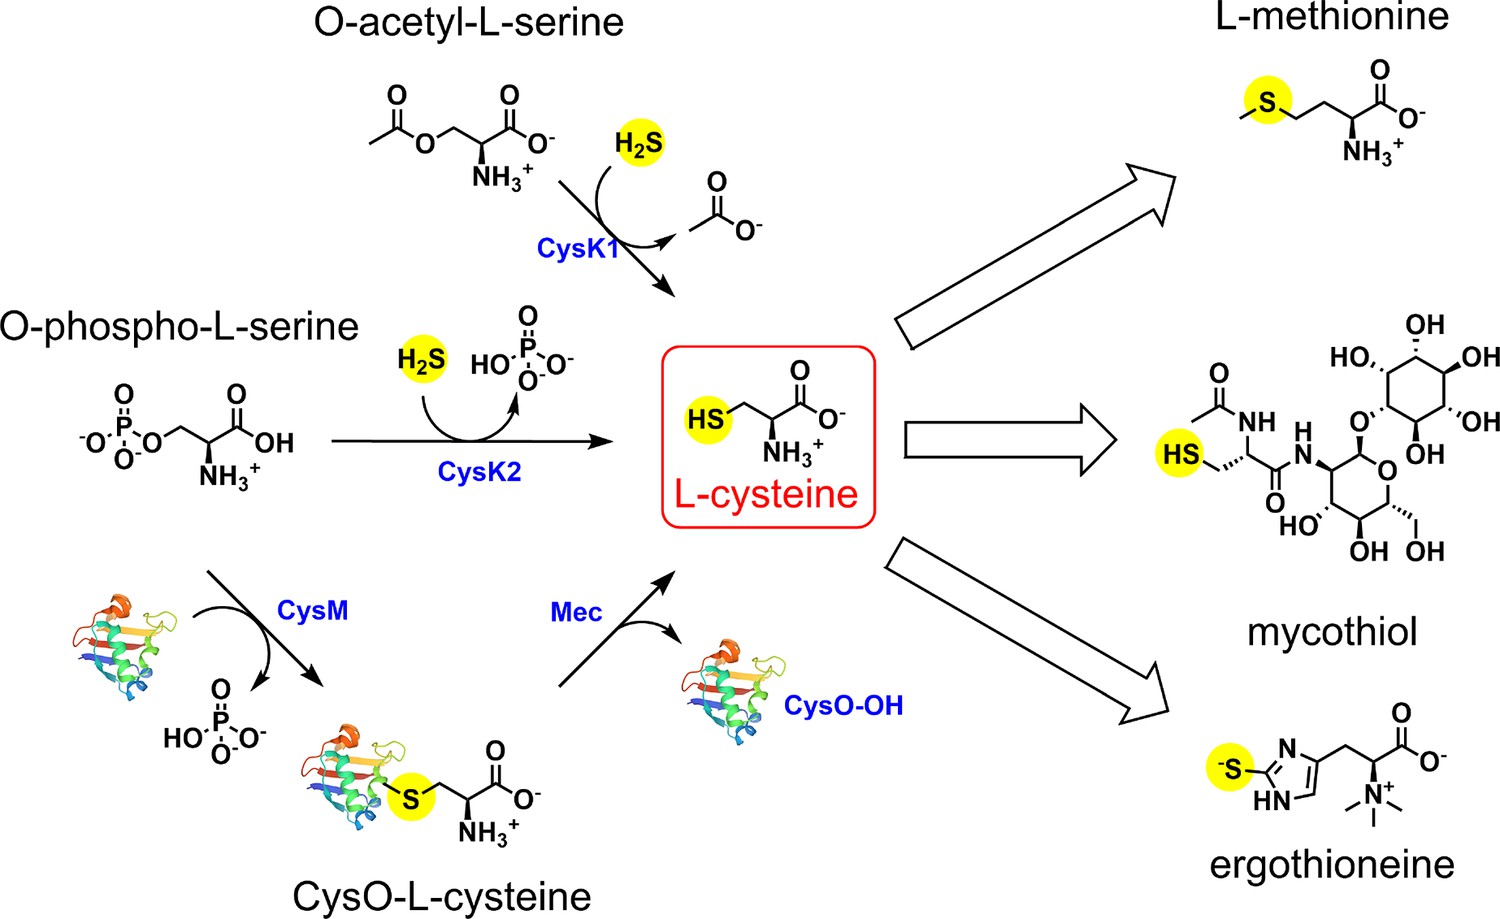
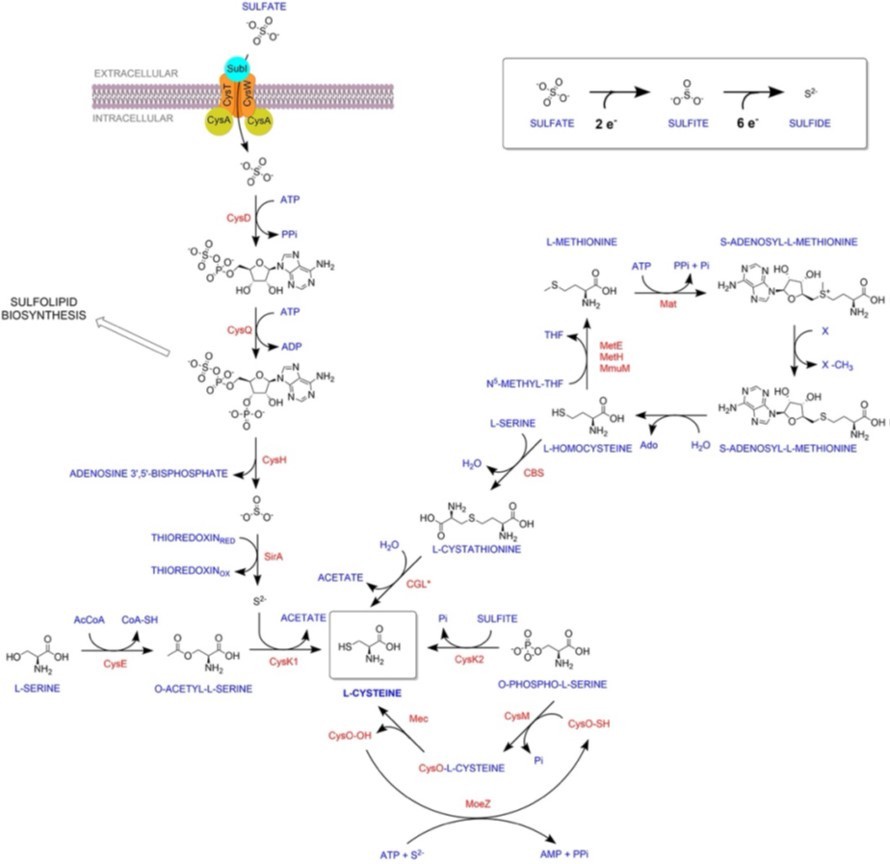
Overview of sulfur metabolism pathway in Mycobacterium tuberculosis.
Sulfate is imported via the sulfate transporter composed of SufI.CysT.W.A, which is acted upon by CysDNC complex to form adenosine-5′-phosphosulfate (APS). APS can either form sulfolipids or is reduced by subsequent actions of CysH and SirA to form sulfide. CysK1, the classical L-cysteine synthase, utilizes reduced sulfide and O-acetyl-L-serine as substrates to form L-cysteine. Alternatively, L-cysteine is produced by CysM, a non-canonical L-cysteine synthase that is unique to actinomycetes, and uses O-phospho-L-serine and a small sulfur carrier protein CysO to form L-cysteine. Mtb also encodes for a third L-cysteine synthase, CysK2. However, the major product of this pathway is S-sulfo-L-cysteine, which can get rapidly converted to L-cysteine.
Figure 1—figure supplement 2
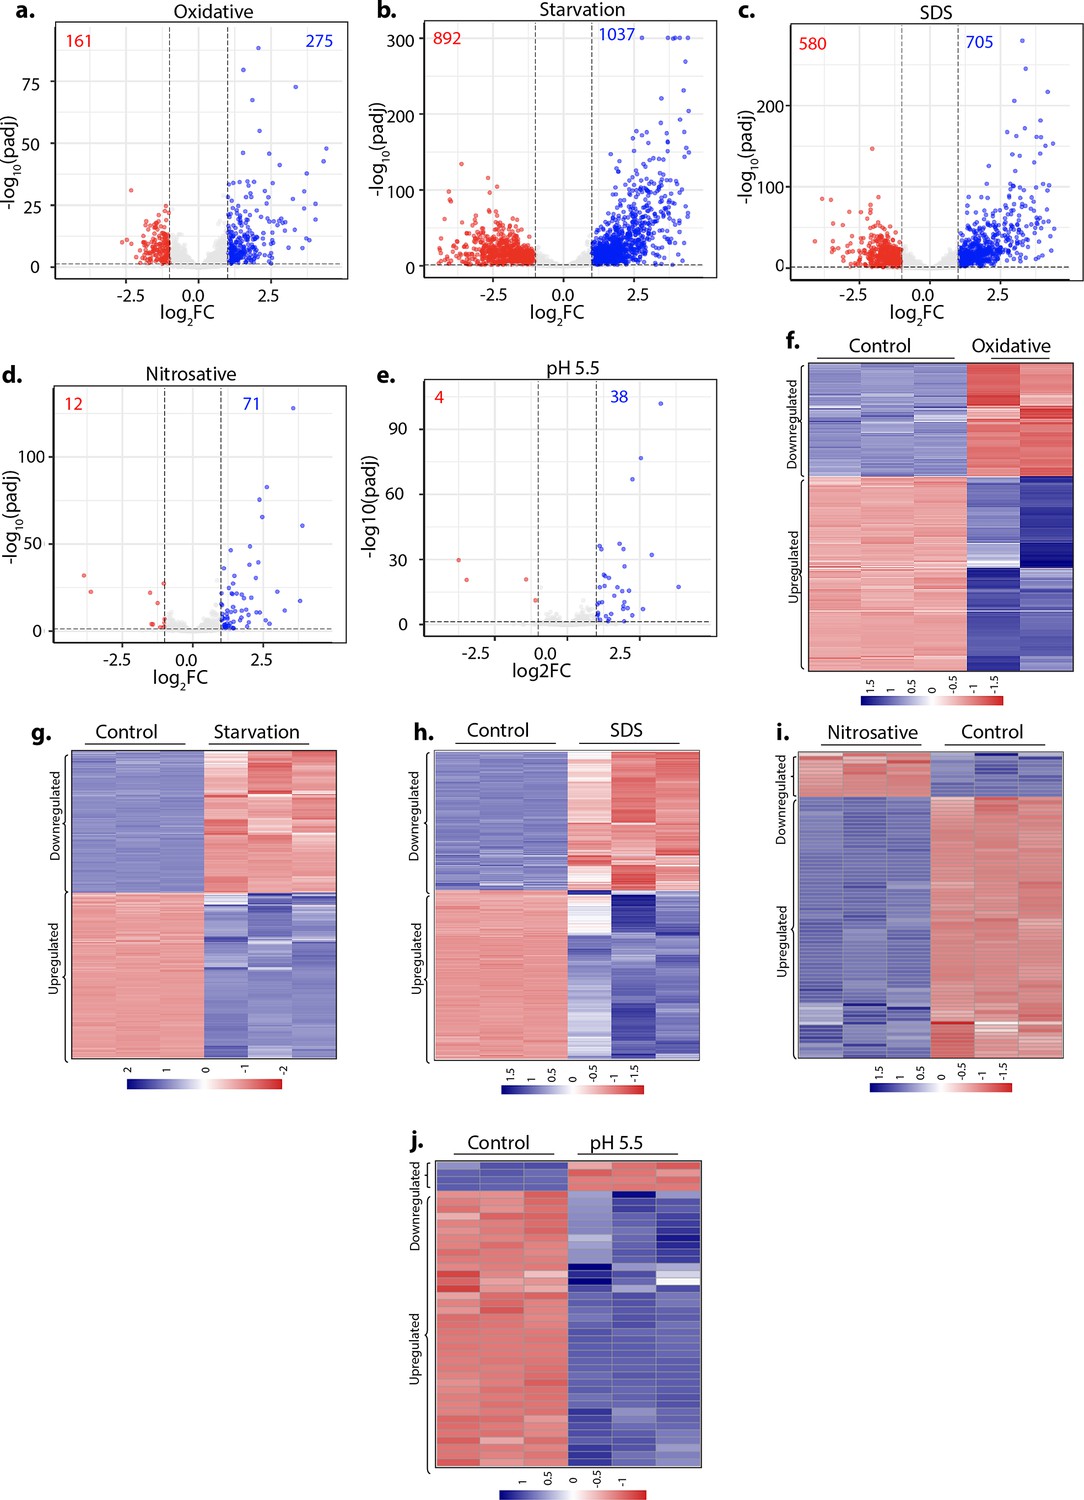
Sulfur assimilation and L-cysteine biosynthesis pathways are upregulated under stress conditions.
(a–e) Volcano plots illustrating significantly upregulated (blue) and downregulated (red) genes in Rv grown under indicated conditions with log2 Fold change >1 and padj value <0.05 compared to control (untreated) Rv. Numbers in the top quadrant depict the number of significantly upregulated (blue) and downregulated (red) genes in each condition compared to the control. (f–j) Heat maps depicting normalized gene count of differentially expressed genes (DEGs) in independent replicates of Rv grown under indicated conditions with log2 Fold change >1 and padj value <0.05. The colour intensity indicates relative upregulated (blue) and downregulated (red) genes compared to the control.
Figure 1—figure supplement 3
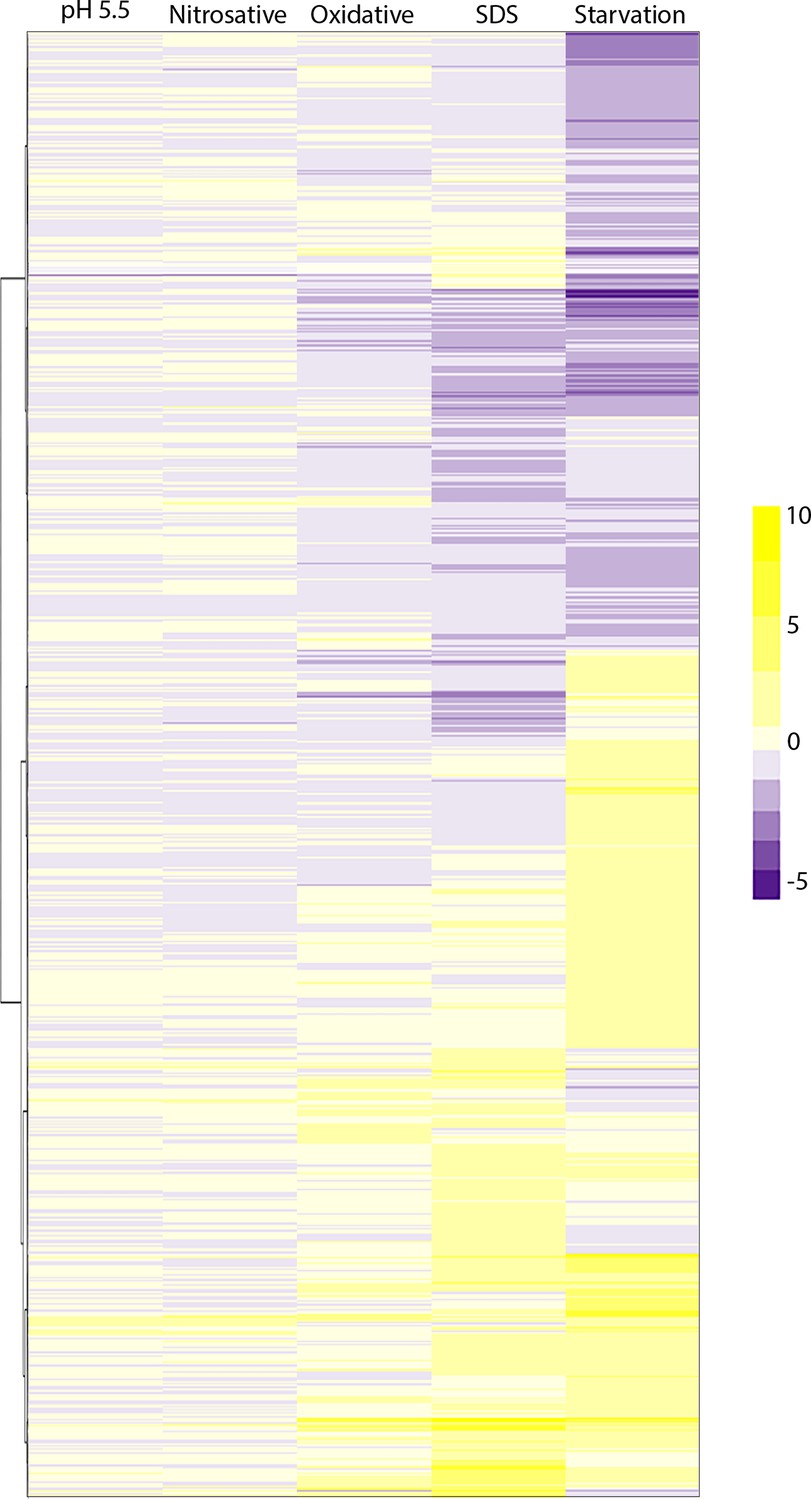
Genes that were differentially expressed in at least one of the five stresses.
We compiled a list of genes differentially expressed in at least one of the five stresses against compared untreated Rv. We made a data frame of fold changes for these selected genes in the five comparisons. We then generated a heat map where the five comparisons were plotted as columns (x-axis), and selected genes were plotted as rows (y-axis). Hierarchical clustering was performed on the y-axis so that genes with similar fold changes across comparisons clustered together.
Figure 1—figure supplement 4
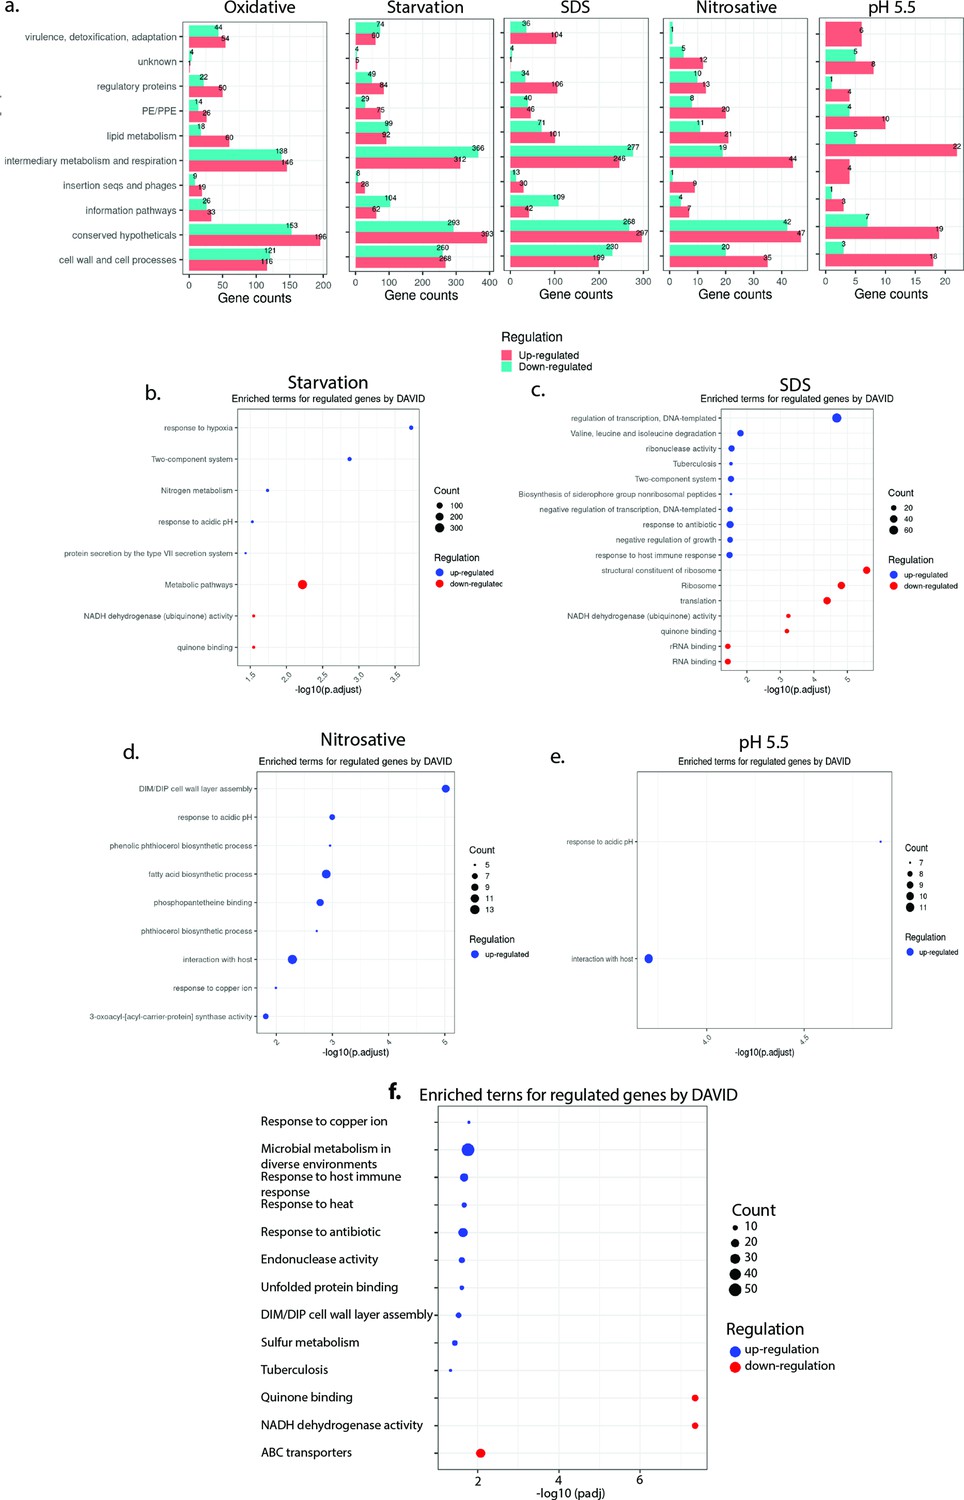
Genes belonging to the sulfur metabolism pathway are upregulated upon oxidative stress.
(a) Horizontal bar graph demonstrating the number of differentially expressed genes (DEGs) belonging to a particular functional category under indicated stress condition. Pathway enrichment by DAVID depicting significantly enriched Gene Ontology (GO) biological processes based on DEGs in starvation (b), sodium dodecyl sulfate (SDS) (c), nitrosative (d), and pH 5.5 (e). (f) Pathway enrichment by DAVID depicting significantly affected GO biological processes based on DEGs (log2 Fold change >0.5 and padj value <0.05).
Figure 1—figure supplement 5
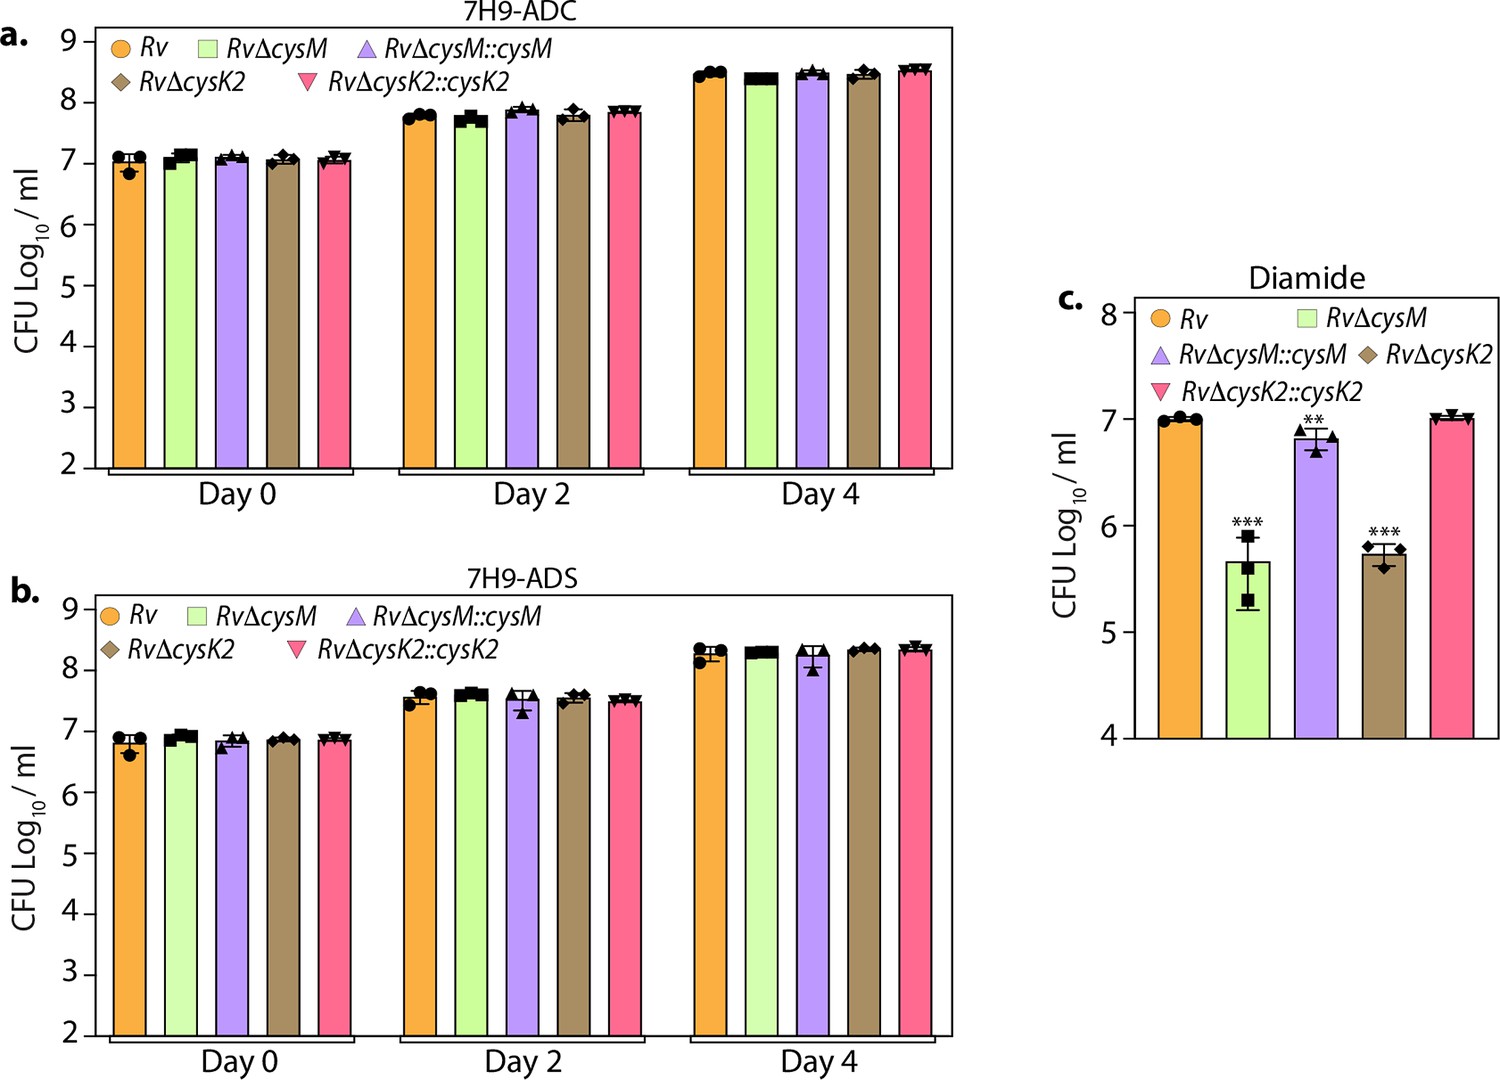
L-Cysteine synthases facilitate mycobacterial survival upon oxidative stresses in vitro.
Rv, RvΔcysM, RvΔcysK2, RvΔcysM::cysM, and RvΔcysK2::cysK2 strains were inoculated in 7H9-ADC (a), 7H9-ADS (b), 7H9-ADS plus 10 mM diamide (c) medium. Bar graphs represent the bacillary survival with data point indicating values CFU log10/ml ± standard deviation (SD) from individual replicate (n = 3). Statistical significance was drawn in comparison with Rv using one-way analysis of variance (ANOVA) followed by a post hoc test (Tukey test; GraphPad prism). **p < 0.005; ***p < 0.0005.
-
Figure 1—figure supplement 5—source data 1
Raw CFU/ml values for Figure 1—figure supplement 5a–c.
- https://cdn.elifesciences.org/articles/91970/elife-91970-fig1-figsupp5-data1-v1.xlsx
Figure 2 with 1 supplement
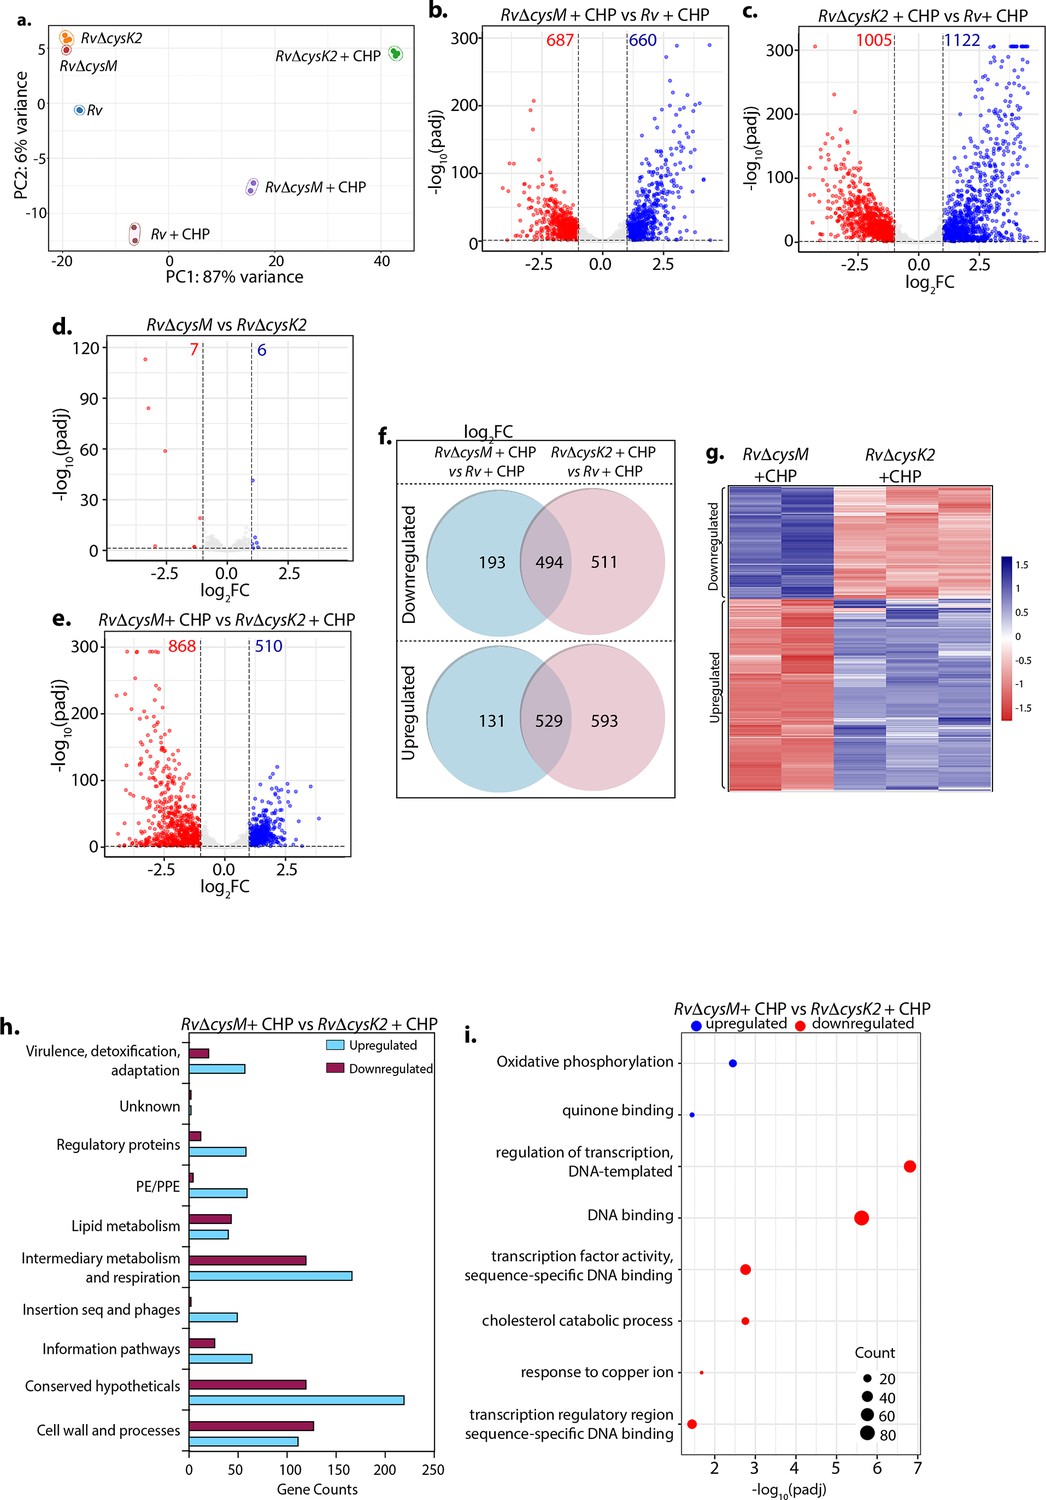
Distinct roles of CysM and CysK2 in attuning cellular processes.
(a) PCA plot demonstrating separation of various bacterial strains under different conditions. (b–e) Volcano plots illustrating significantly upregulated (blue) and downregulated (red) genes in indicated strains and conditions with absolute log2 Fold change >1 and padj value <0.05. Numbers in the top quadrant highlight the number of significantly upregulated (blue) and downregulated (red) genes in each condition. (f) Venn diagram showing the number of significantly down- and upregulated differentially expressed genes (DEGs) that overlap between indicated strains. (g) Heat maps depicting normalized gene count of DEGs in independent replicates of RvΔcysM and RvΔcysK2 grown under oxidative conditions with absolute log2 Fold change >1 and padj value <0.05. The colour intensity indicates relative upregulated (blue) and downregulated (red) genes compared to the control. (h) Horizontal bar graph depicting the number of DEGs belonging to a particular functional category upon oxidative stress in RvΔcysM compared to RvΔcysK2 under oxidative conditions. (i) Pathway enrichment by DAVID depicting significantly enriched Gene Ontology (GO) biological processes based on DEGs upon oxidative stress in RvΔcysM compared to RvΔcysK2 (absolute log2 Fold change >1 and padj <0.05).
Figure 2—figure supplement 1

Unique transcriptional signatures of CysM and CysK2.
(a, c) Volcano plots illustrating significantly upregulated (blue) and downregulated (red) genes in indicated strains and conditions with log2 Fold change >1 and padj value <0.05. Numbers in the top quadrant highlight the number of significantly upregulated (blue) and downregulated (red) genes in each condition. (b, d) Heat maps depicting normalized gene count of differentially expressed genes (DEGs) in independent replicates of RvΔcysM and RvΔcysK2 compared to Rv with log2 Fold change >1 and padj value <0.05. The colour intensity indicates relative upregulated (blue) and downregulated (red) genes compared to the control. (e) Venn diagram showing the number of significantly down- and upregulated DEGs that overlap between indicated strains (log2 Fold change >1 and padj value <0.05). Pathway enrichment by DAVID depicting significantly enriched Gene Ontology (GO) biological processes based on DEGs upon oxidative stress in RvΔcysM (f) and RvΔcysK2 (g) compared to Rv (log2 Fold change >1 and padj value <0.05).
Figure 3 with 1 supplement
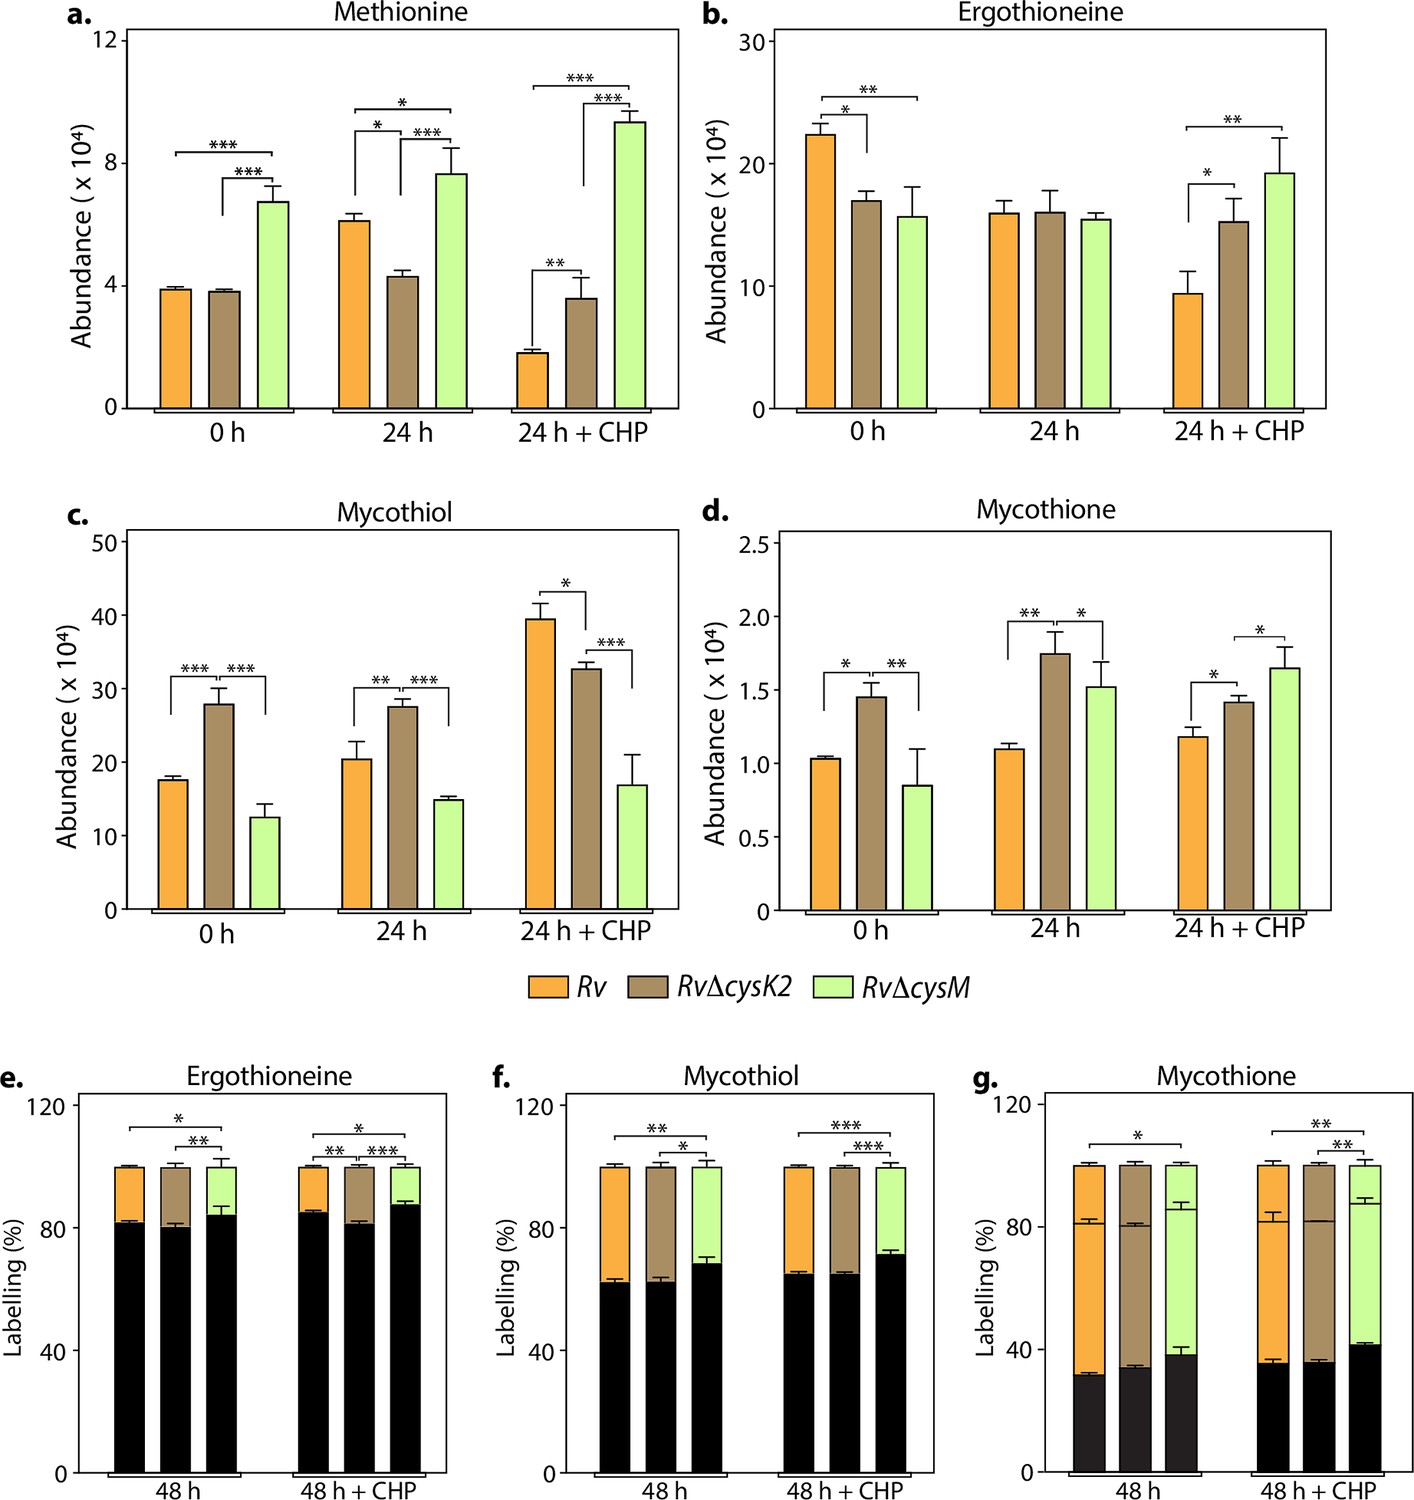
Key metabolites are differentially affected upon CysM and CysK2 deletion.
Total abundance (ion count/protein concentration) of L-methionine (a), ergothioneine (b), mycothiol (c), and mycothione (d) in Rv strains with or without 50 μM cumene hydroperoxide (CHP) treatment. The percentage of labelled (coloured) and unlabeled (black) ergothioneine (e), mycothiol (f), and mycothione (g) in Rv strains with or without 50 μM CHP treatment at 48 hr. Since mycothione (g) has two ionizable sulfur, the two-coloured stacked bar graphs represent percentage of labelled M+2 and M+4 ions. Percentage was calculated with respect to 0 hr abundance for each replicate. Bars depict the mean of biological replicates (n = 3), and error bars represent the standard deviation. The same samples were used for analysis (a–d) and (e–g). Statistical significance was calculated between Rv and RvΔcysM/ RvΔcysK2; and between RvΔcysM and RvΔcysK2 using non-parametric t-test. *p < 0.05; **p < 0.005; ***p < 0.0005.
-
Figure 3—source data 1
Raw data values for Figure 3.
- https://cdn.elifesciences.org/articles/91970/elife-91970-fig3-data1-v1.xlsx
Figure 3—figure supplement 1
Overview of metabolites tracked through 35S sulfur incorporation.
Figure 4
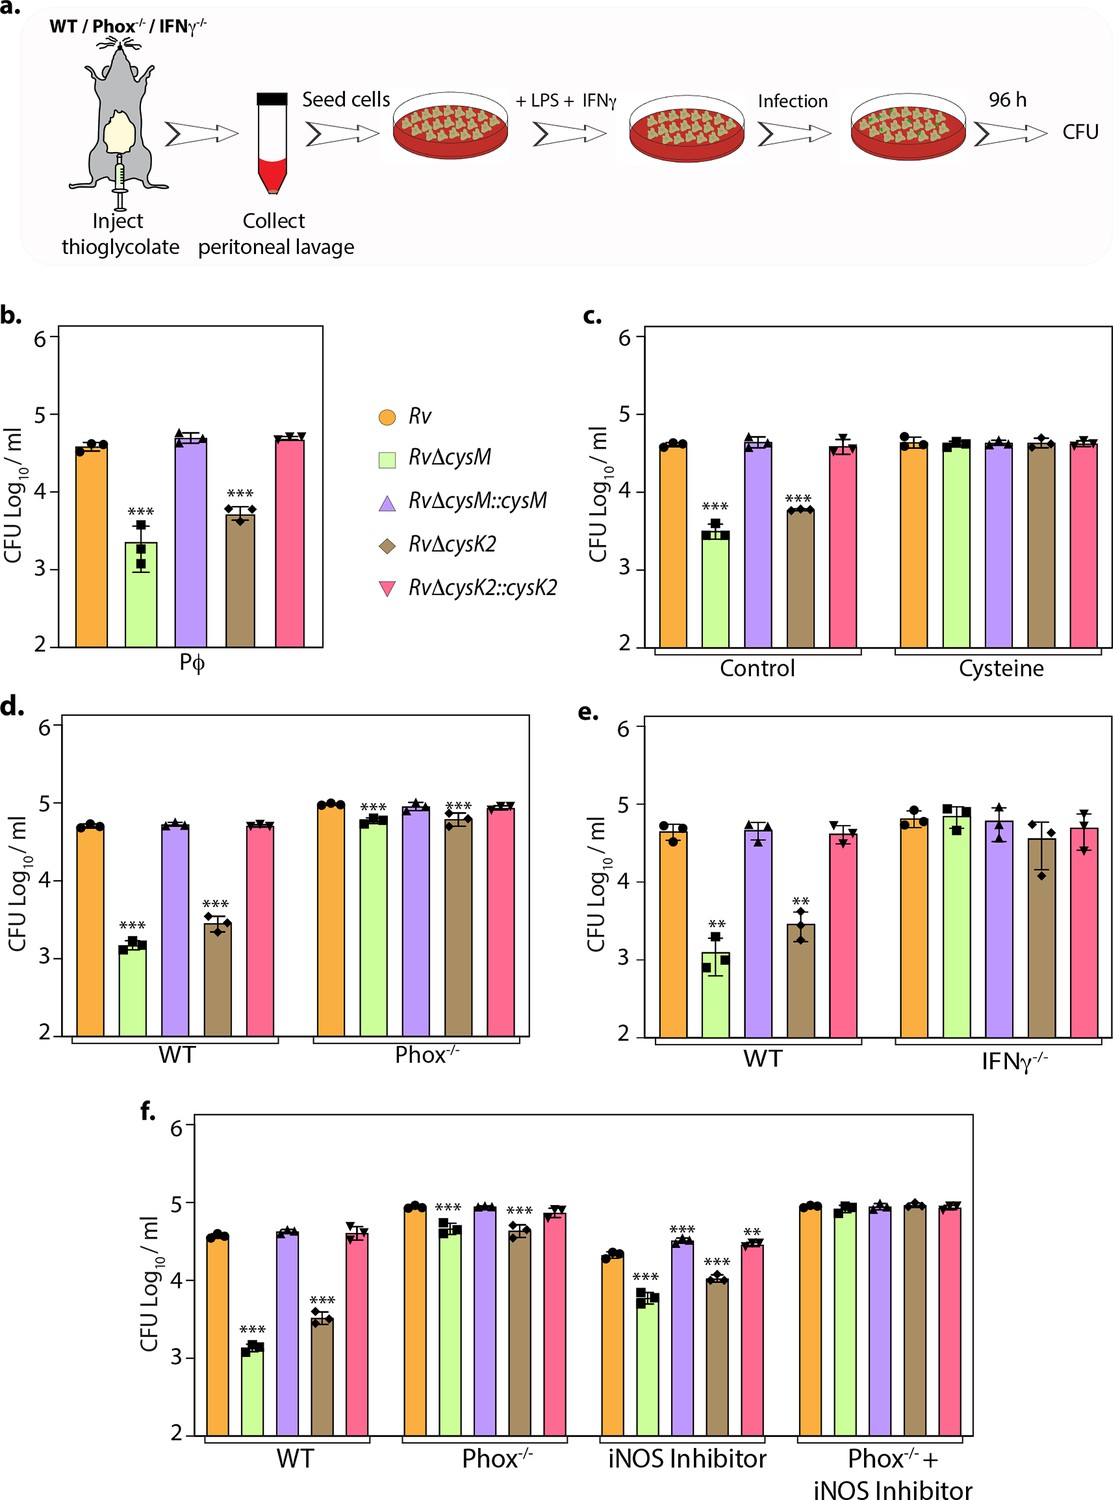
L-Cysteine synthases ameliorate mycobacterial survival in response to host-induced oxidative and nitrosative stress.
(a) Pictorial representation of peritoneal macrophage infection experiments. Thioglycolate was injected into the peritoneum cavity of C57BL/6, phox−/−, IFNγ−/− mice. Four days post-injection, peritoneal macrophages were extracted and activated by treatment with IFNγ (Interferon gamma) overnight and lipopolysaccharide (LPS) 2 hr prior to the infection. In specific cases, iNOS inhibitor 1400 W was added along with IFNγ/LPS. The intracellular bacillary survival was calculated 96 hr post-infection (p.i.). (b) Peritoneal macrophages from C57BL/6 mice were infected, and intracellular bacillary survival was enumerated 96 hr p.i. (c) Peritoneal macrophages from C57BL/6 mice were infected, left untreated (control) or treated with 0.2 mM L-cysteine at the time of infection and intracellular bacillary survival was assessed 96 h p.i. (d–f) Peritoneal macrophages isolated from mice of indicated genotypes were either left untreated or treated with iNOS inhibitor, 1400 W. Intracellular bacillary survival was enumerated 96 h p.i. (b–f) Data points are presented as CFU log10/ml ± standard deviation (SD) of each replicate (n = 3). Statistical significance was drawn in comparison with Rv using one-way analysis of variance (ANOVA) followed by a post hoc test (Tukey test; GraphPad prism). **p < 0.005; ***p < 0.0005.
-
Figure 4—source data 1
CFU/ml values for Figure 4.
- https://cdn.elifesciences.org/articles/91970/elife-91970-fig4-data1-v1.xlsx
Figure 5
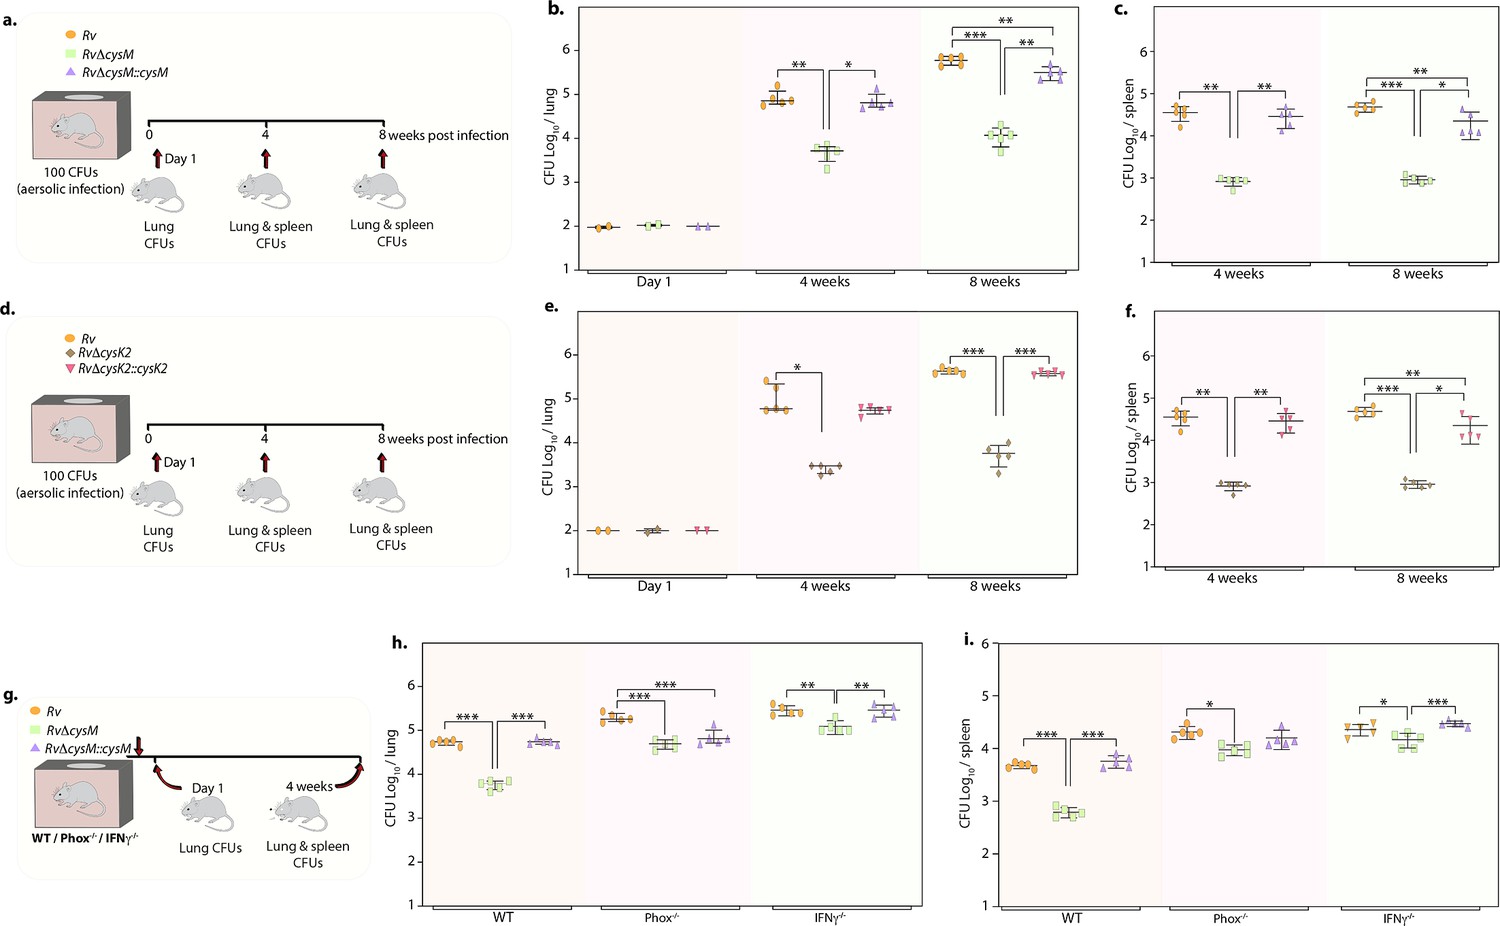
Deletion of non-canonical L-cysteine synthases attenuates mycobacterial survival in murine lungs and spleen.
(a) Schematic outline of murine infection experiment. C57BL/6 (n = 12 per group) were infected with Rv, RvΔcysM, or RvΔcysM::cysM strains via an aerosol route. Colony-forming unit (CFU) was enumerated at day 1 (n = 2), week 4 (n = 5), and week 8 (n = 5). Each data point represents log10 CFU in lung (b) and spleen (c) of an infected animal, and the error bar indicates the median with interquartile range for each group. (d) Schematic outline of murine infection experiment. C57BL/6 (n = 12 per group) were infected with Rv, RvΔcysK2, or RvΔcysK2::cysK2 strains via an aerosol route. CFU was enumerated at day 1 (n = 2), week 4 (n = 5), and week 8 (n = 5). Each data point represents log10 CFU in the lung (e) and spleen (f) of an infected animal, and the error bar indicates the median with interquartile range for each group. (g) Schematic outline of murine infection experiment. C57BL/6 (n = 7 per group), phox−/− (n = 7 per group), and IFNγ−/− (n = 7 per group) were infected with Rv, RvΔcysM, or RvΔcysM::cysM strains via an aerosol route. CFU was enumerated at day 1 (n = 2) and week 4 (n = 5). Each data point represents log10 CFU in the lung (h) and spleen (i) of an infected animal, and the error bar indicates the median with interquartile range for each group. (a–i) Statistical significance was drawn in comparison with Rv using one-way analysis of variance (ANOVA) followed by a post hoc test (Tukey test; GraphPad prism). *p<0.05, **p<0.005, ***p < 0.0005.
-
Figure 5—source data 1
CFU/ml values for Figure 5.
- https://cdn.elifesciences.org/articles/91970/elife-91970-fig5-data1-v1.xlsx
Figure 6
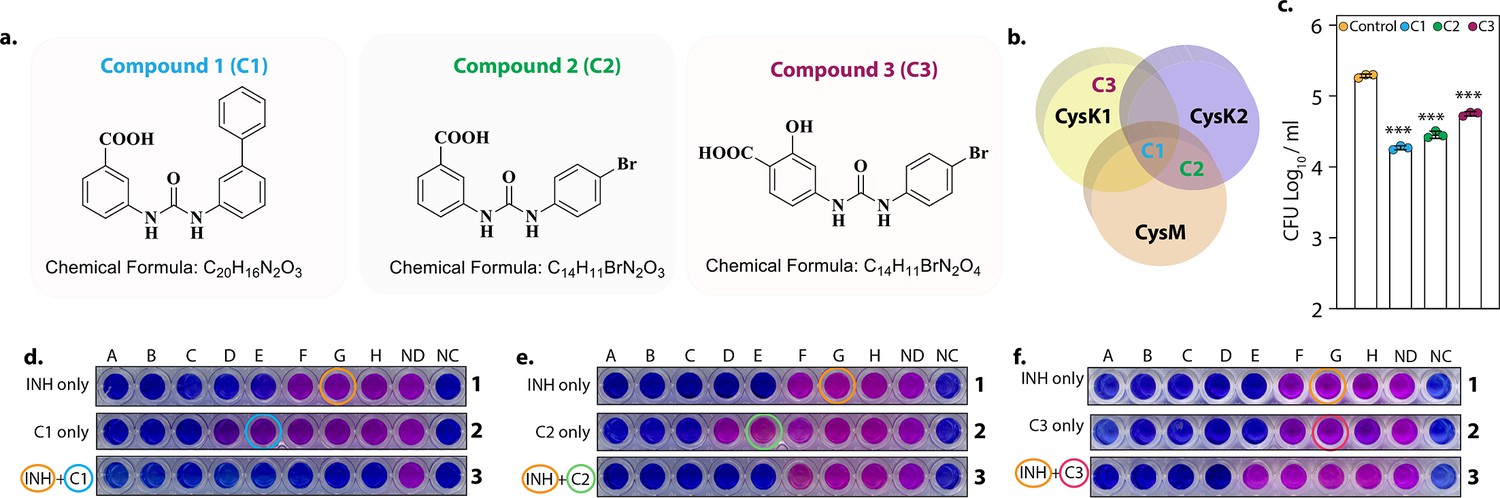
L-Cysteine synthases inhibitors can effectively kill Mtb within the host.
Chemical structure and formula of lead compounds. (b). Venn diagram illustrating the specificity of compounds on mycobacterial L-cysteine synthases. (c). Peritoneal macrophages were infected with Rv. Four hours post-infection, cells were either left untreated (control) or 5 mg/ml C1 (a), C2 (b), or C3 (c) was added to the infected cells. Bar graphs represent mean log10 CFU/ml ± standard deviation (SD), and values from independent replicates are represented by individual data points (n = 3). Alamar blue assay is used to determine MIC values of C1 (d), C2 (e), and C3 (f) with and without Isoniazid in Rv. Starting concentration of INH in 1A is 0.96 μg/ml, 1B – 0.43 μg/ml and each subsequent column twofold dilution. Concentration of C1, C2, and C3 were 2.4 mg/ml in 2A and 1.2 mg/ml in 2B and in each subsequent column twofold dilution. The concentration of INH + C1 or C2 in 3 A was 0.015 μg/ml + 0.15 mg/ml, and 3B was 0.0075 μg/ml + 0.075 mg/ml. and each subsequent column twofold dilution. The concentration of INH + C3 in 3A was.015 μg/ml + 37 μg/ml, and 3B was 0.0075 μg/ml + 18.5 and each subsequent column twofold dilution. ND – no drug and NC – no culture. ***p<0.0005.
-
Figure 6—source data 1
CFU/ml values for Figure 6c.
- https://cdn.elifesciences.org/articles/91970/elife-91970-fig6-data1-v1.xlsx
-
Figure 6—source data 2
Unedited and labelled image for Figure 6d–f.
- https://cdn.elifesciences.org/articles/91970/elife-91970-fig6-data2-v1.pdf
-
Figure 6—source data 3
Raw unedited for Figure 6d–f.
- https://cdn.elifesciences.org/articles/91970/elife-91970-fig6-data3-v1.pdf
Author response image 1
Tables
Key resources table
| Reagent type (species) or resource | Designation | Source or reference | Identifiers | Additional information |
|---|---|---|---|---|
| Gene (Mycobacterium tuberculosis) | CysM | Mycobrowser | CysM (Uniprot ID P9WP53) | |
| Gene (Mycobacterium tuberculosis) | CysK1 | Mycobrowser | CysK1 (Uniprot ID P9WP55) | |
| Gene (Mycobacterium tuberculosis) | CysK2 | Mycobrowser | CysK2(Uniprot ID Q79FV4) | |
| Strain, strain background (Mycobacterium tuberculosis) | H37Rv | ATCC | ||
| Strain, strain background (Mycobacterium tuberculosis) | RvDcysM | https://doi.org/10.15252/embj.2020106111 | ||
| Strain, strain background (Mycobacterium tuberculosis) | RvDcysK2 | This paper | ||
| Chemical compound, drug | C1 | Brunner et al., 2017. | ||
| Chemical compound, drug | C2 | Brunner et al., 2017 | ||
| Chemical compound, drug | C3 | Brunner et al., 2017 | ||
| Chemical compound, drug | Cumene hydroperoxide | Sigma Millipore | Cat no.: 247502 | |
| Chemical compound, drug | Isoniazid | Sigma Millipore | Cat no. I3377 |
Additional files
-
Supplementary file 1
Differentially expressed genes (DEGs) analysis Rv under stress vs. Rv.
- https://cdn.elifesciences.org/articles/91970/elife-91970-supp1-v1.xls
-
Supplementary file 2
We compiled a list of differentially expressed genes in at least one of the five comparisons against control.
- https://cdn.elifesciences.org/articles/91970/elife-91970-supp2-v1.xls
-
Supplementary file 3
Pathway enrichment analysis of differentially expressed genes (DEGs) from Supplementary file 1.
- https://cdn.elifesciences.org/articles/91970/elife-91970-supp3-v1.xls
-
Supplementary file 4
Differentially expressed gene (DEG) analysis of RvΔcysM or RvΔcysK2 vs. Rv with or without cumene hydroperoxide (CHP) stress and DEG analysis RvΔcysM + CHP vs. RvΔcysK2 + CHP.
- https://cdn.elifesciences.org/articles/91970/elife-91970-supp4-v1.xls
-
Supplementary file 5
Pathway enrichment analysis of differentially expressed genes (DEGs) from Supplementary file 3.
- https://cdn.elifesciences.org/articles/91970/elife-91970-supp5-v1.xls
-
MDAR checklist
- https://cdn.elifesciences.org/articles/91970/elife-91970-mdarchecklist1-v1.docx
Download links
A two-part list of links to download the article, or parts of the article, in various formats.
Downloads (link to download the article as PDF)
Open citations (links to open the citations from this article in various online reference manager services)
Cite this article (links to download the citations from this article in formats compatible with various reference manager tools)
Divergent downstream biosynthetic pathways are supported by L-cysteine synthases of Mycobacterium tuberculosis
eLife 12:RP91970.
https://doi.org/10.7554/eLife.91970.3


