Expansion-assisted selective plane illumination microscopy for nanoscale imaging of centimeter-scale tissues
- Allen Institute for Neural Dynamics, United States
- Chan Zuckerberg Initiative, United States
- Allen Institute for Brain Science, United States
- University of Washington, United States
Figures
Figure 1 with 1 supplement
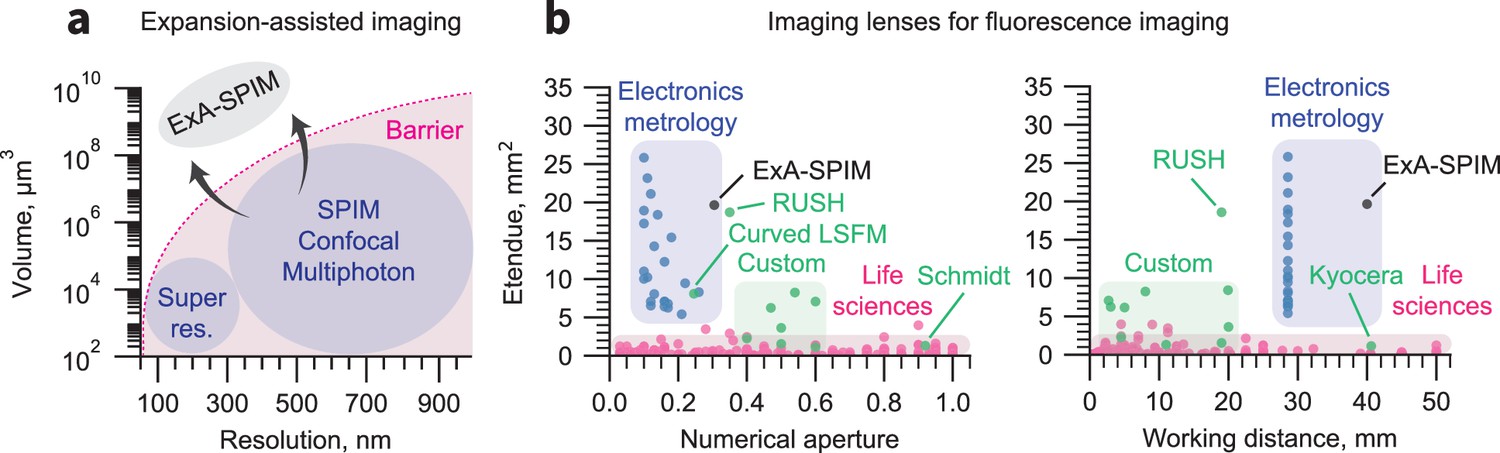
Breaking the volumetric imaging barrier.
(a) Current fluorescence microscopy approaches are bounded by a volumetric imaging barrier (thick pink line; inspired by Daetwyler and Fiolka, 2023). Resolution is limited by the diffraction limit. The accessible imaging volume is limited by specifications of life sciences microscope objectives. The former can be surpassed by using tissue expansion, and the latter can be overcome by using highly engineered lenses from the electronics metrology industry. (b) The etendue (G) of 90% of life sciences objectives (magenta) is <1 mm2(Zhang and Gross, 2019a), apart from several custom lenses (green). In contrast, lenses developed for electronics metrology can have G>10 mm2. The lens used in the ExA-SPIM system provides a field of view of 16.8 mm2 with NA = 0.305 (G=19.65 mm2). This etendue is comparable to the custom RUSH objective (Fan et al., 2019), but with twice the working distance and correction for liquid media. The RUSH, Schmidt (Voigt et al., 2024), Kyocera (https://www.ksoc.co.jp/en/seihin/immersion-objective/immersion-objective.html), and large etendue curved focal plane (Tang et al., 2024) lenses that lie outside of their colored zone are highlighted.
Figure 1—figure supplement 1

A continuum of NA and expansion factor combinations can achieve a desired effective resolution.
Light collection efficiency (which decreases quadratically with NA) and required working distance (which increases linearly with expansion factor) should be considered when deciding on exact parameters to use for expansion-assisted imaging.
Figure 2 with 10 supplements

Microscope overview.
(a) Schematic of the ExA-SPIM system. Light enters the system from the laser combiner and is reflected by mirror M1. A cylindrical lens focuses the light in one dimension onto the surface of a tunable lens, which is magnified onto the back focal plane of the excitation through a 1.5×relay consisting of lenses L1 and L2 and mirrors M2 and M3. The excitation objective is oriented vertically and dipped into a liquid immersion chamber. The tunable lens is conjugated to the back focal plane of the excitation objective to enable axial sweeping. A pair of galvo mirrors is used in tandem to translate the position of the light sheet in z (along the optical axis of the detection objective). The detection objective is oriented horizontally. A beam splitter is removed from the lens and replaced with approximately 35 mm of water. A large-format CMOS camera captures images from the detection lens, at a back focusing distance of 50 cm. (b) The field of view of the system is 10.6×8.0 mm (13.3 mm diagonal), which is digitized by the camera into a 151-megapixel (MP) image with 0.75 µm/px sampling. Although the optical resolution of the detection lens is ~1.0 µm, the sampling limited resolution based on the Nyquist criterion is ~1.5 µm. The large field of view dramatically reduces the need for tiling. For example, a 3× expanded mouse brain can be captured in only 15 tiles. Representative images of a three expanded mouse brain are shown with a 1 cm scale bar. (c) The PSF for 561 nm excitation is shown in the xy, xz, and yz planes. The mean and standard deviation of the lateral and axial full-width half-maximum are shown as a function of x and y position across the full field of view. (d) The field curvature and distortion of the system as a function of field position is shown for different wavebands. The field curvature is <2.5× the depth of field (DoF) for all wavebands. This performance is better than ‘Plan’ specified life sciences objectives (Zhang and Gross, 2019a). (e) The relative signal-to-noise ratio (rSNR) of the VP-151MXCMOS camera and an Orca Flash V3 sCMOS camera as a function of imaging speed. The VP-151MX camera provides equivalent SNR at nearly twice the imaging speed.
Figure 2—figure supplement 1
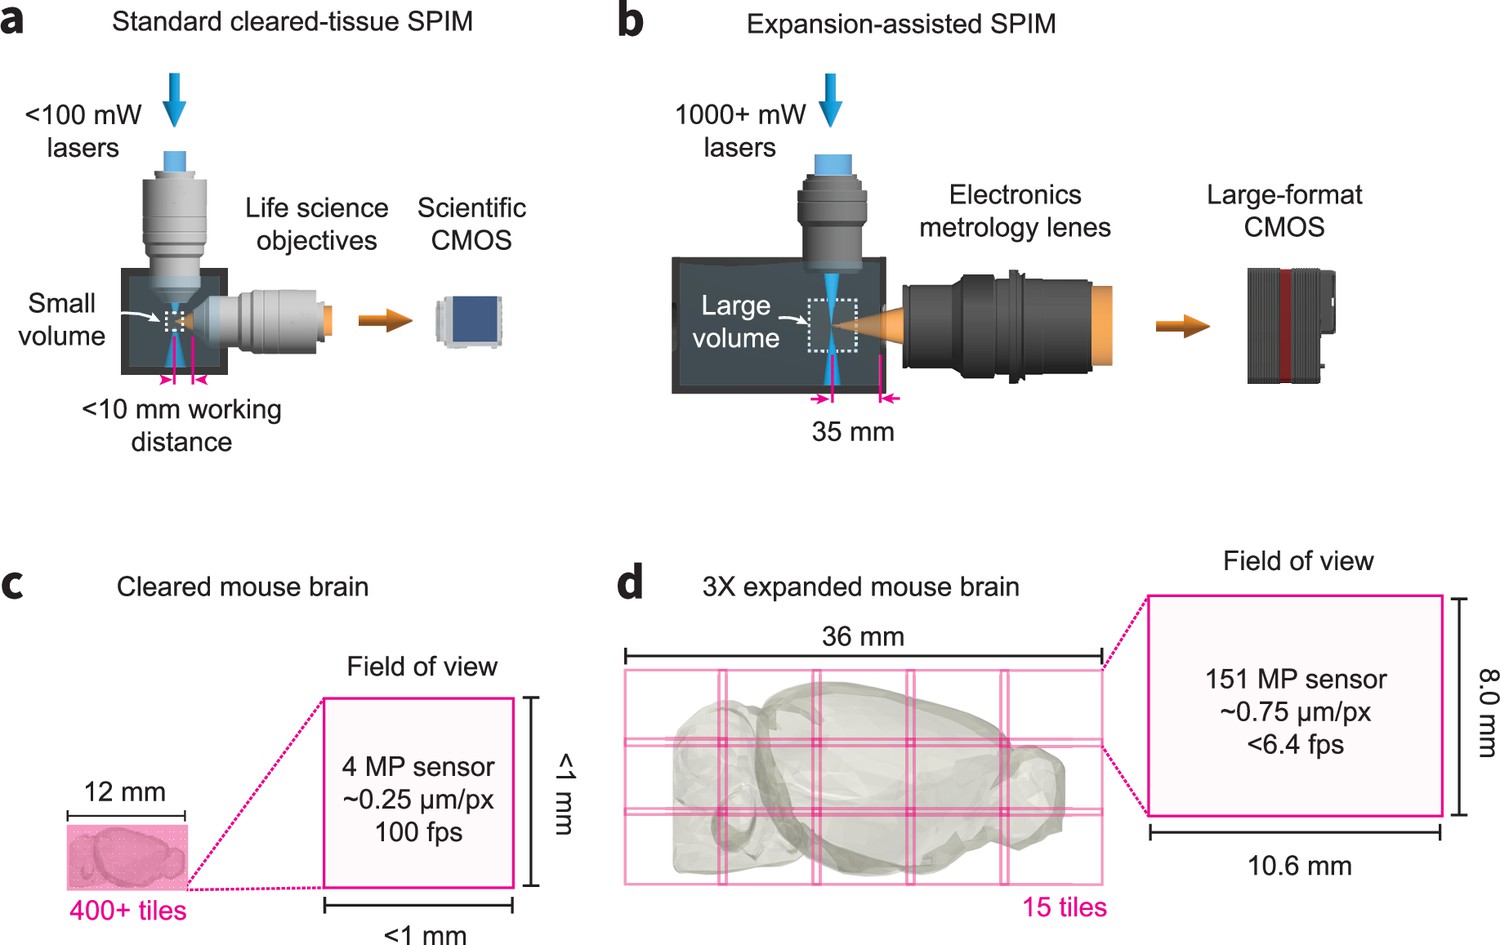
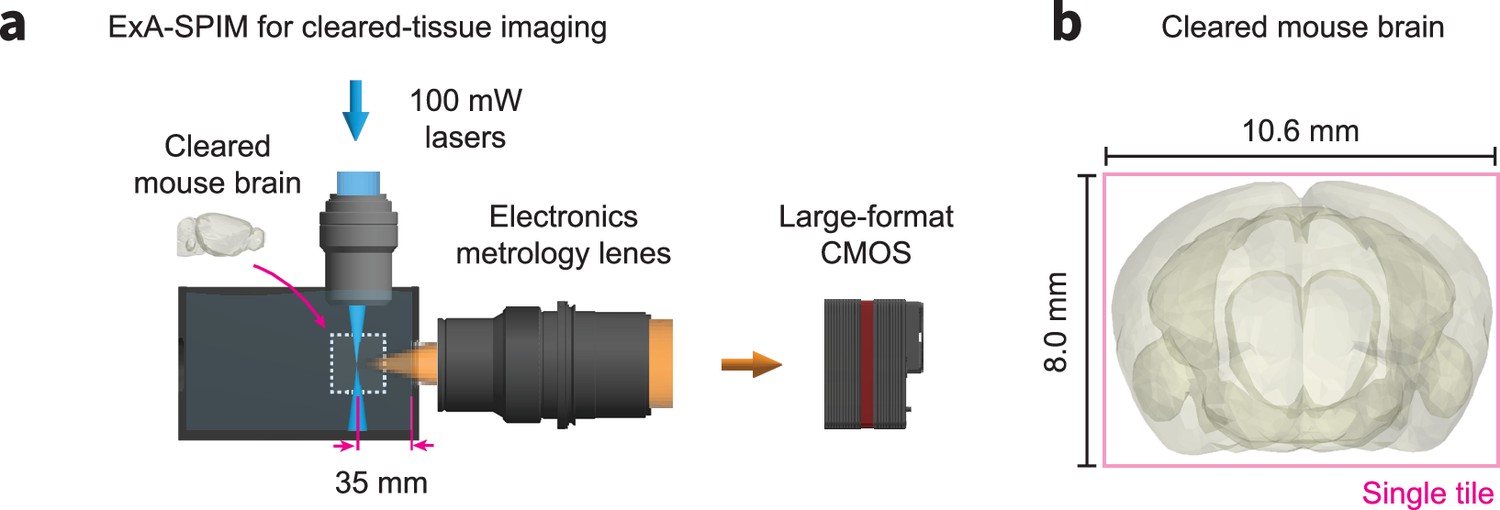
Comparison of traditional cleared tissue SPIM and ExA-SPIM imaging of a mouse brain at equivalent resolutions.
(a–c) A traditional cleared-tissue SPIM system uses standard 100 mW or less lasers, a scientific CMOS camera, and life sciences objectives with higher NA and <10 mm working distance. In theory, these systems can image an entire cleared mouse brain at 500 nm or less resolution without any physical cutting. However, this would require 400+ individual image tiles and high camera framerates, which is problematic for techniques such as axial sweeping. (bd) By comparison, the ExA-SPIM system uses 1000+ mW lasers, a large-format CMOS camera, and electronics metrology lenses with a moderate NA and ~35 mm working distance. After expanding a mouse brain 3×, the system is still capable of imaging the entire brain in only 15 tiles.
Figure 2—figure supplement 2
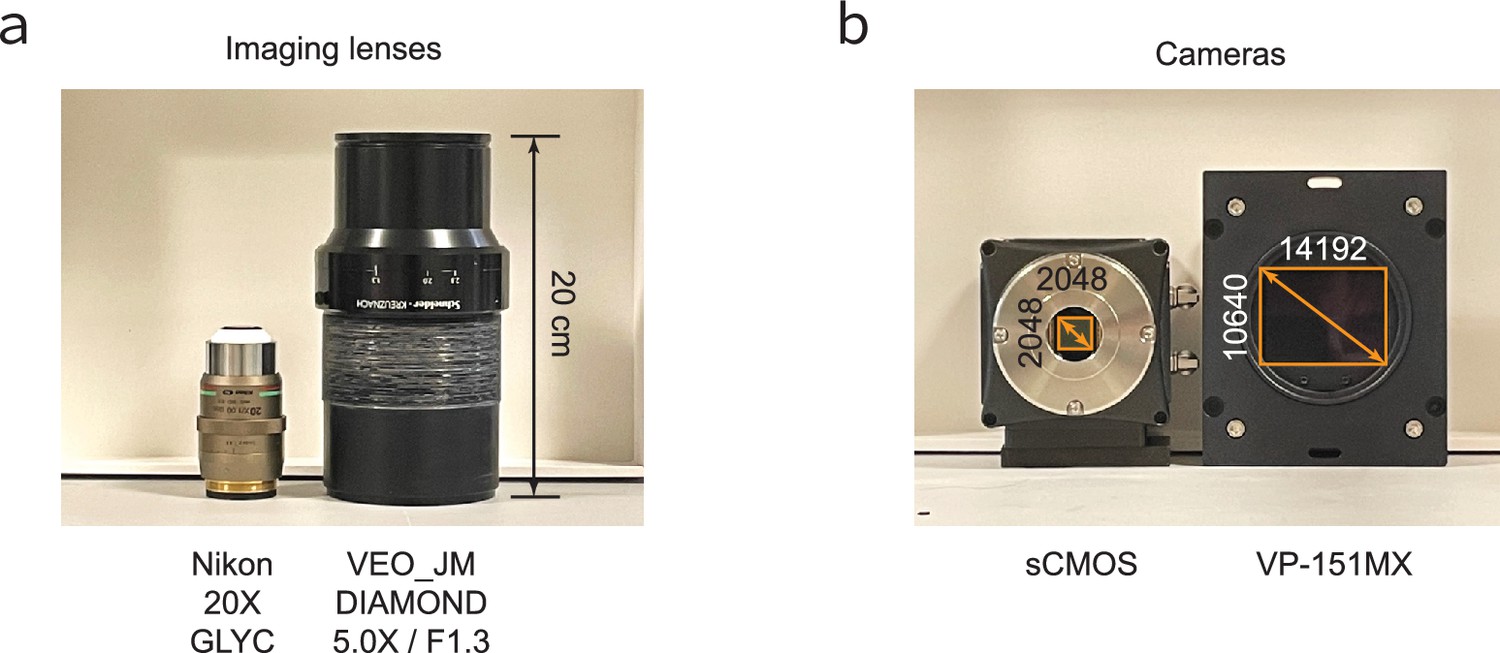
Comparison of traditional scientific and electronics metrology technologies.
(a) Nikon 20× GLYC next to the VEO_JM DIAMOND 5.0× / F1.3 lens. (b) Traditional sCMOS camera with 2048×2048 pixels next to the VP-151MX camera with the Sony IMX411 sensor with 14192×10,640 pixels.
Figure 2—figure supplement 3
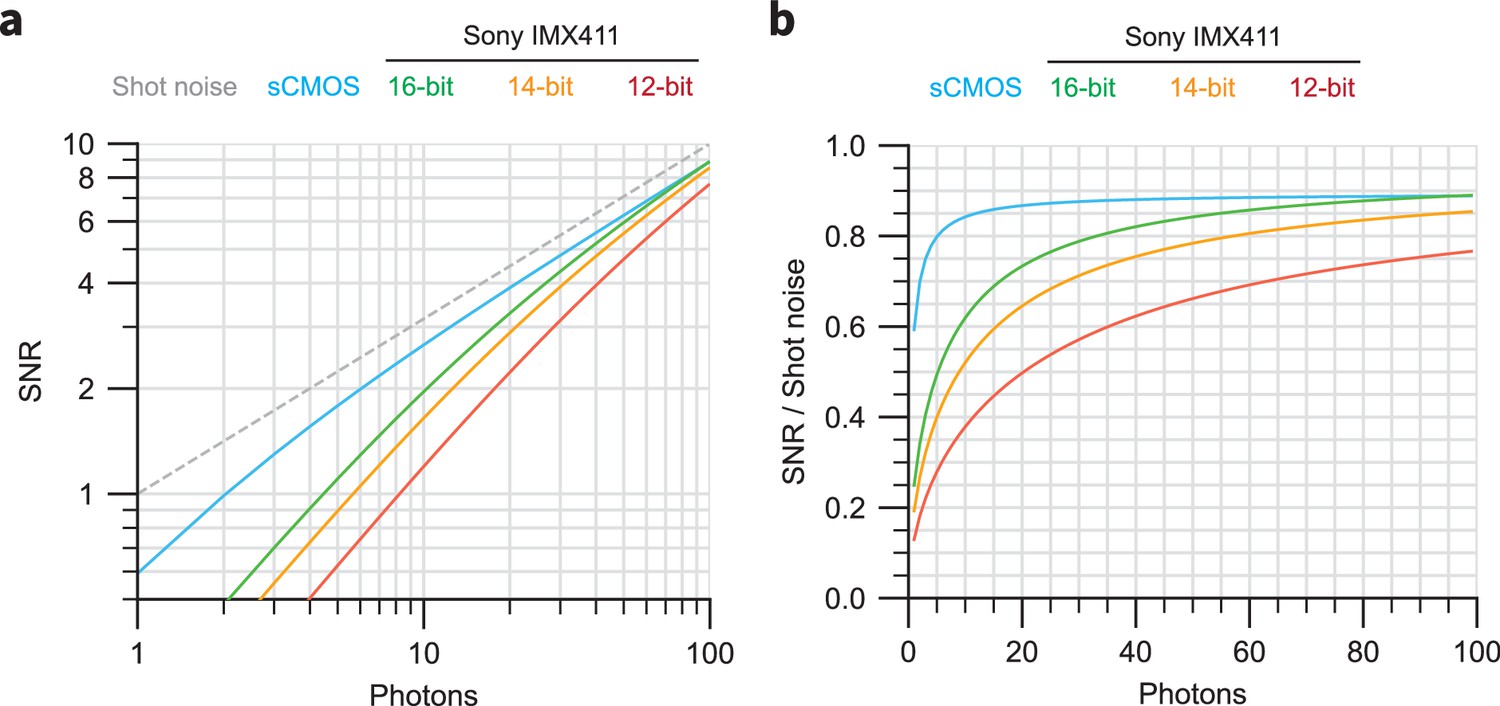
Theoretical noise characteristics of sCMOS and Sony IMX411 sensors.
(a) Simulations of SNR versus collected photons for sCMOS (cyan) and the Sony IMX411 sensor with 16-bit (green), 14-bit (yellow), and 12-bit (red) readout. The SNR for an ideal perfect sensor is highlighted. (b) Relative SNR values for the curves shown in (a), normalized to the ideal sensor curve.
Figure 2—figure supplement 4
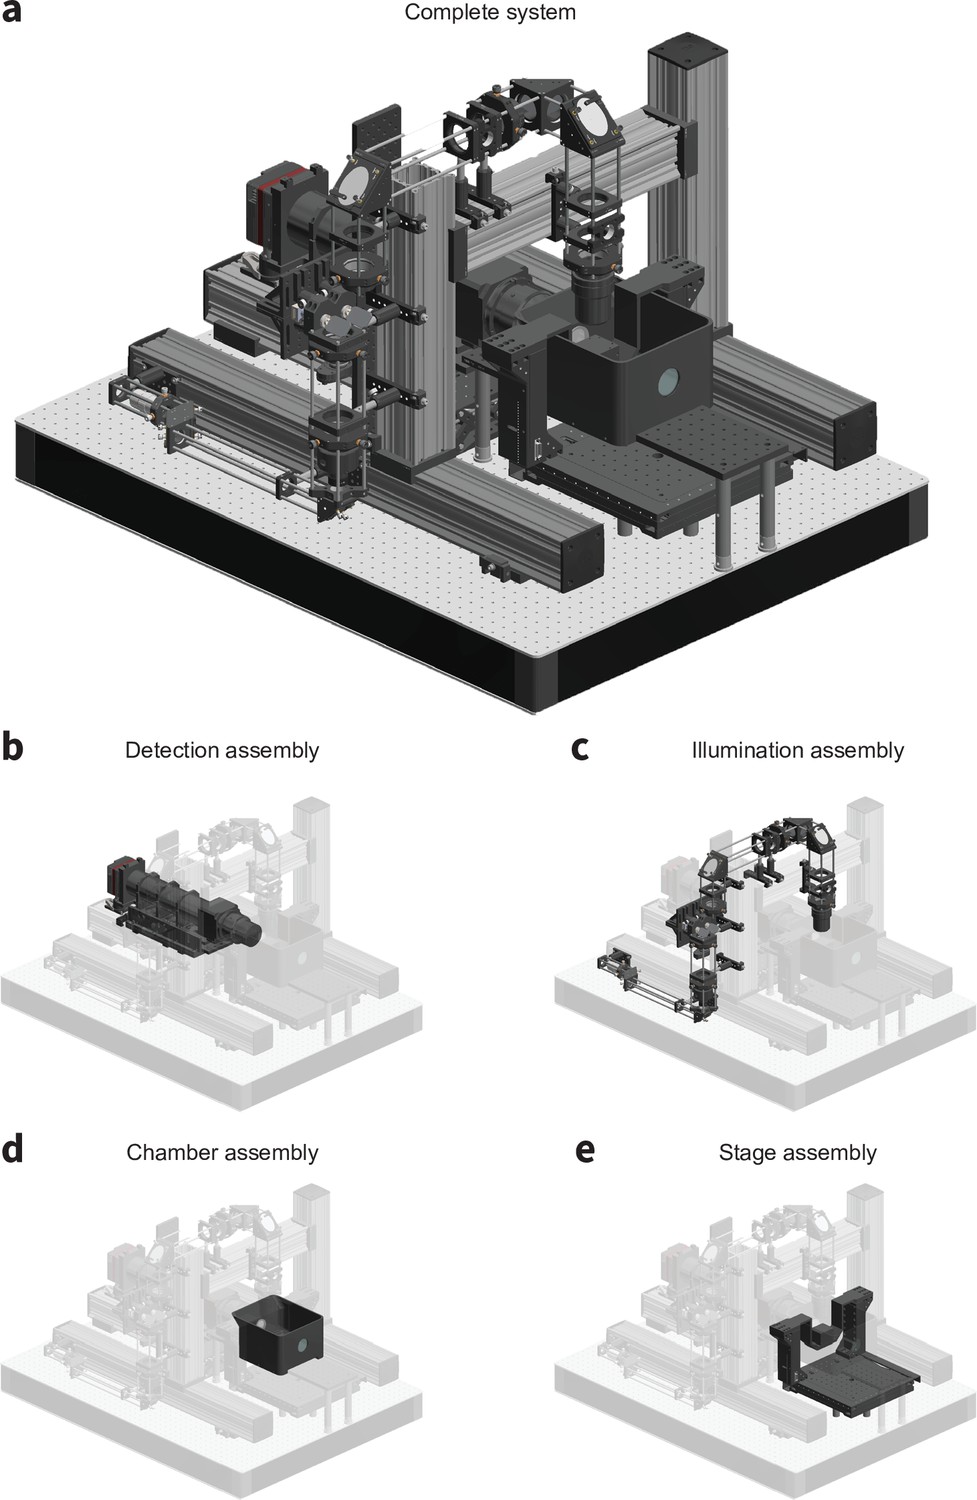
CAD renderings of the microscope detailing (a) the complete system, (b) the detection assembly, (c) the illumination assembly, (d) the chamber assembly, and (e) the stage assembly.
Figure 2—figure supplement 5
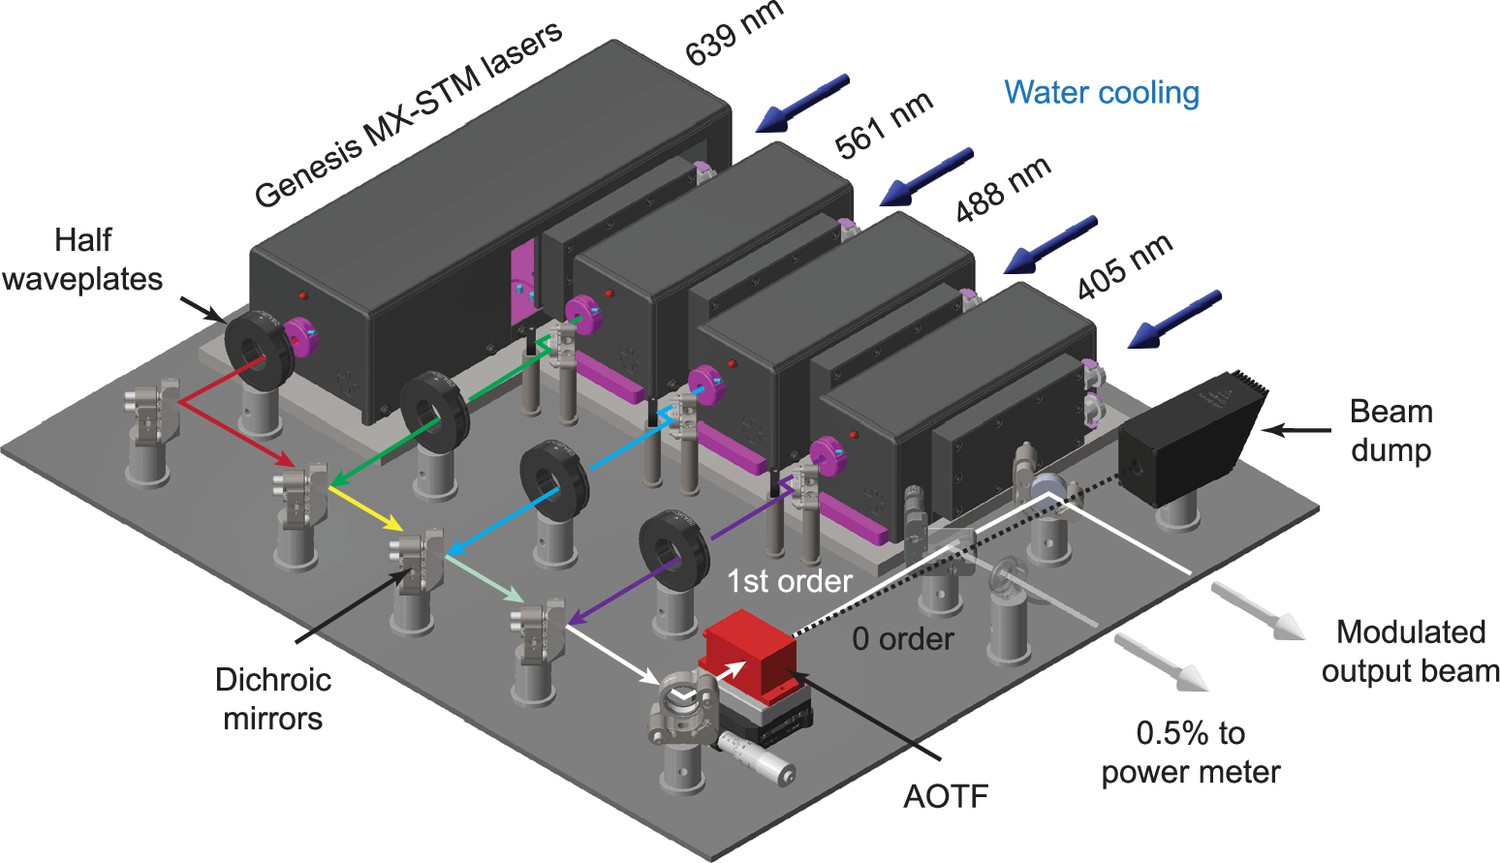
The system uses three 1000 mW lasers at 488, 561, and 639 nm (Genesis MX-STM series, Coherent) with an optional 405 nm laser.
The beam from each laser (~1 mm in diameter) first passes through a half waveplate for polarization rotation. The beams are all then combined using a series of dichroic mirrors mounted in kinematic mounts. An acousto-optic tunable filter (AOTF) is used to both select wavelength and modulate the power of each laser. The 0-order beam from the AOTF terminates in a beam dump, whereas the modulated 1st order beam is reflected off a final kinematic mirror before being injected into the microscope. An AR-coated glass plate is used to reflect ~0.5% of the output beam to a power meter for monitoring during dataset acquisition.
Figure 2—figure supplement 6

The same region in an expanded mouse brain sample was irradiated repeatedly to measure photobleaching at the excitation powers used by the ExA-SPIM.
Decay curves for a soma (blue) were measured over 2000 repeated exposures. Because the higher excitation power of the ExA-SPIM is distributed over an 11 mm wide light sheet, the light intensity is similar to typical standard SPIM (105–106 mW/cm2). Only modest photobleaching was observed, with ~50% reduction in intensity after ~800 exposures.
Figure 2—figure supplement 7
ExA-SPIM imaging of cleared mouse brains.
(a) Although we have focused on imaging expanded tissues, the ExA-SPIM microscope does not require expansion. The chamber can be filled with any refractive index matching media, and the liquid working distance of the electronics metrology lens can be adjusted slightly to recover diffraction-limited imaging performance. (b) As an example, an entire cleared mouse brain could be imaged coronally in a single tile.
Figure 2—figure supplement 8

Summary plot comparing the resolution, isotropy, and imaging speed of various existing large volume microscopy methods (2p and SPIM).
Methods that do or do not use sectioning are highlighted. The aspect ratio of each marker indicates the relative isotropy of the method. Note that expansion lattice light-sheet microscopy (ExLLSM; Gao et al., 2023) is capable of a very small effective focal volume but over very limited volumes (« 1 mm3) and is shown in a dedicated inset. The Benchtop mesoSPIM system (Vladimirov et al., 2024), which sits outside of the other SPIM systems, is highlighted.
Figure 2—figure supplement 9
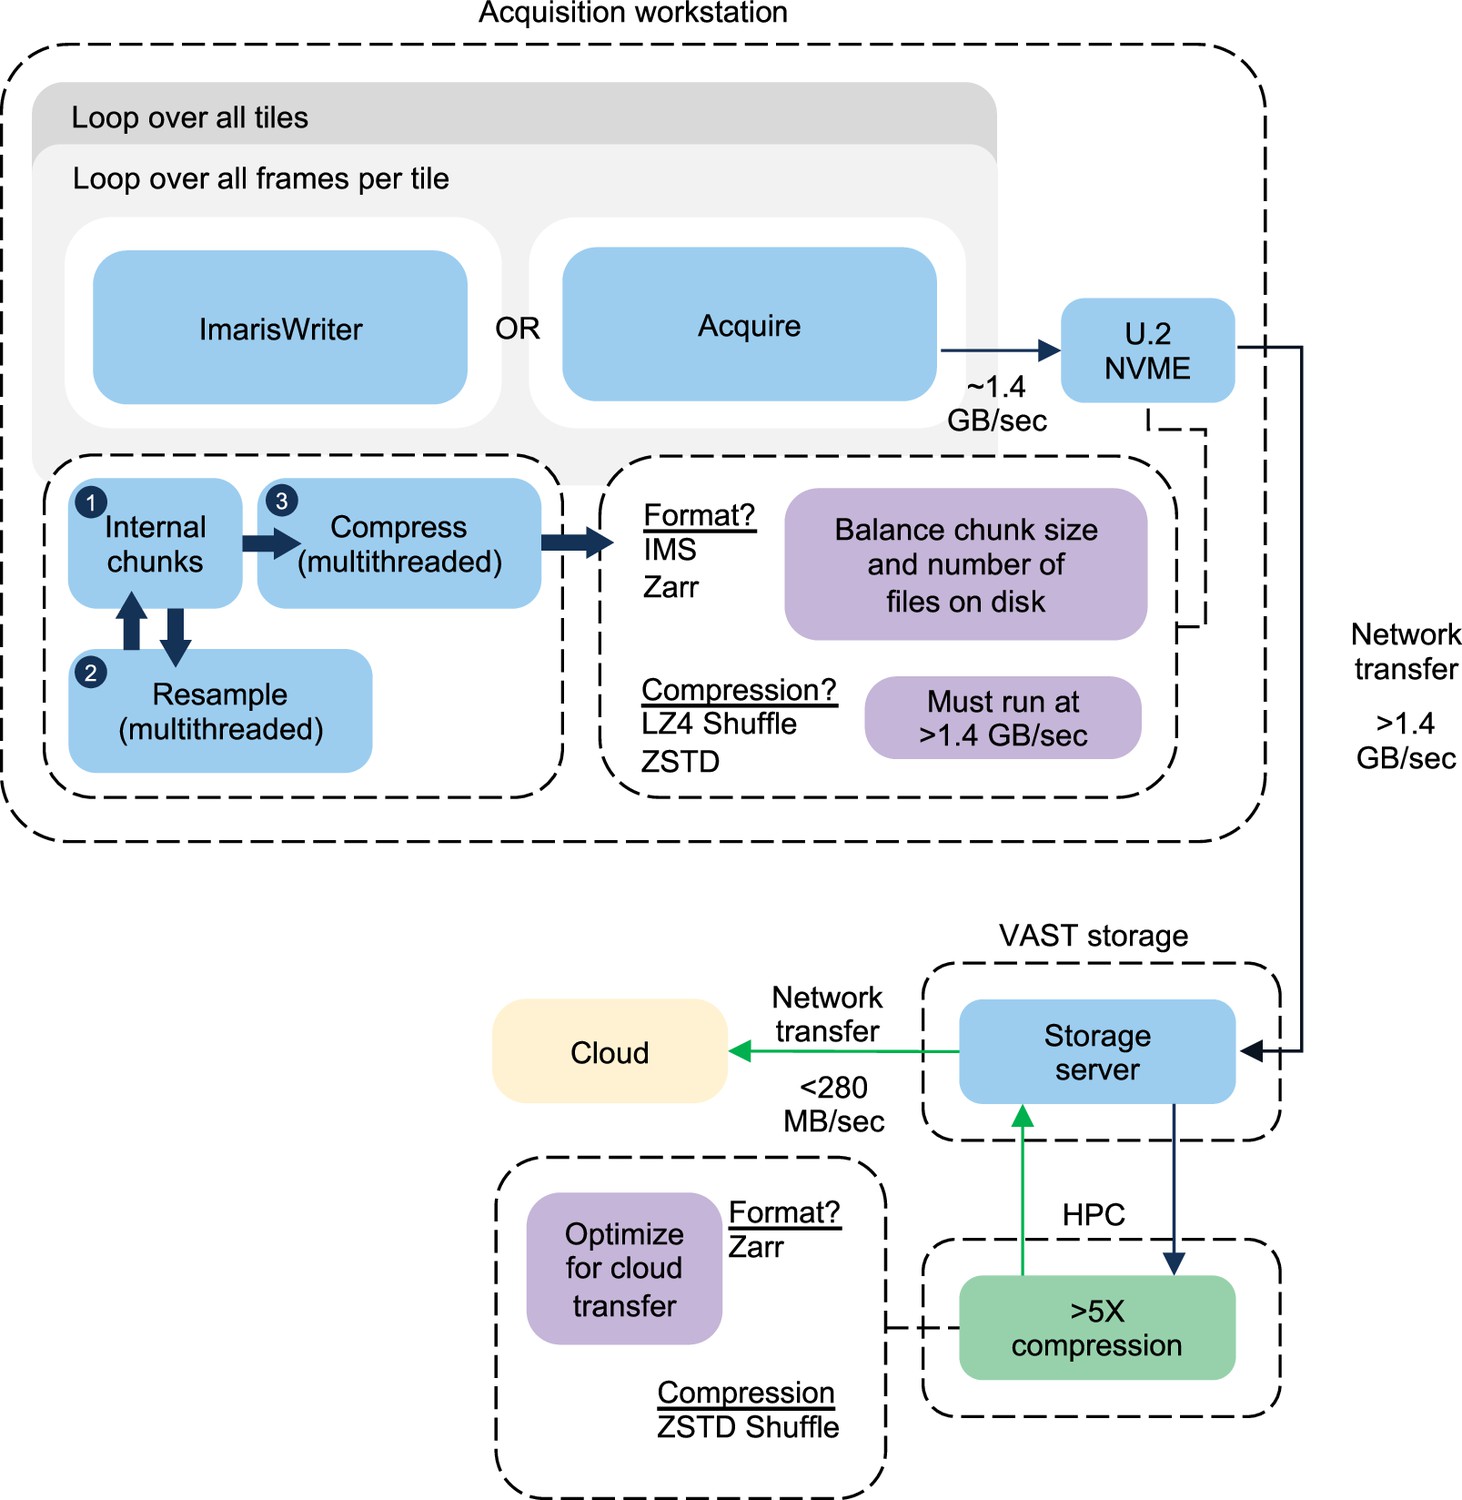
A block diagram summarizing the acquisition procedure for an ExA-SPIM dataset is shown.
Each dataset requires looping over the total frames within a given tile, and then all tiles within a given dataset. Each tile results in a single file on disk, which is copied over the network to a local VAST storage system. The transfer of the previous tile occurs synchronously with the acquisition of the next tile, and the transfer speed to the VAST system outpaces the data generation speed of the microscope. For the ImarisWriter workflow, once tiles are transferred to the VAST storage system, they are synchronously converted to OME-Zarr files with ZSTD Shuffle compression. After compression, the files are written directly to cloud storage. The compression and conversion to OME-Zarr also run at a speed that outpaces the microscope.
Figure 2—figure supplement 10

Although clearing and expansion protocols render tissues transparent, there still exist small refractive index inhomogeneities, ΔRI, which degrade image quality at larger imaging depths.
This effect is more extreme for high NA lenses, as light enters the objective over a larger collection angle, leading to path differences between extreme and axial rays (i.e. wavefront error). This effect is reduced for low NA optics. In addition, when tissues are expanded by a factor, F, the refractive index inhomogeneities reduce to the third power, while the imaging path length through tissue, WD, only increases to the first power. The reduced aberration sensitivity of low NA optics, combined with the increased homogenization of refractive index through the expansion process explain, in part, the benefits of expansion-assisted imaging.
Figure 3 with 1 supplement
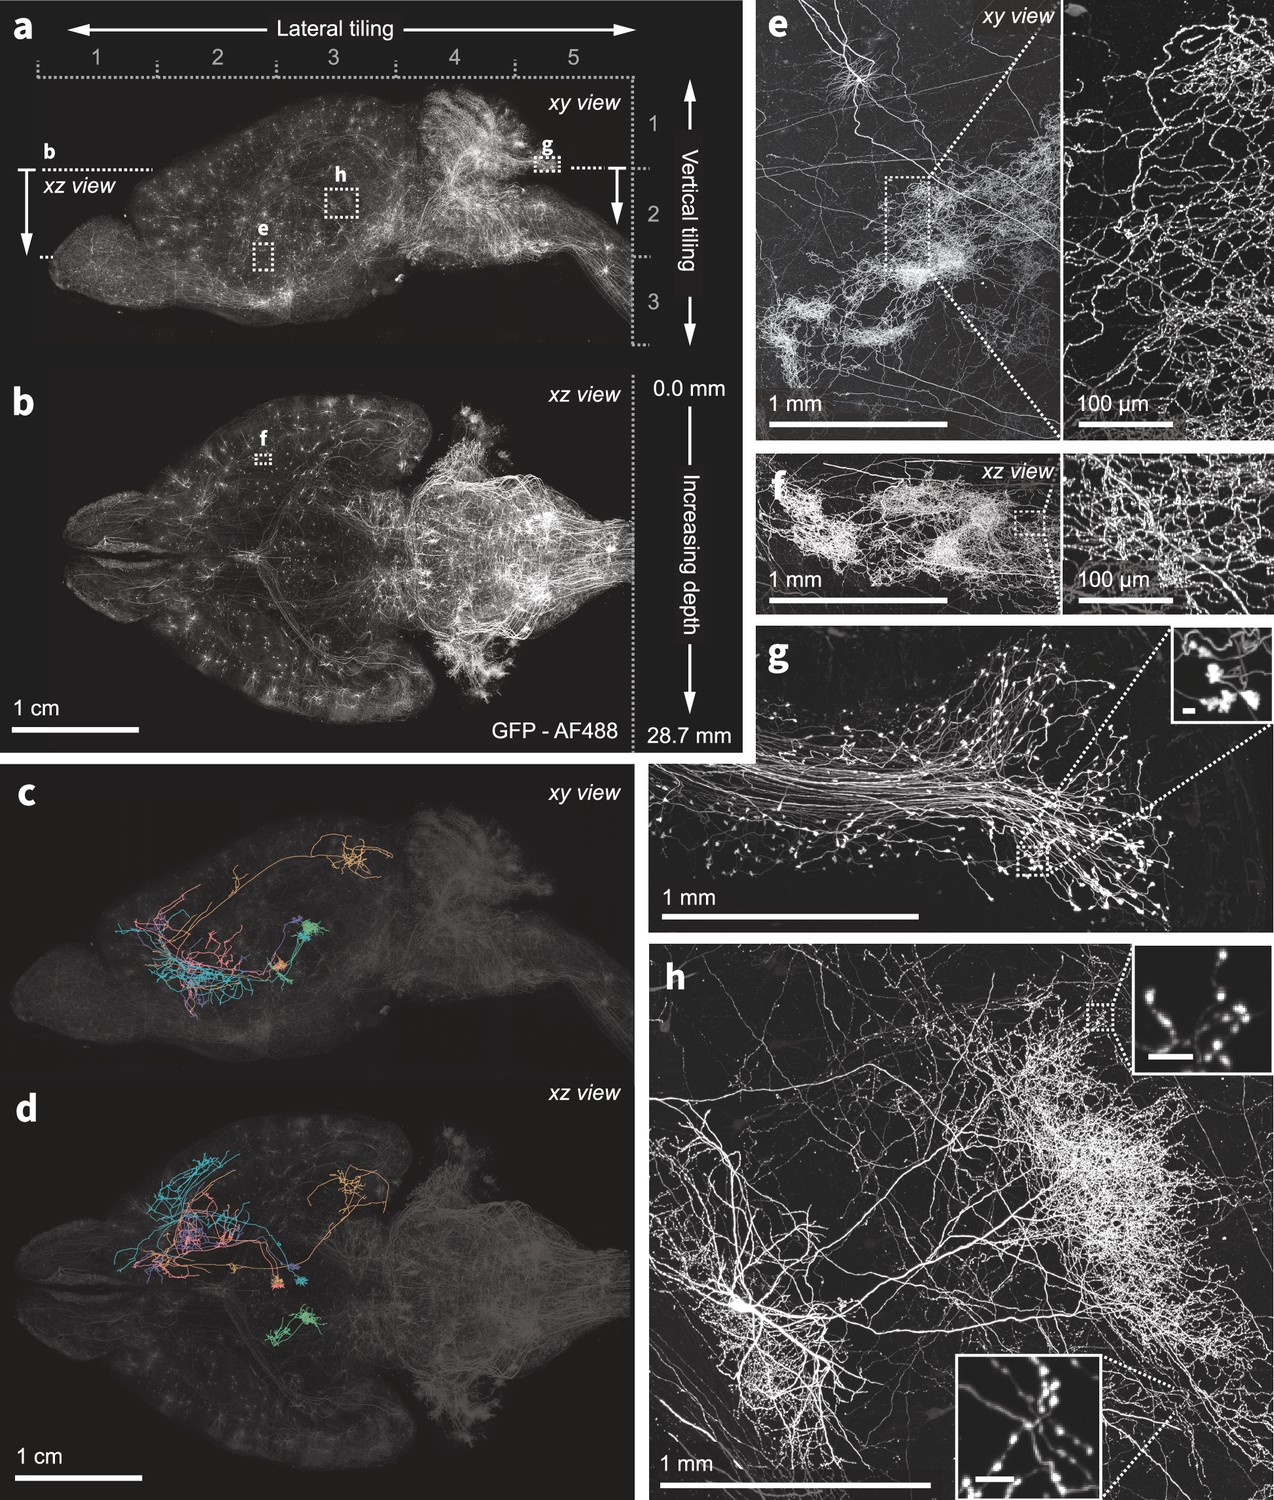
Nanoscale imaging of intact mouse brains.
(a–b) Neurons in the mouse brain were labeled using a combination of PHP.eB pseudotyped enhancer AAV (pAAV-AiE2255m-minBG-iCre(R297T)-BGHpA that drives expression of a mutated iCre(R297T) recombinase and targets the 149 PVT-PT Ntrk1Glut molecular subclass in the whole mouse brain taxonomy Yao et al., 2023) together with an AAV expressing GFP in a Cre-dependent manner. Sparse and bright labeling was achieved for neurons in the olfactory bulb, striatum, thalamus, midbrain, and medulla. Intact mouse brains were expanded (3×) and imaged using the ExASPIM microscope (Ouellette et al., 2023, dx.doi.org/10.17504/protocols.io.n92ldpwjxl5b/v1). (c–d) Representative reconstructions of complete axonal morphologies of five thalamic neurons. (e–h) ExA-SPIM imaging resolves dense axonal arbors and varicosities across various brain regions with high resolution and isotropy . xy and xz views of a dense arbor in the striatum (e–f); mossy fiber axon terminals and boutons (g); an individual hippocampal CA3 neuron and its extensive local axons (h). Images are displayed as maximum intensity projections, and inset scale bars correspond to 10 µm post tissue expansion unless otherwise specified.
Figure 3—figure supplement 1
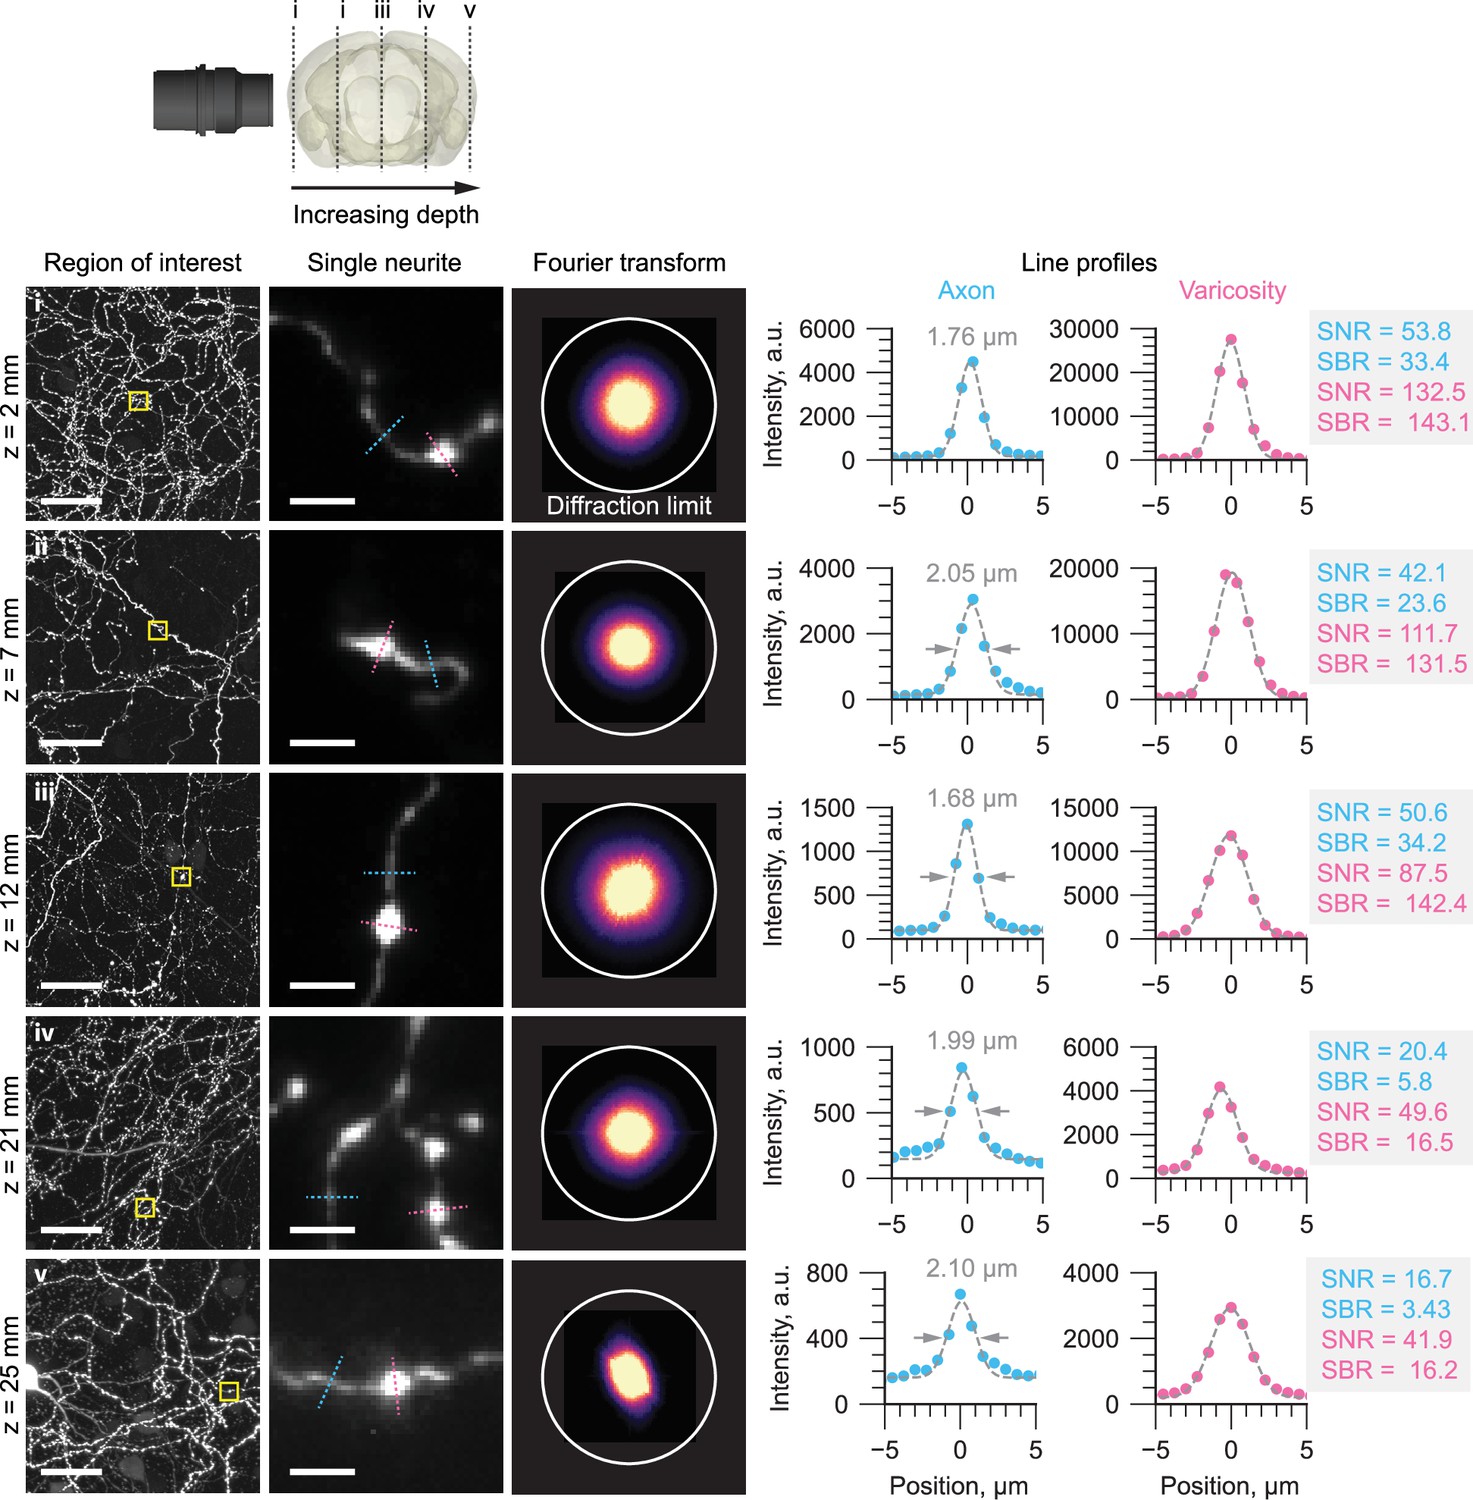
Representative regions of interest of individual axons in a mouse brain are shown at increasing imaging depths.
At each imaging depth, the Fourier transform is shown with a circle denoting the expected diffraction-limited resolution of the microscope. Line profiles through individual axons and varicosities are also shown, with the full-width-half-maximum, signal-to-noise-ratio (SNR), and signal-to-background-ratio (SBR) estimated. The SNR was calculated assuming shot noise-limited detection: where P (photons) was calculated by converting the arbitrary intensity units (a.u.) to photons using the gain factor, K (e-/a.u.) and quantum efficiency, QE (e-/photon) of the camera sensor.
Figure 4

Multi-color imaging of centimeter-scale tissues with nanoscale resolution.
(a–b) An intact mouse brain was expanded (3×) and sparsely labeled neurons expressing GFP and tdTomato were imaged using the ExA-SPIM microscope (Ouellette et al., 2023, dx.doi.org/10.17504/protocols.io.n92ldpwjxl5b/v1). An overlay of both channels for a single tile is shown in (c). The achromatic performance of the optics enabled diffraction-limited imaging in both color channels, as illustrated by the ability to resolve individual spines along the dendrites of Purkinje cells in the cerebellum. Images are displayed as maximum intensity projections, and inset scale bars correspond to 10 µm post tissue expansion unless otherwise specified.
Figure 5 with 1 supplement
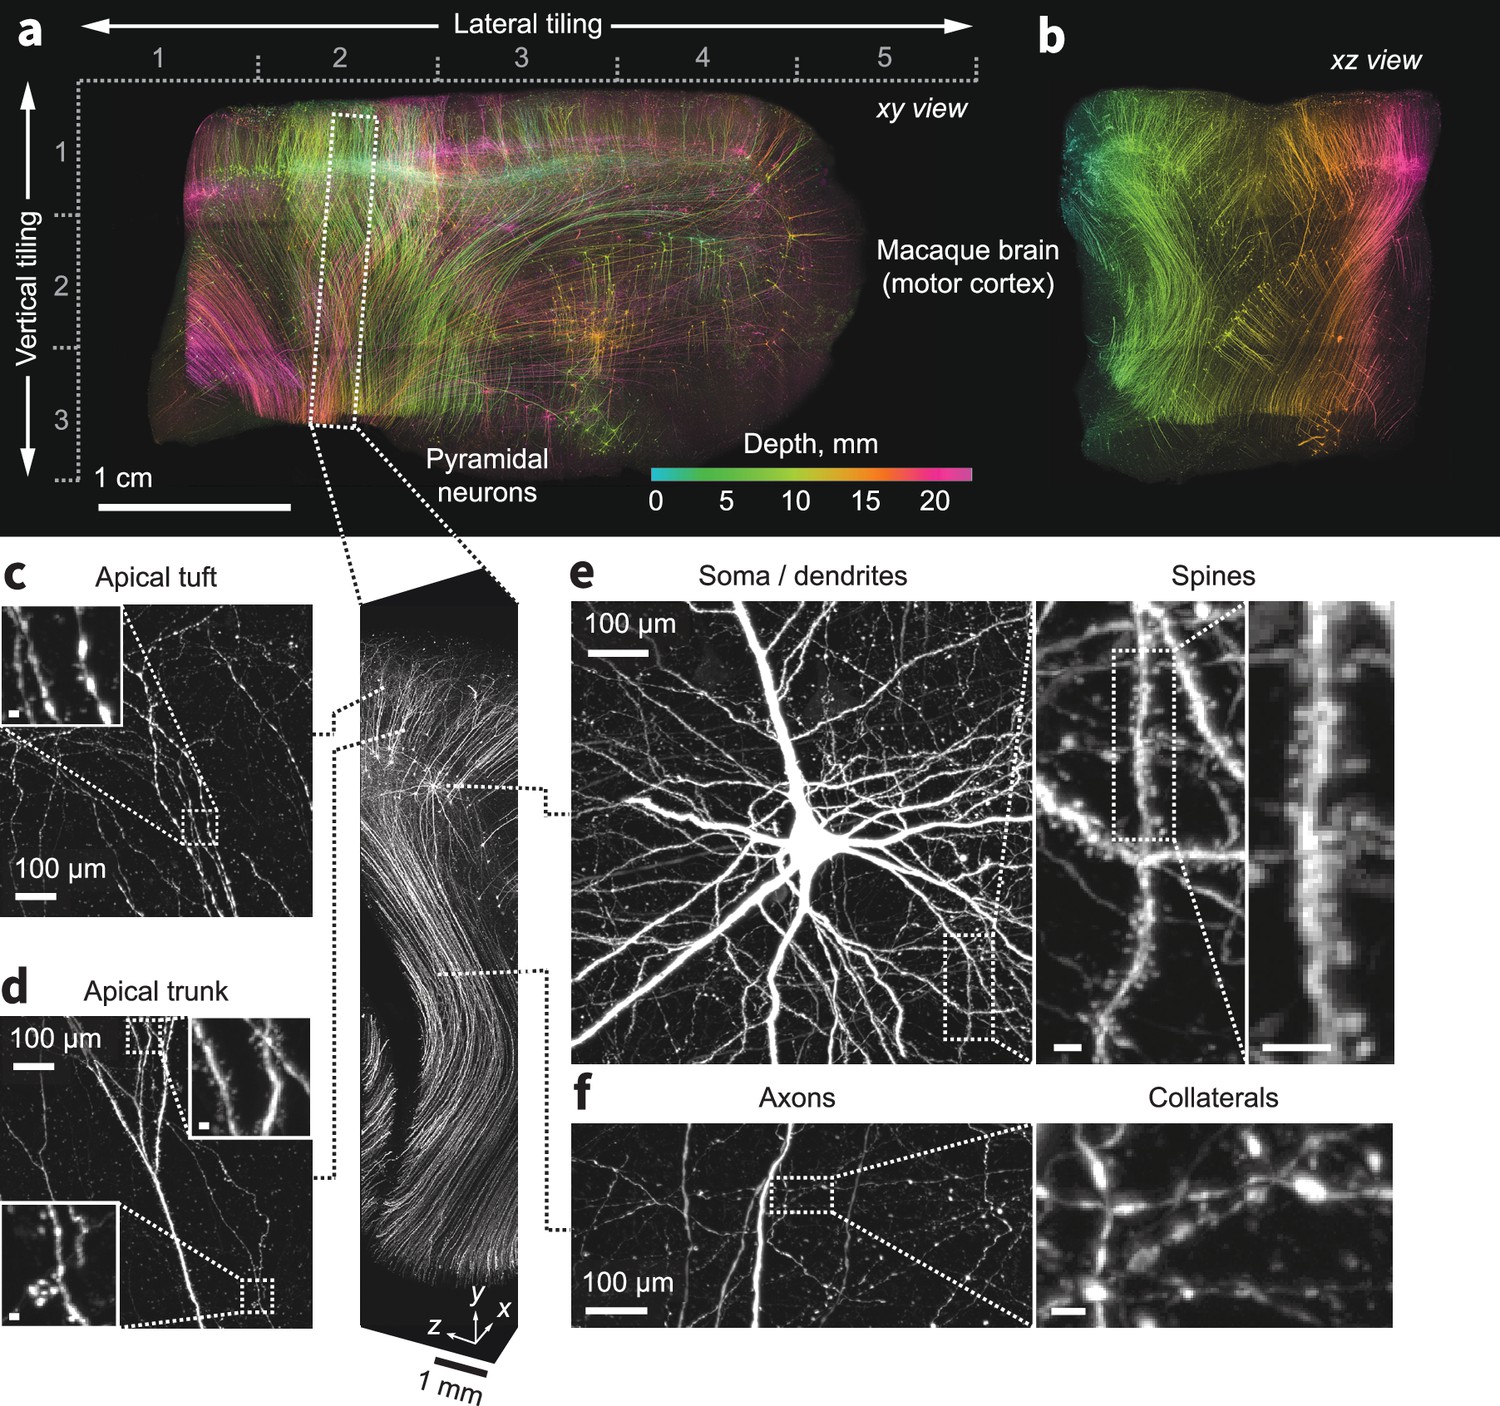
Expansion and imaging of a large volume of macaque brain.
A 1 cm×1 cm×1.5 cm block of macaque primary motor cortex was expanded (3×) and imaged on the ExA-SPIM (Videos 7–9). Corticospinal neurons were transduced by injecting tdTomato-expressing retro-AAV into the spinal cord. (a–b) Maximum intensity projections of the imaged volume pseudo-colored by depth. The axes descriptors in (a) indicate the 5×3 tiling used to image this volume. (c–f) Fine axonal and dendritic structures including descending axons, collaterals, and dendritic spines are clearly discernible in the images throughout the entire volume. See Video 10. Images are displayed as maximum intensity projections with the following thicknesses: (a) 23 mm, (b) 45 mm, (c–f) 1 mm. Inset scale bars correspond to 10 µm post tissue expansion unless otherwise specified.
Figure 5—figure supplement 1
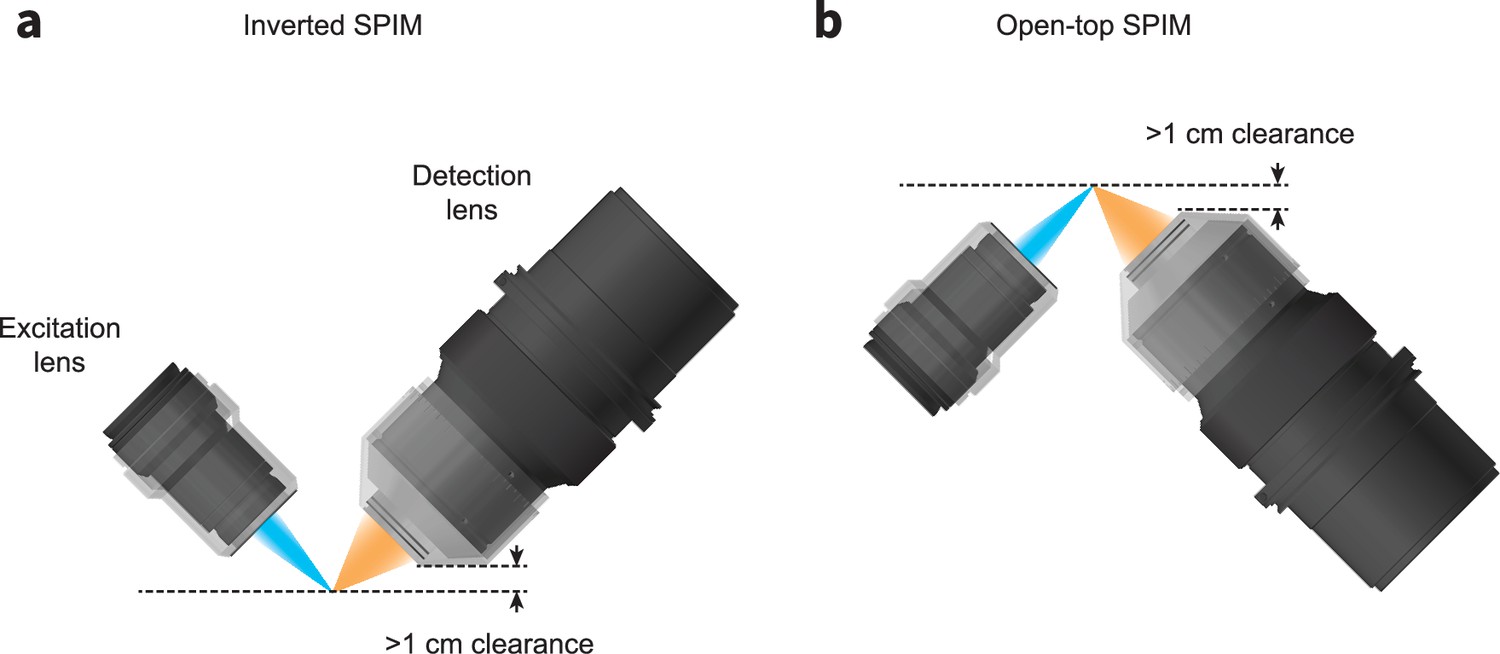
Schematics for configuring the ExA-SPIM system in an (a) inverted or (b) open-top architecture.
In both geometries, the working distance and mechanical housing of the lenses provide >1 cm of clearance, enabling imaging large tissue sections up to 1 cm thick. This geometry also reduces path lengths through the tissue, reducing the demands on optical clearing and tissue clarity.
Figure 6
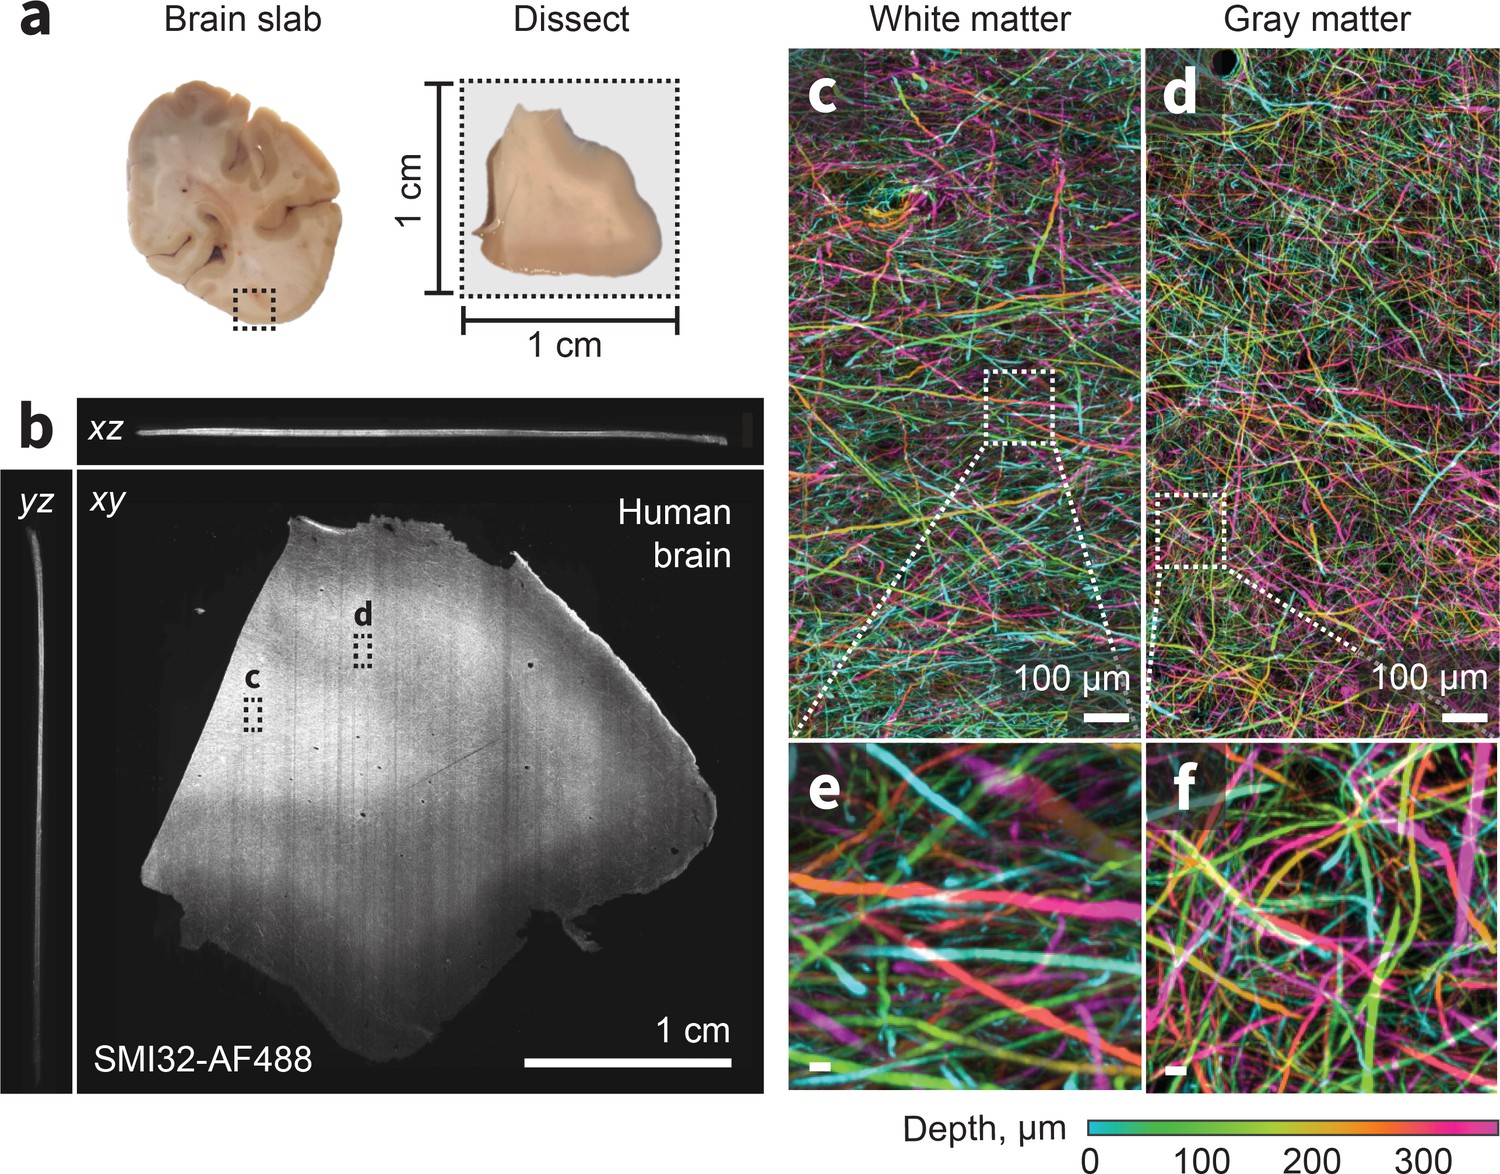
ExA-SPIM imaging of human tissue.
(a–b) A region from the medial temporal-occipital cortex was manually dissected into a ~1 cm×1 cm block, which was subsequently sectioned into ~100 µm sections for tissue expansion (4×), labeling, and ExA-SPIM imaging. (c–d) Maximum intensity projection of a region of interest from white and gray matter, pseudo-colored by depth. (e–f) Individual axons and their trajectories are clearly resolved with high contrast. Images are displayed as maximum intensity projections across 350 µm (b–f). Inset scale bars correspond to 10 µm post tissue expansion unless otherwise specified.
Videos
Video 1
Tiled imaging of an expanded mouse brain.
Adjacent tiles are colored magenta and green.
Video 2
Zoom-in of a single tile before tile alignment.
Video 3
Zoom-in of a single tile after tile alignment.
Video 4
Zoom-in of a single tile after tile fusion.
Video 5
XY fly through of dense axonal arbors shown in Figure 3e.
Video 6
XZ fly through of dense axonal arbors shown in Figure 3f.
Video 7
XY fly-through of macaque motor cortex.
Video 8
YZ fly-through of macaque motor cortex.
Video 9
XZ fly-through of macaque motor cortex.
Video 10
Tracking cortico-spinal tract neurons in macaque motor cortex.
Tables
Appendix 1—table 1
Summary of custom lenses for fluorescence microscopy.
| Reference | Name | Liquid immersion | f | NA | Field of view | Etendue | Working distance |
|---|---|---|---|---|---|---|---|
| Tang et al., 2024 | Curved LSFM | 1.33–1.56 | 118 | 0.25 | 13.00 | 8.30 | 20.00 |
| Current study | ExA-SPIM | 1.33–1.56 | 100 | 0.31 | 16.40 | 19.65 | 40.00 |
| Fan et al., 2019 | RUSH | - | - | 0.35 | 14.00 | 18.86 | 19.00 |
| Ota et al., 2020 | FASHIO-2PM | - | 35 | 0.40 | 4.24 | 2.26 | 4.50 |
| McConnell et al., 2016 | Mesolens | 1.33–1.56 | 50 | 0.47 | 6.00 | 1.13 | 3.00 |
| Yu et al., 2024 | Cousa | - | 20 | 0.50 | 2.00 | 0.79 | 20.00 |
| Yu et al., 2021 | Diesel2P | - | 30 | 0.54 | 6.00 | 8.24 | 8.00 |
| Kyocera | CS06-10-40-154 | 1.52–1.56 | 18 | 0.60 | 2.00 | 1.13 | 40.60 |
| Sofroniew et al., 2016 | 2p-RAM | - | 21 | 0.60 | 5.00 | 7.07 | 2.70 |
| Voigt et al., 2024 | Schmidt | 1.33–1.56 | - | 1.00 | 1.15 | 1.04 | 11.00 |
Appendix 1—table 2
Comparison of large-scale volumetric imaging modalities.
| Reference | Imaging method | Optical resolution | Voxel size | Isotropy | Focal volume | Voxel rate |
|---|---|---|---|---|---|---|
| Economo et al., 2016 | 2 p tomography | 0.45×0.45 × 1.33 | 0.30×0.30 × 1.00 | 2.96:1 | 0.27 | 16 |
| Gong et al., 2016 | fMOST | 0.32×0.32 × 2.00 | 0.32×0.32 × 2.00 | 6.25:1 | 0.20 | 4 |
| Narasimhan et al., 2017 | Oblique light-sheet | 0.75×0.75 × 6.90 | 0.41×0.41 × 0.41 | 9.20:1 | 3.88 | 419 |
| Migliori et al., 2018 | Light-sheet theta | 0.34×0.34 × 3.00 | 0.23×0.23 × 5.00 | 8.82:1 | 0.29 | 105 |
| Chakraborty et al., 2019 | Axially-swept SPIM | 0.48×0.48 × 0.48 | 0.16×0.16 × 0.16 | 1:1 | 0.11 | 42 |
| Voleti et al., 2019 | SCAPE 2.0 | 0.60×1.21 × 1.55 | 0.24×0.24 × 0.24 | 2.58:1 | 1.13 | 419 |
| Gao et al., 2019 | ExLLSM | 0.06×0.06 × 0.09 | 0.03×0.03 × 0.04 | 1.5:1 | <<0.01 | 68 |
| Chen et al., 2020a | Multifocal 2 p tomography | 0.36×0.36 × 2.59 | 0.40×0.40 × 1.00 | 7.19:1 | 0.34 | 77 |
| Guo et al., 2020 | Dual-inverted SPIM | 0.48×0.48 × 0.48 | 0.24×0.24 × 0.24 | 1:1 | 0.11 | 419 |
| Chen et al., 2020b | Tiling SPIM | 0.30×0.30 × 2.50 | 0.30×0.30 × 1.50 | 5:1 | 0.22 | 105 |
| Wang et al., 2021 | fMOST | 0.34×0.34 × 2.00 | 0.23×0.23 × 1.00 | 5.88:1 | 0.23 | 136 |
| Zhang et al., 2021 | Axially-swept SPIM | 0.95×0.95 × 2.10 | 0.52×0.52 × 1.00 | 2.21:1 | 1.90 | 84 |
| Xu et al., 2021 | VISOR2 SPIM | 1.00×1.00 × 2.50 | 1.00×1.00 × 2.50 | 2.5:1 | 2.50 | 373 |
| Glaser et al., 2022 | Open-top light-sheet | 0.45×0.45 × 2.91 | 0.20×0.20 × 0.20 | 6.47:1 | 0.59 | 105 |
| Qi et al., 2023 | Confocal airy light-sheet | 0.76×0.76 × 2.20 | 0.26×0.26 × 1.06 | 2.08:1 | 1.27 | 419 |
| Vladimirov et al., 2024 | Benchtop mesoSPIM | 1.50×1.50 × 3.30 | 0.75×0.75 × 2.00 | 2.2:1 | 7.43 | 37 |
| Tang et al., 2024 | Curved LSFM | 1.22×1.22 × 2.50 | 0.63×0.63 × 1.25 | 2:1 | 3.72 | 130 |
| Current study | ExA-SPIM (1×) | 1.00×1.00 × 3.00 | 0.75×0.75 × 1.00 | 3:1 | 6.75 | 725 |
| Current study | ExA-SPIM (2×) | 0.50×0.50 × 1.50 | 0.38×0.38 × 0.50 | 3:1 | 0.84 | 725 |
| Current study | ExA-SPIM (3×) | 0.33×0.33 × 1.00 | 0.25×0.25 × 0.33 | 3:1 | 0.25 | 725 |
| Current study | ExA-SPIM (4×) | 0.25×0.25 × 0.75 | 0.19×0.19 × 0.25 | 3:1 | 0.11 | 725 |
Appendix 1—table 3
ExA-SPIM imaging across scales.
| Manufacturer | Model | M | NA | Lateral resolution | Field of view | Etendue | Speed |
|---|---|---|---|---|---|---|---|
| Schneider-Kreuznach | VEO_JM DIAMOND 1.43×/F3.0 | 1.43 | 0.10 | 3.05 | 57.34 | 26.34 | 2137 |
| Schneider-Kreuznach | VEO_JM DIAMOND 1.67×/F3.0 | 1.67 | 0.10 | 3.05 | 49.10 | 19.32 | 1340 |
| Schneider-Kreuznach | VEO_JM DIAMOND 2.5×/F2.6 | 2.50 | 0.13 | 2.35 | 32.80 | 15.17 | 400 |
| Schneider-Kreuznach | VEO_JM DIAMOND 3.33×/F2.1 | 3.33 | 0.18 | 1.69 | 24.62 | 15.43 | 170 |
| Schneider-Kreuznach | VEO_JM DIAMOND 5.0×/F1.3 | 5.00 | 0.31 | 1.00 | 16.40 | 19.65 | 50 |
| Nikon | Rayfact 1.4 S | 1.40 | 0.11 | 2.77 | 61.71 | 36.19 | 2277 |
| Nikon | Rayfact 1.7 S | 1.70 | 0.11 | 2.77 | 49.37 | 23.16 | 1272 |
| Nikon | Rayfact 2.5 S | 2.50 | 0.14 | 2.18 | 34.56 | 18.39 | 400 |
| Nikon | Rayfact 3.5 S | 3.50 | 0.16 | 1.91 | 24.69 | 12.25 | 146 |
| Nikon | Rayfact 5 S | 5.00 | 0.17 | 1.79 | 17.28 | 6.78 | 50 |
| Nikon | Rayfact 1–2 x Variable Lens | 1.00 | 0.09 | 3.39 | 86.4 | 47.49 | 6249 |
| Nikon | Rayfact 1–2 x Variable Lens | 2.00 | 0.12 | 2.54 | 43.2 | 21.11 | 781 |
| Nikon | Rayfact 2–5 x Variable Lens | 2.00 | 0.13 | 2.35 | 43.2 | 24.77 | 781 |
| Nikon | Rayfact 2–5 x Variable Lens | 5.00 | 0.17 | 1.79 | 16.6 | 6.25 | 50 |
Additional files
-
MDAR checklist
- https://cdn.elifesciences.org/articles/91979/elife-91979-mdarchecklist1-v2.pdf
-
Supplementary file 1
Summary of available electronics metrology technologies.
- https://cdn.elifesciences.org/articles/91979/elife-91979-supp1-v2.xlsx
-
Supplementary file 2
Data for Appendix 1—tables 1–3.
- https://cdn.elifesciences.org/articles/91979/elife-91979-supp2-v2.xlsx
Download links
A two-part list of links to download the article, or parts of the article, in various formats.
Downloads (link to download the article as PDF)
Open citations (links to open the citations from this article in various online reference manager services)
Cite this article (links to download the citations from this article in formats compatible with various reference manager tools)
Expansion-assisted selective plane illumination microscopy for nanoscale imaging of centimeter-scale tissues
eLife 12:RP91979.
https://doi.org/10.7554/eLife.91979.4


