Spatial transcriptomics and single-nucleus RNA sequencing reveal a transcriptomic atlas of adult human spinal cord
- Department of Anesthesiology, West China Hospital, Sichuan University, China
- Laboratory of Anesthesia and Critical Care Medicine, National-Local Joint Engineering Research Centre of Translational Medicine of Anesthesiology, West China Hospital, Sichuan University, China
- Department of Anesthesiology, Longgang District Maternity & Child Healthcare Hospital of Shenzhen City (Longgang Maternity and Child Institute of Shantou University Medical College), China
- Department of Intensive Care Unit, Affiliated Hospital of Zunyi Medical University, China
- Department of Orthopedic Surgery, Affiliated Hospital of Zunyi Medical University, China
- Department of Anesthesiology, Affiliated Hospital of Zunyi Medical University, China
- Department of Anesthesiology, Zhongshan Hospital, Fudan University, China
Figures
Figure 1 with 1 supplement
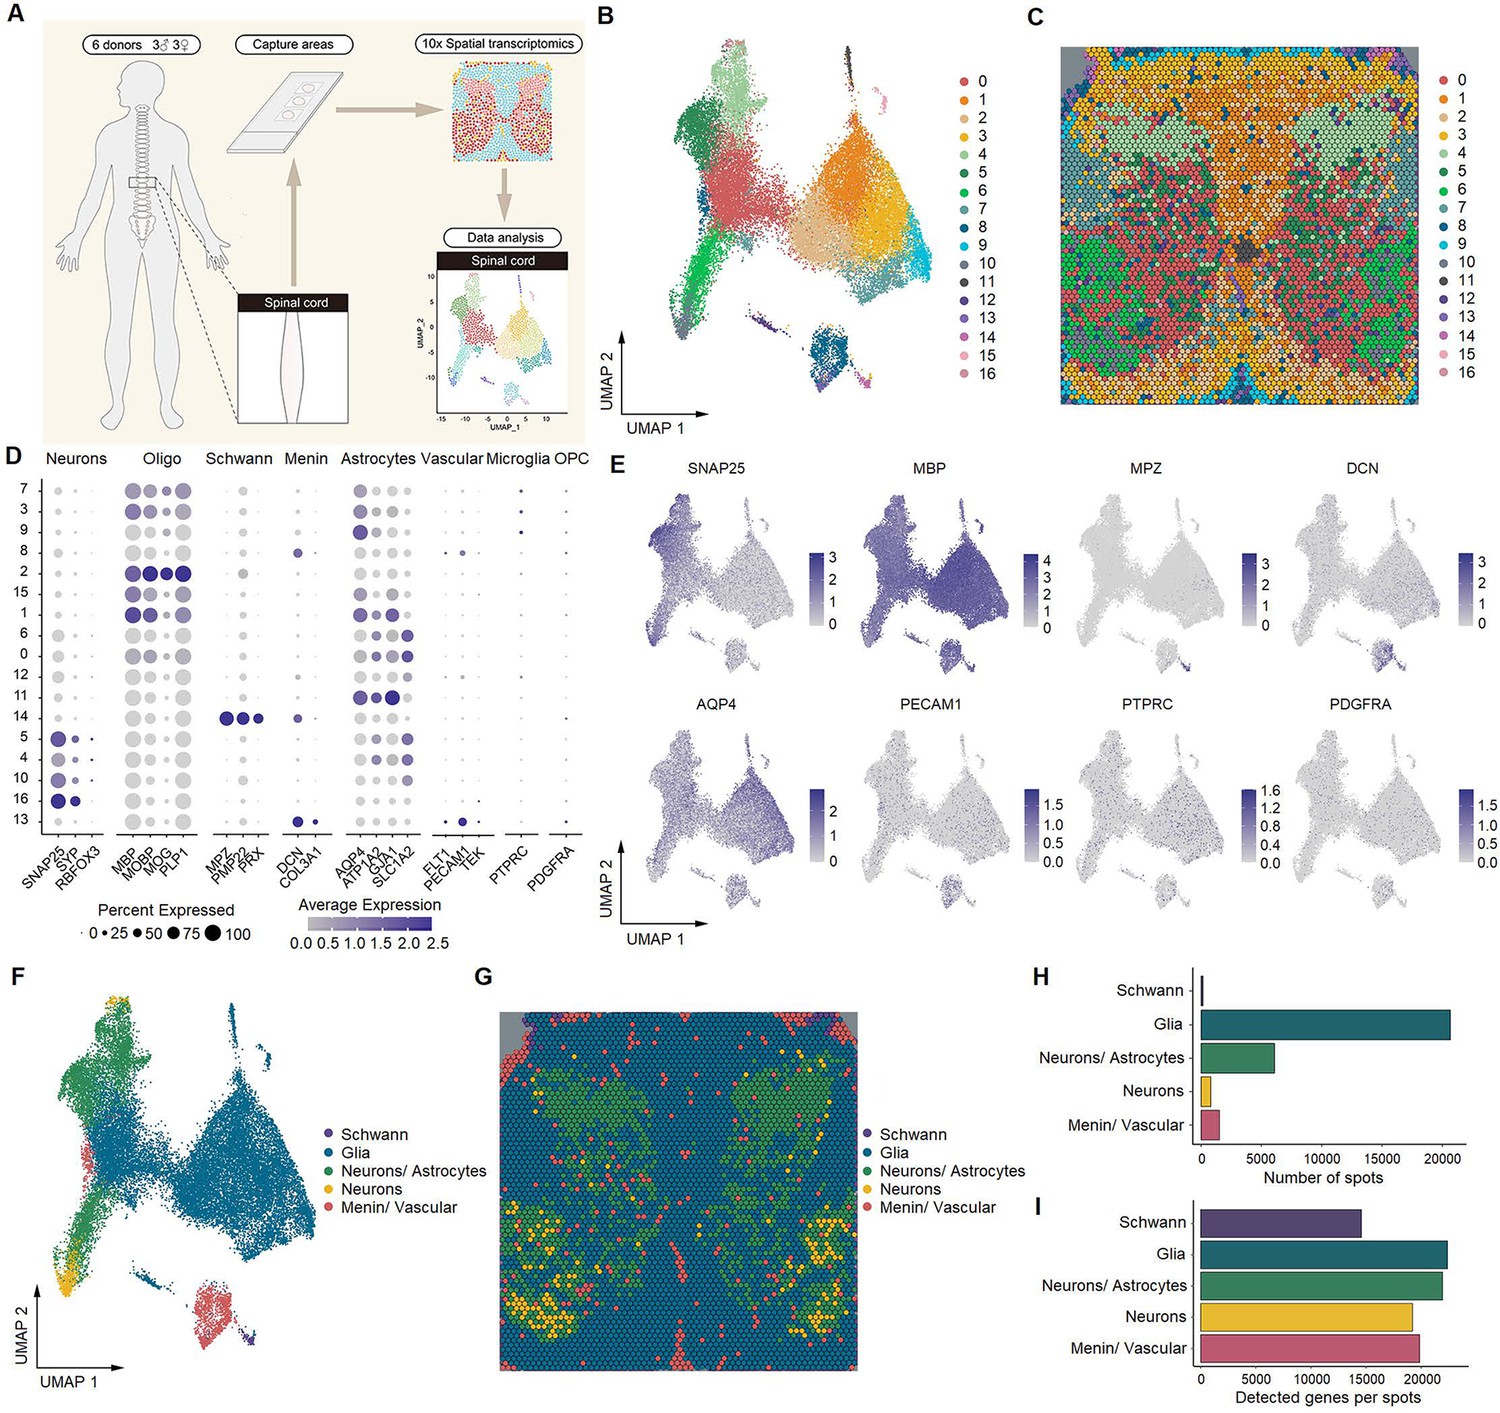
Identification of human spinal cell types from spatial transcriptomics.
(A) Overview of the experimental workflow for spatial transcriptomics. (B) UMAP plot showing 17 cell types in the spinal cord. Dots, individual spots; colors, cell types. (C) Representative image showing the spatial distribution of these 17 cell types on Visium slides. (D) Dot plot showing the expression of representative marker genes across all cell types. The dot size represents the percentage of barcodes within a cluster, and the color scale indicates the average expression across all barcodes within a cluster for each gene shown. (E) UMAP plot showing the expression of representative marker genes. (F) UMAP plot showing five major cell types in the spinal cord. Glia includes oligodendrocytes, astrocytes, microglia, and OPCs. Dots, individual spots; colors, cell types. (G) Representative image showing the spatial distribution of five major cell types in spinal slices. Dots, individual spots; colors, cell types. (H) The number of spots in each cluster. (I) The number of genes detected per cluster. Oligo, oligodendrocytes; Menin, meningeal cells; OPC, oligodendrocyte precursor cells; UMAP, uniform manifold approximation and projection.
Figure 1—figure supplement 1
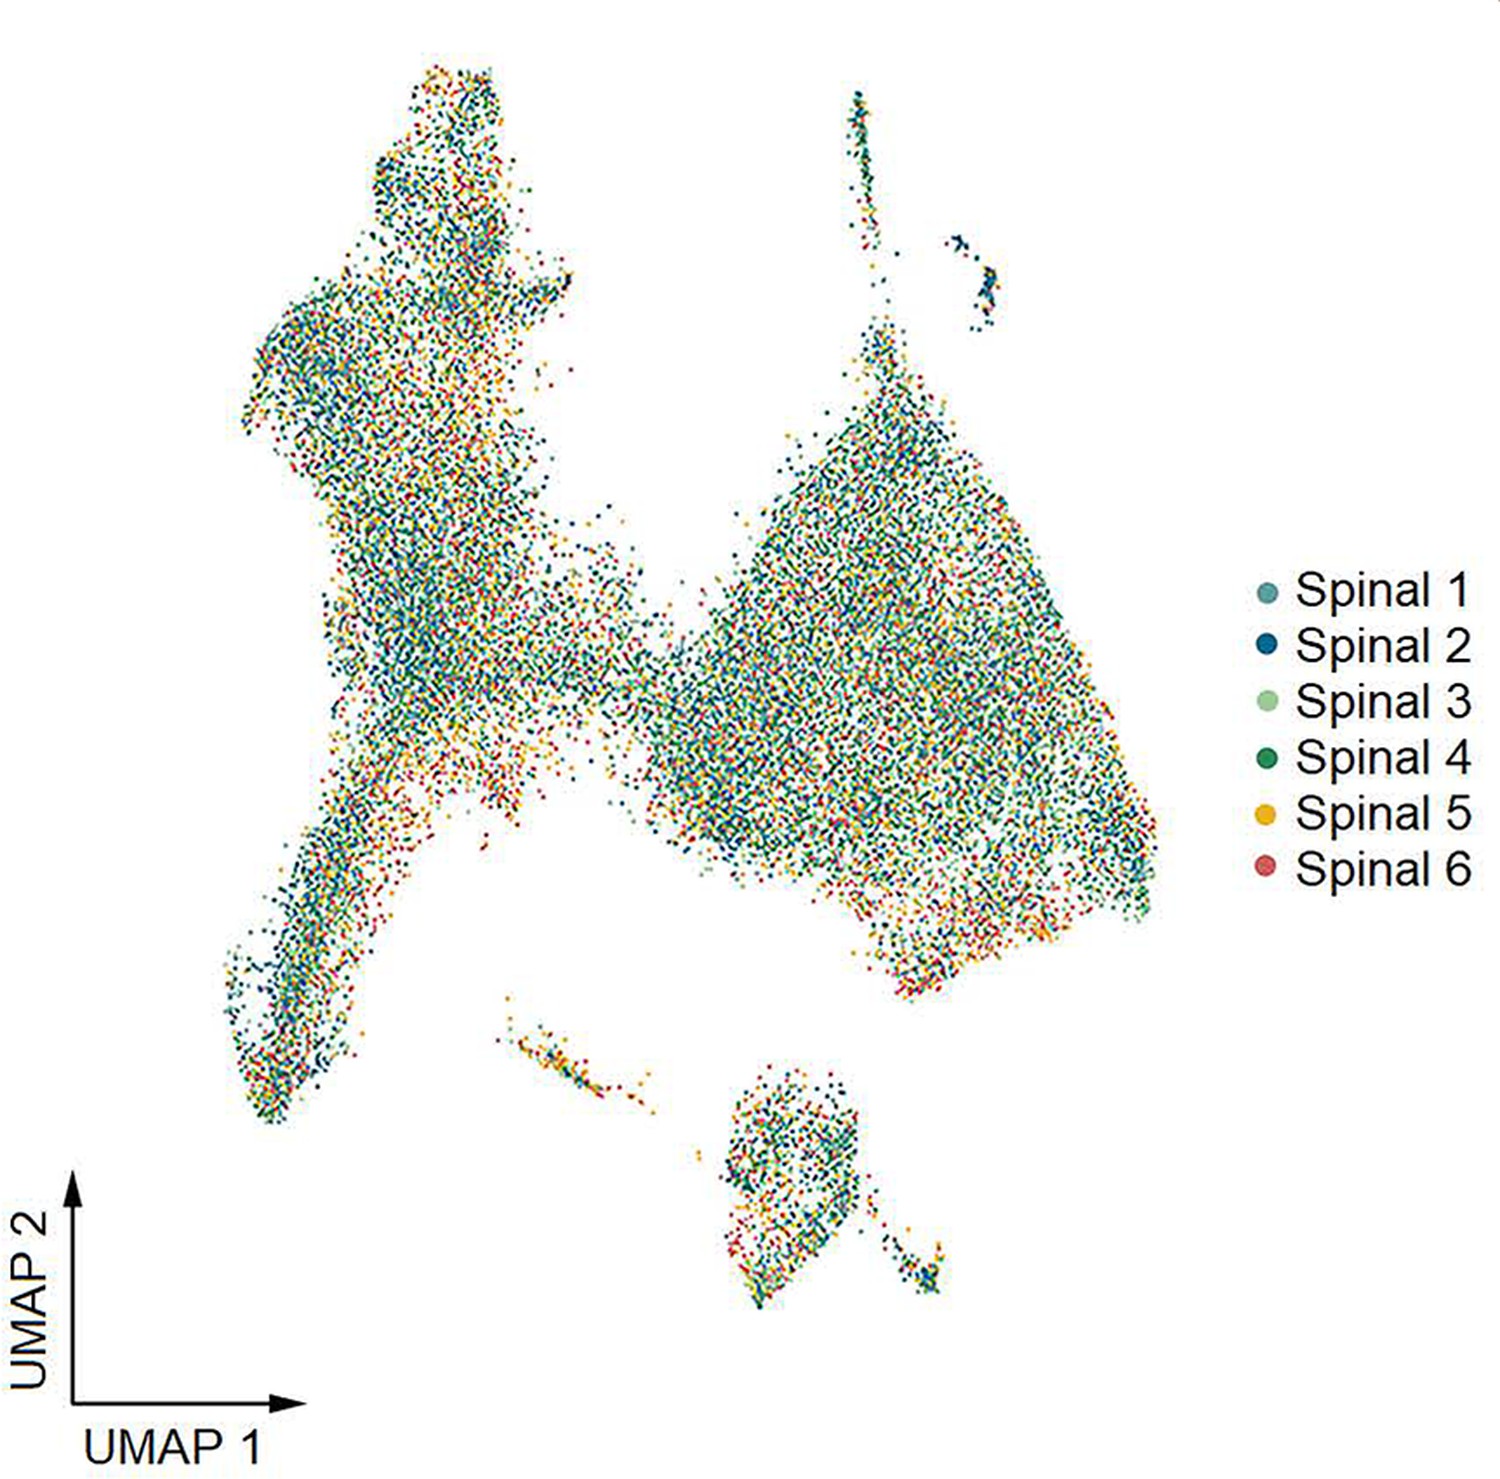
Uniform manifold approximation and projection (UMAP) plot showing the contribution of each donor to spinal cluster formation by spatial transcriptomics.
Figure 2 with 1 supplement
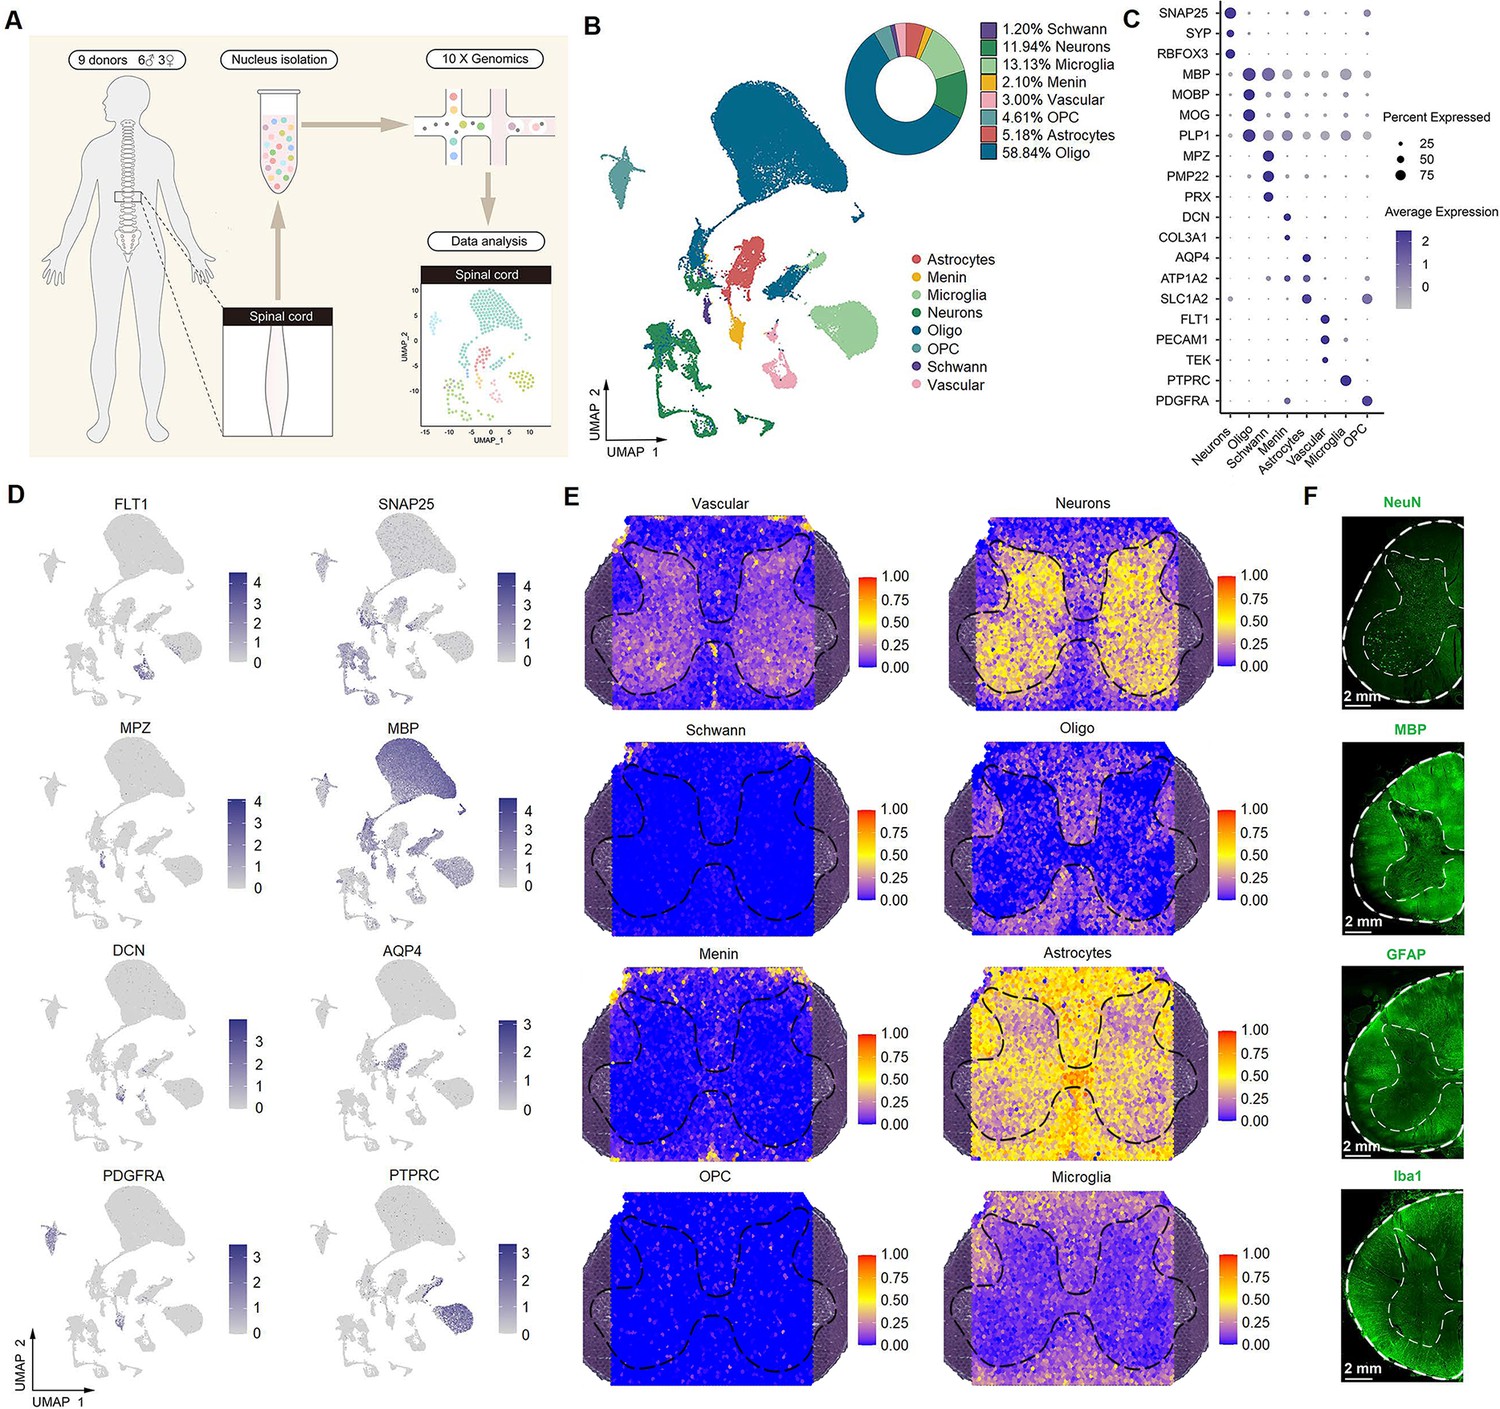
Identification of spinal cell types using single-nucleus RNA-seq.
(A) Overview of the experimental workflow for single-nucleus RNA-seq. (B) UMAP plot showing eight major cell types. Dots, individual cells; colors, cell types. (C) Dot plot showing the expression of representative marker genes across all eight cell types. The dot size indicates the percentage of cells expressing the gene; the color scale indicates the average normalized expression level in each cluster. (D) UMAP plot showing the expression of representative marker genes. (E) Representative section showing the spatial distribution of eight clusters in the spinal cord. (F) Representative immunofluorescence images of NeuN, MBP, GFAP, and Iba1 in a coronal cryosection of the lumber spinal cord. Oligo, oligodendrocytes; OPC, oligodendrocyte precursor cells; Menin, meningeal cells; UMAP, uniform manifold approximation and projection.
Figure 2—figure supplement 1

The characteristics of eight cell types in the human spinal cord by single-nucleus RNA-seq.
(A, B) Heatmap (A) and violin plot (B) showing the expression of selected marker genes across all eight cell types in the spinal cord by single-nucleus RNA-seq. (C) UMAP plot showing the contribution of each donor to spinal cluster formation by single-nucleus RNA-seq. (D) Violin plot showing genes detected per nucleus in each spinal cell type by single-nucleus RNA-seq. Oligo, oligodendrocytes; OPC, oligodendrocyte precursor cells; Menin, meningeal cells; UMAP, uniform manifold approximation and projection.
Figure 3 with 6 supplements
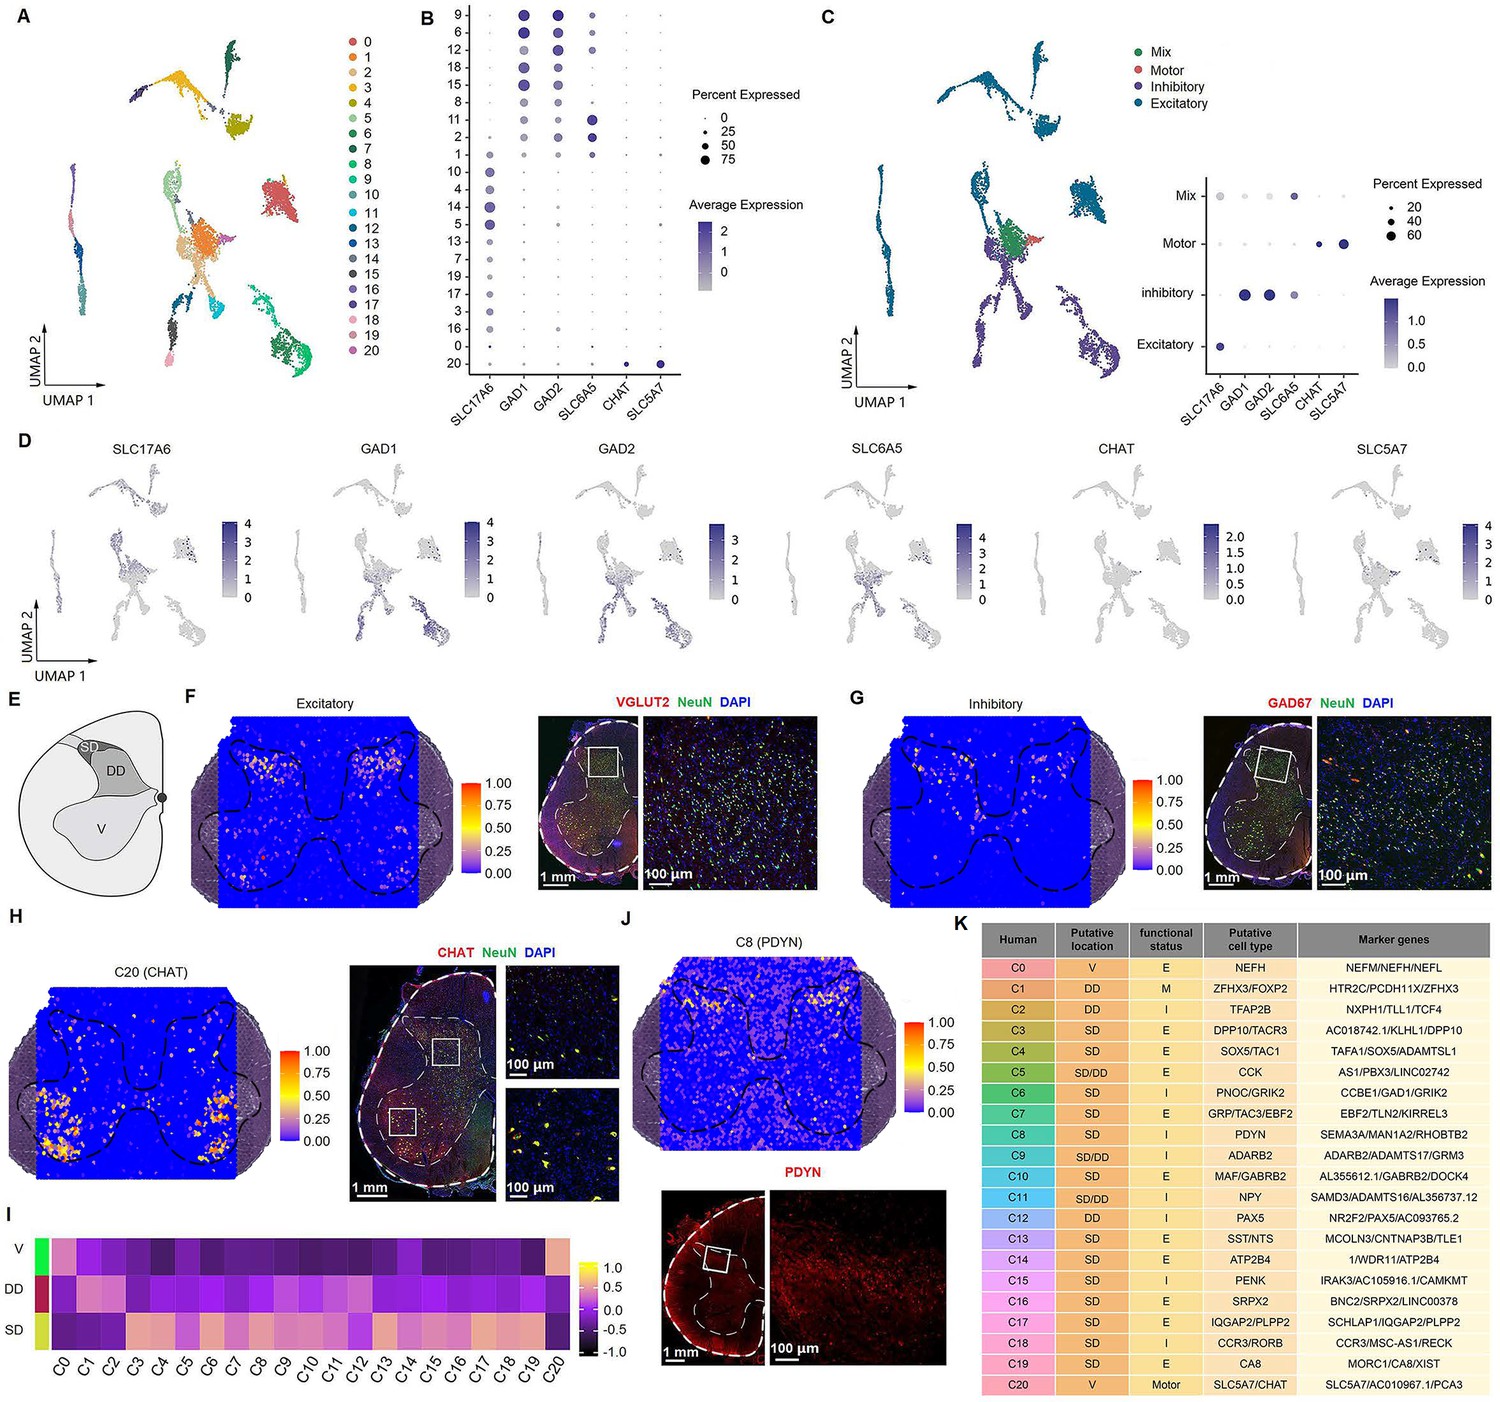
Identification of neuronal subtypes in the human spinal cord.
(A) UMAP plot showing 21 neuronal clusters. Dots, individual cells; colors, neuronal clusters. (B) Dot plot showing the expression of selected marker genes across all 21 neuronal clusters. (C) UMAP plot of spinal cord neurons based on excitatory, inhibitory, and cholinergic marker genes (left). Dot plot showing the expression of representative marker genes of excitatory, inhibitory, and cholinergic clusters (right). (D) UMAP plot showing the expression of representative marker genes of excitatory, inhibitory, and cholinergic clusters. (E) Representative cartoons of subregions in coronal slices of the spinal cord. (F) Representative section showing the spatial distribution of the excitatory clusters (left) and representative immunofluorescence image of the excitatory (VGLUT2) marker in a coronal cryosection of lumber spinal cord (right). (G) Representative section showing the spatial distribution of the inhibitory clusters (left) and representative immunofluorescence image of the inhibitory (GAD67) marker in a coronal cryosection of lumber spinal cord (right). (H) Representative section showing the spatial distribution of motor neurons (C20, left) and representative immunofluorescence image of its marker gene (CHAT) in a coronal cryosection of lumber spinal cord (right). (I) Gene set variation analysis (GSVA) showing the spatial distribution patterns of neuronal clusters in different subregions of coronal sections from the lumber spinal cord. (J) Representative section showing the spatial distribution of C8 (top) and representative immunofluorescence image of its marker gene (PDYN) in a coronal cryosection of lumber spinal cord (bottom). (K) A summary of the characteristics of neuronal clusters, including their location, functional status, putative neuronal type, and representative marker genes. SD, superficial dorsal horn; DD, deep dorsal horn; V, ventral horn; E, excitatory; I, inhibitory; M, mixed; C, cholinergic; UMAP, uniform manifold approximation and projection.
Figure 3—figure supplement 1
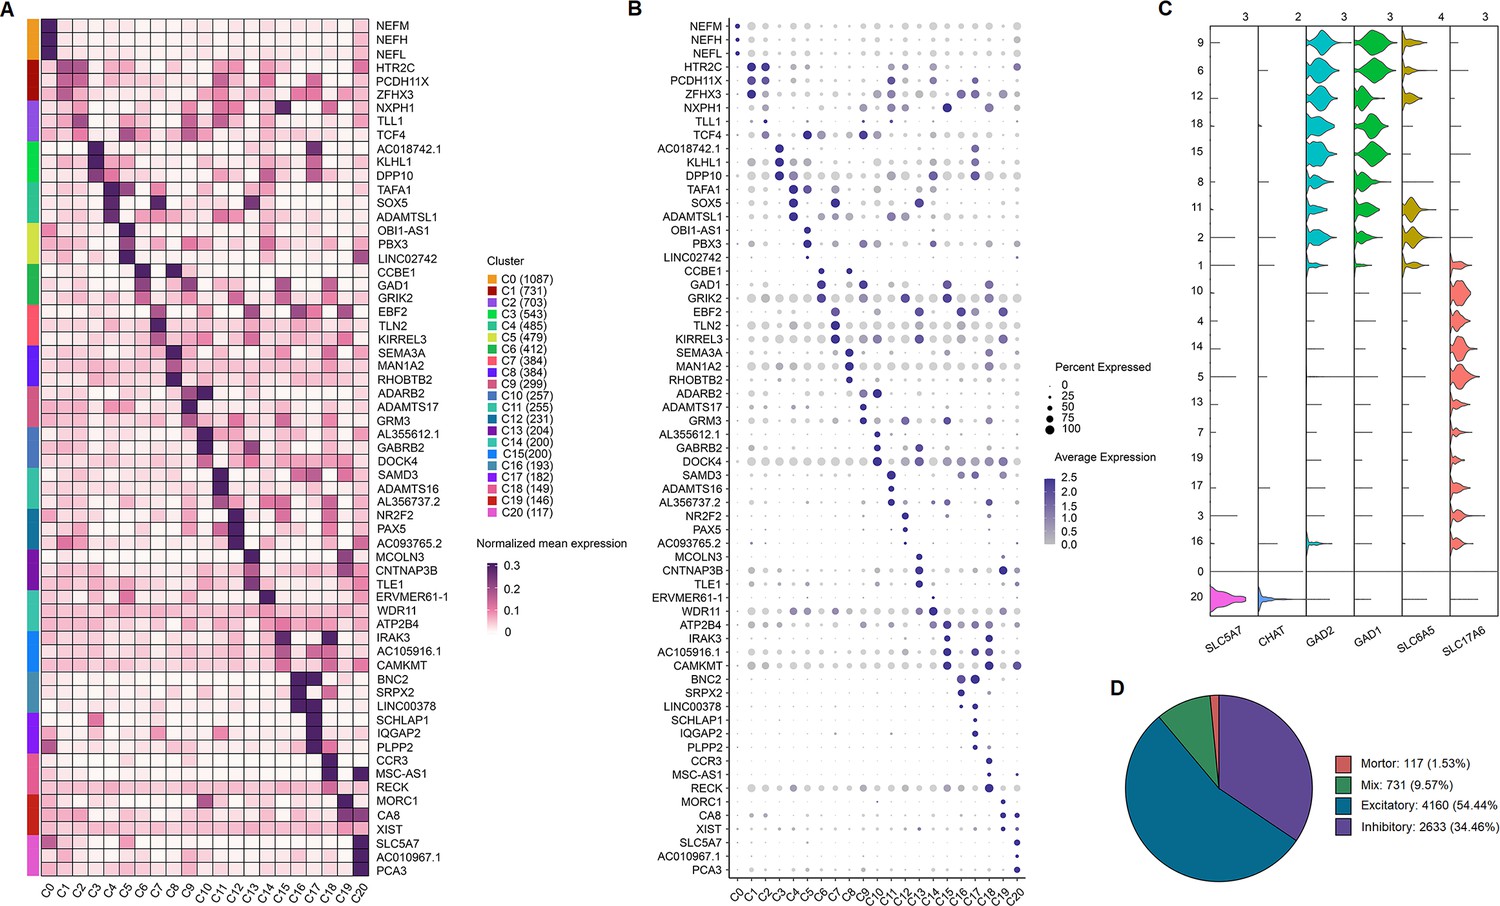
The gene expression features in 21 neuronal subtypes of human spinal cord.
(A) Heatmap showing the expression of the top three most differentially expressed genes across different human spinal neuronal clusters.(B) Dot plot showing the expression of the top three most differentially expressed genes across different spinal neuronal clusters. (C) Violin plot showing the expression of excitatory, inhibitory, and cholinergic marker genes across all 21 neuronal clusters in the human spinal cord. (D) The component percentage of different clusters according to neurotransmitter status. Mix, mixed excitatory and inhibitory clusters.
Figure 3—figure supplement 2
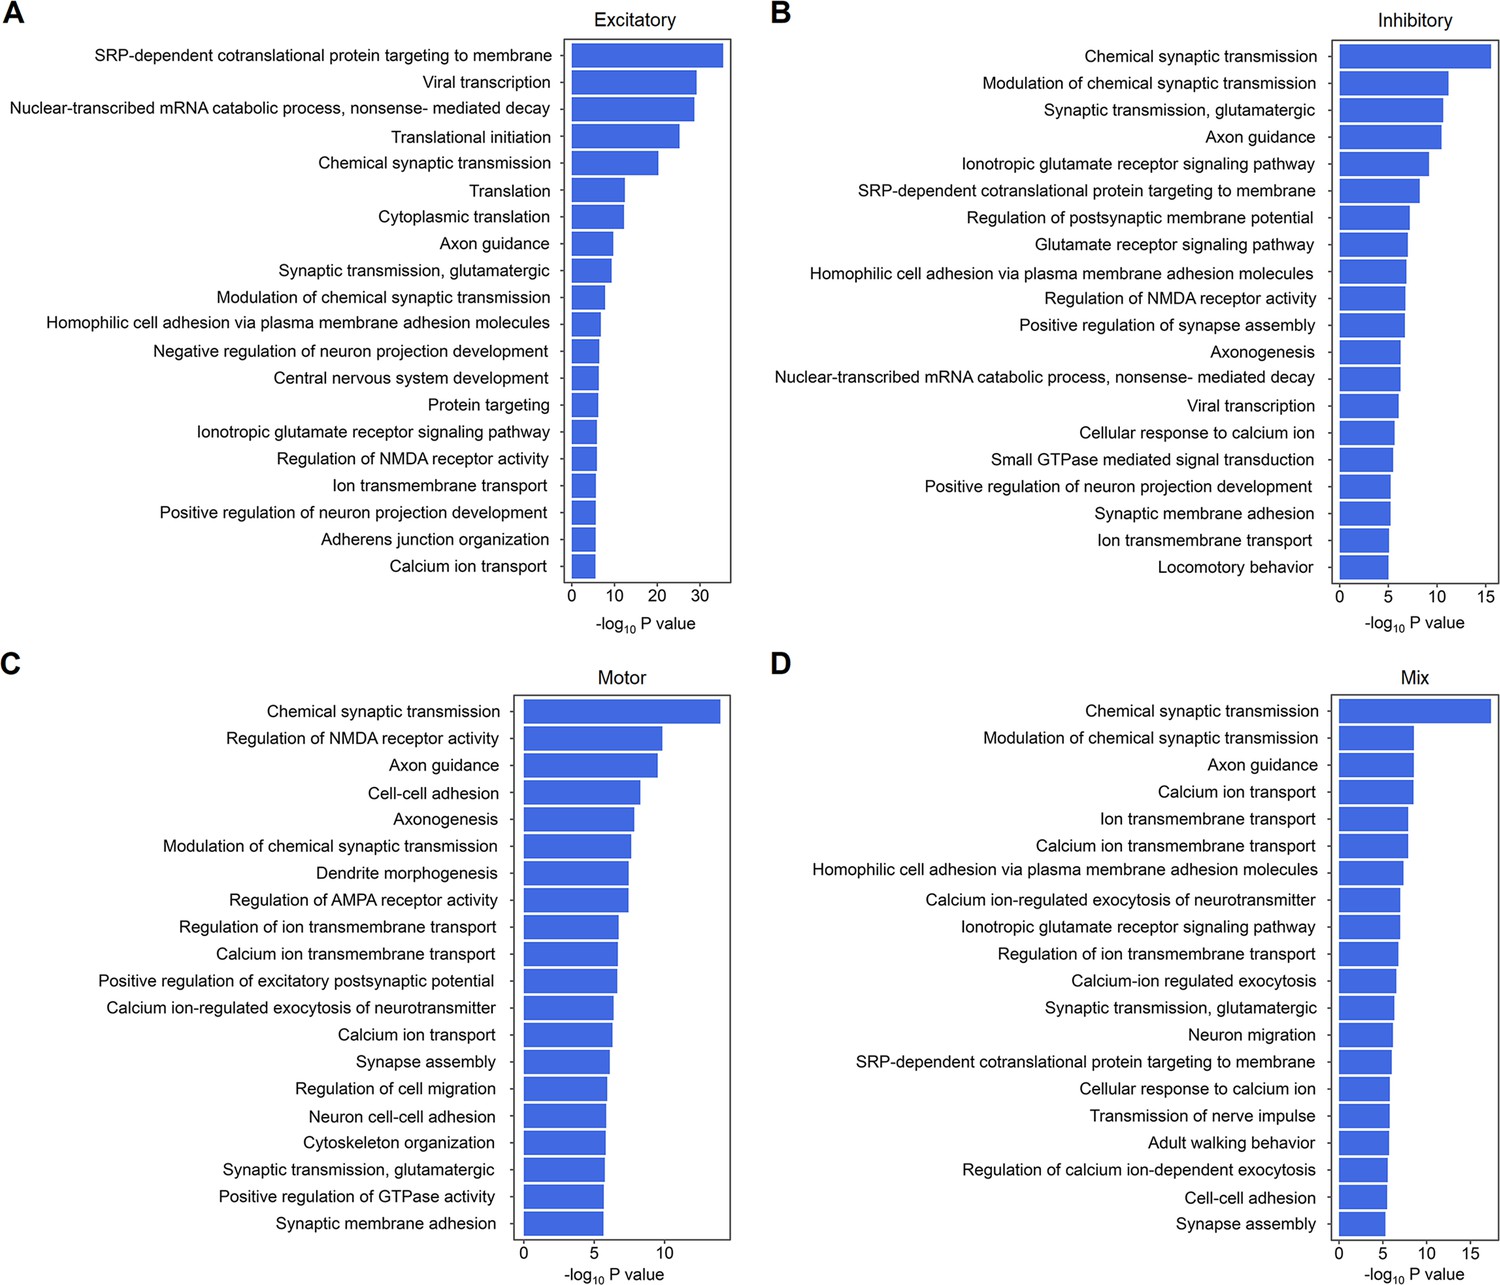
GO term analysis for four functional subpopulations in human spinal cord.
(A–D) Summarized GO terms among the top genes in excitatory (A), inhibitory (B), motor (C), and mixed excitatory and inhibitory (D) clusters of the human spinal cord. GO, Gene Ontology.
Figure 3—figure supplement 3
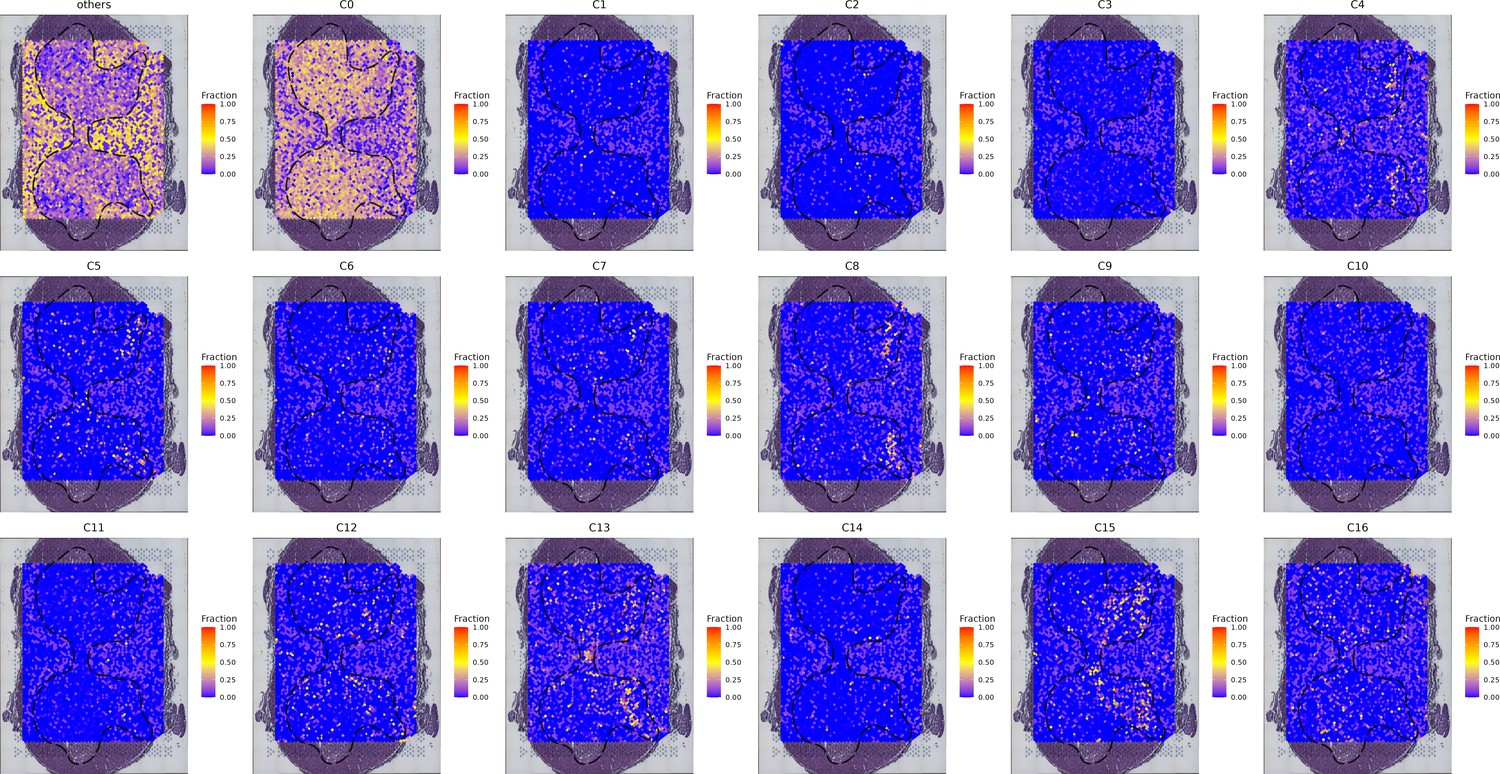
The spatial spot showing the distribution pattern of 21 neuronal clusters in the human spinal cord.
The color scale represents the probable percentage of single-nucleus RNA-seq data that mapped to spatial spots. For a specific spot, the sum of the probable percentage of C0-C20 was defined as 1.
Figure 3—figure supplement 4
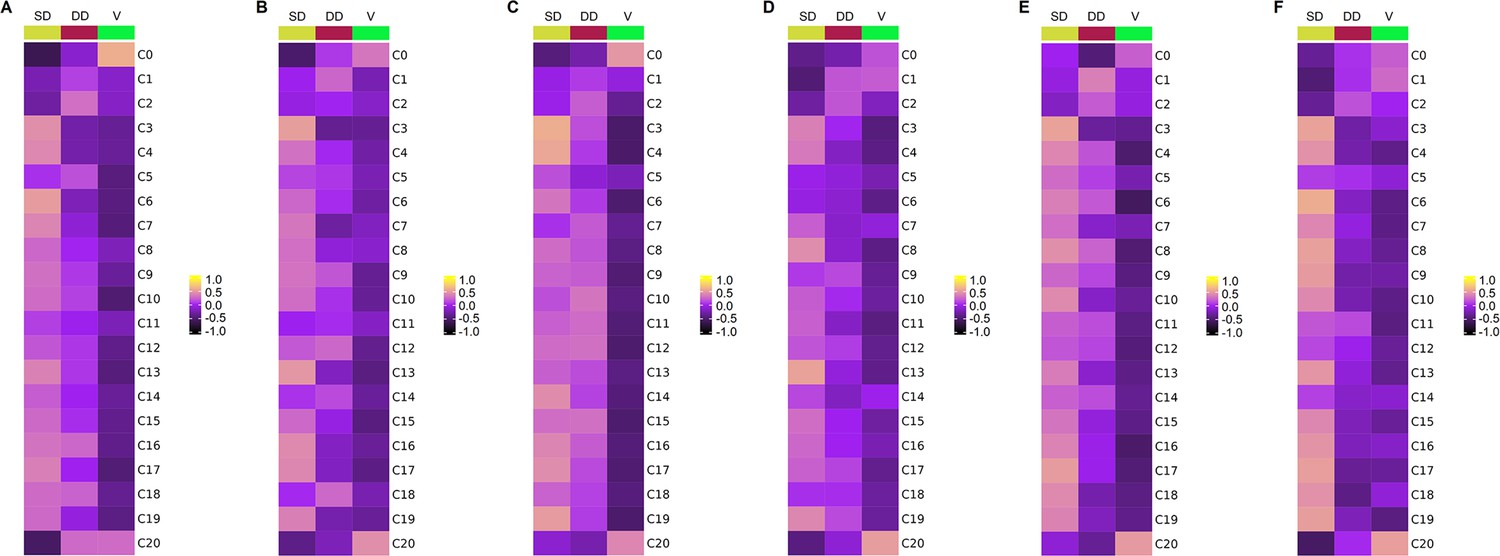
The spatial distribution patterns of neuronal clusters in different spinal subregions of each donor.
(A–F) Gene set variation analysis (GSVA) showing the spatial distribution patterns of neuronal clusters in different subregions of coronal sections from the lumber spinal cord of each human donor. The color scale represents the enrichment scores. SD, superficial dorsal horn; DD, deep dorsal horn; V, ventral horn.
Figure 3—figure supplement 5
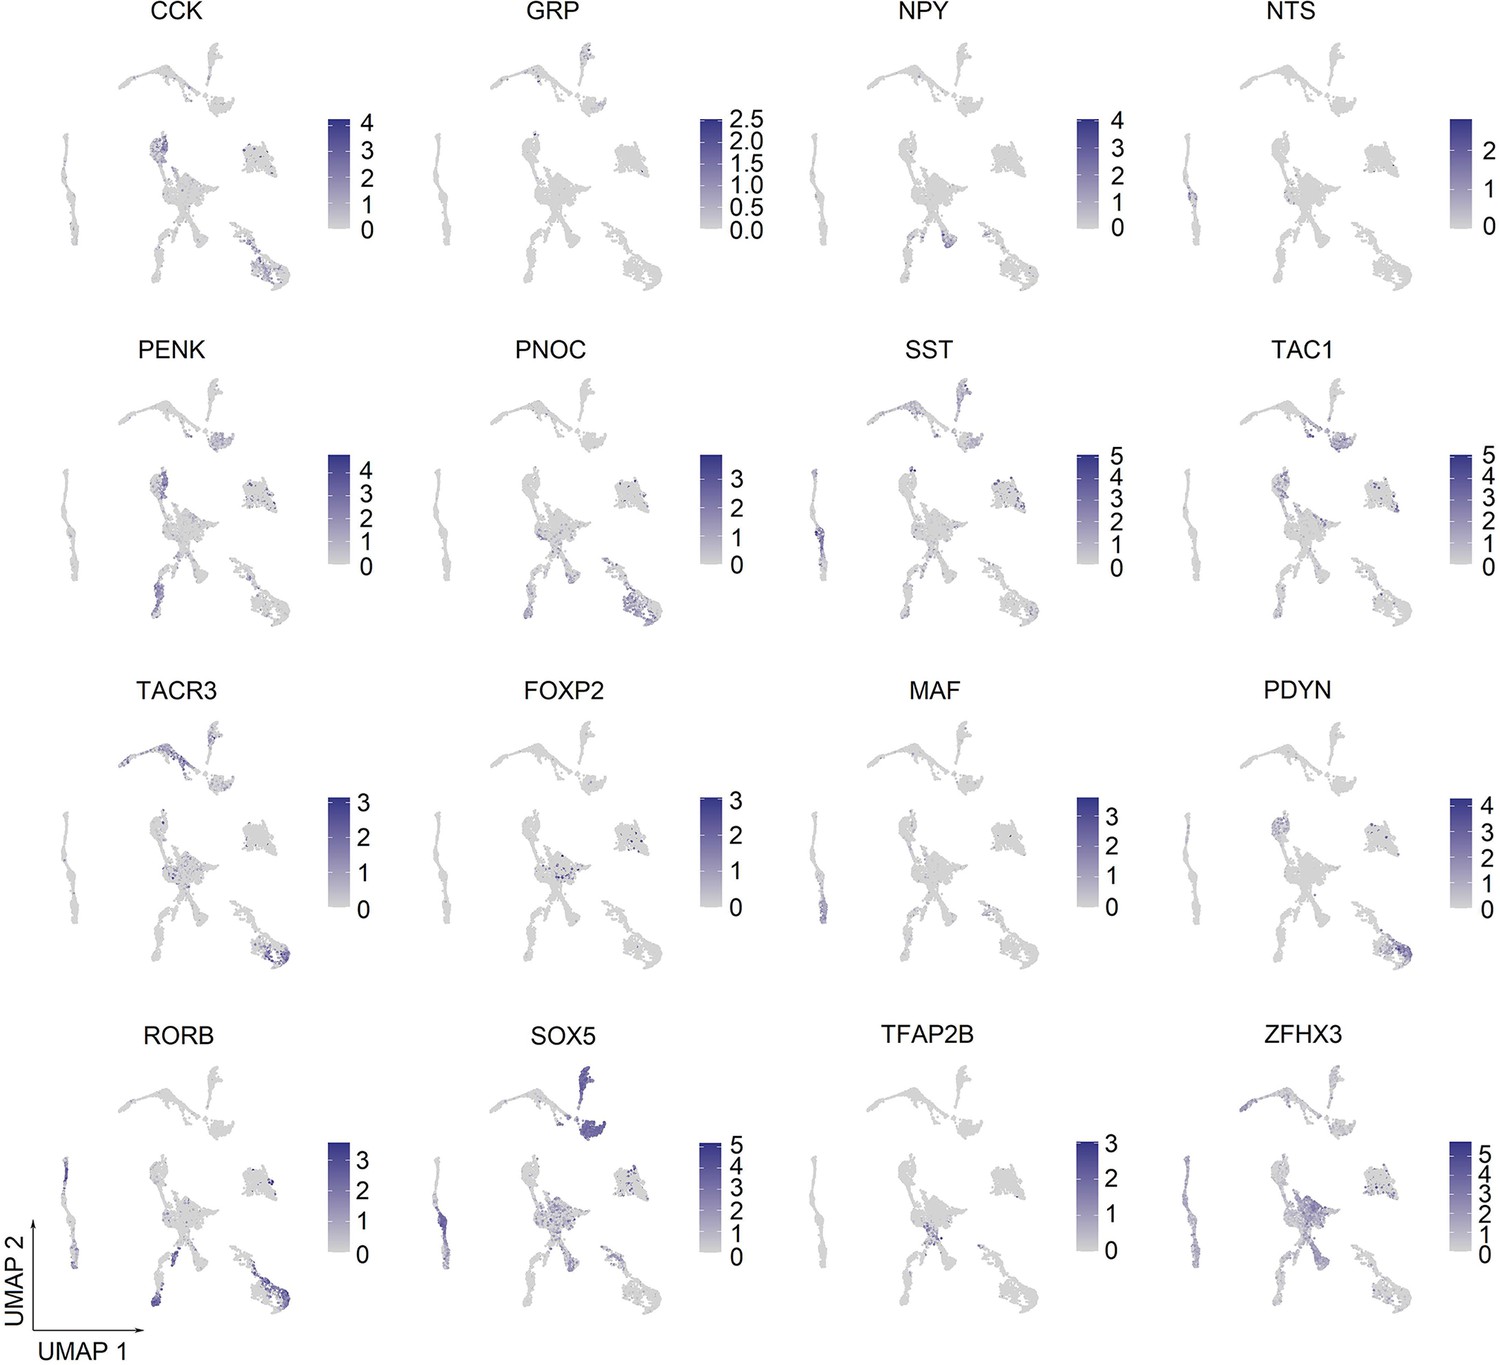
UMAP plot showing the expression of representative marker genes in human spinal neuronal clusters.
UMAP, uniform manifold approximation and projection.
Figure 3—figure supplement 6
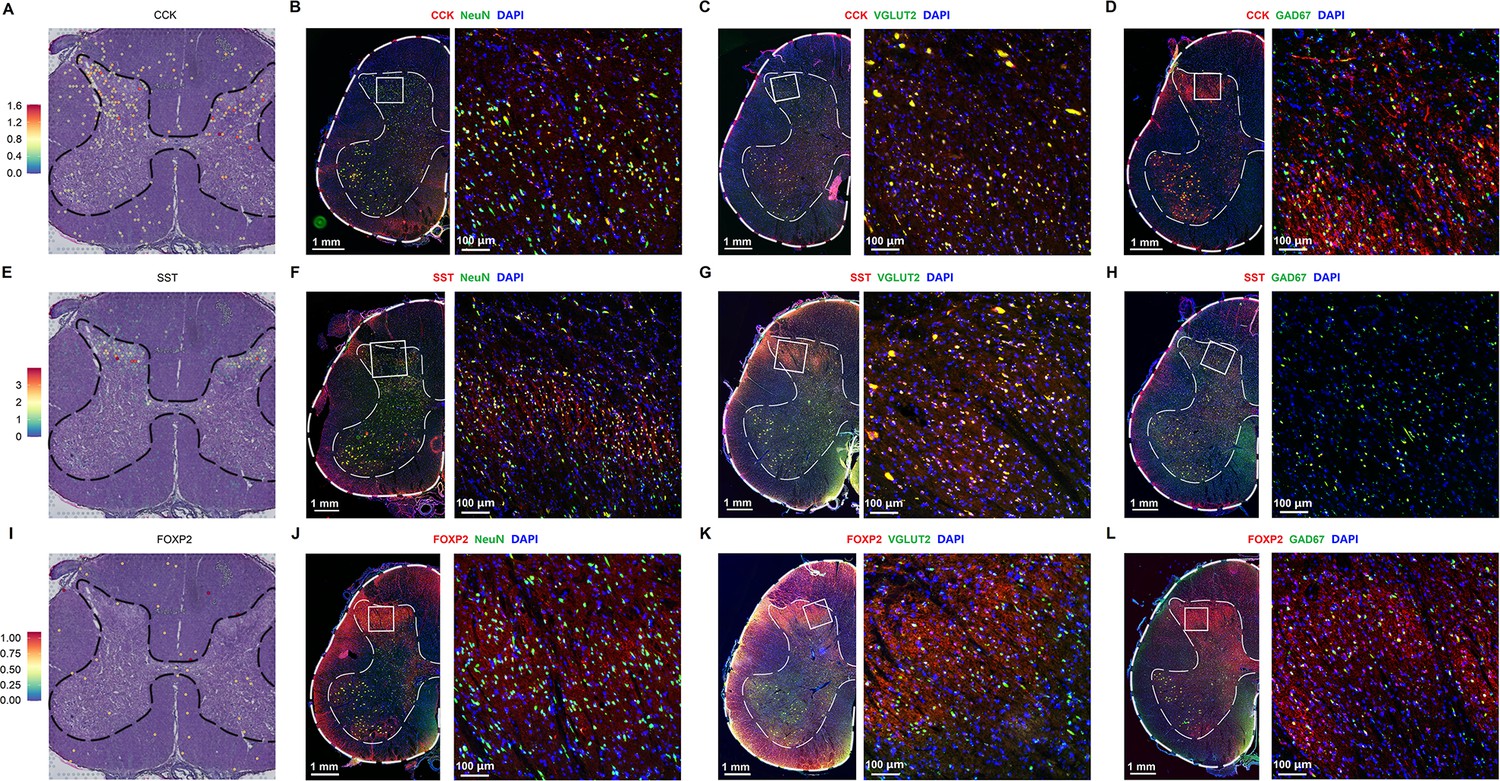
Immunofluorescence results of CCK, SST, and FOXP2.
(A) Representative section showing the spatial distribution of CCK in the human spinal cord. (B) Representative immunofluorescence images of CCK in human spinal neurons. (C, D) Representative immunofluorescence images of CCK in excitatory (VGLUT2, C) and inhibitory (GAD67, D) neurons of the human spinal cord. (E) Representative section showing the spatial distribution of SST in the human spinal cord. (F) Representative immunofluorescence images of SST in human spinal neurons. (G, H) Representative immunofluorescence images of SST in excitatory (VGLUT2, G) and inhibitory (GAD67, H) neurons of the human spinal cord. (I) Representative section showing the spatial distribution of FOXP2 in the human spinal cord. (J) Representative immunofluorescence images of FOXP2 in human spinal neurons. (K, L) Representative immunofluorescence images of FOXP2 in excitatory (VGLUT2, K) and inhibitory (GAD67, L) neurons of the human spinal cord.
Figure 4 with 3 supplements
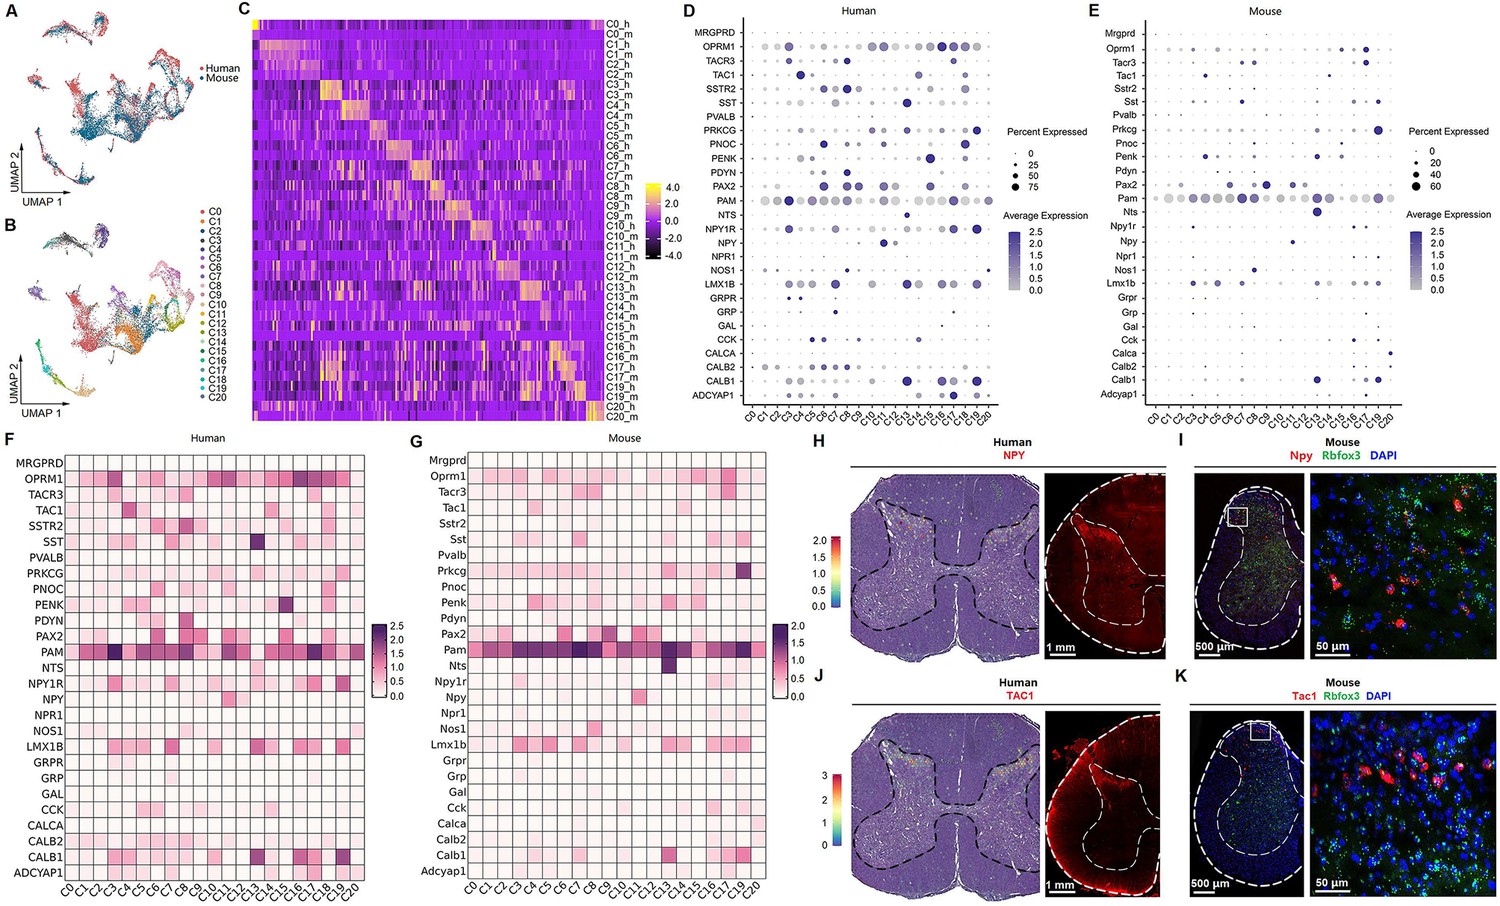
Human–mouse cell-type homology.
(A) UMAP plot showing the coclustering of mouse and human neurons. Dots, individual cells. Colors, species. (B) UMAP plot showing the distribution of putative homologous neuronal clusters of humans and mice. Dots, individual cells. Colors, clusters. (C) Heatmap of conserved cell-type-specific gene expression (columns) in human and mouse cell types (rows; m, mouse; h, human). Genes in each species are included in the heatmap if they are significantly enriched in a cluster compared to all other clusters (FDR < 0.01, top 50 genes by log2-fold change [FC] per cell type). (D, E) Dot plot showing the expression of classical marker genes in the human (D) and mouse (E) spinal cord. (F, G) Heatmap showing the expression of classical marker genes in the human (F) and mouse (G) spinal cord. (H) Representative image showing the distribution of NPY-positive spots in the human spinal cord (left) and representative immunofluorescence image of NPY in a coronal cryosection of the human lumber spinal cord (right). (I) Representative RNAscope in situ hybridization images of Npy and Rbfox3 in a coronal cryosection of mouse lumber spinal cord. (J) Representative image showing the distribution of TAC1-positive spots in the human spinal cord (left) and representative immunofluorescence image of TAC1 in a coronal cryosection of the human lumber spinal cord (right). (K) Representative RNAscope in situ hybridization images of Tac1 and Rbfox3 in a coronal cryosection of mouse lumber spinal cord. UMAP, uniform manifold approximation and projection.
Figure 4—figure supplement 1

Expression of top 20 most differentially expressed genes in the functional subtypes of human and mouse spinal cord.
(A, B) Dot plot showing the expression of the top 20 most differentially expressed genes between excitatory, inhibitory, and cholinergic clusters of the spinal cord in humans (A) and mice (B).
Figure 4—figure supplement 2
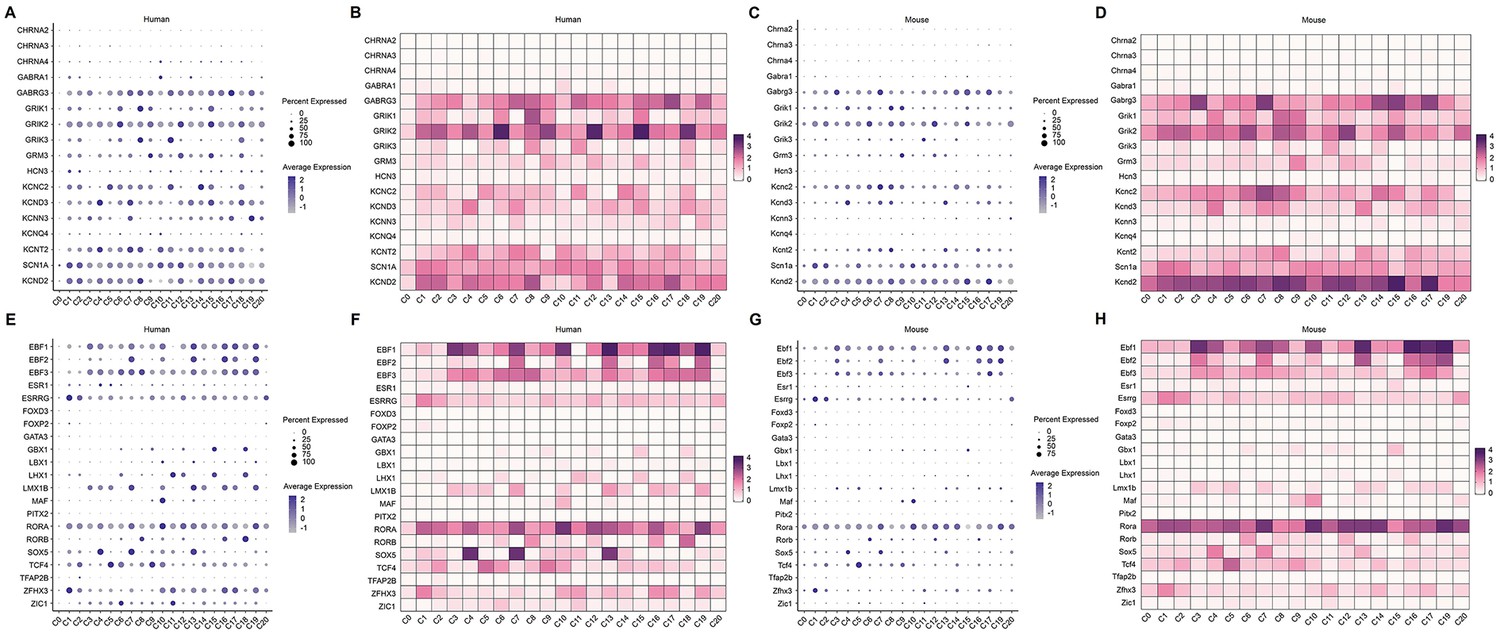
Expression of classic ion channels and transcription factors in human and mouse spinal neuronal clusters.
(A, B) Dot plot (A) and heatmap (B) showing the expression of classic ion channels in human spinal neuronal clusters. (C, D) Dot plot (C) and heatmap (D) showing the expression of classic ion channels in mouse spinal neuronal clusters. (E, F) Dot plot (E) and heatmap (F) showing the expression of classic transcription factors in human spinal neuronal clusters. (G, H) Dot plot (G) and heatmap (H) showing the expression of classic transcription factors in mouse spinal neuronal clusters.
Figure 4—figure supplement 3

Expression of selected marker genes in human spinal neuronal clusters.
(A–L) UMAP plot showing the broad (A–I) or low (J–L) expression of selected marker genes in human spinal neuronal clusters. UMAP, uniform manifold approximation and projection.
Figure 5
Sex differences in gene expression in human spinal neuronal types.
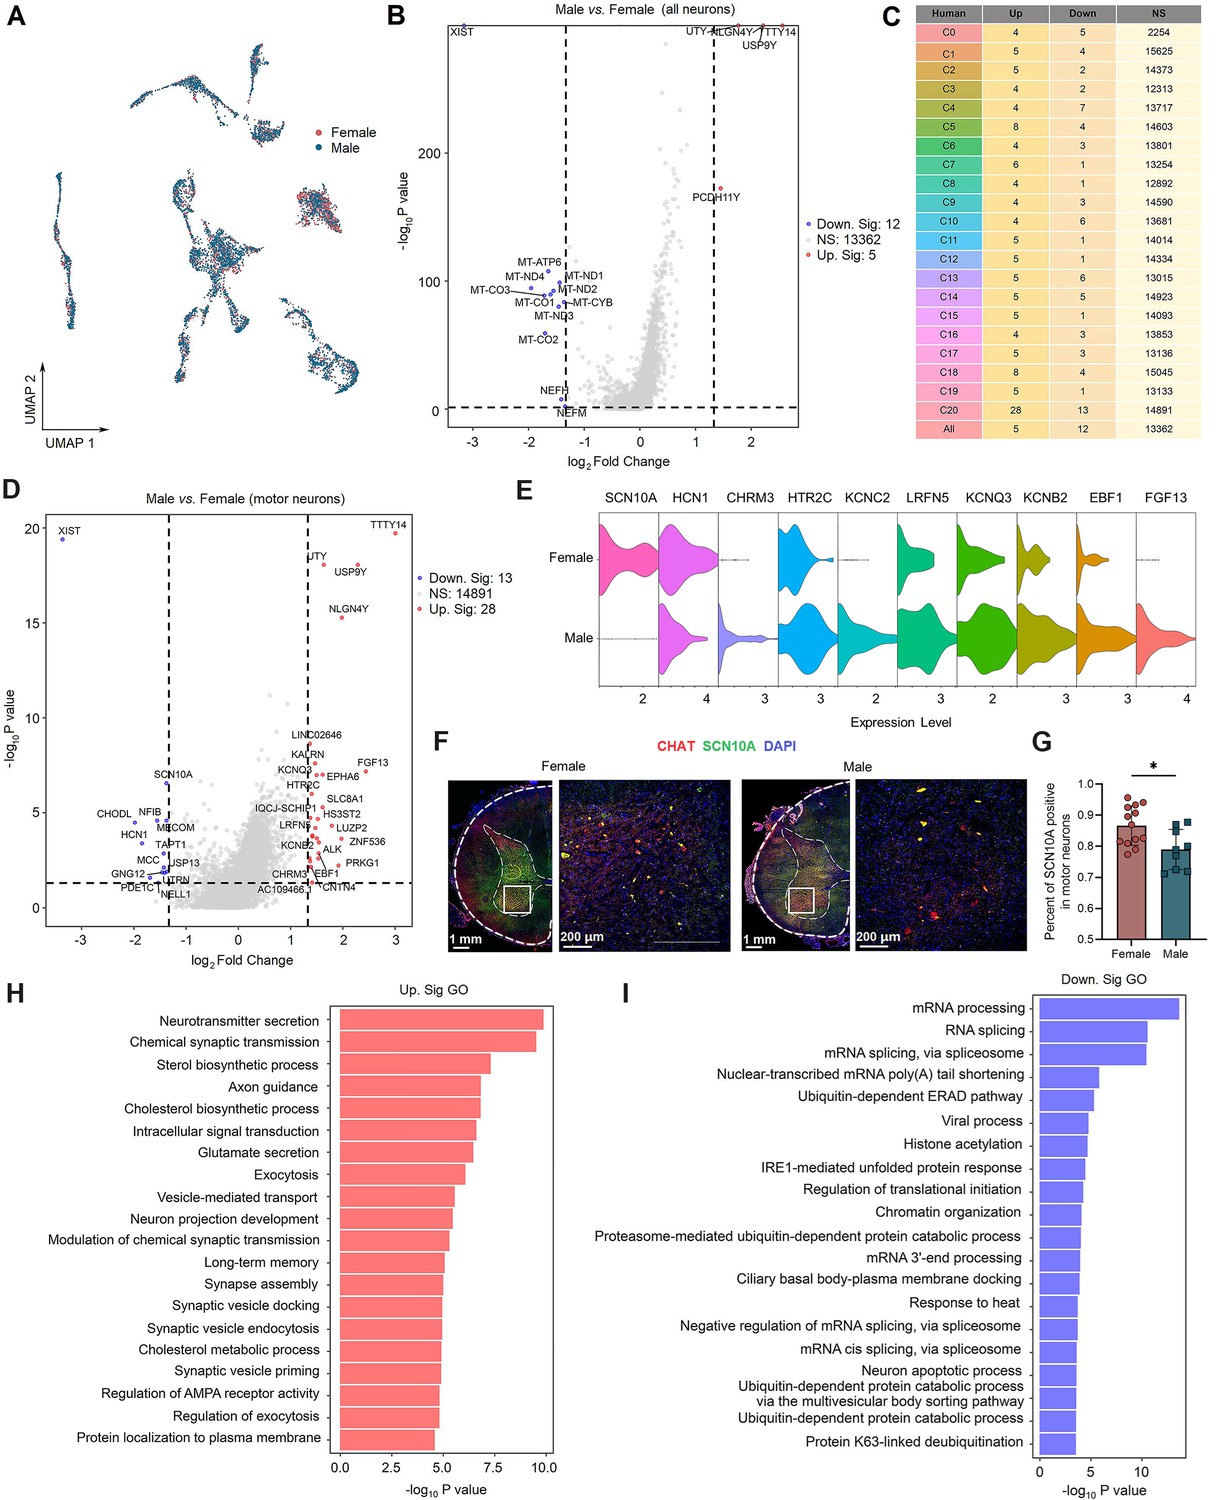
(A) UMAP plot showing barcodes in all spinal neuronal clusters from males and females. Dots, individual cells. Colors, sexes. (B) Volcano plot showing DEGs of all spinal neurons between males and females. (C) A summary table showing the number of DEGs for specific neuronal types between males and females. (D) Volcano plot showing DEGs in C20 (motor neurons) between males and females. (E) Violin plot showing the expression of DEGs in males and females within the motor neurons. (F) Representative immunofluorescence images of SCN10A with CHAT (a marker of motor neurons) in male and female spinal cord. (G) The quantitative analysis of the percentage of CHAT neurons that expressing SCN10A in male and female spinal cord (9 slices from three males and 13 slices from three females, unpaired two-tailed Student’s t-test, p<0.05). (H, I) Summarized GO terms for upregulated DEGs (H) or downregulated DEGs (I) in male motor clusters compared to females. DEGs were considered if FC ≥ 1.33 and adjusted p<0.05. GO, Gene Ontology; NS, no significance; UMAP, uniform manifold approximation and projection; DEGs, differentially expressed genes.
Figure 6 with 1 supplement
Identification of human DRG cell types from spatial transcriptomics.
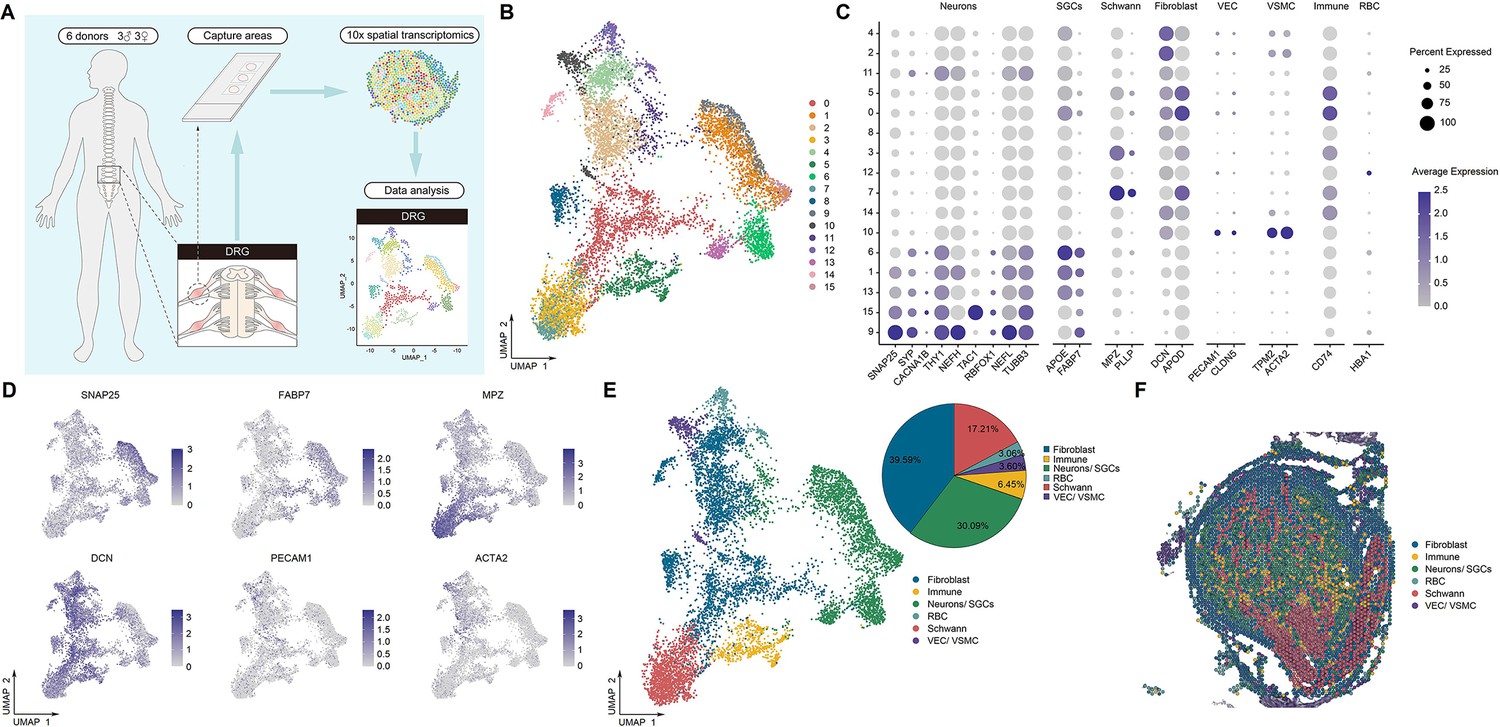
(A) Overview of the experimental workflow for spatial transcriptomics in human DRG. (B) UMAP plot showing 16 cell types in the spinal cord. Dots, individual spots; colors, cell types. (C) Dot plot showing the expression of representative marker genes across all cell types. (D) UMAP plot showing the expression of representative marker genes. (E) UMAP plot showing six major DRG cell types and their percentages. Dots, individual spots; colors, cell types. (F) Representative section showing the spatial distribution of six major cell types in the DRG. Dots, individual spots; colors, cell types. DRG, dorsal root ganglia; RBCs, red blood cells; VECs, vascular endothelial cells; VSMCs, vascular smooth muscle cells; SGCs, satellite glial cells; UMAP, uniform manifold approximation and projection.
Figure 6—figure supplement 1
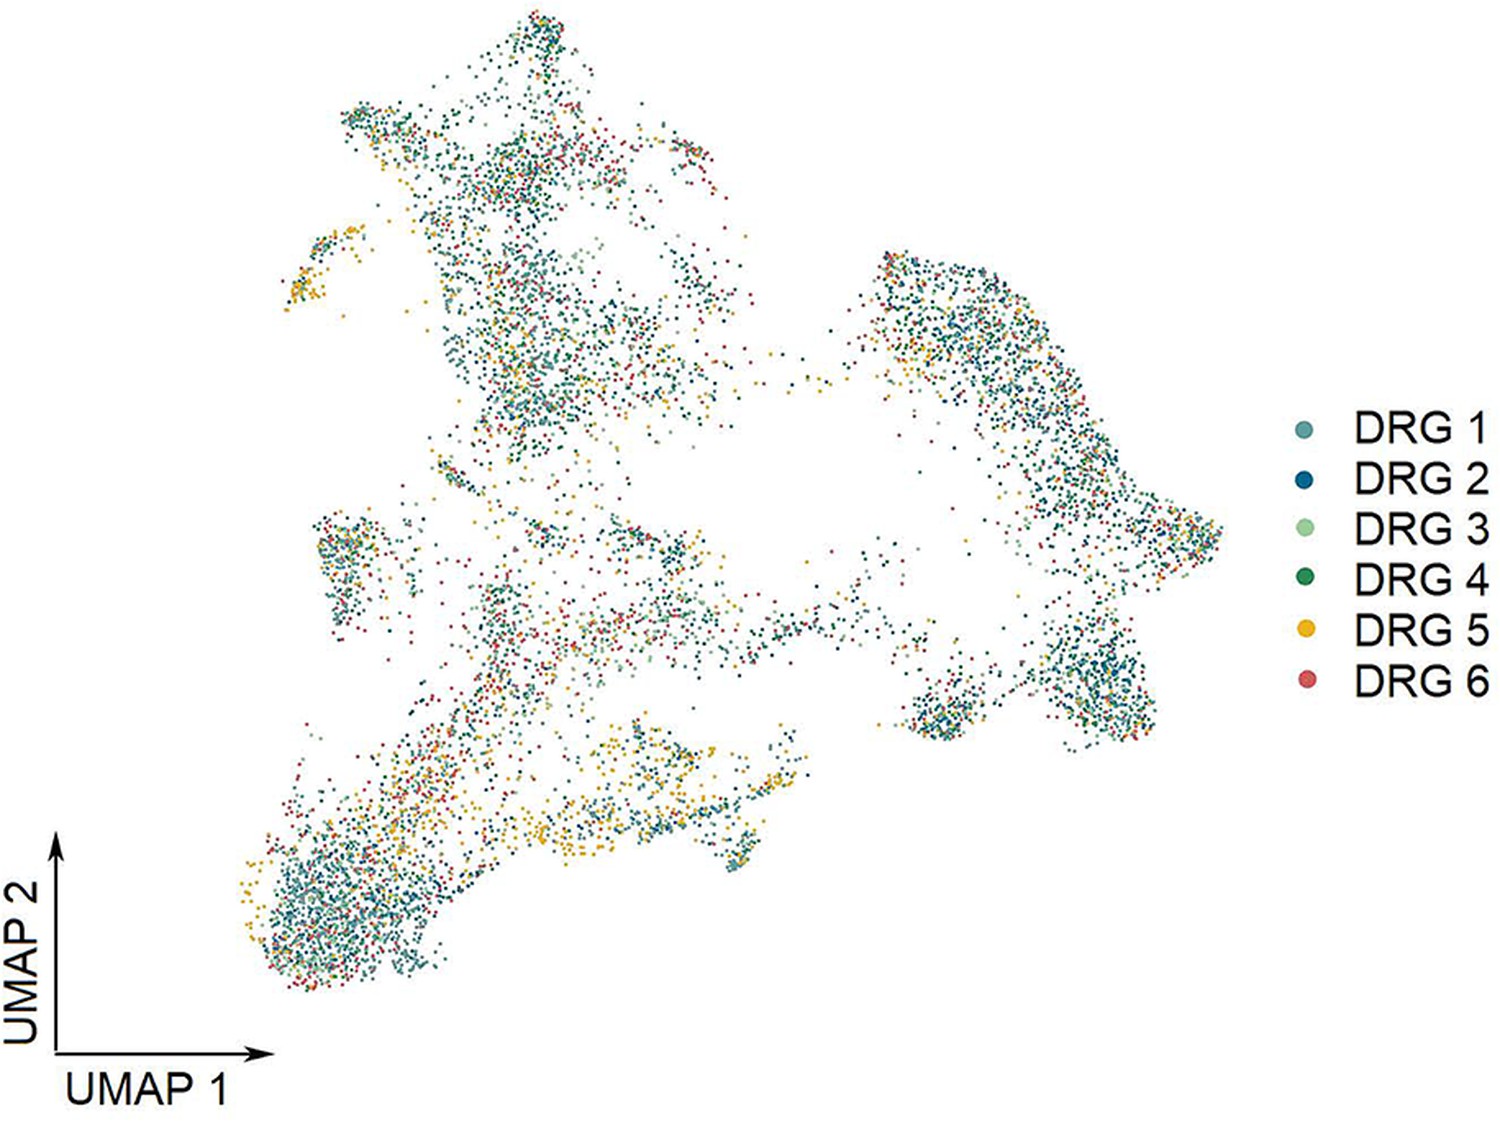
UMAP plot showing the contribution of each donor to cluster formation in the DRG by spatial transcriptomics.
UMAP, uniform manifold approximation and projection; DRG, dorsal root ganglia.
Figure 7 with 4 supplements
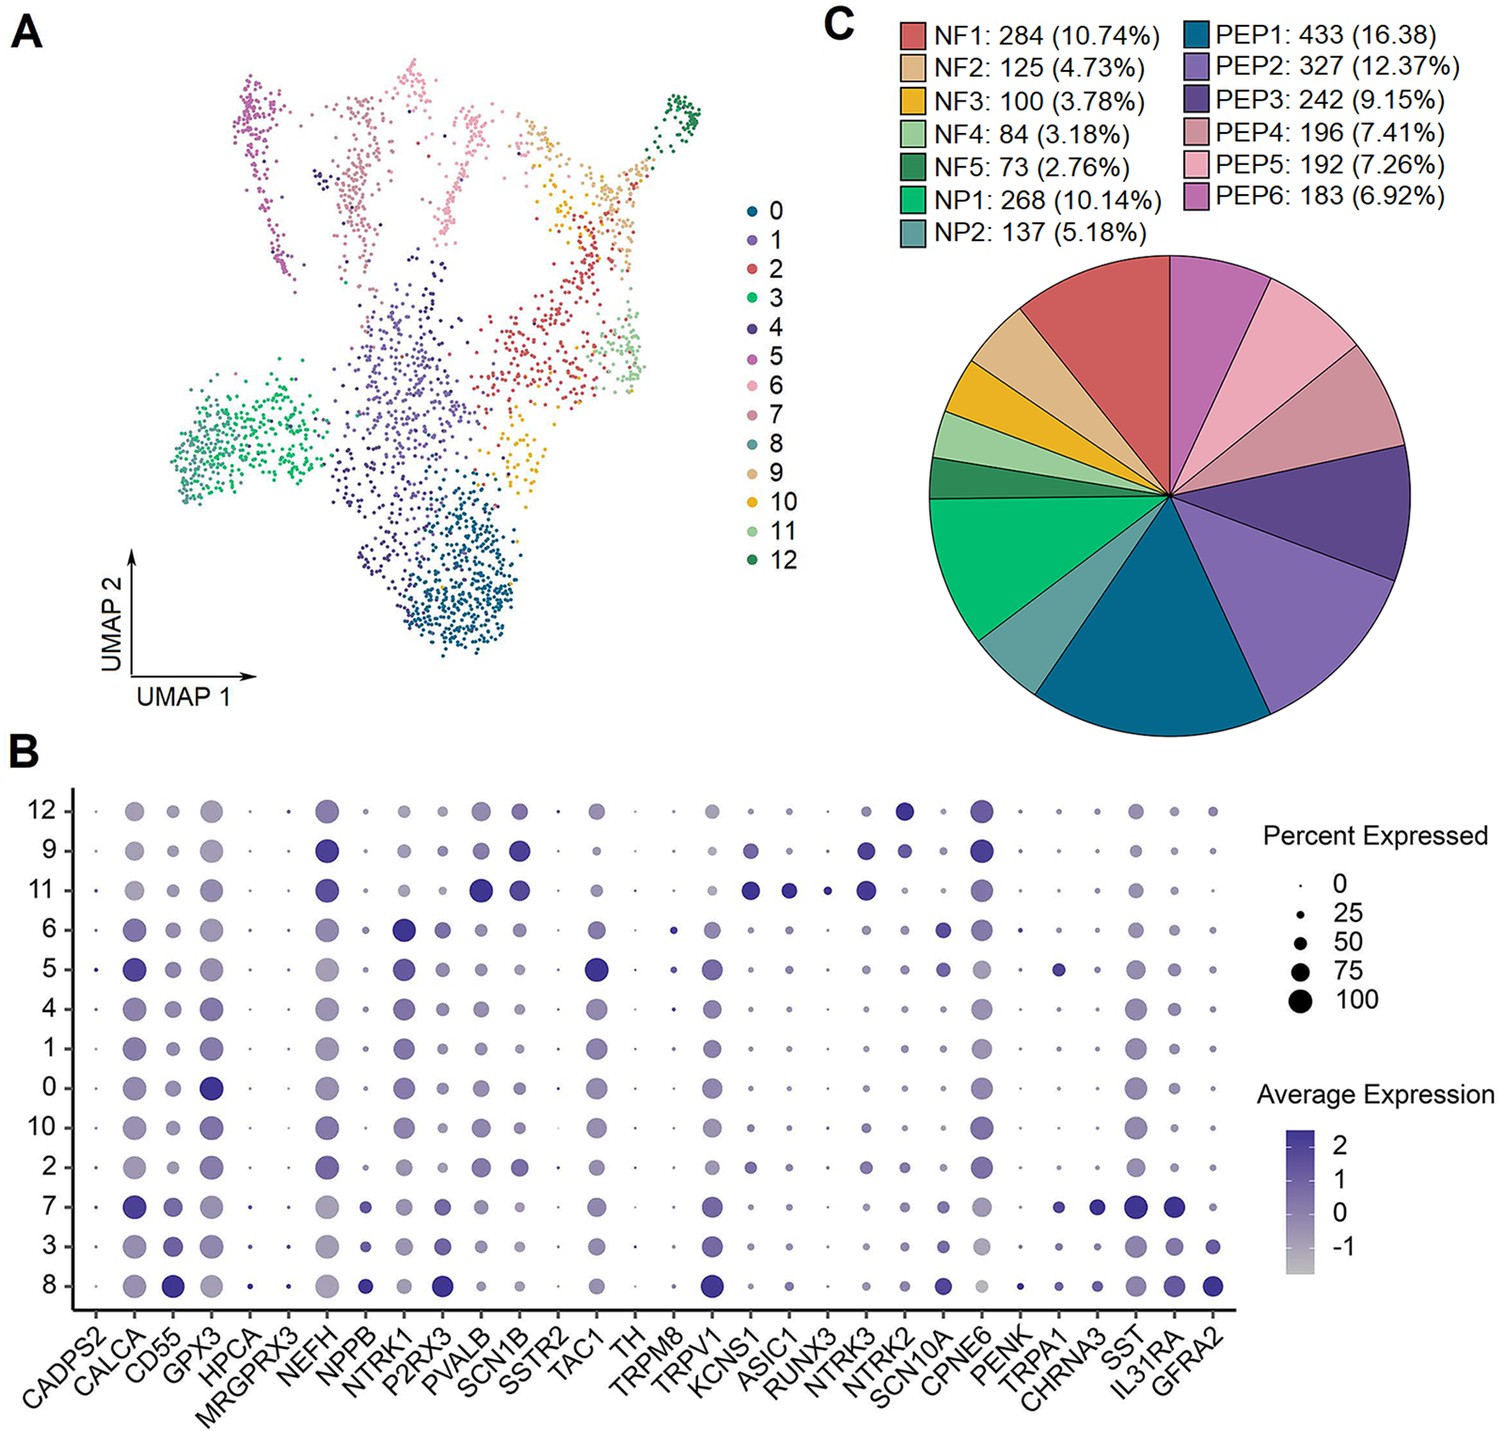
Identification of neuronal subtypes in human DRG.
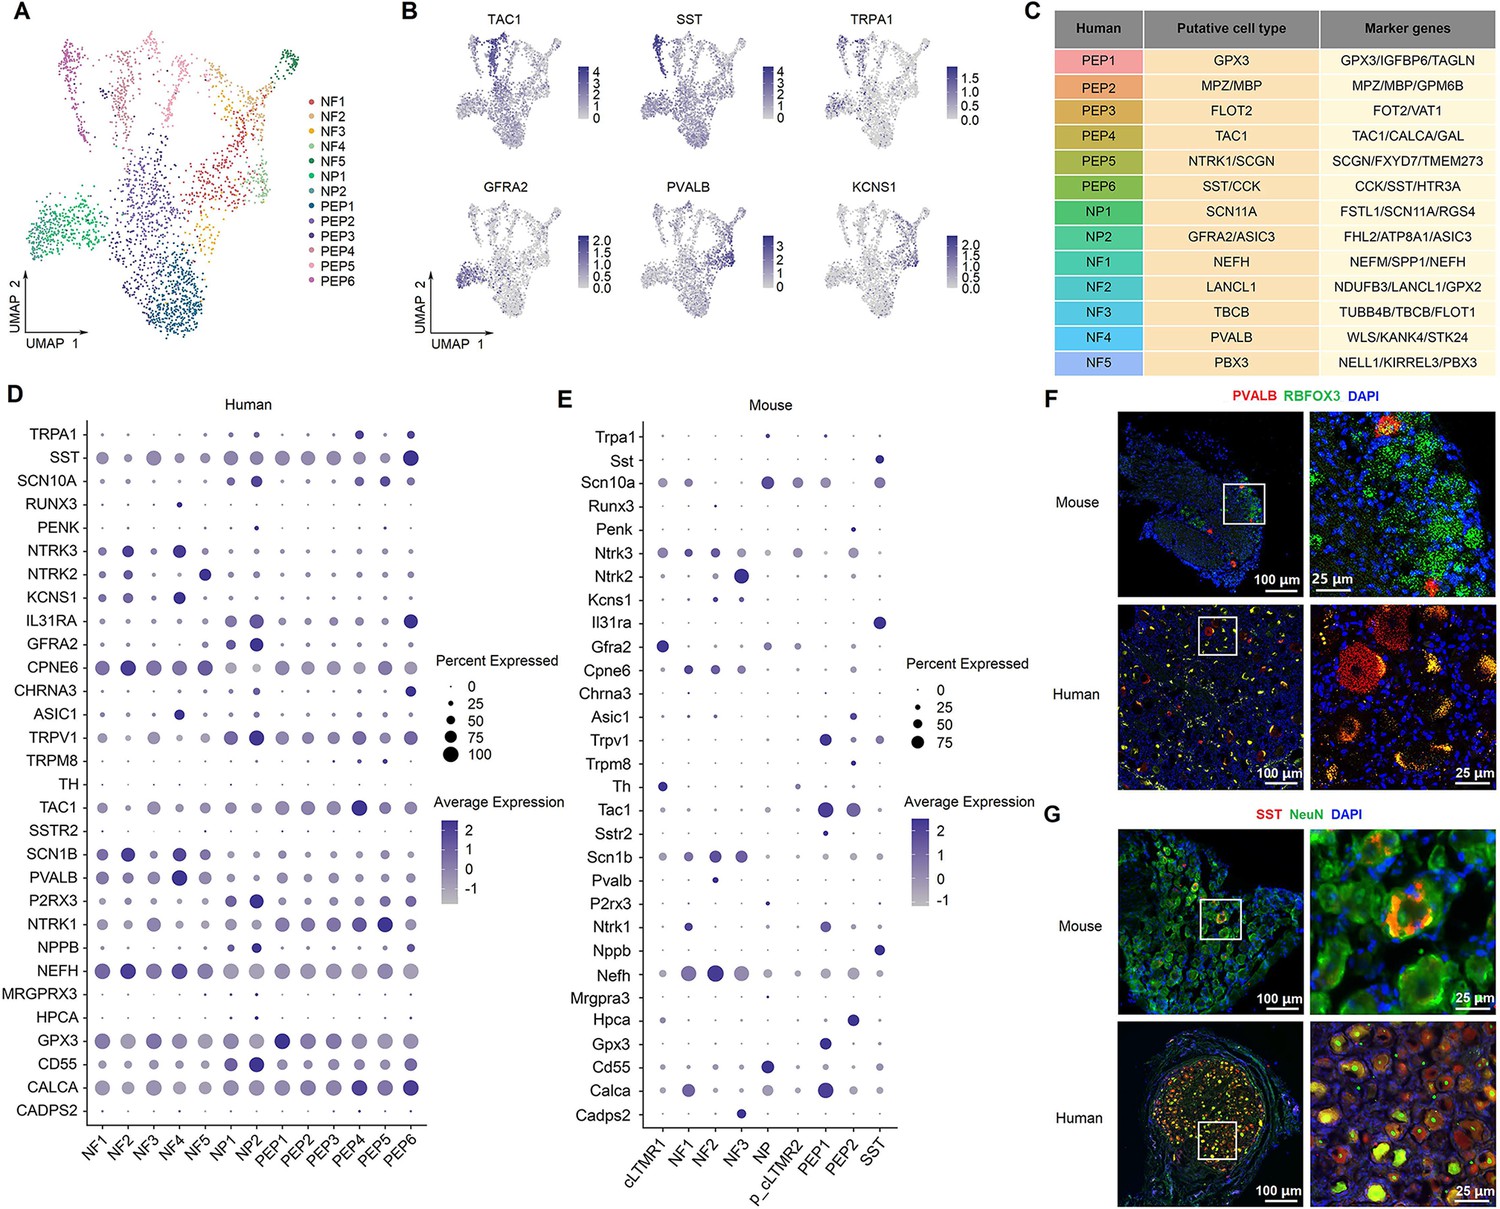
(A) UMAP plot showing 13 neuronal clusters of human DRG neurons. Dots, individual spots; colors, neuronal clusters. (B) UMAP plot showing the expression of representative marker genes. (C) Putative DRG neuronal types and their representative marker genes. (D, E) Dot plot showing the expression of classical marker genes in human (D) and mouse (E) DRG neuronal clusters. (F) Representative RNAscope in situ hybridization images of PVALB and RBFOX3 in mouse (top) and human (bottom) DRG. (G) Representative immunofluorescence images of SST and NeuN in mouse (top) and human (bottom) DRG. DRG, dorsal root ganglia; NF, neurofilament neurons; PEP, peptidergic neurons; NP, nonpeptidergic neurons; UMAP, uniform manifold approximation and projection.
Figure 7—figure supplement 1
The gene expression features in 13 neuronal subtypes of human DRG.
(A) UMAP plot showing 13 types of human DRG neurons.Dots, individual spots; colors, cell types. (B) Dot plot showing the expression of representative marker genes across all DRG neuronal subtypes. (C) The component percentage of DRG neuronal subtypes. UMAP, uniform manifold approximation and projection; DRG, dorsal root ganglia.
Figure 7—figure supplement 2
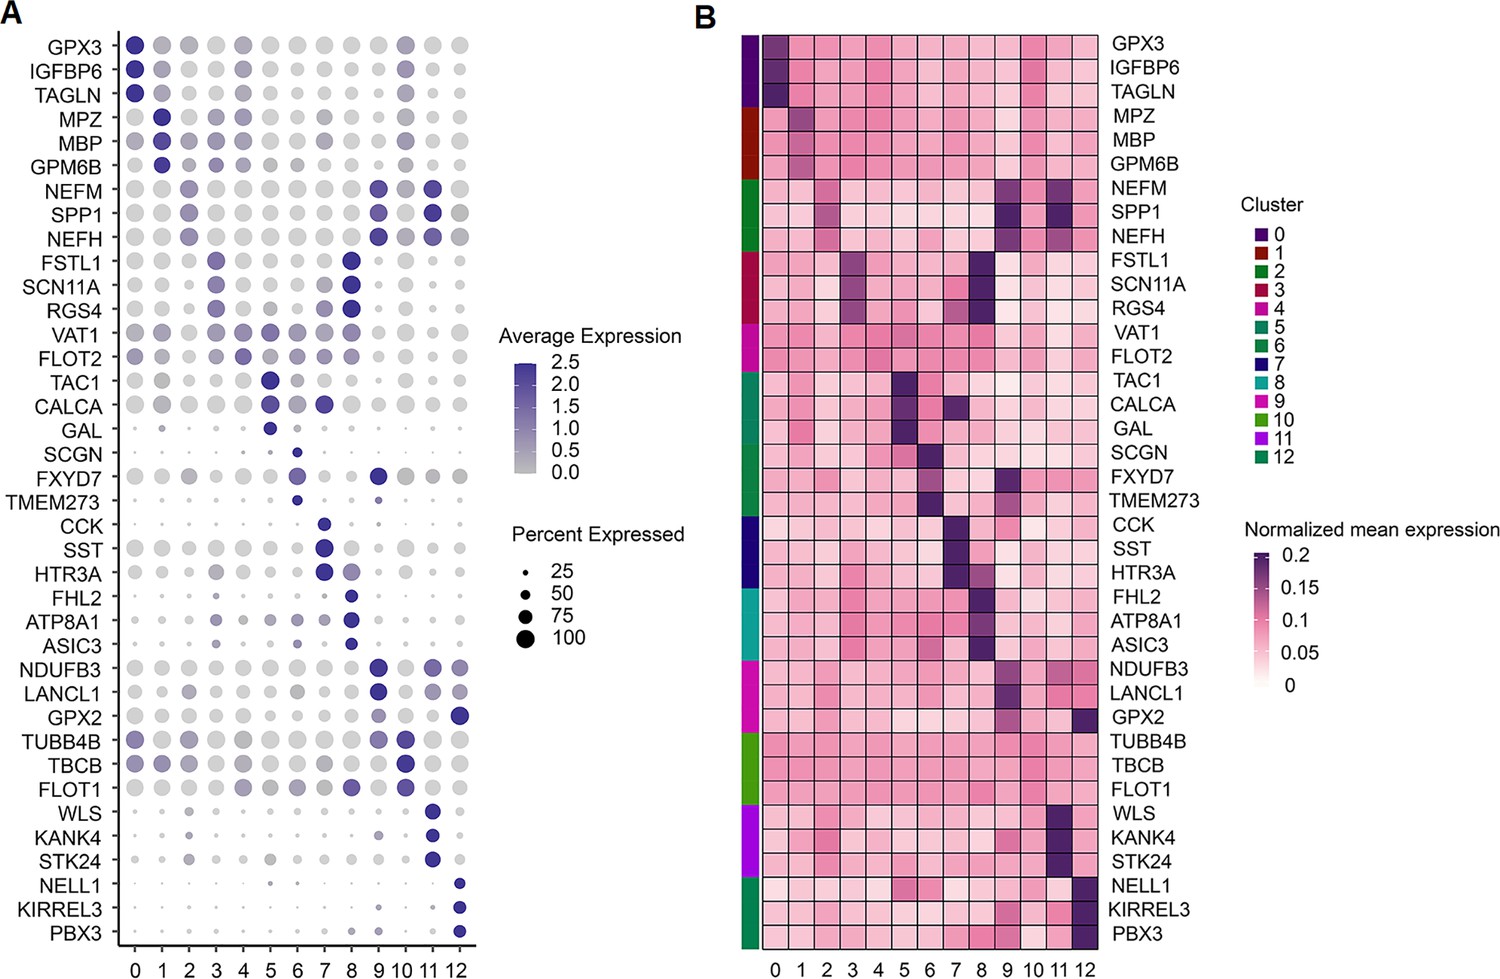
Expression of the top 3 most differentially expressed genes across human DRG neuronal subclusters.
(A, B) Dot plot (A) and heatmap (B) showing the expression of the top three most differentially expressed genes across human DRG neuronal subclusters. DRG, dorsal root ganglia.
Figure 7—figure supplement 3

Expression of classical marker genes in human and mouse DRG neuronal clusters.
(A, B) Heatmap showing the expression of classical marker genes in human (A) and mouse (B) DRG neuronal clusters. DRG, dorsal root ganglia.
Figure 7—figure supplement 4
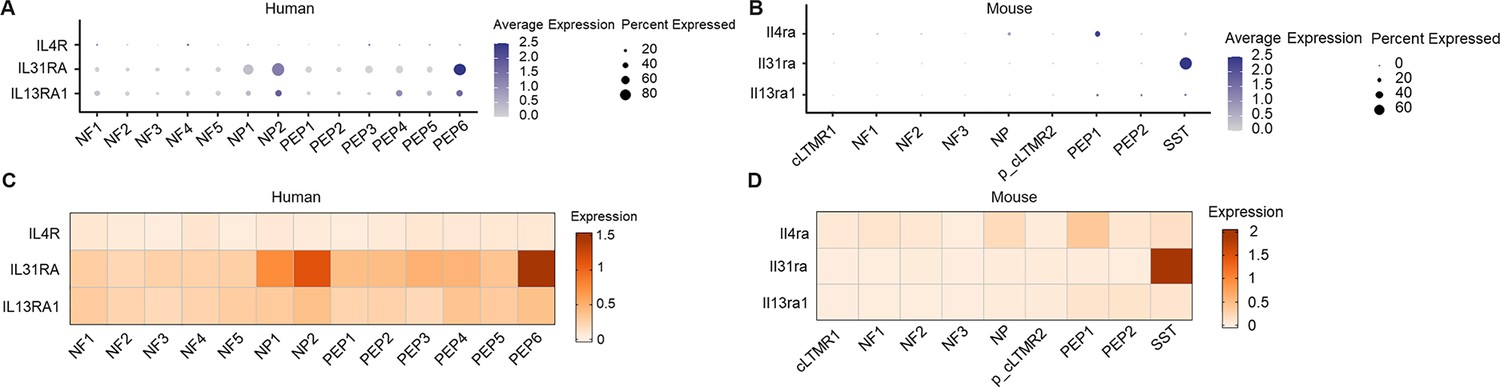
Expression of IL4R, IL31RA, and IL13RA1 in human and mouse DRG neuronal clusters.
(A, B) Dot plot showing the expression of IL4R, IL31RA, and IL13RA1 in human (A) and mouse (B) DRG neuronal clusters. (C, D) Heatmap showing the expression of IL4R, IL31RA, and IL13RA1 in human (C) and mouse (D) DRG neuronal clusters. DRG, dorsal root ganglia.
Figure 8
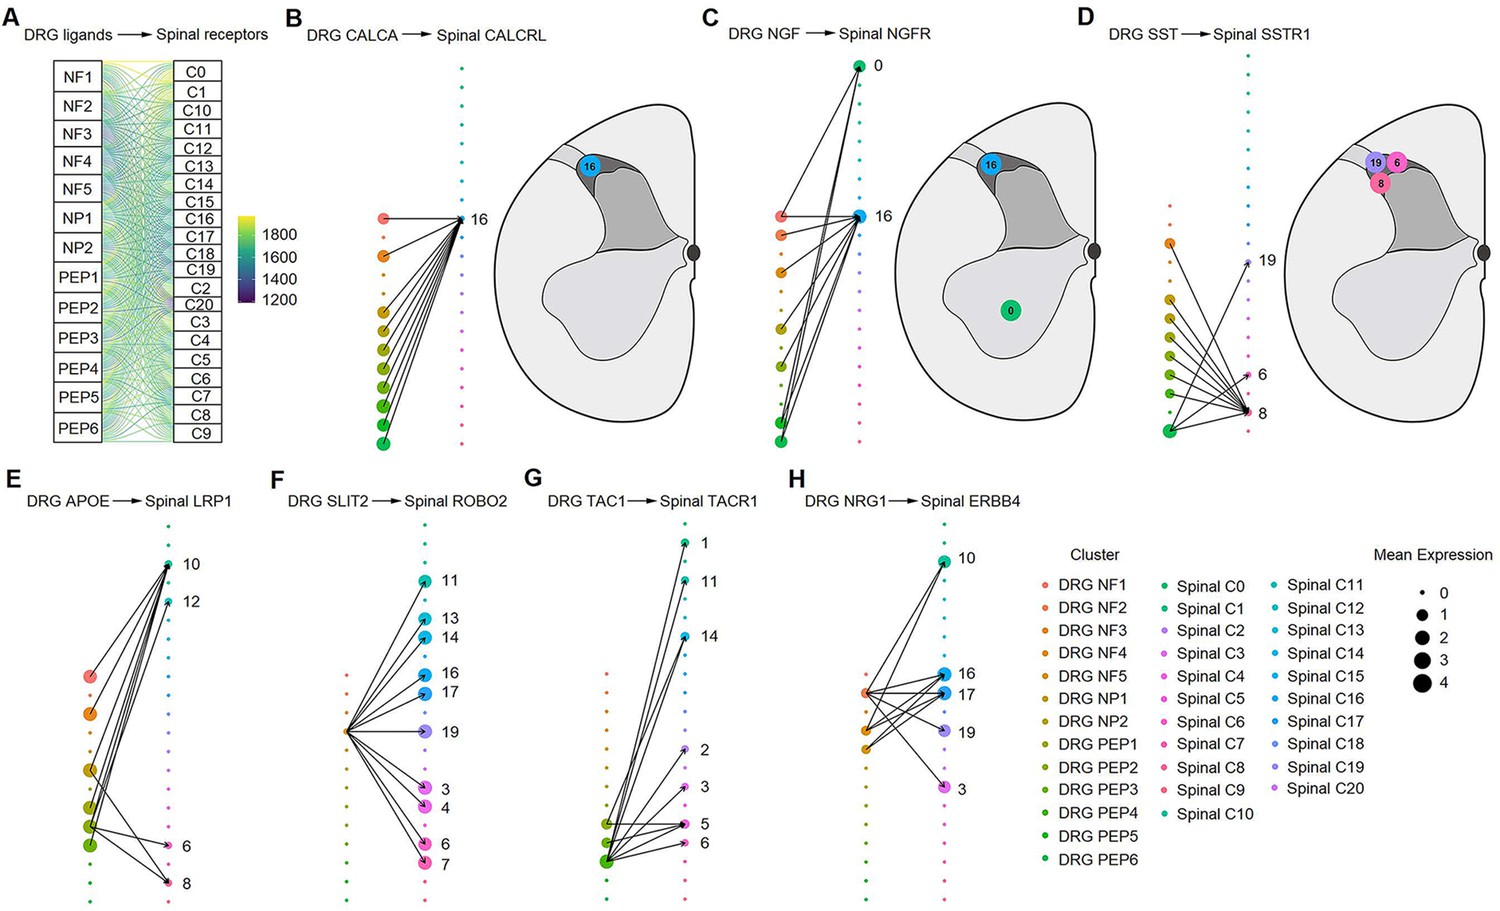
Ligand‒receptor interactions between the human DRG and spinal cord.
(A) Putative ligand‒receptor interactions of neuronal clusters between the human DRG and spinal cord. The thickness of connecting lines is proportional to the number of total ligand‒receptor interactions between the two connecting cell types. (B) DRG CALCA-spinal CALCRL interactions (left). The spatial location of the CALCRL-cluster (right). (C) DRG NGF-spinal NGFR interactions (left). The spatial location of the NGFR-cluster (right). (D) DRG SST-spinal SSTR1 interactions (left). The spatial location of the SSTR1-cluster (right). (E) DRG APOE-spinal LRP1 interactions. (F) DRG SLIT2-spinal ROBO2 interactions. (G) DRG TAC1-spinal TACR1 interactions. (H) DRG NRG1-spinal ERBB4 interactions. Dot size denotes relative expression of a gene in each cell type, and colors indicate cell type. Arrows between cell types denote the 10 highest ligand‒receptor scores. DRG, dorsal root ganglia; NF, neurofilament neurons; PEP, peptidergic neurons; NP, nonpeptidergic neurons.
Additional files
-
MDAR checklist
- https://cdn.elifesciences.org/articles/92046/elife-92046-mdarchecklist1-v1.docx
-
Supplementary file 1
The expression profiles of each neuronal cluster of the human spinal cord.
- https://cdn.elifesciences.org/articles/92046/elife-92046-supp1-v1.xlsx
-
Supplementary file 2
The expression profiles of each neuronal cluster of the mouse spinal cord.
- https://cdn.elifesciences.org/articles/92046/elife-92046-supp2-v1.xlsx
Download links
A two-part list of links to download the article, or parts of the article, in various formats.
Downloads (link to download the article as PDF)
Open citations (links to open the citations from this article in various online reference manager services)
Cite this article (links to download the citations from this article in formats compatible with various reference manager tools)
Spatial transcriptomics and single-nucleus RNA sequencing reveal a transcriptomic atlas of adult human spinal cord
eLife 12:RP92046.
https://doi.org/10.7554/eLife.92046.2


