Some mechanistic underpinnings of molecular adaptations of SARS-COV-2 spike protein by integrating candidate adaptive polymorphisms with protein dynamics
- Department of Physics and Center for Biological Physics, Arizona State University, United States
- Institute for Genomics and Evolutionary Medicine, Temple University, United States
- Department of Biology, Temple University, United States
- Center for Genomic Medicine Research, King Abdulaziz University, Saudi Arabia
Figures
Figure 1

Evolutionary probability (EP) in SARS-CoV-2.
(A) The EPs of each amino acid in the S protein sequence are calculated by taking the multiple sequence alignment of the S proteins through their evolutionary tree and using Bayesian inferences to determine the likelihood of finding a particular residue at a particular location within a given sequence. Simply, if the residue is found at a location ‘x’ in closely related sequences, it will have a higher EP at location ‘x’ in the target sequence. Residues with an EP < 0.05 in the target sequence are candidate adaptive polymorphisms (CAPs) (red). CAPs are found at sites 32, 50, 218, 346, 372, 478, 486, 498, 519, 604, 681, 682, 683, 684, and 1125. (B) The distribution of EP scores of the wild-type residues in the S protein. Here, lower EP scores are shown in red, and higher EP scores in blue. While the vast majority of the wild-type (reference) protein consists of high EP residues, a few residues have low EP. (C) The CAPs are also highlighted as red spheres in the open configuration of the S protein, with the open chain in a darker shade. We observe that a majority of the CAP positions reside at the receptor-binding domain (RBD) and the Furin cleavage site (676-689; Wrobel et al., 2020) shown as transparent light gray spheres.
Figure 2
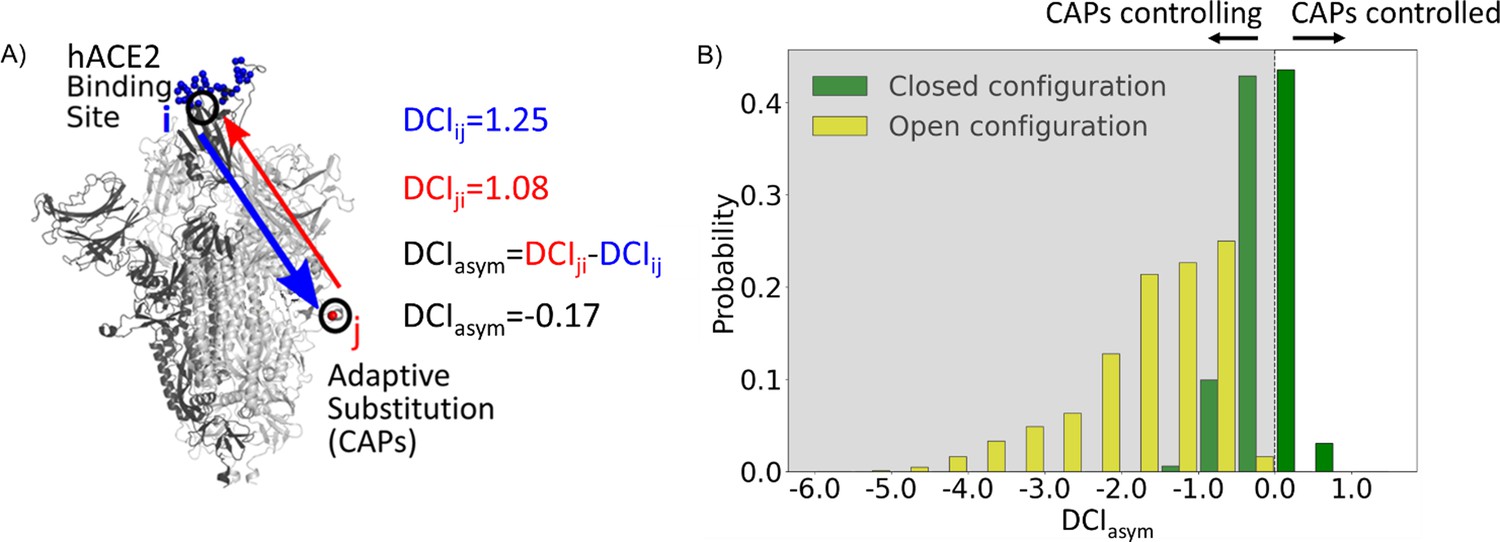
Candidate adaptive polymorphisms (CAPs) control binding sites across chains.
(A) Schematic representation of DCIasym. (B) DCIasym of CAP residue positions with the binding interface of receptor-binding domain (RBD) in the open chain. Residues in the closed chains with a low evolutionary probability (EP) amino acid in the reference sequence dominate the binding site interface of RBD in the open chain. There is a significant difference between the asymmetry profiles of the closed (M = –0.06, SD = 0.33) and open (M = –1.68, SD = 0.89) conformations (p<0.001).
Figure 3

The average number of variants observed among residues of different flexibility.
Residues were sorted into one of five bins based on flexibility. Then, the average number of variants for residues within that bin was calculated. Here, the number of variants is defined as the number of different amino acid varieties found at that site. Mutational data was calculated across approximately 24,000 SARS-CoV-2 S protein sequences from the NCBI Datasets Project (Brister et al., 2015). Residue flexibility, as reported here via %DFI, was computed using PDB id 6vsb from the Protein DataBank (Berman et al., 2000). More rigid residues tend to have fewer variants (r = 0.94).
-
Figure 3—source data 1
A comparison of the amino acid sequences for different variant spike proteins used in this article.
Sequence MN90894.3 is used as the wild-type (reference) sequence. For each different variant, residue positions matching the reference sequence are shown in blue, while locations where the residue differs from the reference sequence are shown in yellow. For S protein locations not shown here, all variants presented have the same amino acid type as the reference sequence.
- https://cdn.elifesciences.org/articles/92063/elife-92063-fig3-data1-v1.xlsx
Figure 4

Mutations in variants of concern (VOCs) present different asymmetry profiles.
(A) DCIasym with low evolutionary probability (EP) characteristic mutation sites of Delta or Omicron strains in the closed chains and the binding interface of receptor-binding domain (RBD) in the open chain. Delta displays a second peak closer to zero, suggesting that Delta mutation sites (M = –0.98, SD = 0.80) have less allosteric control over the hACE2 binding sites than Omicron mutation sites (M = –1.74, SD = 1.00) (p<0.001). However, both sets of sites have far more control over hACE2 binding sites than expected, based on a random control group (M = 0.03, SD = 0.85) (p<0.001). (B) S protein structure showing binding interface sites (transparent gray), Delta mutation sites (magenta), Omicron mutation sites (cyan), and sites mutated in both Omicron and Delta (blue).
Figure 5
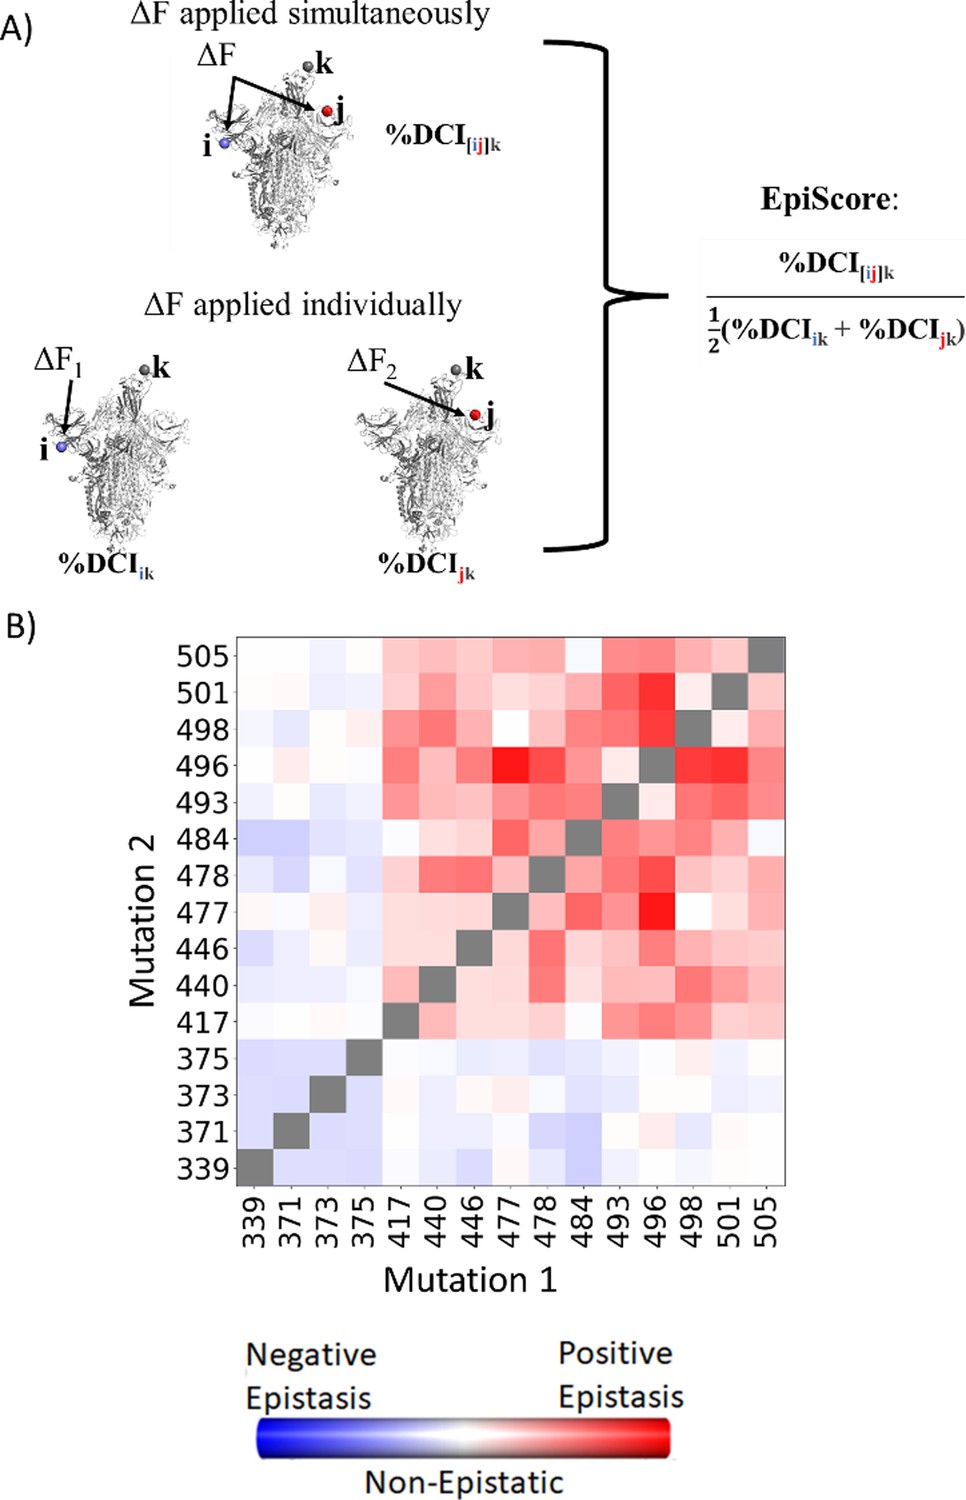
EpiScore provides a measurement of epistasis.
(A) Schematic representation of cross-chain EpiScore, describing i, j, in chains B and C, respectively, and its impact in receptor-binding domain (RBD) binding position k in the open RBD conformer chain A. (B) Colors indicate EpiScore values for given mutation pairs, averaged over hACE2 binding sites. Cross-chain residue pairs in the upper right tend to be highly epistatic, similar to pairwise second-order interaction coefficients from Moulana et al., 2022.
Figure 6 with 2 supplements
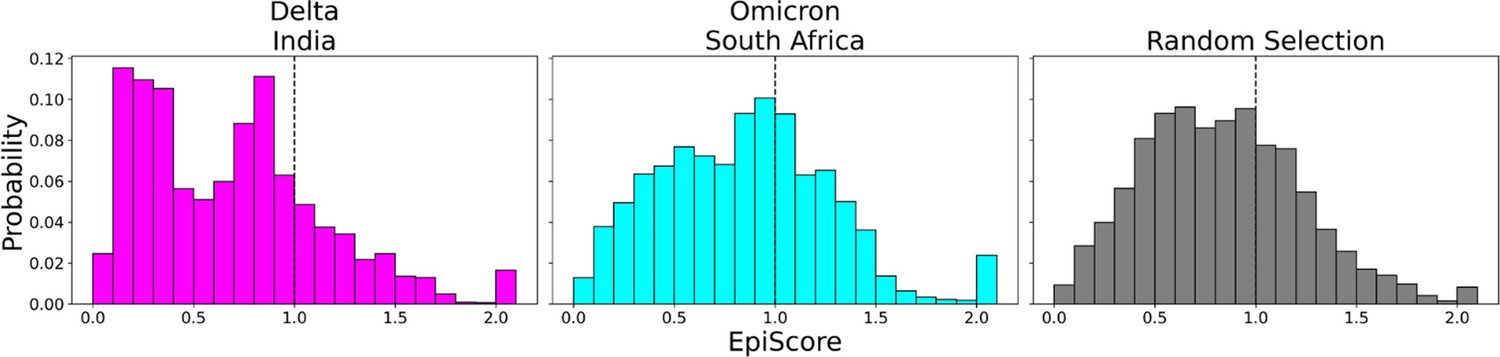
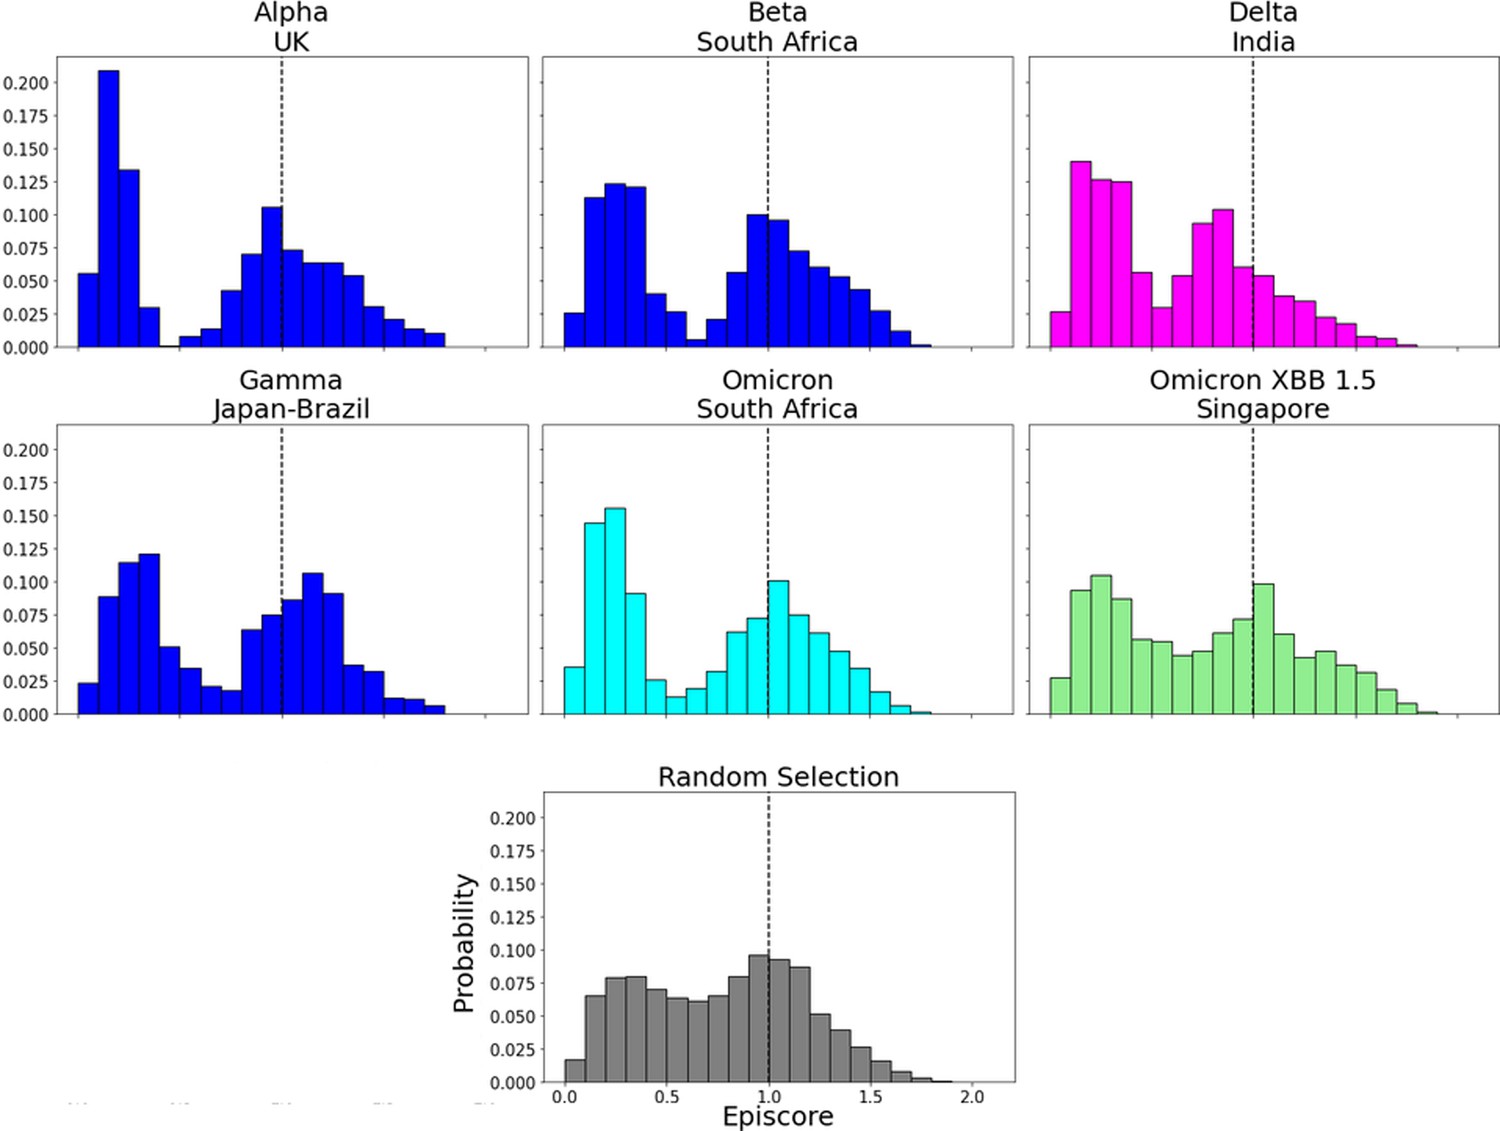
EpiScores of variants of concern (VOC) mutations.
Here, i = low evolutionary probability (EP) Delta mutation sites (magenta), low EP Omicron mutation sites (cyan), and a random selection of sites (gray), j = low EP sites in the Wuhan variant, and k = the binding interface of the open chain. EpiScores using sites of either variant (Delta: M = 0.70, SD = 0.50, Omicron M = 0.86, SD = 0.46) are significantly different (p<0.001) from a set of EpiScores using random sites (M = 0.84, SD = 0.41), but the distribution for Delta variants differs much more from the other two. EpiScores for other variants can be found in Figure 6—figure supplement 1.
Figure 6—figure supplement 1
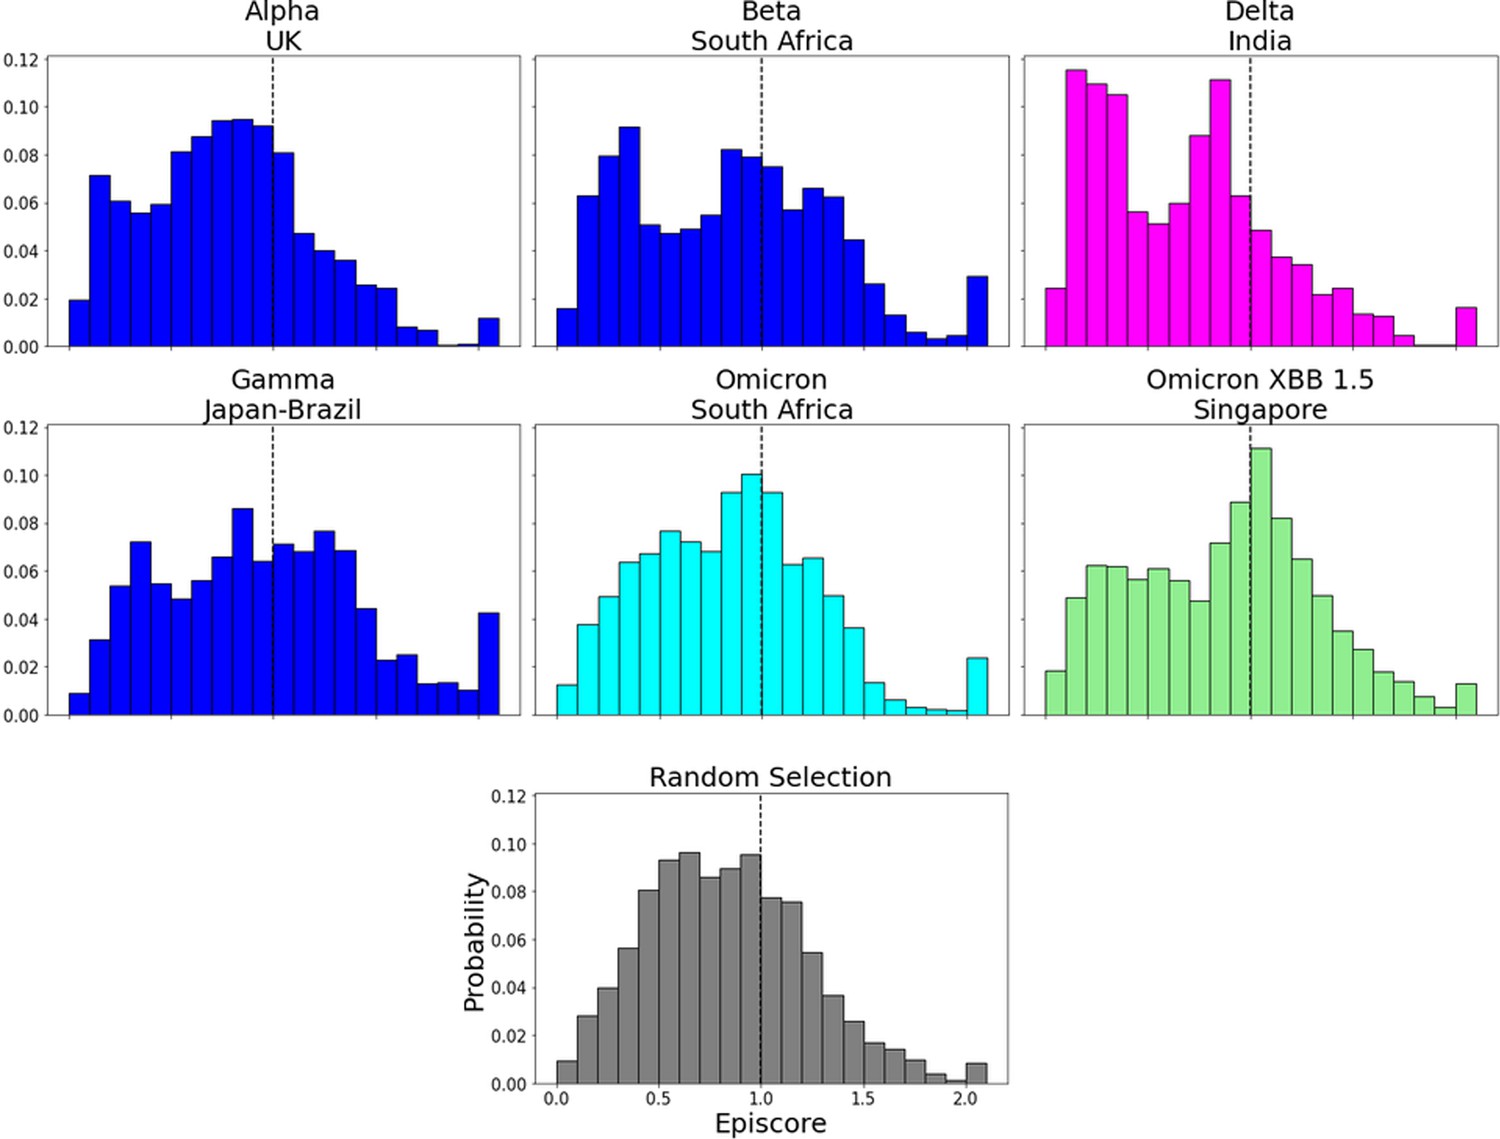
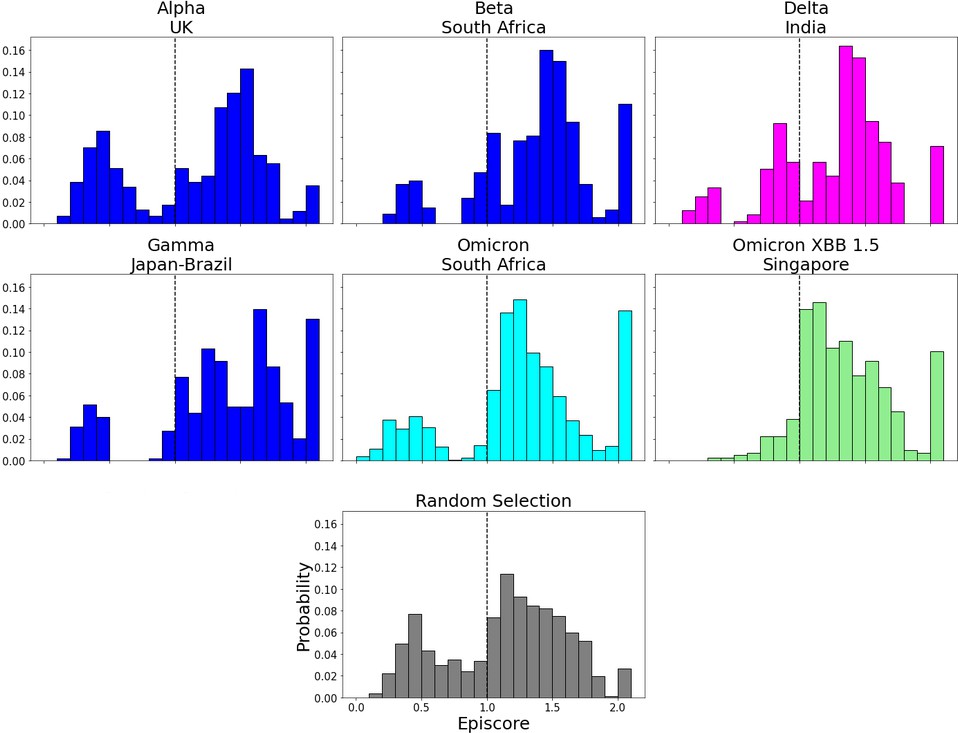
EpiScores for more variants of concern (VOCs).
EpiScores with i = characteristic mutation sites, j = low evolutionary probability (EP) sites, and k = the binding interface of the open chain. EpiScores using variant sites are significantly different (p<0.001) from a set of EpiScores using random sites.
Figure 6—figure supplement 2
EpiScores in the N-terminal domain (NTD).
EpiScores with i = characteristic mutation sites within the NTD, j = low evolutionary probability (EP) sites, and k = the binding interface of the open chain. NTD mutation sites result in markedly lower EpiScores compared to elsewhere (p<0.001).
Figure 7 with 1 supplement
EpiScores with candidate adaptive polymorphism (CAP) site 486.
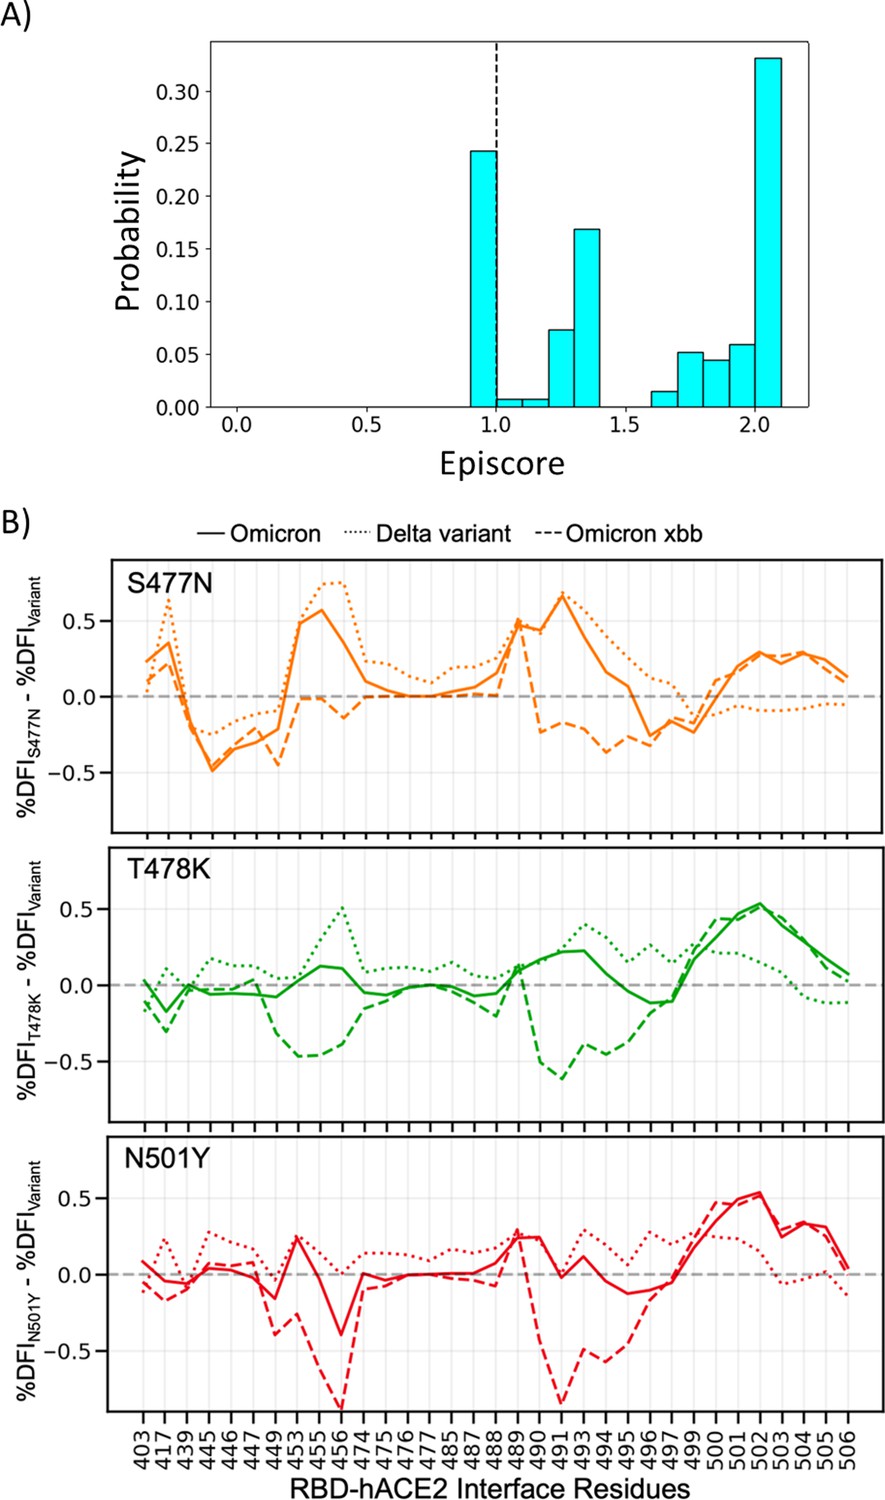
Here, i = low evolutionary probability (EP) Delta mutation sites (magenta), low EP Omicron mutation sites (cyan), and a random selection of sites (gray), j = site 486, and k = the binding interface of the open chain. CAP and hACE2 and antibody binding site 486 displays epistasis with almost all XBB 1.5 variant sites at almost every hACE2 binding site (M = 1.40, SD = 0.46) and presents a significantly different profile from other variant sites (p<0.01). EpiScores involving 486 for other variants can be found in Figure 7—figure supplement 1.
Figure 7—figure supplement 1
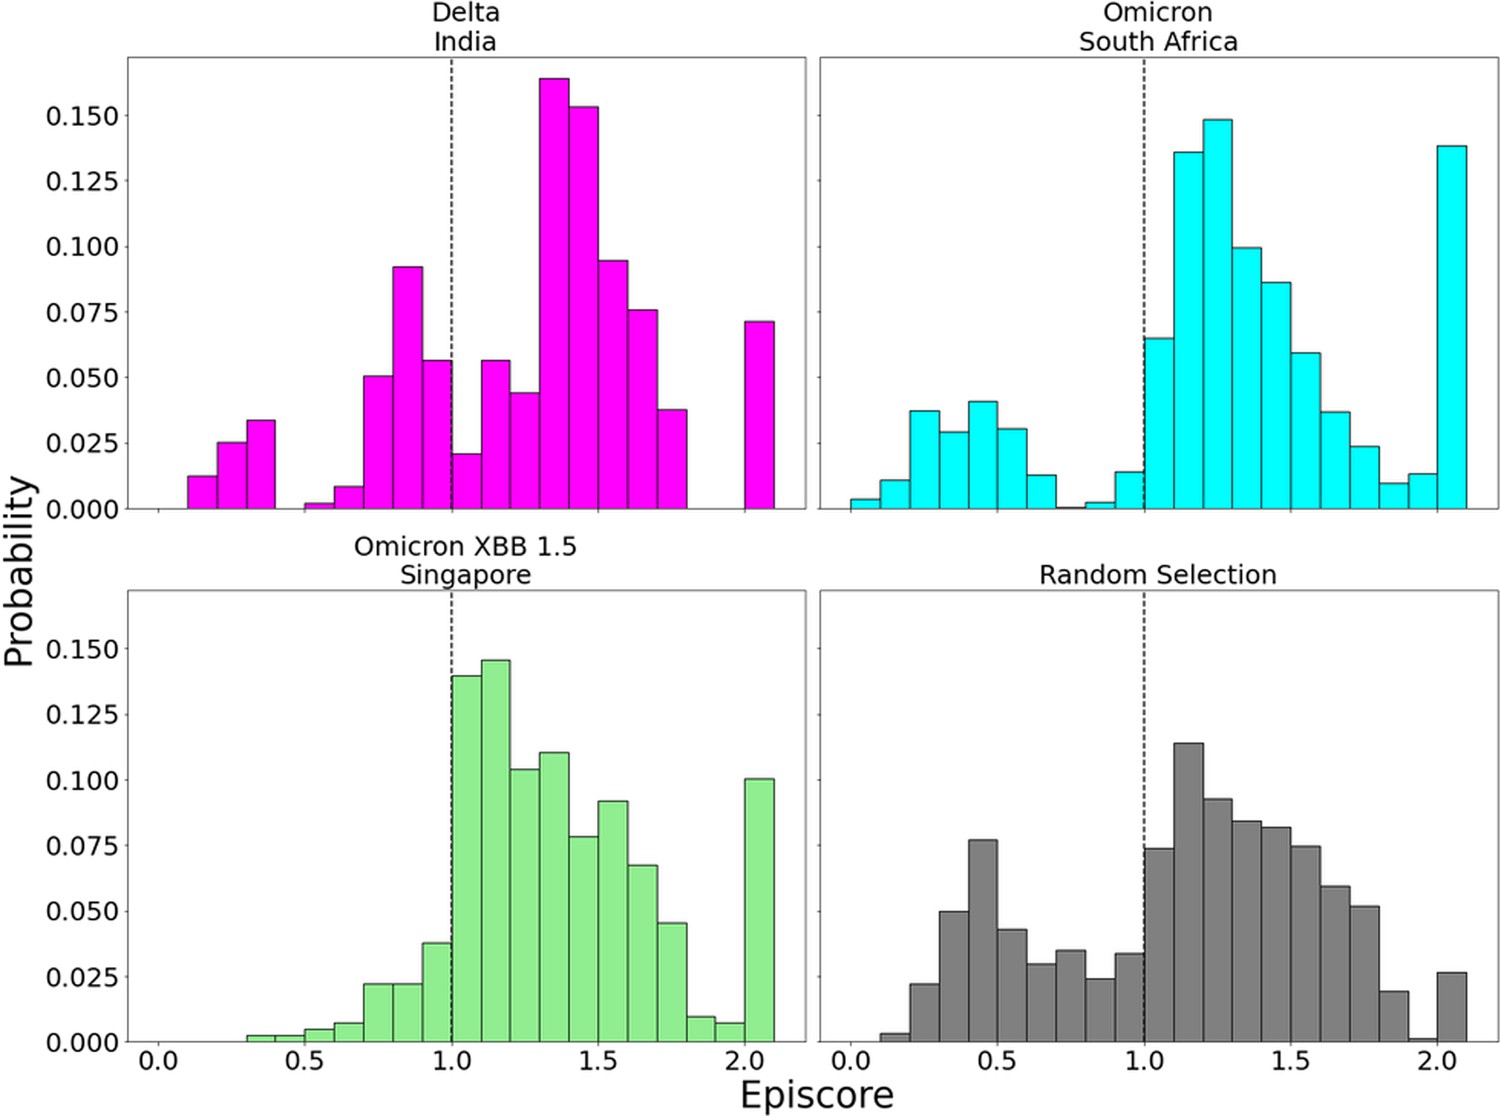
EpiScores for more variants of concern (VOCs) with candidate adaptive polymorphism (CAP) site 486.
EpiScores with i = characteristic mutation sites, j = site 486, and k = the binding interface of the open chain. CAP and hACE2 and antibody binding site 486 displays epistasis with almost all XBB 1.5 variant sites at almost every hACE2 binding site. EpiScores using variant sites are significantly different (p<.001) from a set of EpiScores using random sites.
Figure 8 with 1 supplement

The %DFI calculations for variants Omicron, XBB, and XBB 1.5.
(A) %DFI profile of the variants are plotted in the same panel. The gray shaded areas and dashed lines indicate the ACE2 binding regions, whereas the red dashed lines show the antibody binding residues. (B) The sum of %DFI values of RBD-ACE2 interface residues. The trend of total %DFI with the log of Kd values overlaps with the one seen with the experiments (r = 0.97). (C) The receptor-binding domain (RBD) antibody binding residues are used to calculate the sum of %DFI. The ranking captured with the total %DFI agrees with the log of IC50 values from the experiments.
Figure 8—figure supplement 1
Non-additive interactions influence variant behavior.
(A) Three critical mutations that emerged quickly and were frequently observed in other dominant variants are S477N, T478K, and N501Y. EpiScores of sites 477, 478, and 501 with one another are shown (with k = the binding interface of the open chain). These residues are highly epistatic, producing higher responses than expected when perturbed together. (B) The difference in the dynamic flexibility profiles between the single mutants and the most common variants for the hACE2 binding residues of the receptor-binding domain (RBD). The dynamic flexibility index (DFI) profiles exhibit significantly different flexibility in each background variant, highlighting the critical non-additive interactions of the other mutation in the given background variant. Thus, these three binding affinity-impacting mutations do not contribute only their own effects to the binding interface, there are epistatic interactions with the other mutations in variants of concern (VOCs) that shape the dynamics of the binding interface to modulate binding.
Author response image 1
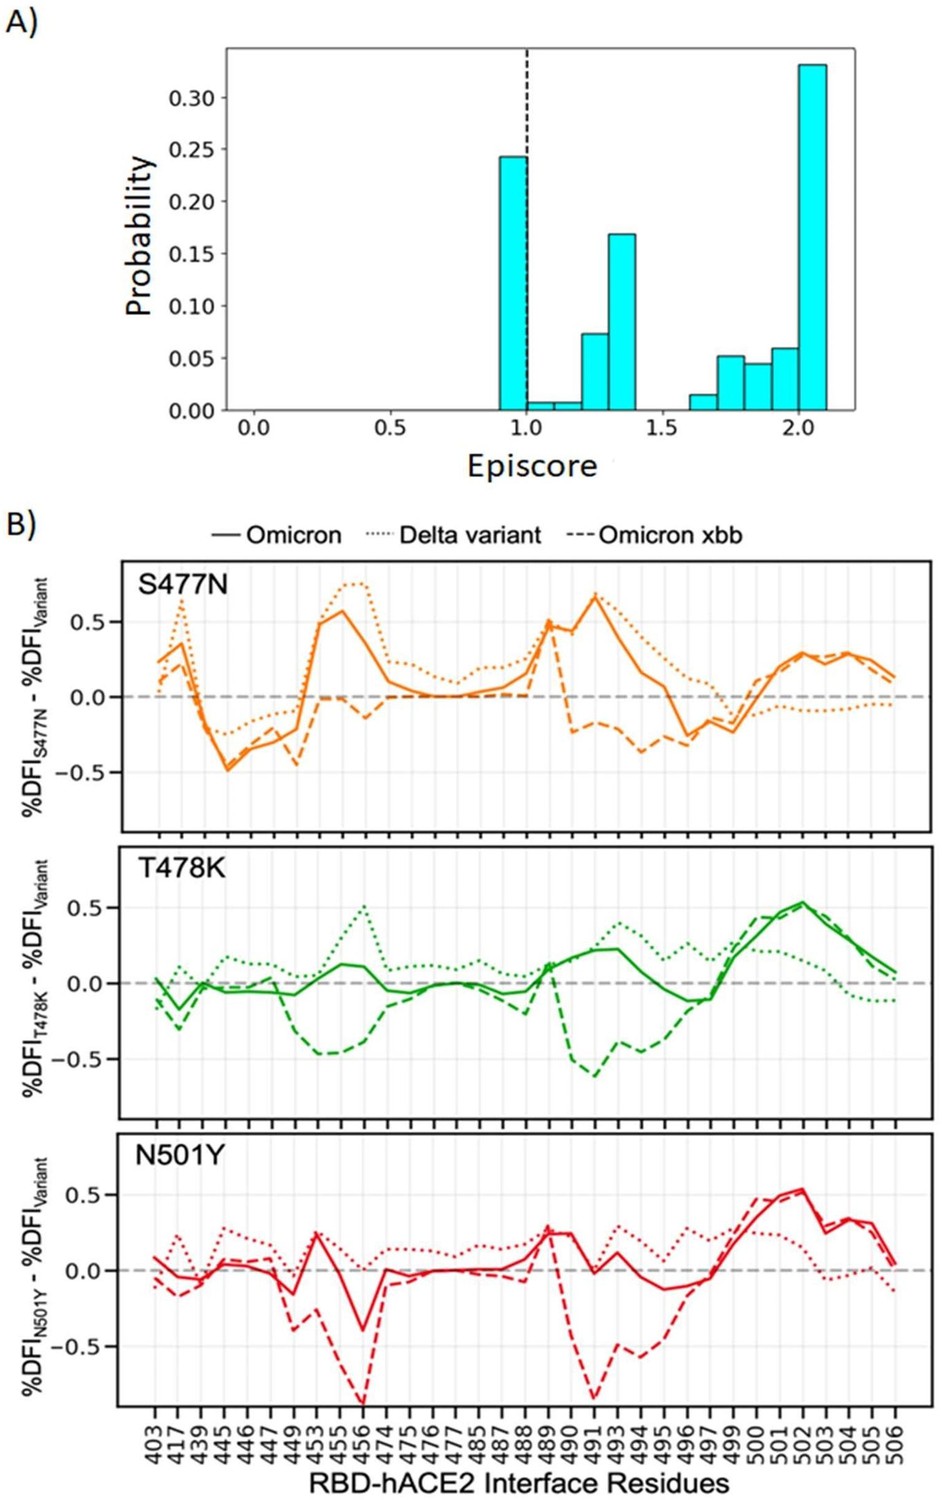
(A) Three critical mutations that emerged quickly, and were frequently observed in other dominant variants, were S477N, T478K, and N501Y.
EpiScores of sites 477, 478, and 501 with one another are shown with k = the binding interface of the open chain. These residues are highly epistatic, producing higher responses than expected when perturbed together. (B) The difference in the dynamic flexibility profiles between the single mutants and the most common variants for the hACE2 binding residues of the RBD. DFI profiles exhibit significant variation from zero, and also show different flexibility in each background variant, highlighting the critical non-additive interactions of the other mutation in the given background variant. Thus, these three critical mutations, impacting binding affinity, do not solely contribute to the binding. There are epistatic interactions with the other mutations in VOCs that shape the dynamics of the binding interface to modulate binding affinity with hACE2.
Author response image 2

The %DFI calculations for variants Delta, Omicron, XBB, and XBB 1.
5. (A) %DFI profile of the variants are plotted in the same panel. The grey shaded areas and dashed lines indicate the ACE2 binding regions, whereas the red dashed lines show the antibody binding residues. (B) The sum of %DFI values of RBD-hACE2 interface residues. The trend of total %DFI with the log of Kd values overlaps with the one seen with the experiments. (C) The RBD antibody binding residues are used to calculate the sum of %DFI. The ranking captured with the total %DFI agrees with the susceptibility fold reduction values from the experiments.
Additional files
-
Supplementary file 1
DFI profile of the Omicron variant, as obtained from MD simulations.
- https://cdn.elifesciences.org/articles/92063/elife-92063-supp1-v1.csv
-
Supplementary file 2
DFI profile of the Omicron XBB variant, as obtained from MD simulations.
- https://cdn.elifesciences.org/articles/92063/elife-92063-supp2-v1.csv
-
Supplementary file 3
DFI profile of the Omicron XBB 1.5variant, as obtained from MD simulations.
- https://cdn.elifesciences.org/articles/92063/elife-92063-supp3-v1.csv
-
Supplementary file 4
Mutation sites and EP values.
- https://cdn.elifesciences.org/articles/92063/elife-92063-supp4-v1.csv
-
Supplementary file 5
The alignment used to generate EP values.
- https://cdn.elifesciences.org/articles/92063/elife-92063-supp5-v1.zip
-
Supplementary file 6
Alignment of VOC sequences.
- https://cdn.elifesciences.org/articles/92063/elife-92063-supp6-v1.zip
-
MDAR checklist
- https://cdn.elifesciences.org/articles/92063/elife-92063-mdarchecklist1-v1.docx
Download links
A two-part list of links to download the article, or parts of the article, in various formats.
Downloads (link to download the article as PDF)
Open citations (links to open the citations from this article in various online reference manager services)
Cite this article (links to download the citations from this article in formats compatible with various reference manager tools)
Some mechanistic underpinnings of molecular adaptations of SARS-COV-2 spike protein by integrating candidate adaptive polymorphisms with protein dynamics
eLife 12:RP92063.
https://doi.org/10.7554/eLife.92063.3


