N-cadherin mechanosensing in ovarian follicles controls oocyte maturation and ovulation
- Robinson Research Institute, Adelaide Medical School, The University of Adelaide, Australia
- Zonula Incorporated, Canada
- Department of Chemistry, The University of Adelaide, Australia
- Myeloma Research Laboratory, Adelaide Medical School, Faculty of Health and Medical Sciences, The University of Adelaide, Adelaide, Australia. South Australian Health and Medical Research Institute, Australia
- Myeloma Research Laboratory, Adelaide Medical School, Faculty of Health and Medical Sciences, The University of Adelaide, Adelaide, Australia. South Australian Health and Medical Research Institute, Adelaide, Australia. Central Adelaide Local Health Network, Australia
Figures
Figure 1 with 1 supplement
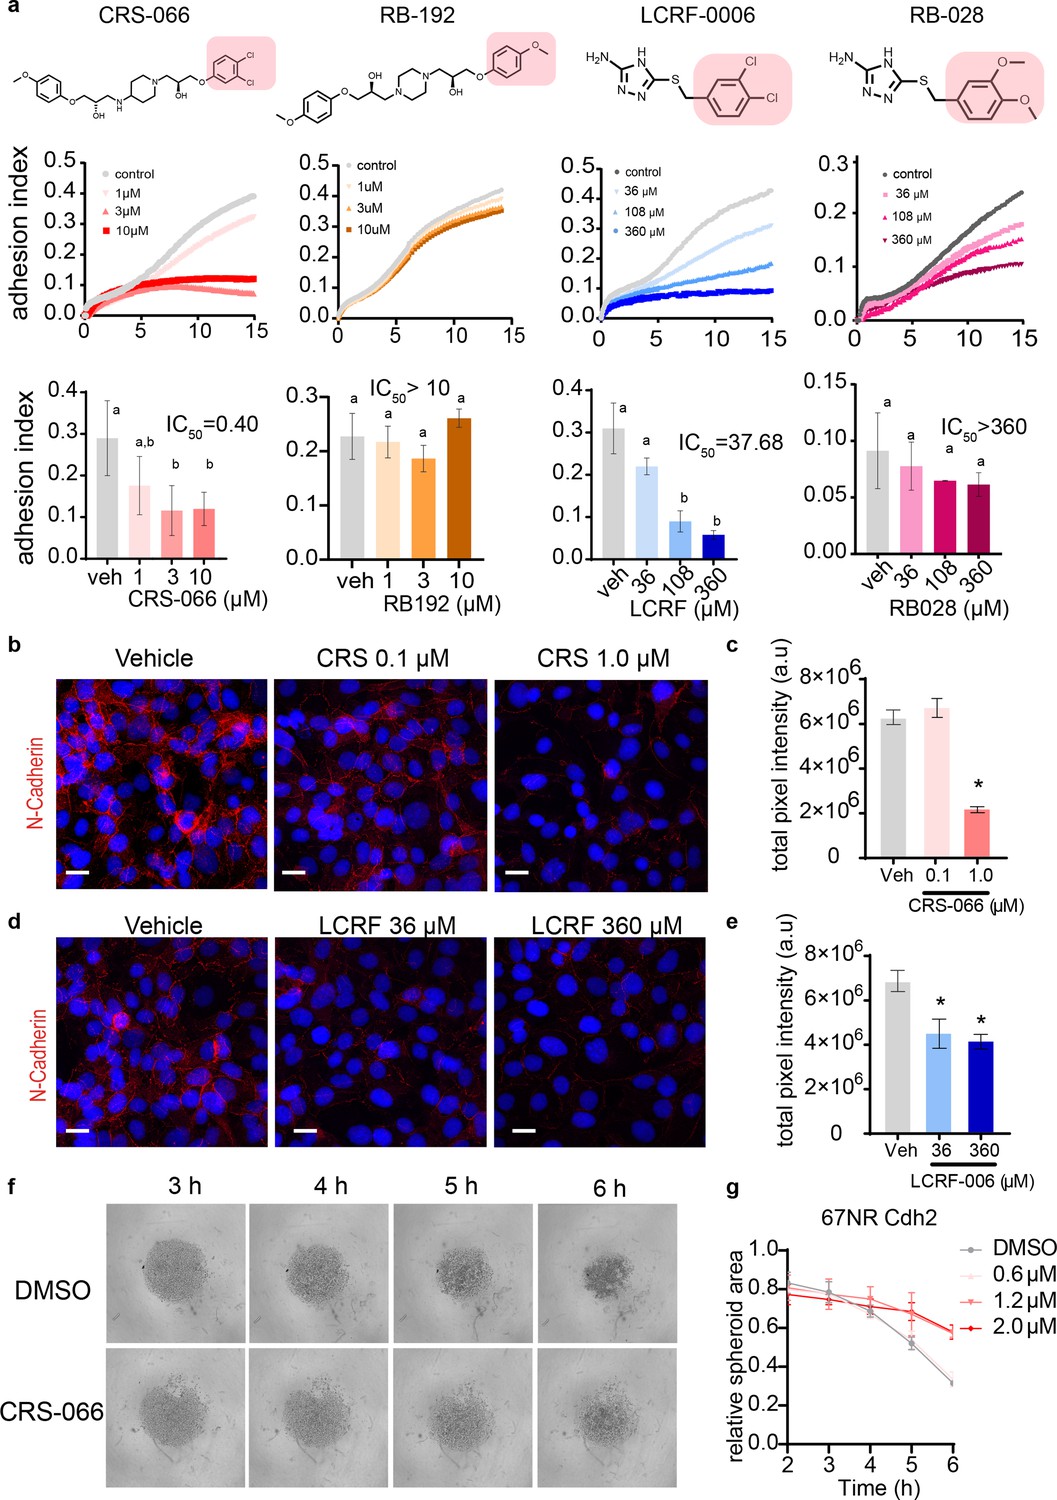
N-cadherin controls adhesive capacity of ovulating cumulus–oocyte complexes (COCs).
(a) Top panel: Chemical structures of N-cadherin antagonists CRS-066, LCRF-0006, and analogues RB-192 and RB-028. Active side chain or modified side chain depicted by highlighted box. Middle panel: Average cell adhesion index values of preovulatory COCs (11 hr post-hCG) interacting with a fibronectin substrate in presence of vehicle or N-cadherin antagonists CRS-066, LCRF-0006, and side chain modified analogues RB-192 and RB-028 or vehicle at respective doses. Cell indices were determined using the xCELLigence Impedance system over 15 hr (n = 3 independent experiments with 2 technical replicates per treatment). Bottom panel: Mean ± SD adhesion index values at 6 hr different superscript letters indicate significant differences (P<0.05), and IC50 values of respective drugs calculated from dose–response curve and compared using one-way ANOVA. (b, d) Representative confocal images of N-cadherin adherens junctions on SK-OV-3 cells treated with N-cadherin antagonists CRS-066 (0.1–1.0 μM), LCRF-0006 (36–360 μM), or vehicle for 24 hr (N = 3). Scale bar: 40 μM. (c, e) Quantification of N-cadherin adherens junctions. Mean of total pixel intensity in red channel, ± SEM of at least 50 cells. N = 3 independent experiments. Statistical analyses with two-tailed unpaired t-test. * denotes <0.01. (f) Bright-field images of spheroid formation in 67NR mouse mammary cell line expressing ectopic Cdh2 were treated with CRS-066 or vehicle at respective time points. Cells were seeded at 2000 cells per well, and formation of spheroids was assessed by imaging every hour for 6 h. (g) Mean ± SEM of spheroid area in 67NR-Cdh2 cells treated with either vehicle or increasing doses of CRS-066 (0–2 μM) over 6 hr.
Figure 1—figure supplement 1

Spheroid formation assay in N-cadherin deficient or N-cadherin expressing mouse 67NR cells.
(a) Bright-field images of spheroid formation assay in either wild-type 67NR cells lacking endogenous N-cadherin and unable to form spheroids and in 67NRs Cdh2 stably expressing N-cadherin and successfully undergo spheroid compaction within 6 hr. (b) Example of automated ‘spheroid mask’ image segmentation used to calculate spheroid area using ImageJ software. (c) Mean ± SEM of spheroid area in 67NR-Cdh2 or 67NR WT over 6 hr calculated after ‘spheroid masking’.
Figure 2 with 1 supplement
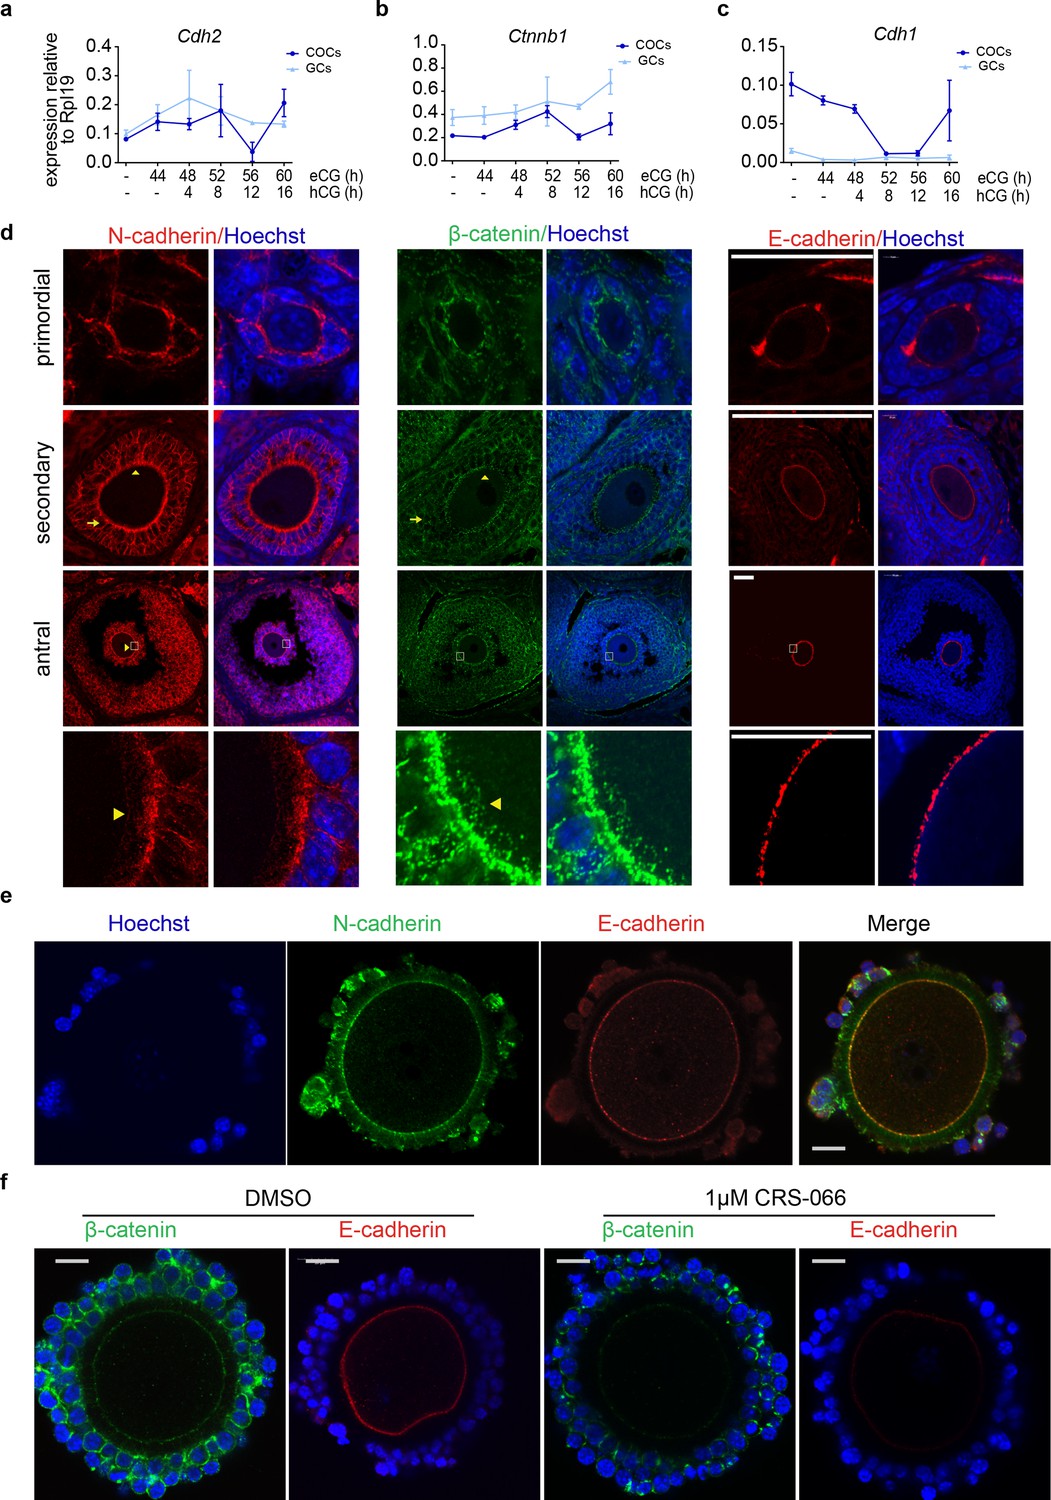
N-cadherin maintains oocyte–cumulus cell interaction.
(a–c) Time-course of Cdh2, ctnnb1, and Cdh1 mRNA expression in isolated granulosa cell (GCs) or cumulus–oocyte complexes (COCs) from mouse ovaries at indicated time points after eCG and hCG stimulation of folliculogenesis and ovulation (N = 3 animals per time point). Cdh2 and Ctnnb1 levels are high in GC and COC throughout folliculogenesis, with a transient drop in Cdh2 level 12 hr after ovulation stimulus, while E-cadherin was high in COCs and significantly reduced by ovulation stimulus. The levels shown of the indicated mRNAs were determined by TaqMan qPCR normalised to Rpl19. (d) Immunofluorescent staining of N-cadherin, β-catenin, and E-cadherin throughout ovarian folliculogenesis. Confocal images of mouse ovarian sections obtained from eCG primed mice and stained using anti N-cadherin (left panel), anti-β-catenin (middle panel), and E-cadherin (right panel). DNA is counterstained with Hoechst. Arrows indicate presence of N-cadherin and β-catenin at granulosa–granulosa cell junctions in secondary and antral follicle stages. Arrowheads indicate presence of N-cadherin and β-catenin at oocyte–cumulus interface. High magnification images show transzonal projections extending from cumulus cells and anchored to oocyte membrane Scale bar: 50 µM. (e) Whole-mount immunofluorescent staining showing co-localisation of N-cadherin (green) and E-cadherin (red) at the oocyte plasma membrane in mouse COC from antral follicles of eCG primed mice. N-cadherin is also evident on cumulus cell surfaces and transzonal projections. Cumulus cell and oocyte nuclear DNA are counterstained with Hoechst. Scale bar: 50 µM. (f) Whole-mount immunostaining shows loss of β-catenin and E-cadherin at the oocyte plasma membrane after treatment with CRS-066. COCs obtained from antral follicles of eCG primed mice and treated with CRS-066 or vehicle for 4 hr. COCs were fixed and stained with anti-E-cadherin (green) and anti-β-catenin (red). DNA was counterstained with Hoechst. Scale bar: 50 µM.
Figure 2—figure supplement 1

In situ proximity ligation assay (PLA).
PLA confirms close-proximity interaction between N-cadherin and β-catenin (red) on granulosa cell junctions (a, b) and at oocyte membrane (c).
Figure 3 with 1 supplement
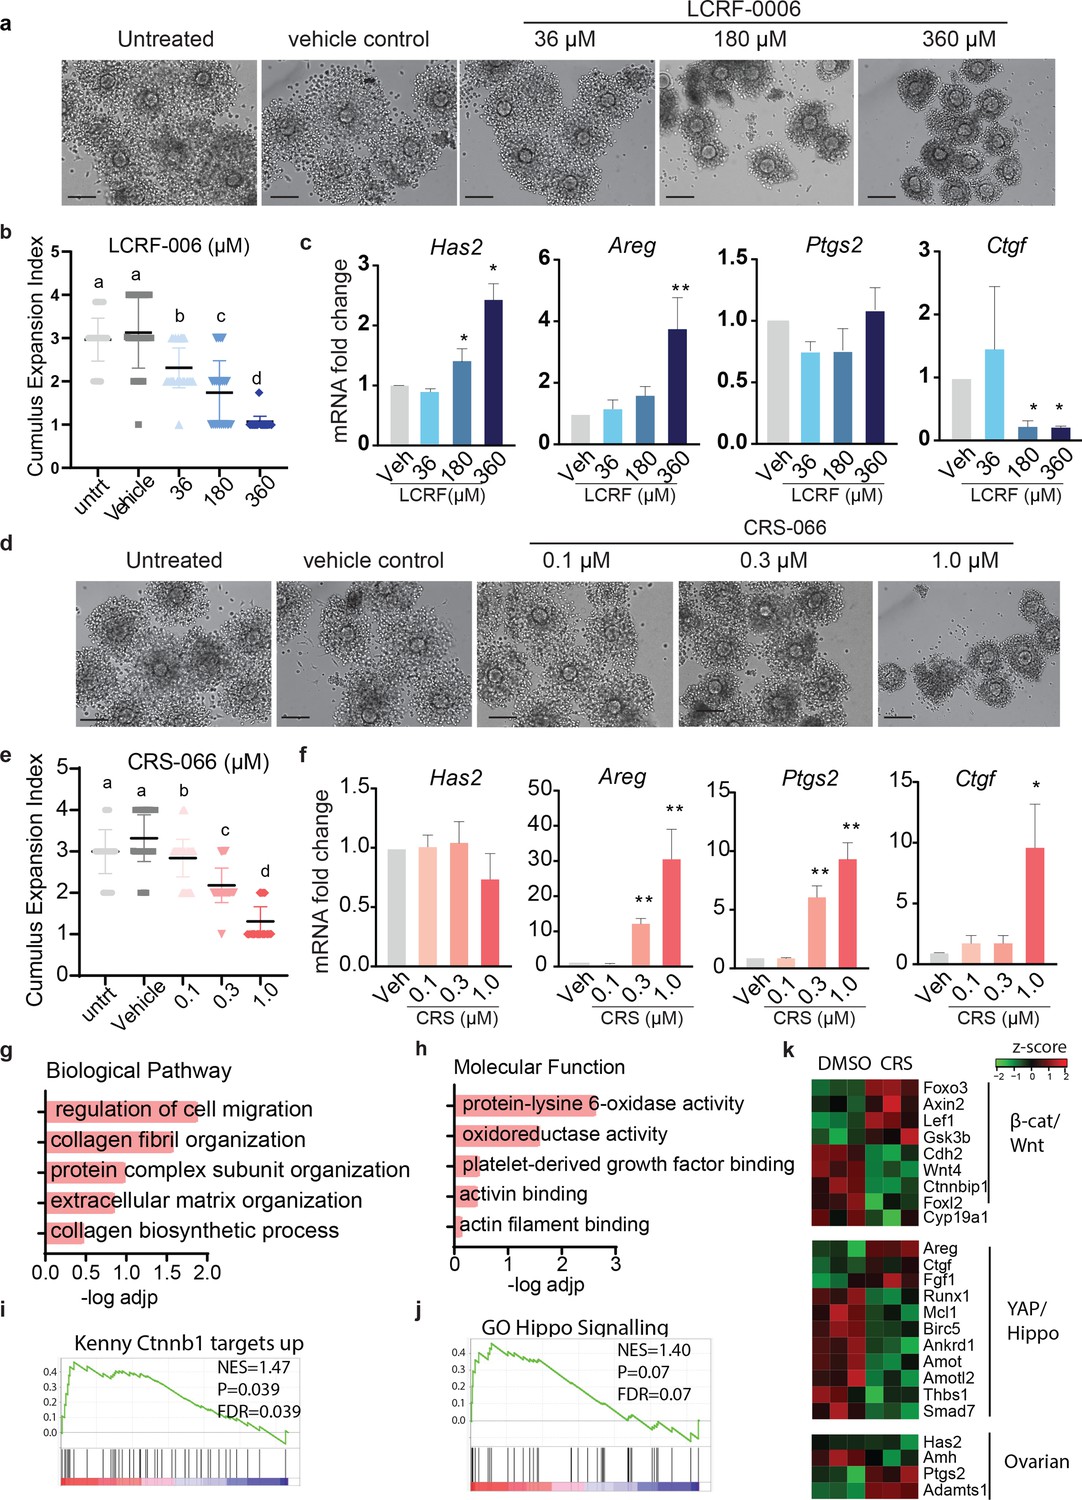
N-cadherin antagonists block cumulus expansion in mouse cumulus–oocyte complexes (COCs).
COCs from eCG primed mice were treated with LCRF-0006 (36–360 µM) or CRS-066 (0.1–1 µM) during in vitro maturation (IVM) (EGF and FSH stimulated) and cumulus expansion was assessed after 12 hr or gene expression assessed after 10 hr IVM. (a, d) Representative bright-field images of COCs after 12 hr IVM treated with LCRF-0006 or CRS-066. Scale bar: 10 µm. (b, e) Mean ± SEM of cumulus expansion indices from a and d n = >20 COCs per experiment. N = 4 independent experiments, different superscript letters indicate significant differences (P<0.05), *p < 0.05, **p < 0.01. (c, f) Effect of N-cadherin antagonist treatment during IVM (10 hr) on the expression of key genes involved in COC expansion during IVM. Mean ± SEM. N = 3 independent experiments. Statistical testing with one-way ANOVA, *p < 0.05, **p < 0.01. (g, h) Gene ontology enrichment of biological pathways and molecular functions of significantly differentially downregulated genes identified in RNA-Seq analysis of COCs after CRS-066 (0.3 μM) treatment compared to vehicle treatment. All data are presented as the ratio of CRS-066 over vehicle (N = 3). (I, j) Gene set enrichment analysis (GSEA) plot demonstrating the upregulation of Ctnnb1 and Hippo signalling pathways in CRS-066- versus vehicle-treated COCs. Net enrichment score (NES) values are shown. N = 3 independent biological replicates. (k) Heatmap representing the relative expression profiles of transcripts involved in Wnt\β-catenin, Hippo\YAP, and ovarian signalling axes.
Figure 3—figure supplement 1

N-cadherin antagonist and Yap1 antagonist effect COC expansion and gene expression.
(a) Principal component analyses of cumulus–oocyte complexes (COCs) treated with either CRS-066 (2.5 µM) or vehicle (DMSO) for 10 hr during in vitro maturation (IVM). (b) Volcano plot of differentially regulated genes (DEGs) (adjusted p < 10−6 and log2FC >0.5). (c) Effect of YAP inhibition on cumulus cell expansion and meiotic maturation. (d) Relative mRNA expression of key cumulus expansion genes normalised to Rpl19. Mean and SEM (n = 5).
Figure 4
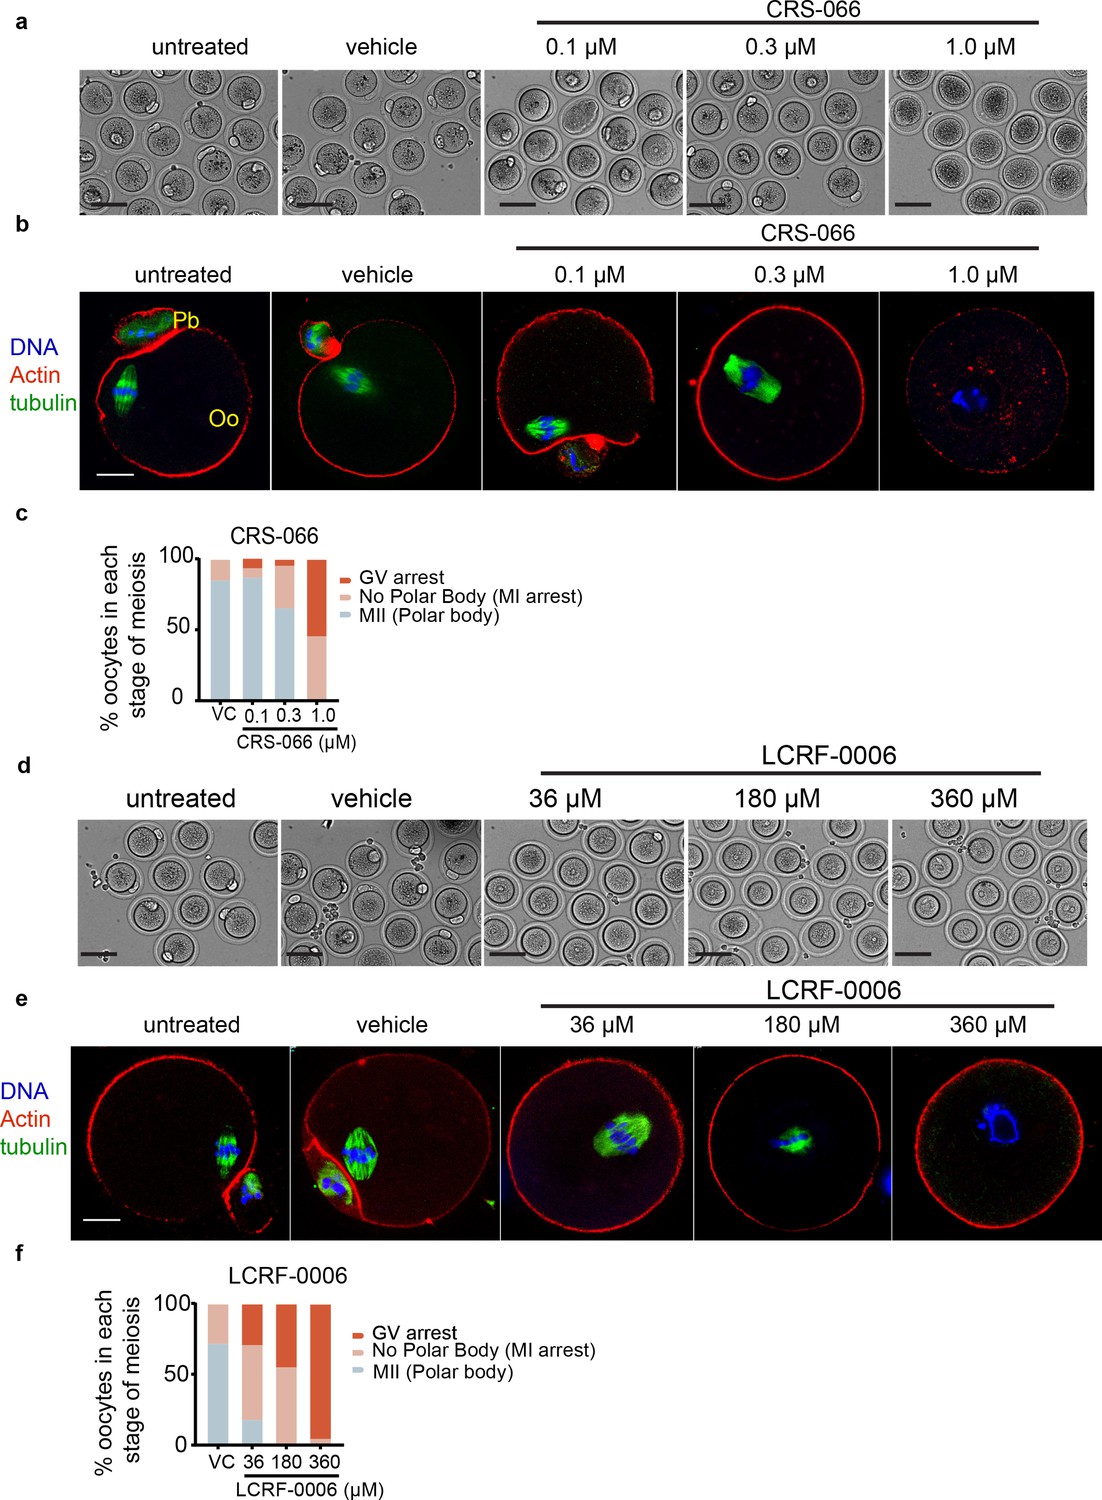
N-cadherin antagonists block meiotic maturation in mouse cumulus–oocyte complexes (COCs).
COCs from eCG primed mice were treated with LCRF-0006 (36–360 μM) or CRS-066 (0.1–1 μM) during in vitro maturation (IVM) (12 hr EGF and FSH stimulated), then oocytes were denuded and meiotic stage was assessed by labelling actin (phalloidin, red), spindles (tubulin IF, green), and DNA (Hoechst, blue). n = >20 COCs per experiment; N = 4 independent experiments. (a, d) Representative bright-field images of denuded mouse COCs showing oocyte and polar body morphology after vehicle, CRS-066 or LCRF-0006 treatment. Scale bar: 5 µM. (b, e) Representative confocal fluorescent images of denuded mouse oocytes after IVM treated with LCRF-0006 or CRS-066 as indicated, showing polar bodies, spindle structure, or germinal vesicle morphology typical in each treatment condition. Scale bar: 20 µM. Pb indicates polar body formation; Oo indicates oocyte. (c, f) Percent of oocytes at each stage of meiotic progression from n > 20 oocytes per experiment in 4 independent experiments. MI defined by the any evidence of tubulin staining in the first metaphase spindle with no polar body extrusion; MII defined by presence of a polar body and MII metaphase plate. GV defined by oocyte DNA lacking any tubulin staining to indicate MI spindle formation.
Figure 5 with 1 supplement
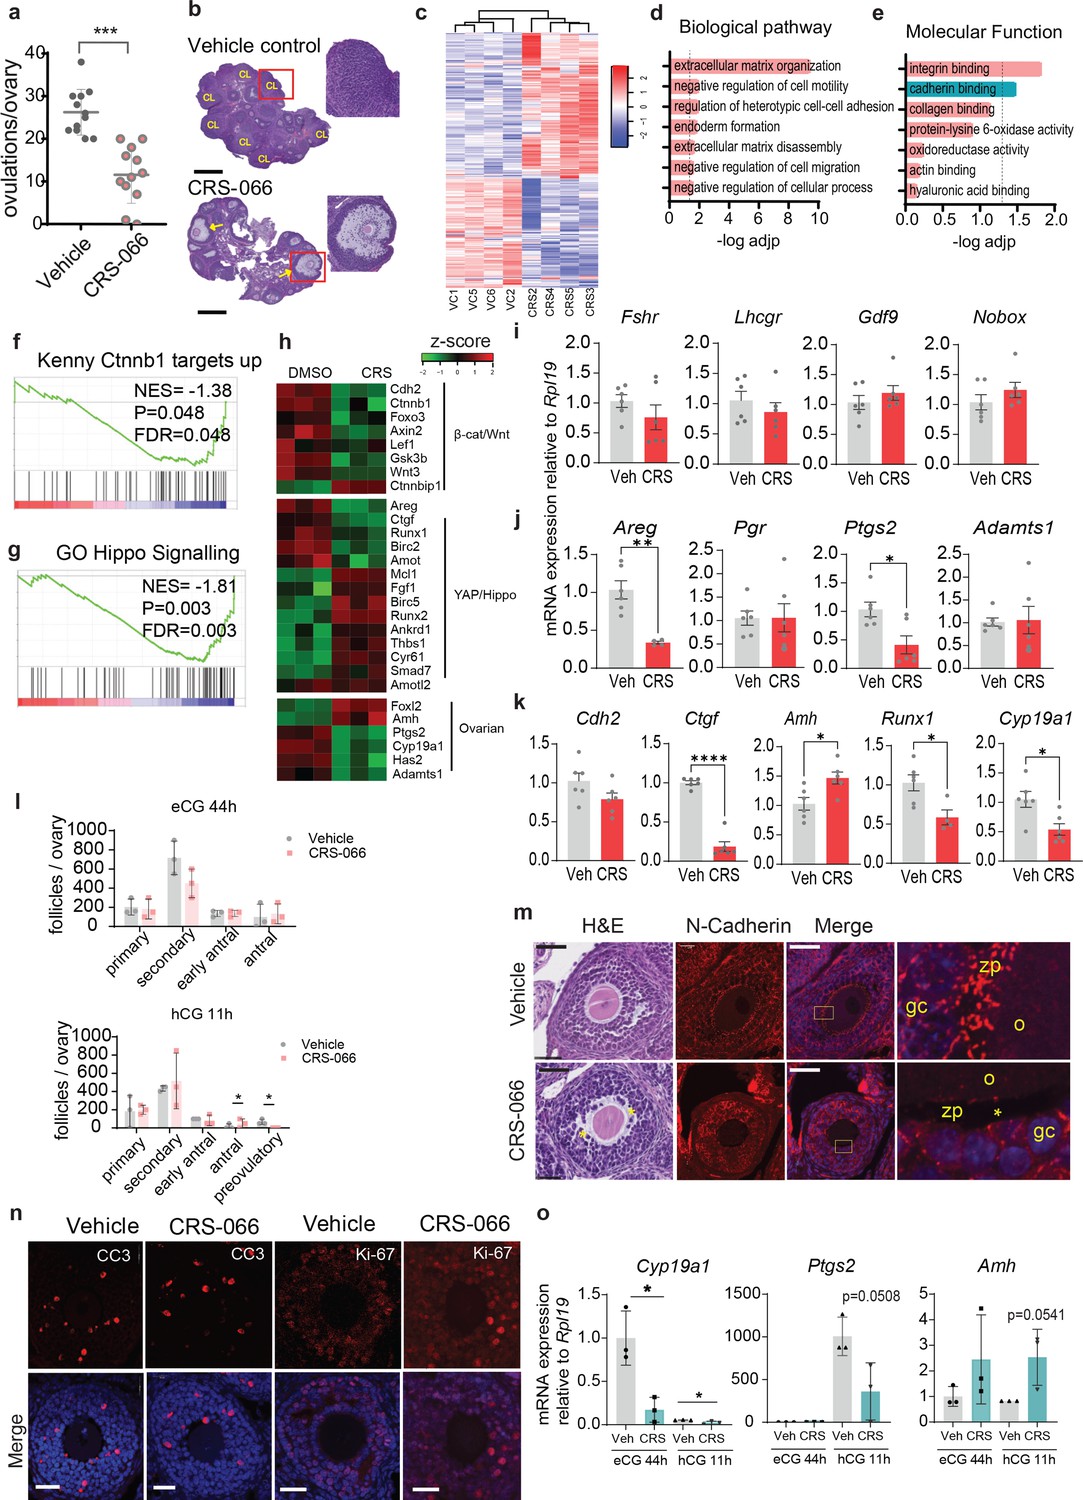
N-cadherin antagonist CRS-066 blocks ovulation in vivo.
(a) Ovulation rate of 21-day-old mice treated with CRS-066 (50 mg/kg) or vehicle (7.5% DMSO in 0.9% saline). Cumulus–oocyte complexes (COCs) in oviducts counted 16 hr after hCG injection. Graph represents mean ± SEM from N = 6 animals; ***p < 0001 (unpaired two-tailed t-test). (b) Histology of ovaries by haematoxylin and eosin staining. CL indicates corpus leuteum; arrows indicate trapped oocytes in CL. Scale bar: 100 µm. (c) Hierarchical clustering of RNA-sequencing analysis results shows differentially expressed genes between CRS-066- and vehicle-treated mice (N = 6 mice per treatment). Gene ontology enrichment of biological pathways (d) and molecular functions (e) of significantly differently downregulated genes in CRS-066-treated mouse ovaries compared to vehicle treated ovaries. (f, g) Gene set enrichment analyses (GSEA) plot shows downregulation of Ctnnb1 and Hippo signalling pathways in CRS-066-treated mice ovaries compared to vehicle-treated ovaries. Net enrichment score (NES) values are shown. (h) Heatmap representing the relative expression profiles of transcripts involved in Wnt\β-catenin, Hippo\YAP and ovarian signalling axes in CRS-066-treated ovaries compared to vehicle. N = 3 biological replicates. Relative mRNA expression of key genes involved in gonadotrophin signalling and oocyte function (i), COC expansion and ovulation (j), or folliculogenesis (k) hr in ovaries treated with CRS-066 compared to vehicle treatment and determined by quantitative reverse transcription PCR (qRT-PCR). Bar graph show mean ± SEM. N = 6 ovaries from independent CRS or vehicle-treated mice. Statistical testing with Student’s t-test; *p < 0.05; **p < 0.01; ****p < 0.00001. (l) Follicle counts at primary, secondary, pre-antral, antral, and ovulatory stages in ovaries from mice treated with either CRS-006 (50 mg/kg) or vehicle control (7.5% DMSO). N = 3 mice/treatment/time point. (m) Representative follicle morphology H&E (left) section and N-cadherin immunofluorescence (right) section in mice treated with either CRS-066 or vehicle. H&E and immunofluorescence highlight disorganised granulosa cells organisation. Asterisks indicate loss of transzonal projections between oocyte and cumulus cells. Scale bar: 30 µm. (n) Representative confocal immunofluorescent images of mouse ovaries stained with anti-cleaved caspase 3 and anti-Ki-67. Scale bar: 30 µm. (o) Relative mRNA expression of key genes involved in oocyte growth and ovulation in CRS-066- or vehicle-treated mice (N = 3/treatment) at either 44 hr post eCG or 11 hr post hCG.
Figure 5—figure supplement 1

N-cadherin antagonist treatment and gene expression changes in vivo.
(a) Dosing schedule for in vivo studies with N-cadherin antagonist CRS-066 (50 mg/kg). (b) Principal component analyses of ovaries collected from mice treated with either CRS-066 or vehicle 16 hr post-hCG. (c) Volcano plot of differentially expressed genes (DEGs) (adjusted p < 10–6 and log2FC >0.5).
Figure 6
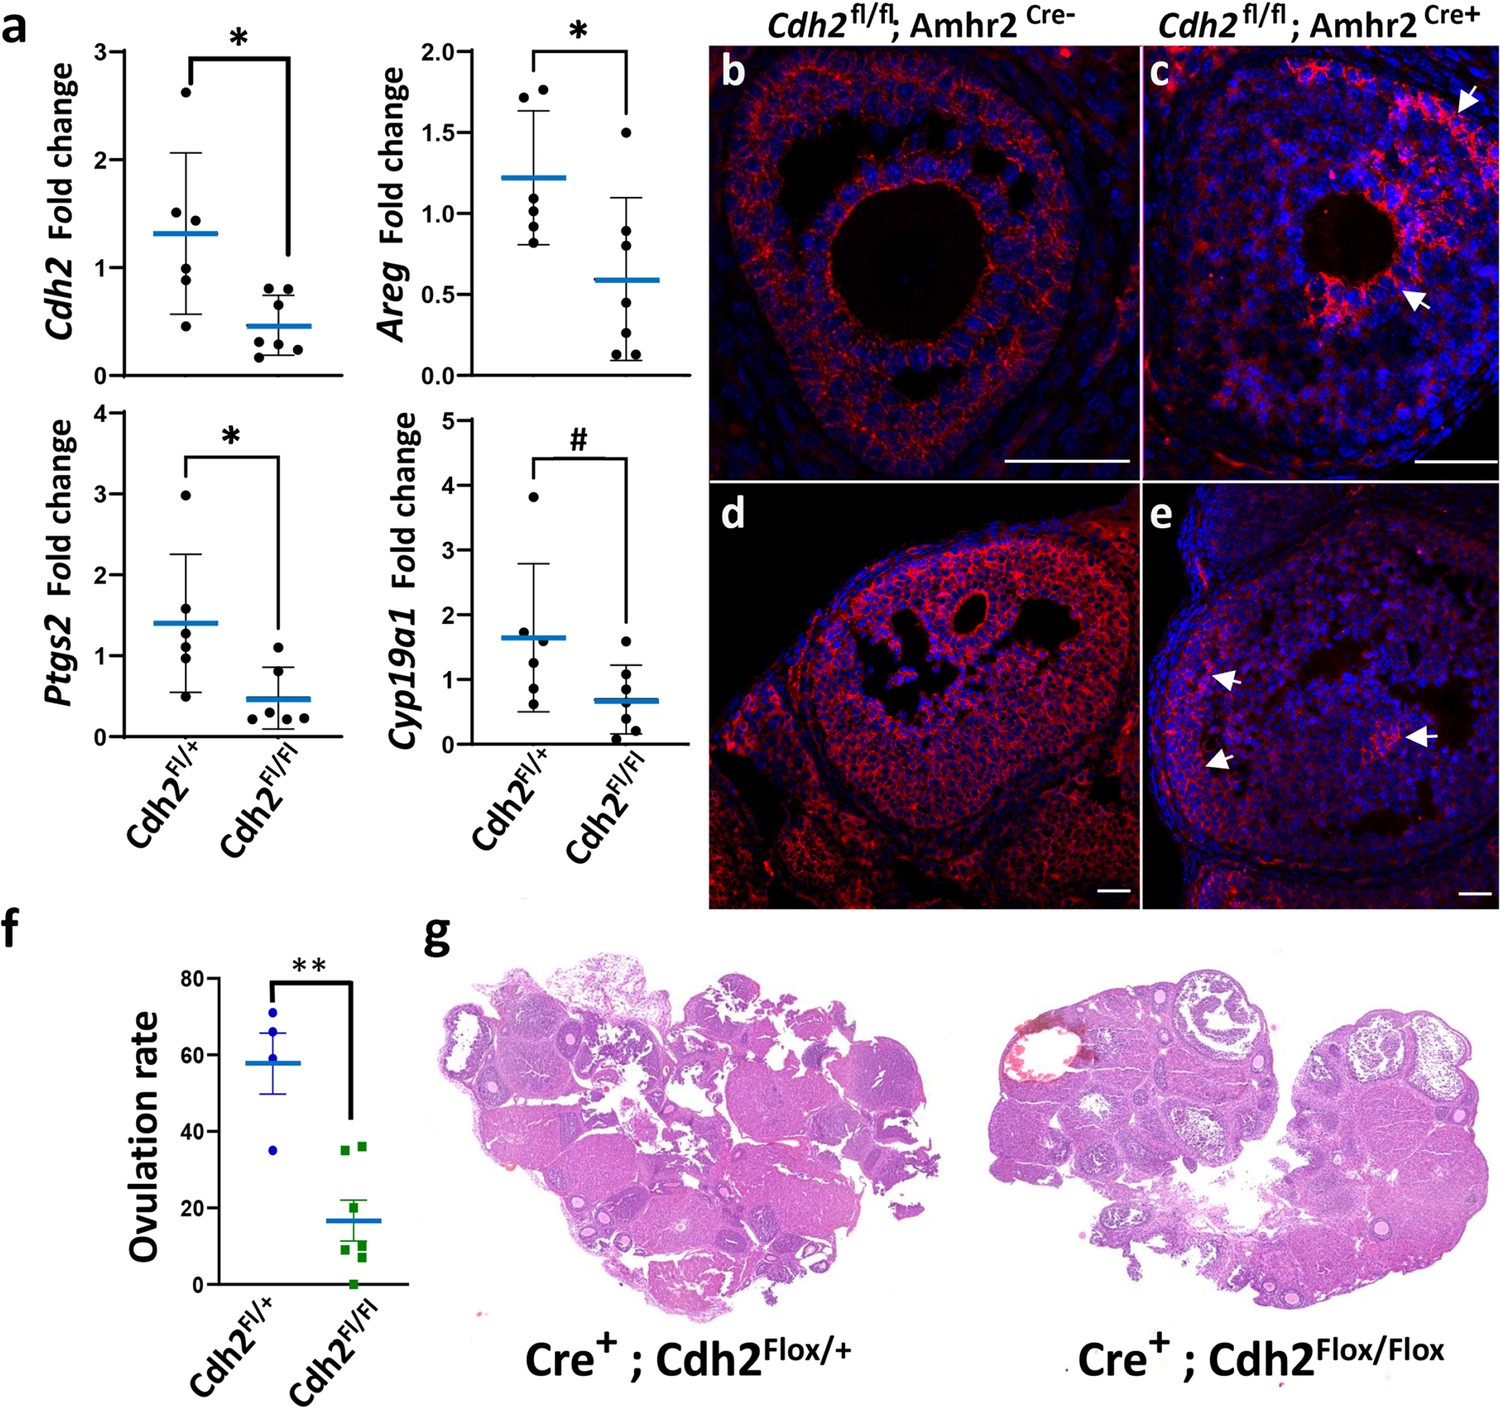
Granulosa conditional Cdh2 null mutation disrupts ovarian gene expression and blocks ovulation.
(a) qPCR analysis of relative mRNA expression of Cdh2, Areg, Ptgs2, and Cyp19a1 in ovaries of control (Cdh2Fl/+; Amhr2Cre) and granulosa-specific Cdh2 null mutants (Cdh2Fl/Fl; Amhr2Cre), n = 6 individual animals, *p < 0.05, #p < 0.08. (b–e) Immunofluorescent analysis of N-cadherin protein in ovaries of control (Cdh2Fl/+; Amhr2Cre) and granulosa-specific Cdh2 null mutants (Cdh2Fl/Fl; Amhr2Cre), showing mosaic depletion of N-cadherin in granulosa cells of mutant follicles. Arrows indicate mosaic regions with persistent N-cadherin. (f) Ovulation rate of 21-day-old mice with indicated control or granulosa-specific mutant genotypes. Cumulus–oocyte complexes (COCs) in oviducts counted 16 hr after hCG injection. Graph represents mean ± SEM from N = 4 and 7 animals, respectively; **p < 0.01 (unpaired two-tailed t-test). (g) Histology of ovaries by haematoxylin and eosin staining. Scale bar: 100 µm.
Additional files
Download links
A two-part list of links to download the article, or parts of the article, in various formats.
Downloads (link to download the article as PDF)
Open citations (links to open the citations from this article in various online reference manager services)
Cite this article (links to download the citations from this article in formats compatible with various reference manager tools)
N-cadherin mechanosensing in ovarian follicles controls oocyte maturation and ovulation
eLife 13:RP92068.
https://doi.org/10.7554/eLife.92068.2


