Liver microRNA transcriptome reveals miR-182 as link between type 2 diabetes and fatty liver disease in obesity
- Institute for Human Genetics, Division Epigenetics & Metabolism, University of Lübeck, Germany
- Center of Brain, Behaviour and Metabolism (CBBM), University of Lübeck, Germany
- German Center for Diabetes Research (DZD), Germany
- Research Unit NeuroBiology of Diabetes, Institute for Diabetes and Obesity, Helmholtz Centre, Germany
- Institute for Experimental Endocrinology, University of Lübeck, Germany
- Institute of Experimental and Clinical Pharmacology, University Hospital Schleswig-Holstein, Campus Kiel, Germany
- Department of General, Visceral and Thoracic Surgery, University Medical Center Hamburg-Eppendorf, Germany
- Chair of Neurobiology of Diabetes, TUM School of Medicine, Technical University of Munich, Germany
- University Hospital of Coventry and Warwickshire, United Kingdom
- Molecular Cell Biology, Institute of Theoretical Medicine, Faculty of Medicine, University of Augsburg, Germany
Figures
Figure 1
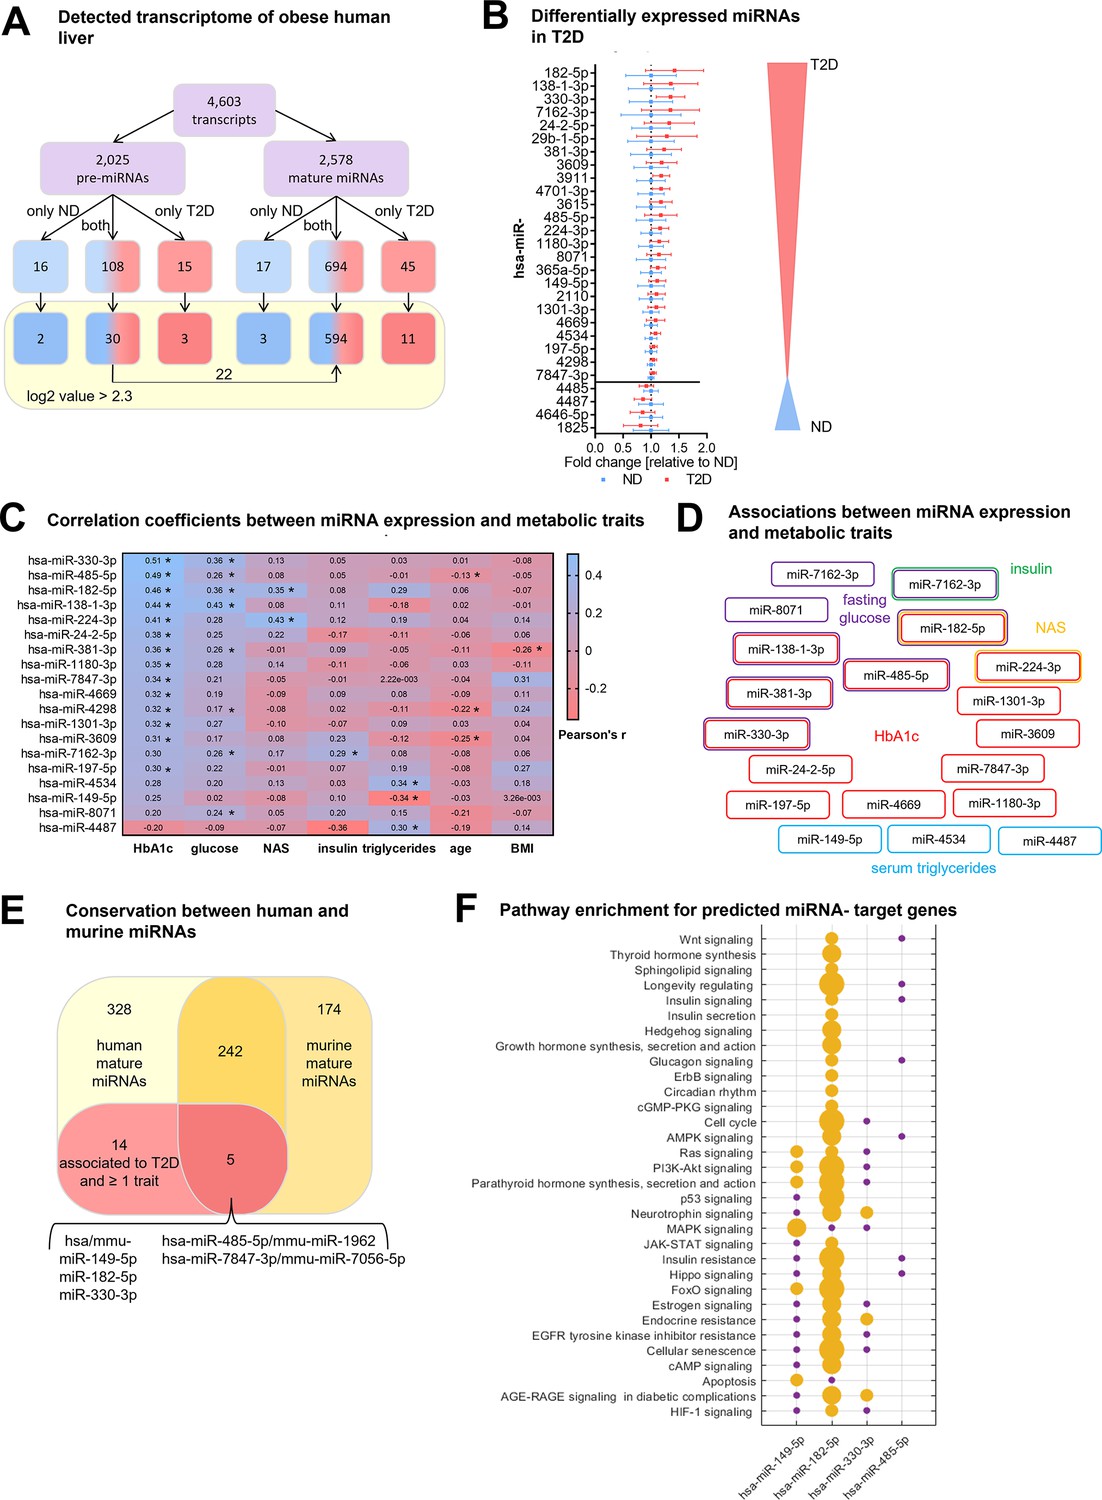
Type 2 diabetes in obese individuals is associated with a distinct hepatic miRNA signature.
(A) Overview of all analyzed human transcripts within the GeneChip miR4.0 assay. (B) Expression of the 28 regulated miRNAs in type 2 diabetes (T2D, n=20) compared to non-diabetic (ND, n=20) after adjustment for age, sex, BMI, and NAFLD activity score (NAS) in logistic regression models ranked by fold-change. Data is represented as relative mean to ND ± SD. (C) Pearson’s correlation coefficients (r) for the correlation between microarray miRNA log2 values and metabolic parameters (n=40). miRNAs are ranked by their association strength to first HbA1c, glucose, NAS, insulin, triglycerides, age, and lastly BMI. (D) Mapping of significant correlations from (C) to metabolic parameters. (E) Venn diagram of all mature miRNA detected by microarray measurement in human and diet-induced obese (DIO) murine liver samples. (F) Pathway enrichment analysis of validated target genes of conserved miRNAs from (E) available in miRTarBase (19). Yellow dots indicate a significant enrichment of target genes in the respective pathway which correlates with the dot size and violet dots a potential implication meaning a non-significant enrichment of target genes in this pathway. Corrected for multiple testing: *q<0.05.
Figure 2 with 4 supplements
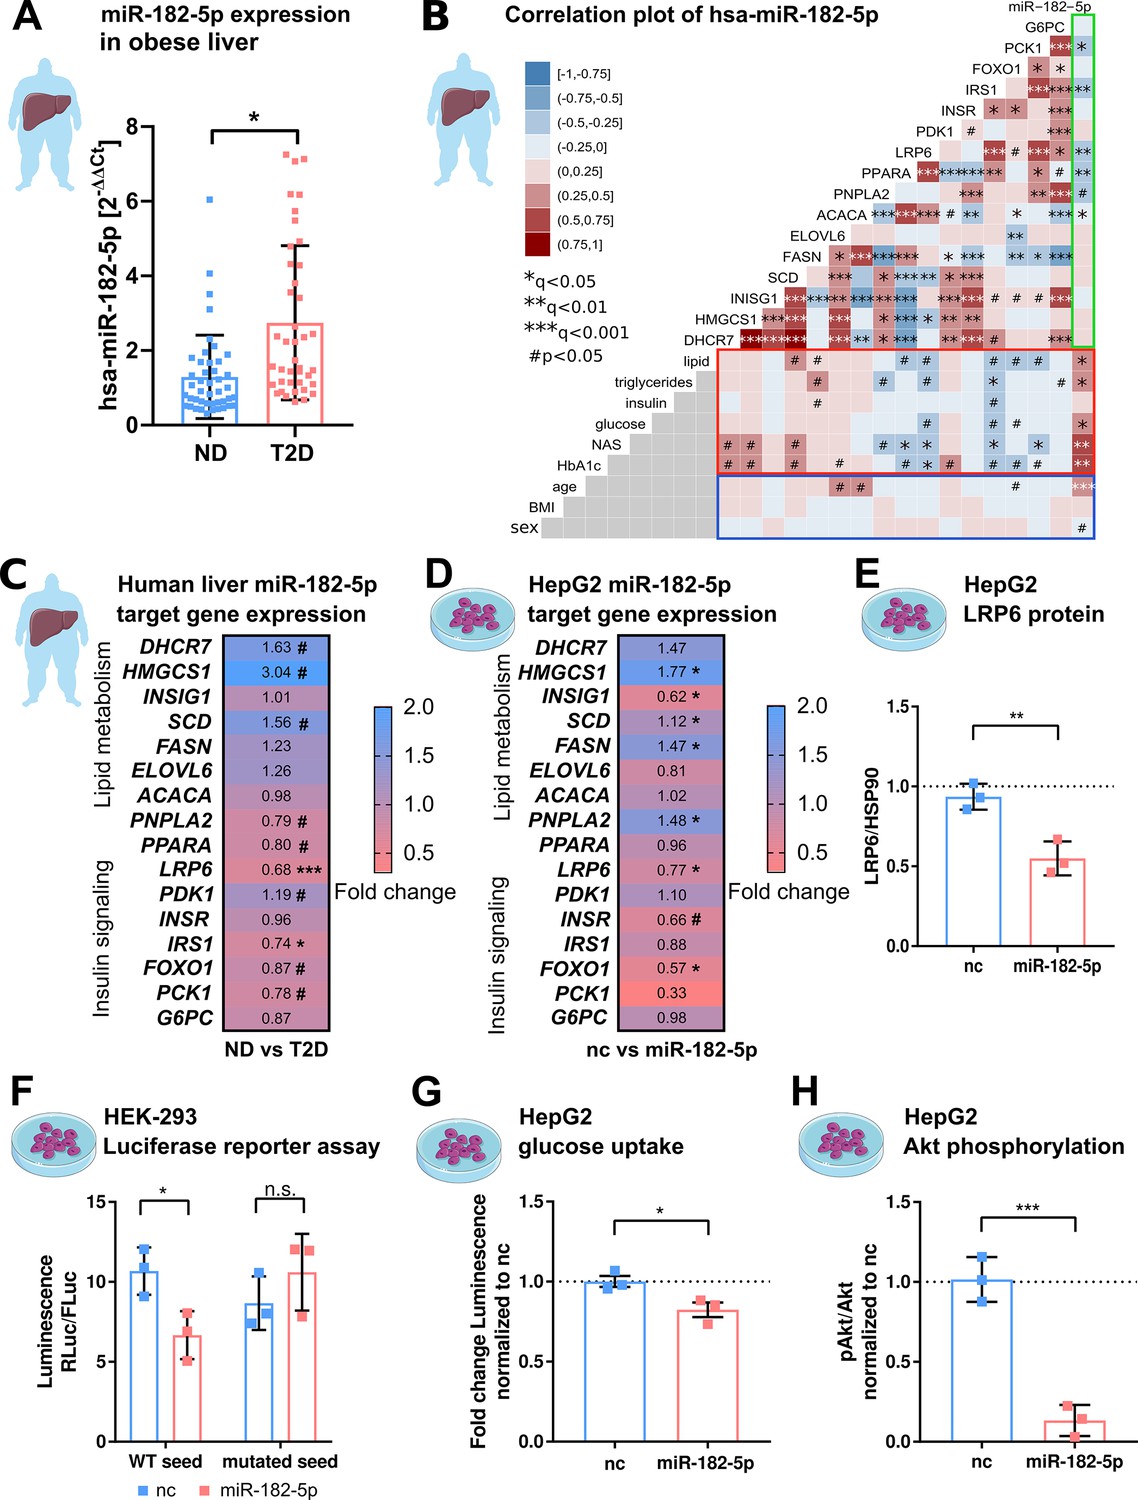
hsa-miRNA-182–5 p is a gate keeper for LRP6-dependent regulation of glucose homeostasis and hepatic lipid metabolism.
(A) Expression of miR-182–5 p is 2.3-fold upregulated in liver tissue of obese subjects with type 2 diabetes (T2D, HbA1c≥6.5% or anti-diabetic medication) compared to non-diabetic (ND, HbA1c<5.7 %) obese subjects in the extended human liver cohort (n=85). (B) Correlation plot of hepatic miR-182–5 p expression and its target genes (ACACA: n=85, DHCR7: n=82, ELOVL6: n=83, FASN: n=84, FOXO1: n=80, G6PC: n=84, HMGCS1: n=77, INSIG1: n=84, INSR: n=80, IRS1: n=78, LRP6: n=80, PCK1: n=84, PDK1: n=84, PNPLA2: n=77, SCD: n=80) in human liver (green box) and of gene expression with metabolic parameters from blood (red box) as well as with confounders (blue box, all n=85). Non-tested correlations are indicated by gray squares. (C) Expression of miR-182–5 p target genes in human diabetic liver (see also Figure 2—figure supplement 1C; same n as indicated in B). (D) Expression of target genes after overexpressing miR-182–5 p for 48 h in HepG2 cells in comparison to a negative control (nc, n=3). (E) Protein abundance of the novel target gene LRP6 is reduced after overexpression of miR-182–5 p for 72 h in HepG2 cells (n=3). (F) Overexpression of miR-182–5 p in HEK-293 cells decreases luciferase activity after 48 h in a luciferase reporter assay for the LRP6 wild-type (WT) sequence but not in the mutated seed (n=3). (G) Glucose uptake is significantly reduced (0.82-fold) in HepG2 cells after 48 h of miR-182–5 p overexpression and acute insulin stimulation for 20 min (n=3). (H) Measurement of pAkt/Akt via Western blot indicates insulin resistance in HepG2 cells 48 hr after overexpression of miR-182–5 p (0.13-fold, n=3). Data are shown as scatter dot plots with mean ± SD (A, E–H) or correlation matrices (B–D). Without multiple testing correction: ***p<0.001, **p<0.01, *p<0.05 (A, E–H); corrected for multiple testing: ***q<0.001, *q<0.05, significant prior to adjustment: #p<0.05 (B,C,D); Students t-test (A,C,D, E–H) or Pearson’s correlation (B).
-
Figure 2—source data 1
Original file for the Western blot analysis of HepG2 LRP6 and HSP90 after mimic overexpression.
- https://cdn.elifesciences.org/articles/92075/elife-92075-fig2-data1-v1.zip
-
Figure 2—source data 2
PDF containing Figure 2E highlighted bands and sample labels for protein quantification.
- https://cdn.elifesciences.org/articles/92075/elife-92075-fig2-data2-v1.pdf
-
Figure 2—source data 3
Original file for the Western blot analysis of HepG2 Akt and phosphor-Akt after mimic overexpression.
- https://cdn.elifesciences.org/articles/92075/elife-92075-fig2-data3-v1.zip
-
Figure 2—source data 4
PDF containing Figure 2H highlighted bands and sample labels for protein quantification.
- https://cdn.elifesciences.org/articles/92075/elife-92075-fig2-data4-v1.pdf
-
Figure 2—source data 5
Phenotypic and qPCR expression (dCT values) data of the human cohort.
- https://cdn.elifesciences.org/articles/92075/elife-92075-fig2-data5-v1.xlsx
Figure 2—figure supplement 1
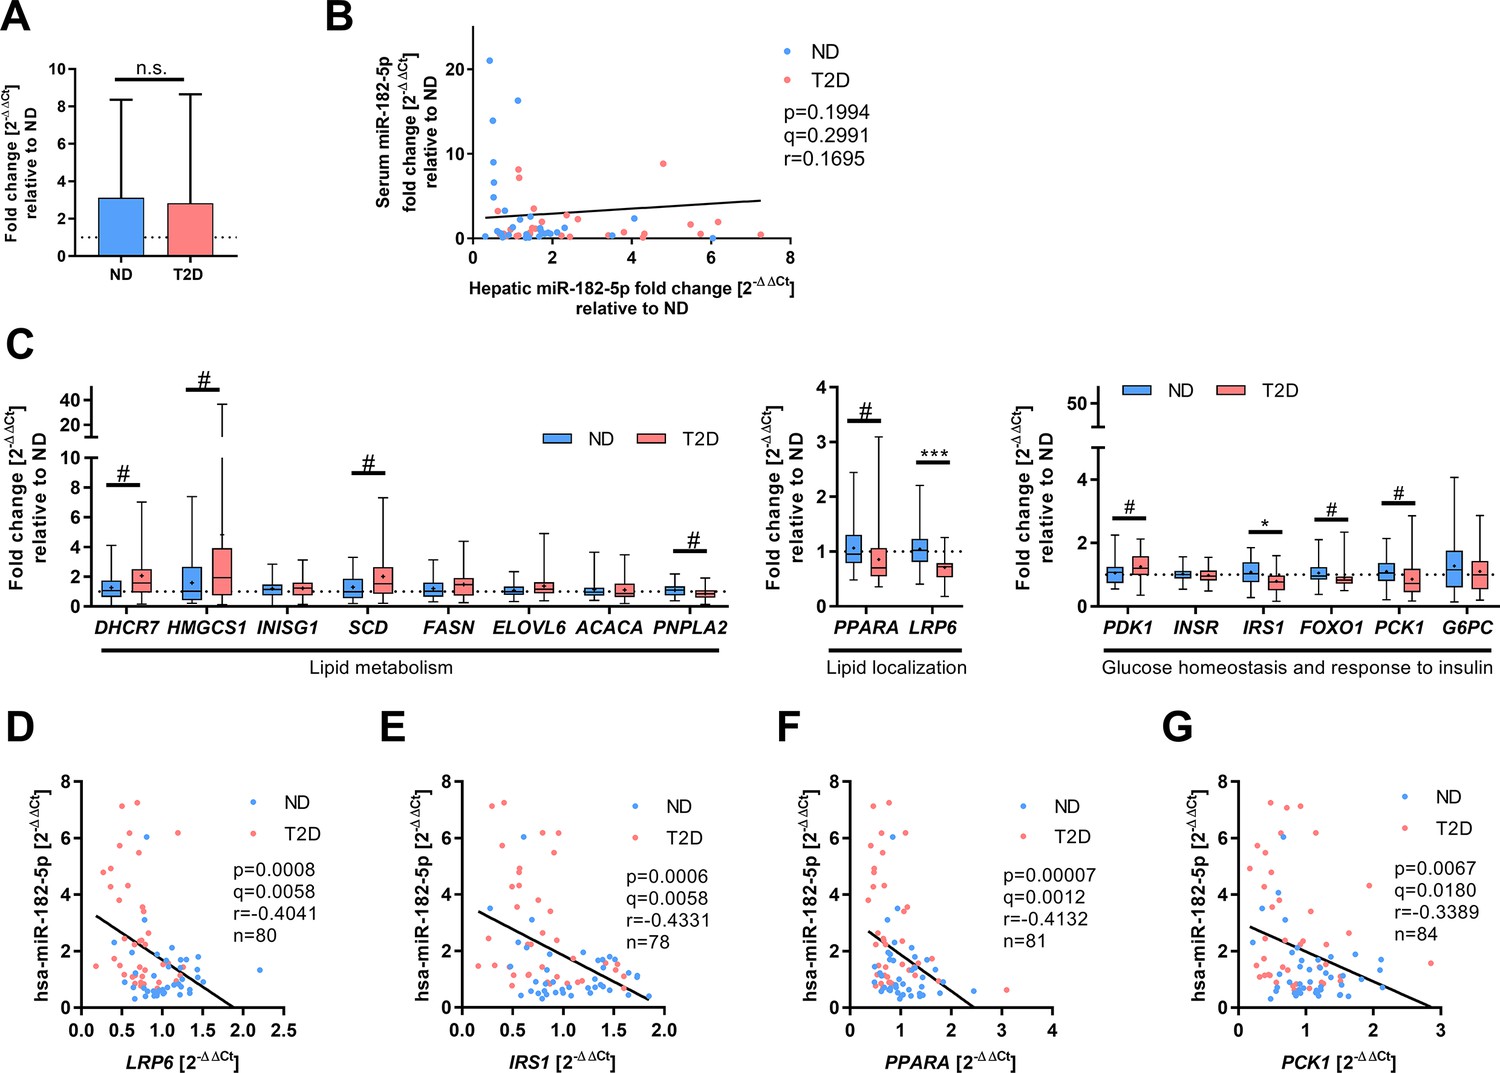
Hepatic gene expression of miR-182–5 p target genes and correlation to miRNA expression as described by correlation plot (main Figure 2B) and heat map (main Figure 2C).
(A) Serum miR-182–5 p levels are not altered between obese human subjects without (non-diabetic, ND, n=30) or with type 2 diabetes (T2D, n=29). (B) Serum miR-182–5 p levels are not associated with hepatic miR-182–5 p expression in obese subjects (n=59). (C) Expression of metabolic miR-182–5 p target genes (ACACA: n=44/41, DHCR7: n=42/40, ELOVL6: n=43/40, FASN: n=44/40, FOXO1: n=40/40, G6PC: n=44/40, HMGCS1: n=39/38, INSIG1: n=44/40, INSR: n=41/39, IRS1: n=40/38, LRP6: n=41/39, PCK1: n=44/40, PDK1: n=43/41, PNPLA2: n=38/39, SCD: n=41/39). Correlation analysis between miR-182–5 p expression and its target genes LRP6 (D), IRS1 (E), PPARA (F), and PCK1 (G) in obese human liver. Data are shown as mean ± SD (A), scatter plot (B, D–G) or box-whisker plots with min and max values, expression mean is indicated as cross within the box plots (C). Corrected for multiple testing: ***q<0.001, *q<0.05, significant prior to adjustment for multiple testing: #p<0.05 (B,C,D); Students t-test (A,C) or Pearson’s correlation (B, D–G).
Figure 2—figure supplement 2

Mimic transfection in HepG2 cells led to a significant 400-fold upregulation of miR-182–5 p (Students t-test, n=3).
Figure 2—figure supplement 3
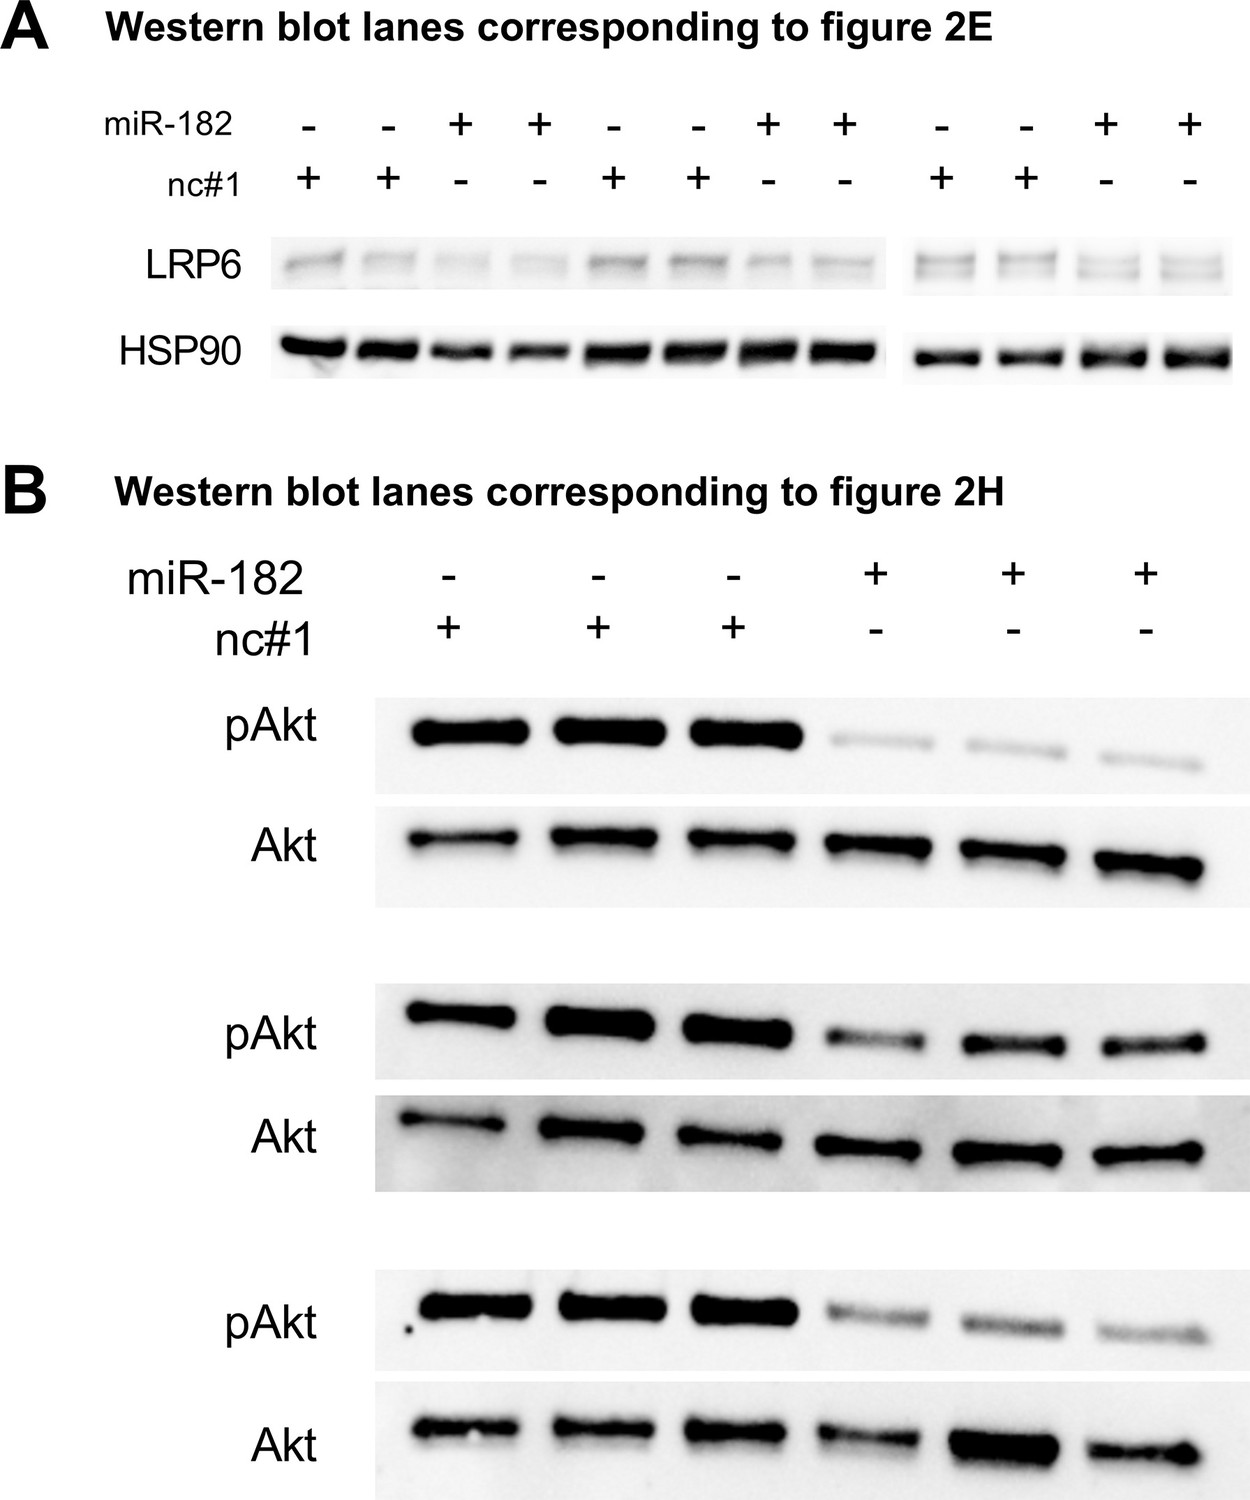
Western blot lanes used for quantification and which are corresponding to Figure 2E (A) or Figure 2H (B).
Figure 2—figure supplement 4
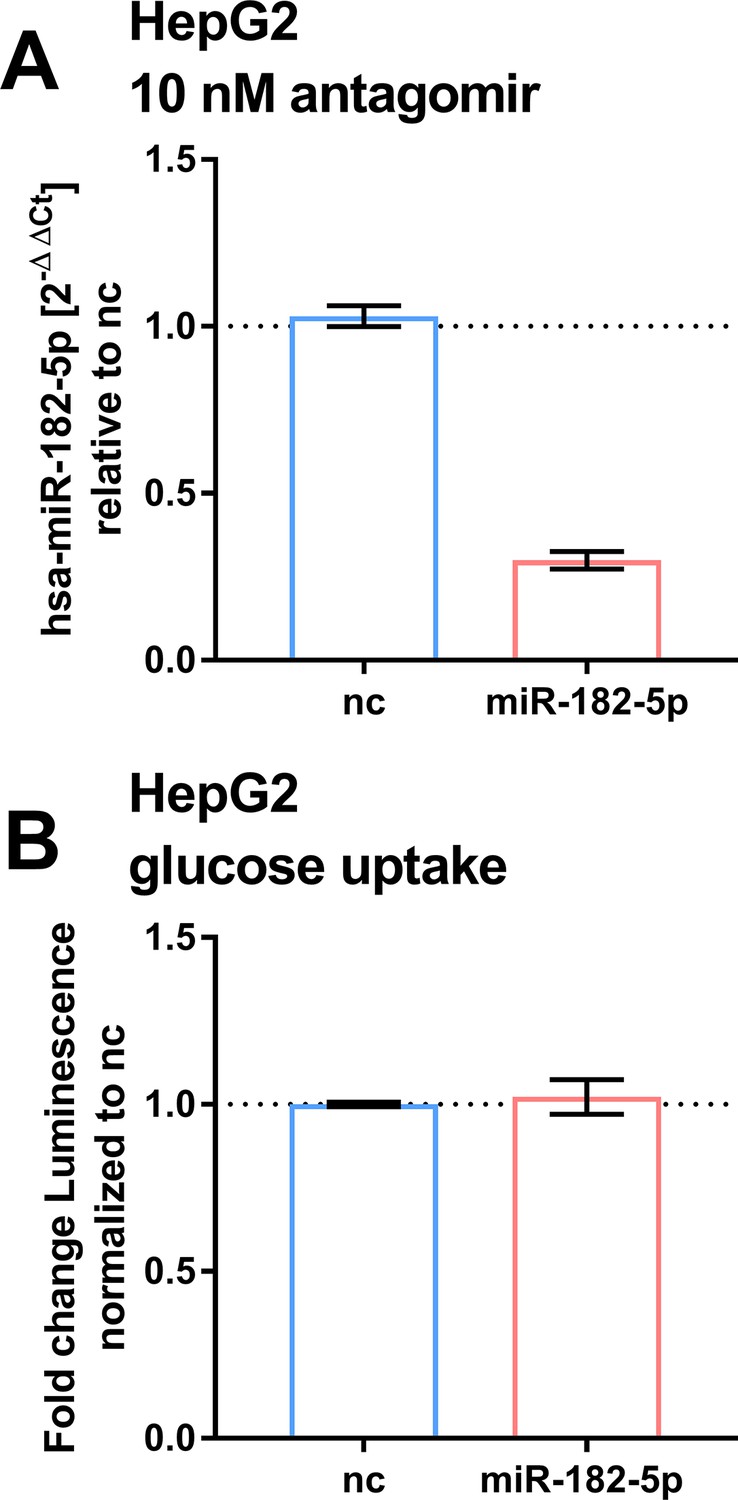
Effects of suppressing basal miR-182–5 p in HepG2.
(A) Treatment of HepG2 cells with 10 nM miR-182–5 p antagomir leads to a 0.4-fold reduction of miR-182–5 p expression (n=2). (B) The reduction did not lead to a significant change in glucose uptake (n=2). Students t-test (A, B).
Figure 3 with 1 supplement
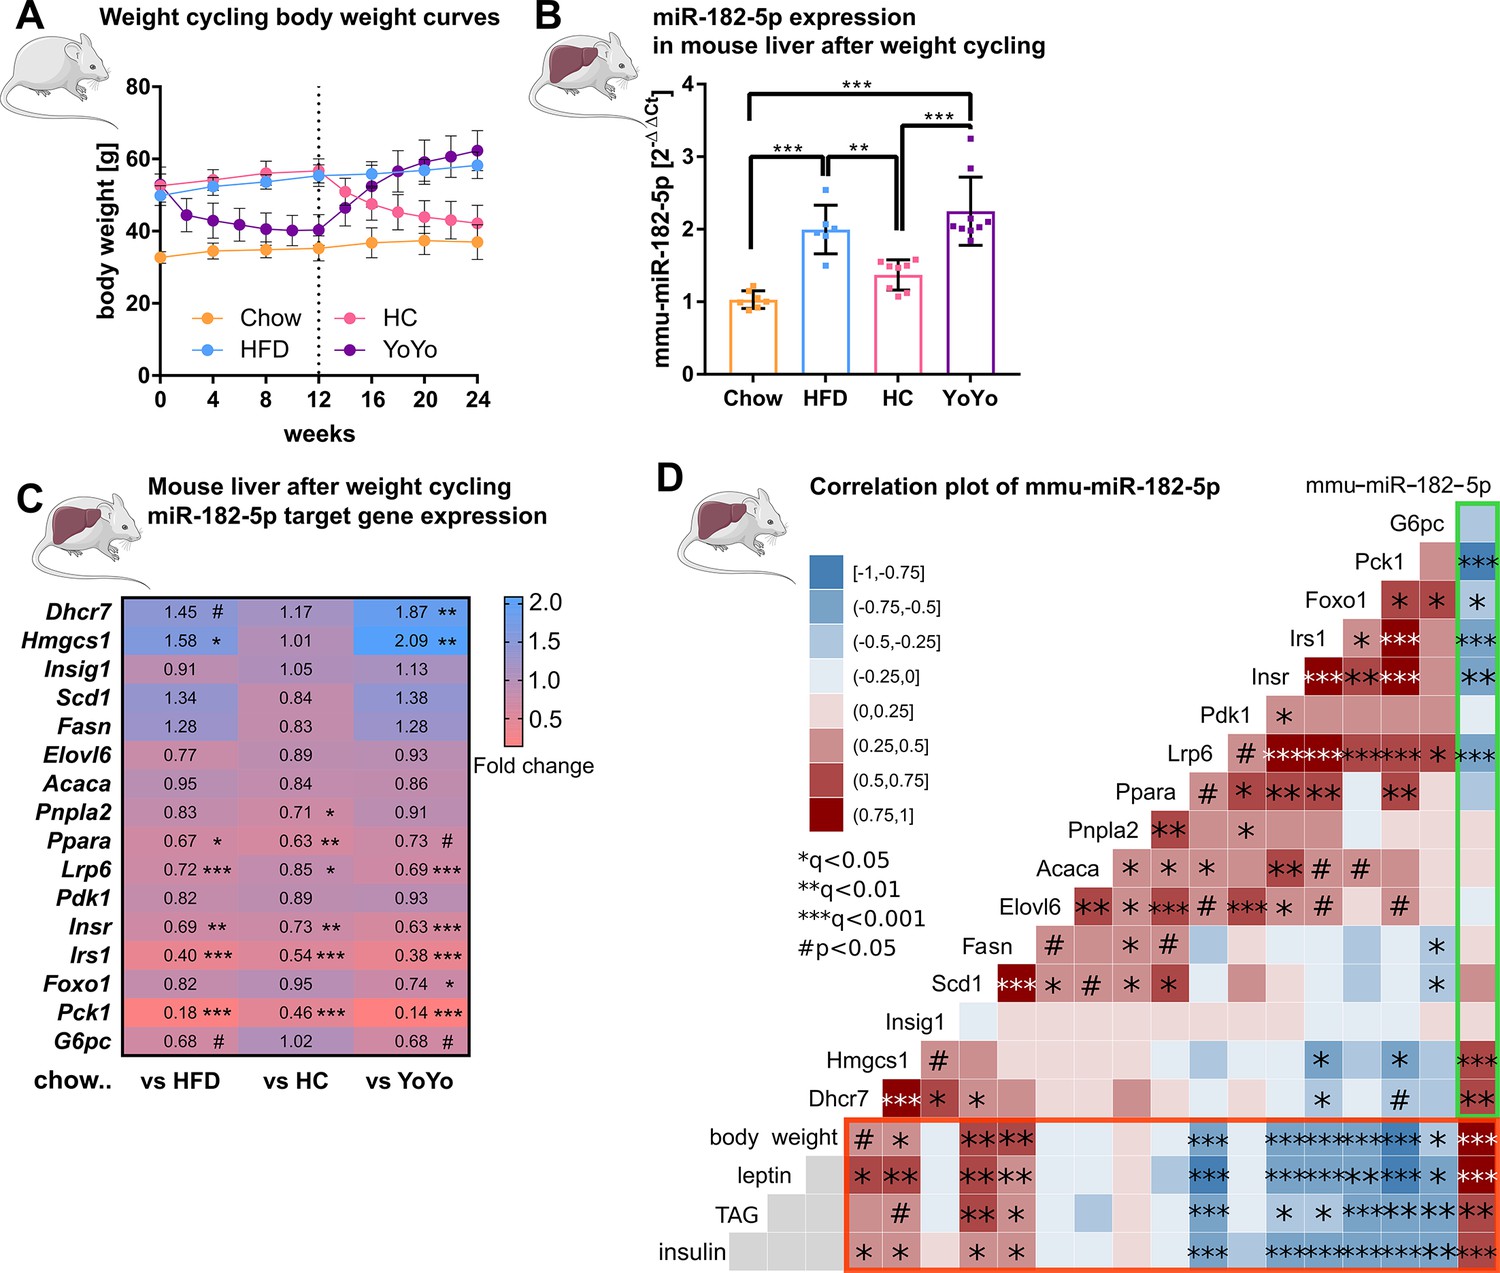
Hepatic miR-182–5 p expression in obese mice can be reversed by weight-loss.
(A) Body weight in grams of mice in the weight cycling cohort (n=7 Chow, n=6 HFD, n=8 HC, n=9 YoYo). Groups of obese high fat diet (HFD)-fed mice were switched to chow for 12 weeks (HC) to induce body weight loss and re-fed with HFD for another 12 weeks (YoYo). (B) Expression of miR-182–5 p in liver of mice undergoing weight cycling. (C) Expression of target genes of miR-182–5 p in murine liver compared to the Chow control group (see also Figure S2). (D) Correlation plot of hepatic miR-182–5 p expression and its target genes in murine liver (green box) and of gene expression with relevant metabolic parameters (red box). Non-tested correlations are indicated by gray squares. TAG: triacylglycerol. Data are shown as mean ± SD (A,B) or correlation matrices (C,D). Corrected for multiple testing: ***q<0.001, ***q<0.01, *q<0.05, significant prior to adjustment: #p<0.05 (C, D); One-Way ANOVA (B) or Pearson’s correlation (C,D).
-
Figure 3—source data 1
Phenotypic and qPCR expression (dCT values) data of the weight cycling mouse cohort.
- https://cdn.elifesciences.org/articles/92075/elife-92075-fig3-data1-v1.xlsx
Figure 3—figure supplement 1
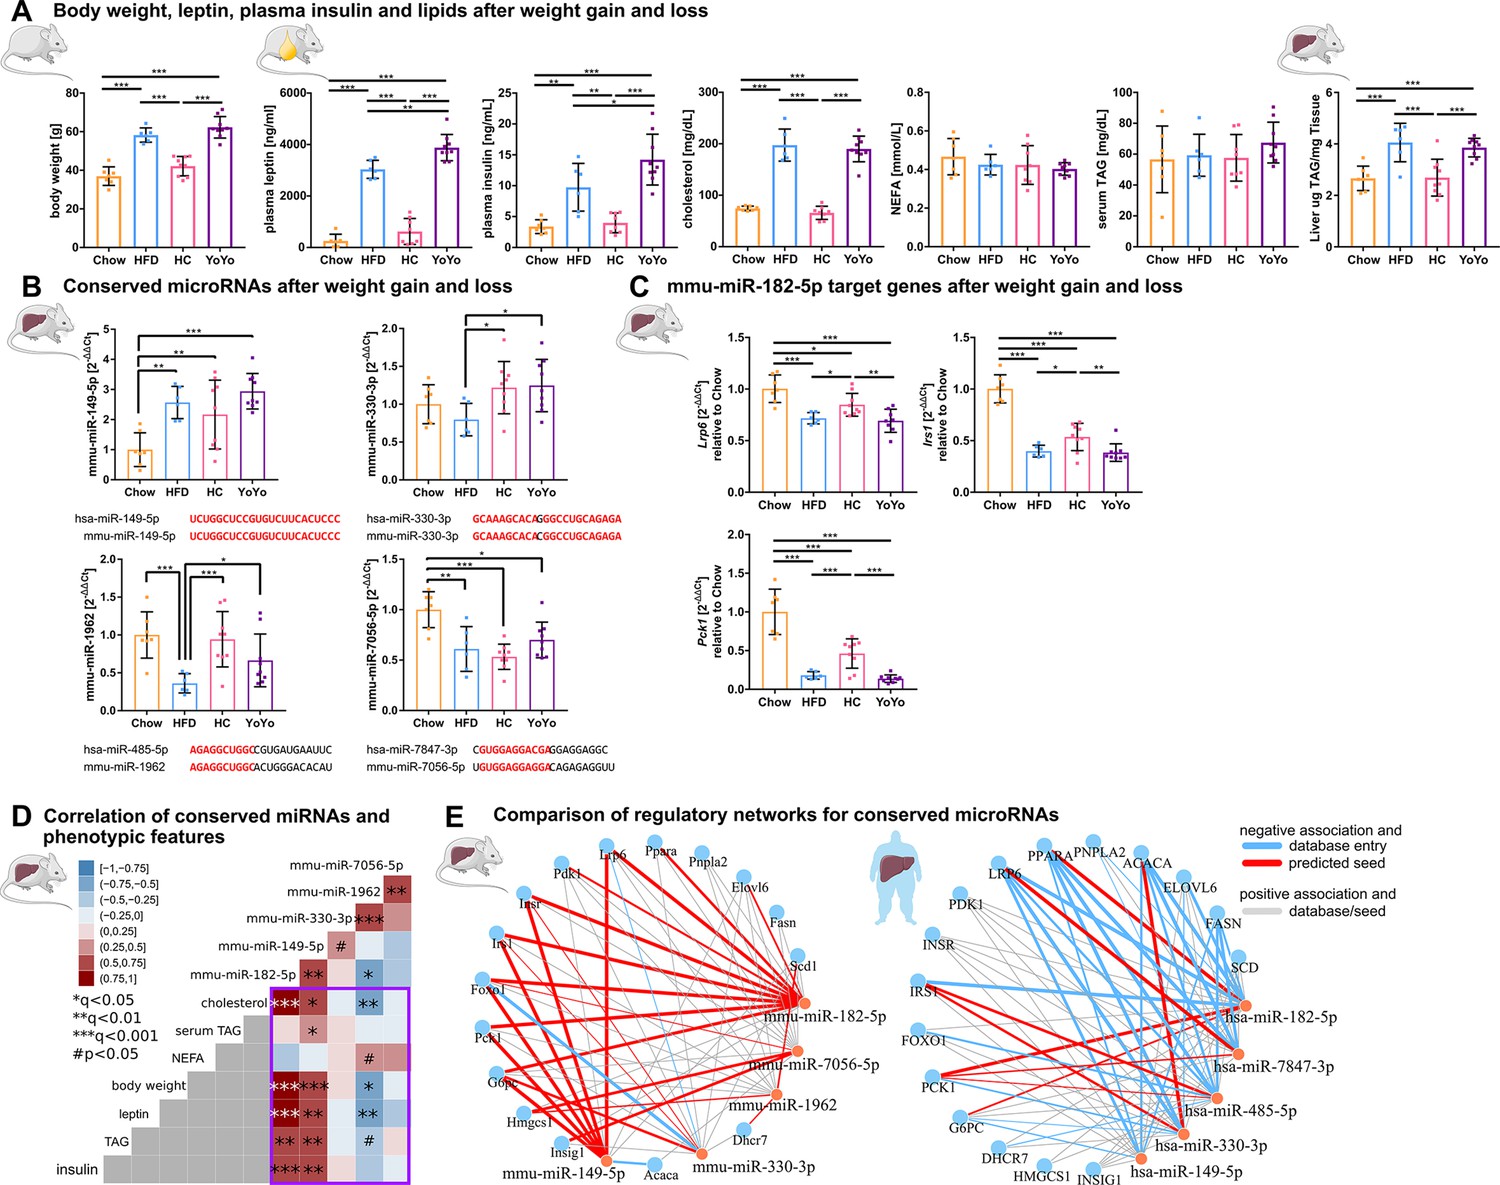
Expression and phenotypic association of conserved metabolic microRNAs and target genes in murine liver during weight cycling with a comparison between predicted murine and human regulatory gene networks.
(A) Weight cycling in mice over 24 weeks induces changes in body weight that are associated with alterations in plasma markers and hepatic fat content (n=7 Chow, n=6 HFD, n=8 HC, n=9 YoYo). (B) Only mmu-miR-149–5 p follows the expected expression pattern of overexpression in high fat diet (HFD) and reversal during weight cycling as observed in human type 2 diabetes (T2D), whereby the other three conserved miRNAs are reduced after HFD feeding. The miRNAs miR-149–5 p and miR-330–3 p are expressed from conserved genes, whereby mmu-miR-1962 and mmu-miR-7056–5 p constitute orthologues to human hsa-miR-485–5 p and hsa-miR-7847–3 p, respectively based on seed matches. Shared sequences are indicated in red. (C) Hepatic expression of Lrp6, Irs1, and Pck1 is significantly altered by weight cycling in obese mice. (D) Mmu-miR-182–5 p shows the strongest positive associations to hepatic triacylglycerol (TAG), plasma leptin and insulin, body weight, and cholesterol in the weight cycling cohort. mmu-miR-149–5 p is further associated with serum TAG, which is also observed for human hepatic hsa-miR-149–5 p expression. (E) Direct comparison between murine and human miRNA-target gene networks reveals a highly conserved and connected network with every metabolic miRNA potentially targeting several genes. The expression values of the murine network are based on qPCR measurements from the weight cycling cohort and the expression values of the human network are based on miRNA microarray and target gene qPCR measurements of n=40 individuals. Weights of the graph edged are based on Pearson's correlation. Data are shown as scatter dot plots with mean ± SD (A–C), correlation matrices (D), or interaction network (E). Corrected for multiple testing: ***q<0.001, **q<0.01, *q<0.05, significant prior to adjustment: #p<0.05 (A–D); One-Way ANOVA (A–C) or Pearson’s correlation (D).
Figure 4 with 1 supplement
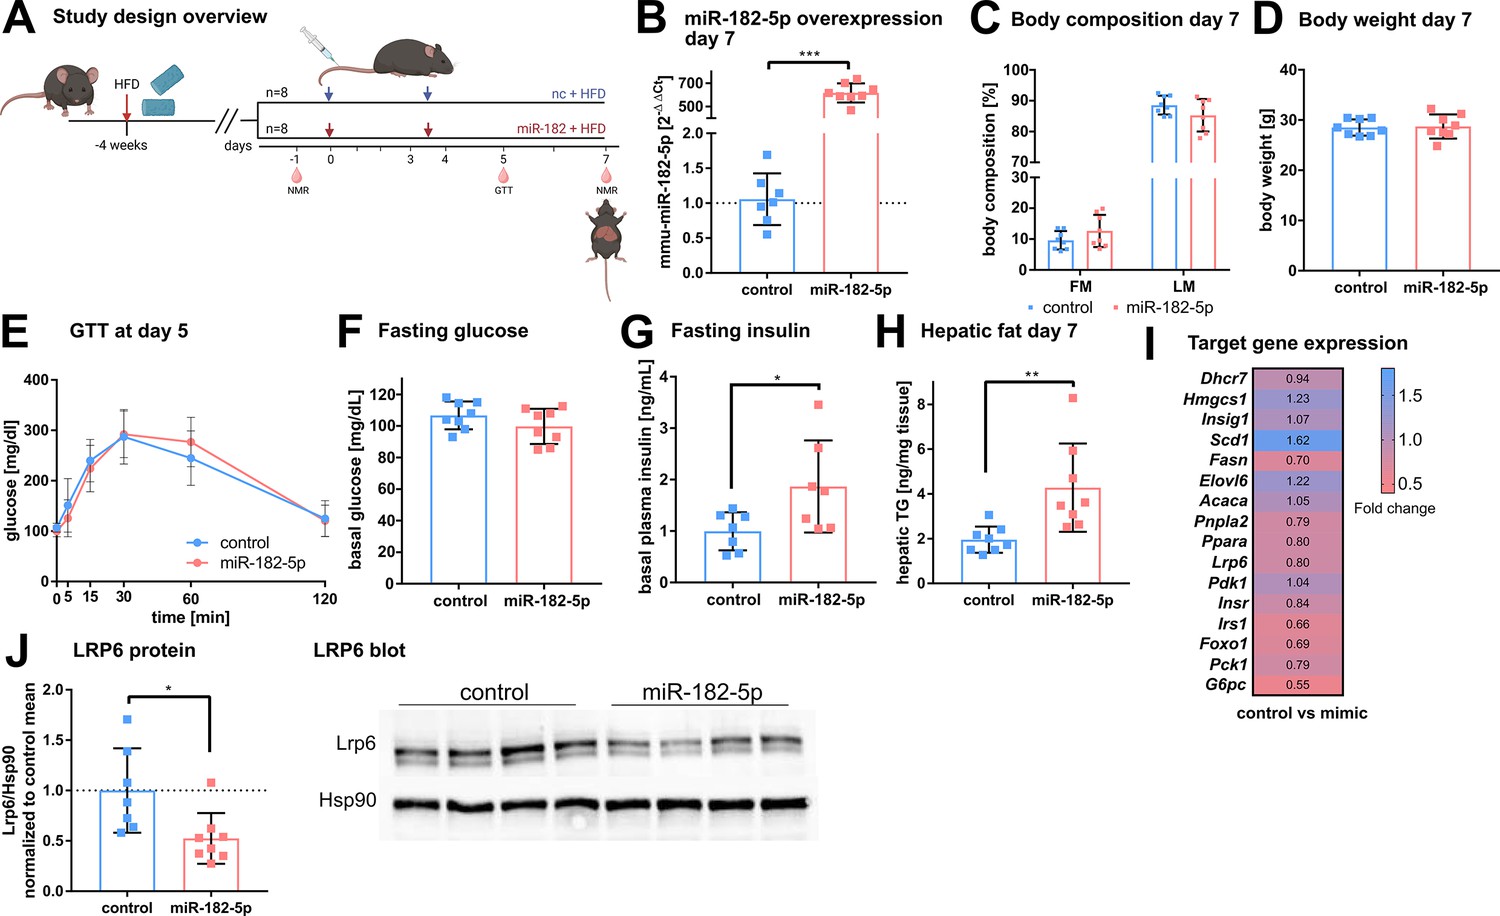
In vivo overexpression of miR-182–5p elevates fasting insulin levels and hepatic fat content and reduces LRP6 protein levels.
(A) Mice were challenged with high fat diet (HFD) for four weeks prior to the first injection of 1 mg miRNA mimic per kg body weight and sacrificed after seven days (n=8 per group if not stated otherwise). A second injection was performed after 3.5 days. Body composition was examined at days –1 and 7 by NMR. Glucose and insulin levels were determined from blood at days –1, 5, and 7. Glucose tolerance was evaluated at day 5. (B) Hepatic miR-182–5 p expression was 584-fold upregulated at day 7. (C) Fat mass tended to be increased in the miR-182–5 p injected group but (D) body weight was not different between control and miR-182–5 p treated mice. (E) Glucose tolerance and (F) fasting glucose were not different between both groups. (G) Fasting insulin levels (n=7 per group) and (H) hepatic triglyceride content were increased 2.25-fold and 2.19-fold in miR-182–5 p treated mice, respectively. (I) Comparable mRNA, but (J) 0.52-fold diminished LRP6 protein levels in liver samples of miR-182–5 p treated mice. The LRP6 blot depicts an example blot of n=4 per group. Data are shown as mean ± SD (B–H). *p<0.05, **p<0.01; Student’s t-test (B–H). Panel A created with BioRender.com, and published using a CC BY-NC-ND license with permission.
© 2024, BioRender Inc. Figure 4 was created using BioRender, and is published under a CC BY-NC-ND 4.0. Further reproductions must adhere to the terms of this license
-
Figure 4—source data 1
Original file for the Western blot analysis of murine LRP6 after treatment with mimic.
- https://cdn.elifesciences.org/articles/92075/elife-92075-fig4-data1-v1.zip
-
Figure 4—source data 2
Phenotypic and qPCR expression (dCT values) data of the mouse trial cohort.
- https://cdn.elifesciences.org/articles/92075/elife-92075-fig4-data2-v1.xlsx
Figure 4—figure supplement 1
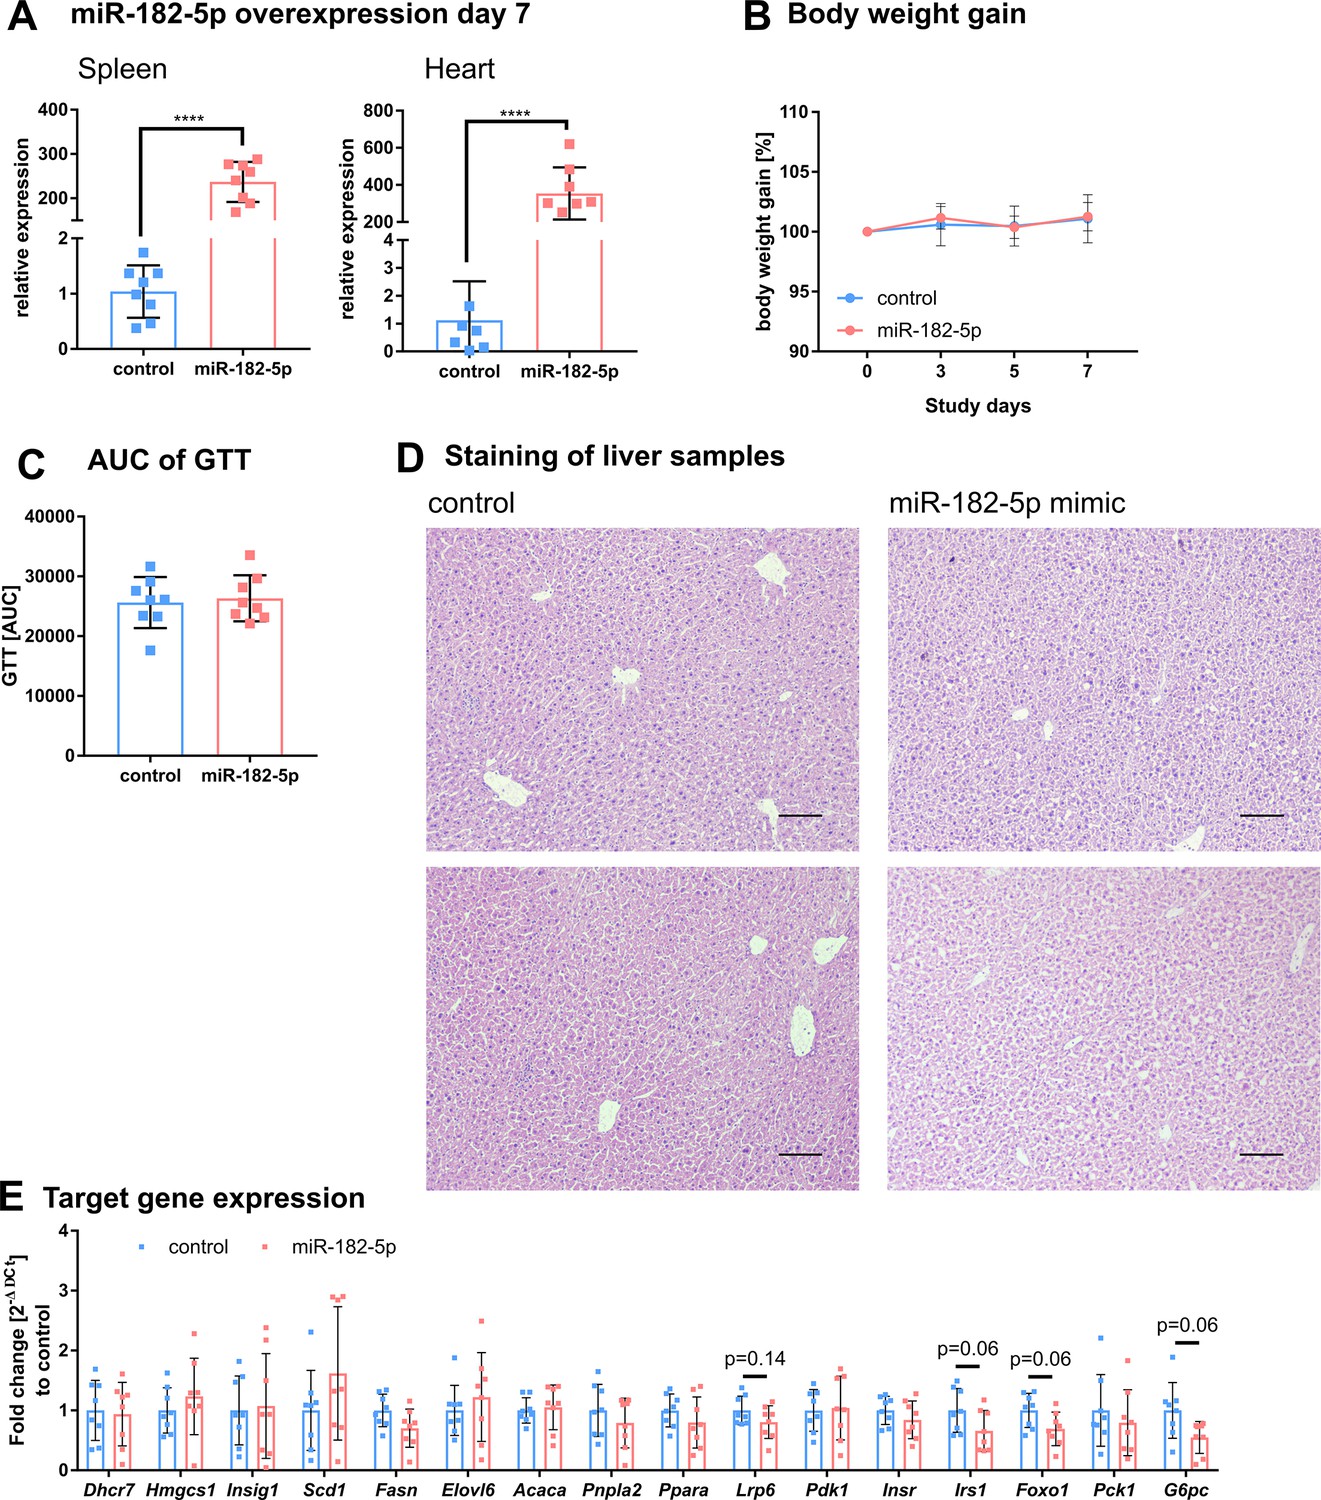
Additional phenotypic characteristics of mice overexpressing of miR-182–5 p in liver.
(A) Detection of miR-182–5 p after tail vein injection in spleen and heart is significantly increased (n=8 per group). (B) Body weight gain and (C) area under the curve (AUC) of the glucose tolerance test (GTT) did not differ between control and miR-182–5 p treated mice (n=8 per group). (D) Hematoxylin and eosin (HE) liver staining of two representative control and mimic treated animals. Mice overexpressing miR-182–5 p show more lipid accumulations. Scale bar represents 100 µm. (E) miR-182–5 p target gene expression was not changed after one week of acute miRNA overexpression, but Lrp6, Irs1, Foxo1, and G6pc showed a strong tendency to reduced expression (n=8 per group). Data are shown as mean ± SD (B) or scatter dot plots with mean ± SD (A, C, E).
-
Figure 4—figure supplement 1—source data 1
PDF containing Figure 4J highlighted bands and sample labels for protein quantification.
- https://cdn.elifesciences.org/articles/92075/elife-92075-fig4-figsupp1-data1-v1.zip
Figure 5
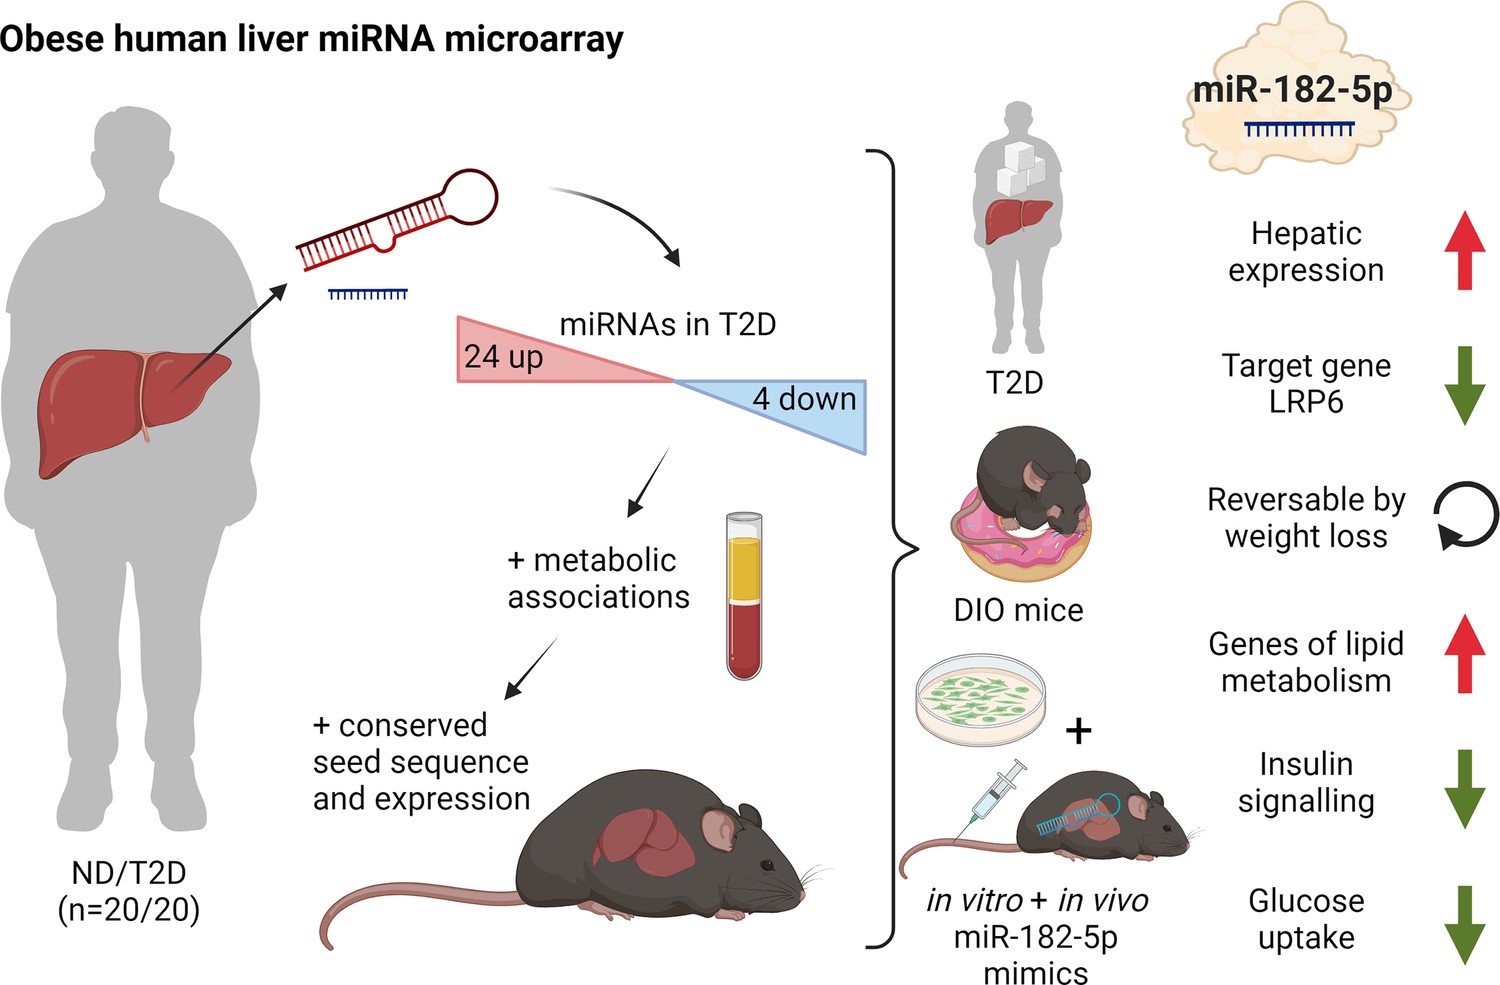
Dynamic regulation of insulin resistance and hepatic lipogenesis by miR-182–5 p.
Expression of 28 microRNAs was significantly altered in the liver of humans with obesity and type 2 diabetes (T2D) versus humans with obesity but no diabetes (ND). These regulated microRNAs were compared to the hepatic microRNA transcriptome of obese mice and associated with metabolic traits. From those miR-182–5 p was selected as overlapping candidate. LRP6 is the main target gene and consistently altered in humans, cell culture, and obese mice. miR-182–5 p is induced by long-term feeding of high-fat diet in mice and reversed by weight loss. Liver-specific upregulation of miR-182–5 p in metabolically challenged mice induced hepatic fat accumulation and increased fasting insulin levels. Figure created with BioRender.com, and published using a CC BY-NC-ND license with permission.
© 2024, BioRender Inc. Figure 5 was created using BioRender, and is published under a CC BY-NC-ND 4.0. Further reproductions must adhere to the terms of this license
Additional files
-
Supplementary file 1
Clinical Characteristics for the complete (n=85) and the microarray (n=40) human liver cohort.
A rank sum test was performed to find significant differences between both subgroups.
- https://cdn.elifesciences.org/articles/92075/elife-92075-supp1-v1.xlsx
-
Supplementary file 2
Primer sequences for SYBR-green analysis of cDNA by qPCR and cloning.
- https://cdn.elifesciences.org/articles/92075/elife-92075-supp2-v1.xlsx
-
Supplementary file 3
Assay-IDs for TaqMan Gene-expression Assays and TaqMan Advanced miRNA Assays.
- https://cdn.elifesciences.org/articles/92075/elife-92075-supp3-v1.xlsx
-
Supplementary file 4
Associations between miRNAs and type 2 diabetes (T2D).
Logistic regression models for the incidence of T2D were generated using self-written scripts in MATLAB. Age, sex, BMI, and the NAFLD activity score (NAS) were used as additional cofactors. The coefficient estimate and p-value are indicated for the respective miRNA expression. ID is the respective identifier for the human microRNA on the GeneChip miRNA 4.0 Array.
- https://cdn.elifesciences.org/articles/92075/elife-92075-supp4-v1.xlsx
-
Supplementary file 5
Associations between miRNAs and metabolic traits.
Effect sizes describe the change of the trait if the miRNA expression changes by 1 log2 value. Age, sex, BMI, and the NAFLD activity score (NAS) were used as additional cofactors whenever they did not serve as response value. ID is the respective identifier for the human microRNA on the GeneChip miRNA 4.0 Array.
- https://cdn.elifesciences.org/articles/92075/elife-92075-supp5-v1.xlsx
-
Supplementary file 6
Associations between miRNAs and excluding factors age and BMI.
To control for associations with both confounding factors, also the HbA1c level was considered as cofactor for linear regression models. Effect sizes describe the change of the trait if the miRNA expression changes by 1 log2 value. ID is the respective identifier for the human microRNA on the GeneChip miRNA 4.0 Array.
- https://cdn.elifesciences.org/articles/92075/elife-92075-supp6-v1.xlsx
-
Supplementary file 7
Predicted target genes from miRTarBase used for pathway analysis.
- https://cdn.elifesciences.org/articles/92075/elife-92075-supp7-v1.xlsx
-
Supplementary file 8
Candidate genes for hsa-mR-182–5 p from database entries stratified by metabolic pathways from Gene Ontology.
Additional column qPCR contains target genes which were considered for analysis by qPCR in the complete cohort.
- https://cdn.elifesciences.org/articles/92075/elife-92075-supp8-v1.xlsx
-
Supplementary file 9
Result of all consulted target gene databases and a comprehensive 3’UTR screening for each potential target gene of hsa-miR-182–5 p.
Besides the relative position of the seed sequences within the 3’-UTR of the target gene, also the relative AU content of the surrounding 60 nt, whether there is an additional base pairing between the mRNA, and the miRNA 3’ of the seed and the relative position of the seed within the target 3’UTR is listed.
- https://cdn.elifesciences.org/articles/92075/elife-92075-supp9-v1.xlsx
-
MDAR checklist
- https://cdn.elifesciences.org/articles/92075/elife-92075-mdarchecklist1-v1.docx
-
Reporting standard 1
STROBE checklist for cross-sectional studies.
- https://cdn.elifesciences.org/articles/92075/elife-92075-repstand1-v1.docx
Download links
A two-part list of links to download the article, or parts of the article, in various formats.
Downloads (link to download the article as PDF)
Open citations (links to open the citations from this article in various online reference manager services)
Cite this article (links to download the citations from this article in formats compatible with various reference manager tools)
Liver microRNA transcriptome reveals miR-182 as link between type 2 diabetes and fatty liver disease in obesity
eLife 12:RP92075.
https://doi.org/10.7554/eLife.92075.3


