A mathematical model that predicts human biological age from physiological traits identifies environmental and genetic factors that influence aging
- Calico Life Sciences, United States
Figures
Figure 1
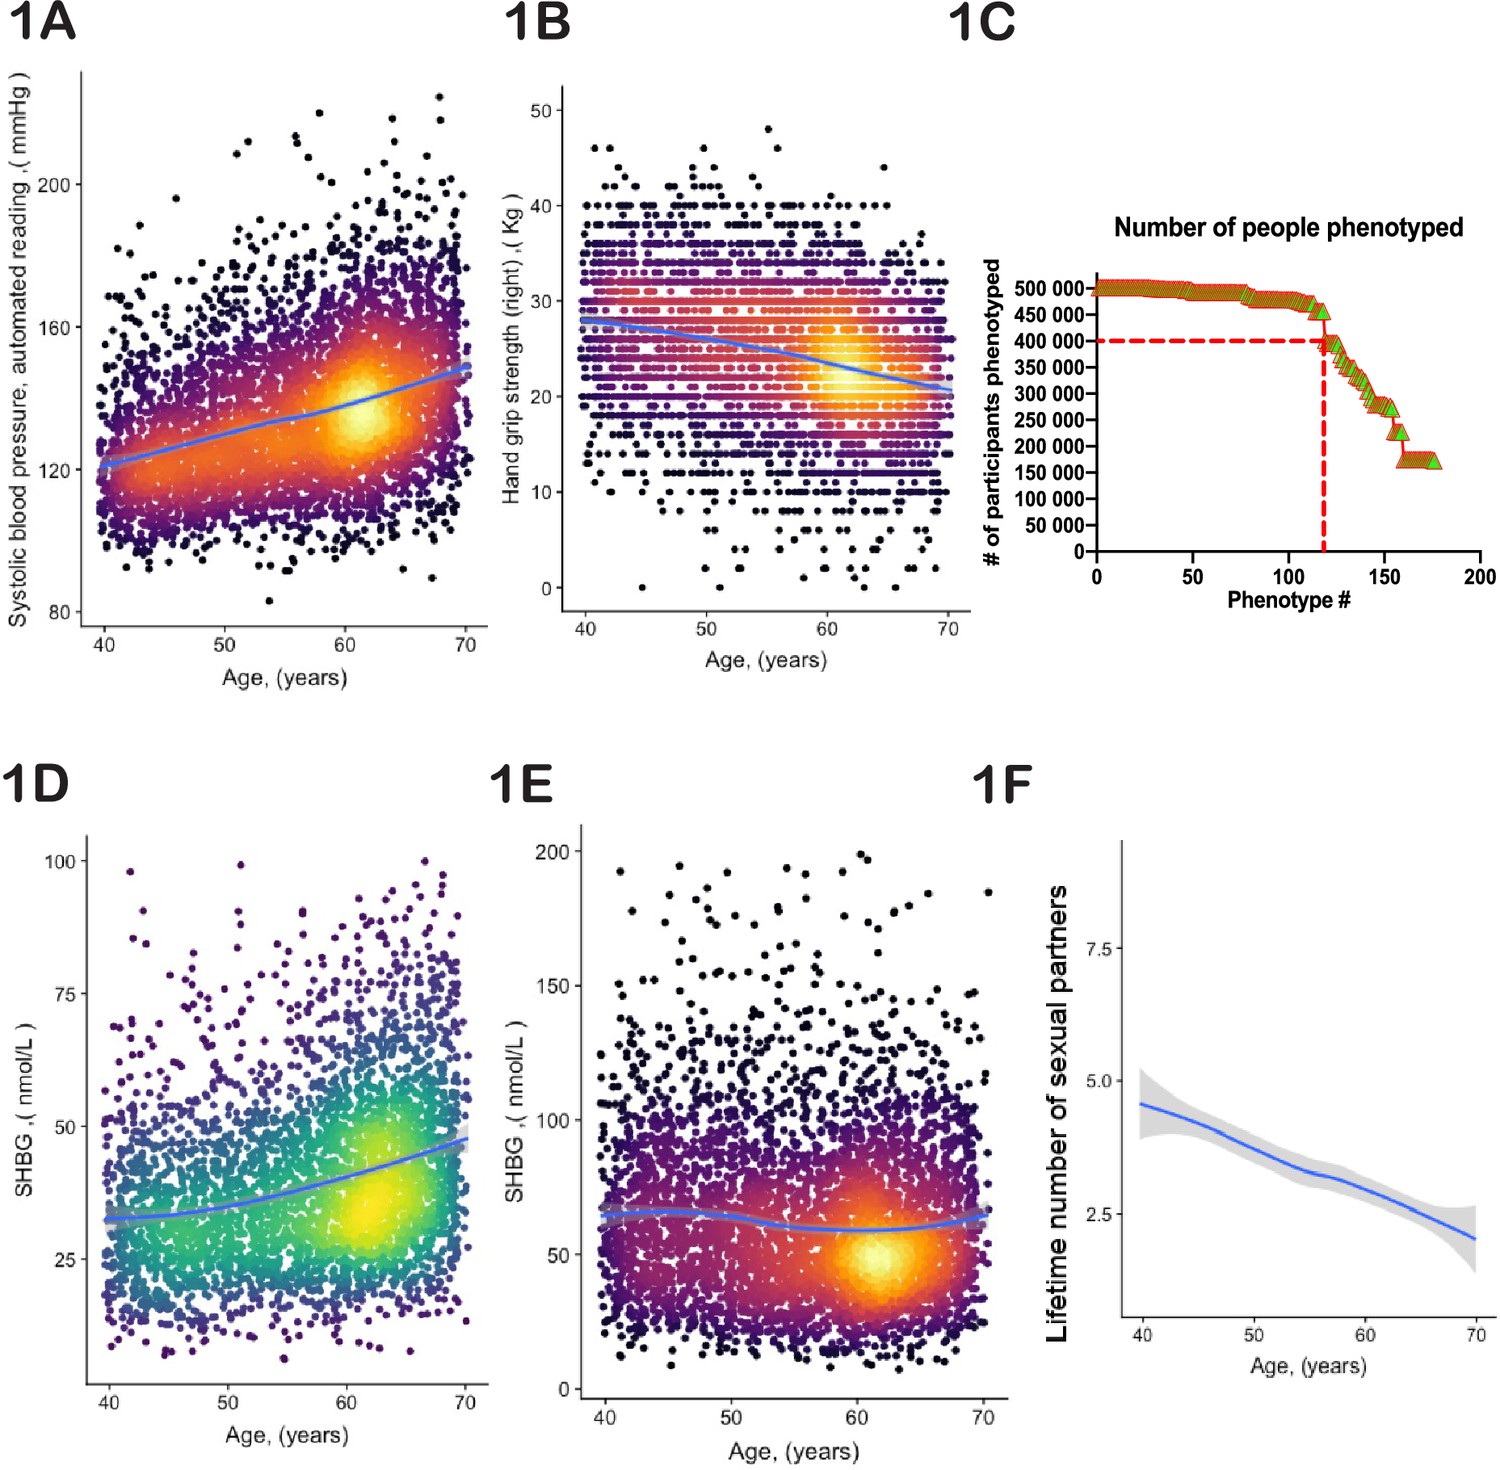
Selection of physiological phenotypes for bioloigcal age modelling.
(A) Systolic blood pressure (United Kingdom BioBank [UKBB] field ID# 4080) and (B) hand-grip strength (UKBB field ID# 47) of a random set of 10,000 female UKBB participants are plotted against their age. (C) Number of age-sensitive phenotypes plotted against the declining number of people in whom these phenotypes were measured. (D, E) Sex hormone binding globulin concentrations (UKBB field# 30830) of a random set of 10,000 males (D) and females (E). (F) Average number of lifetime sexual partners is plotted against the age of UKBB participants (UKBB field ID# 2149). Gray area denotes 99% confidence interval. Color of dots on the plot represents relative density of dots in the area.
Figure 2
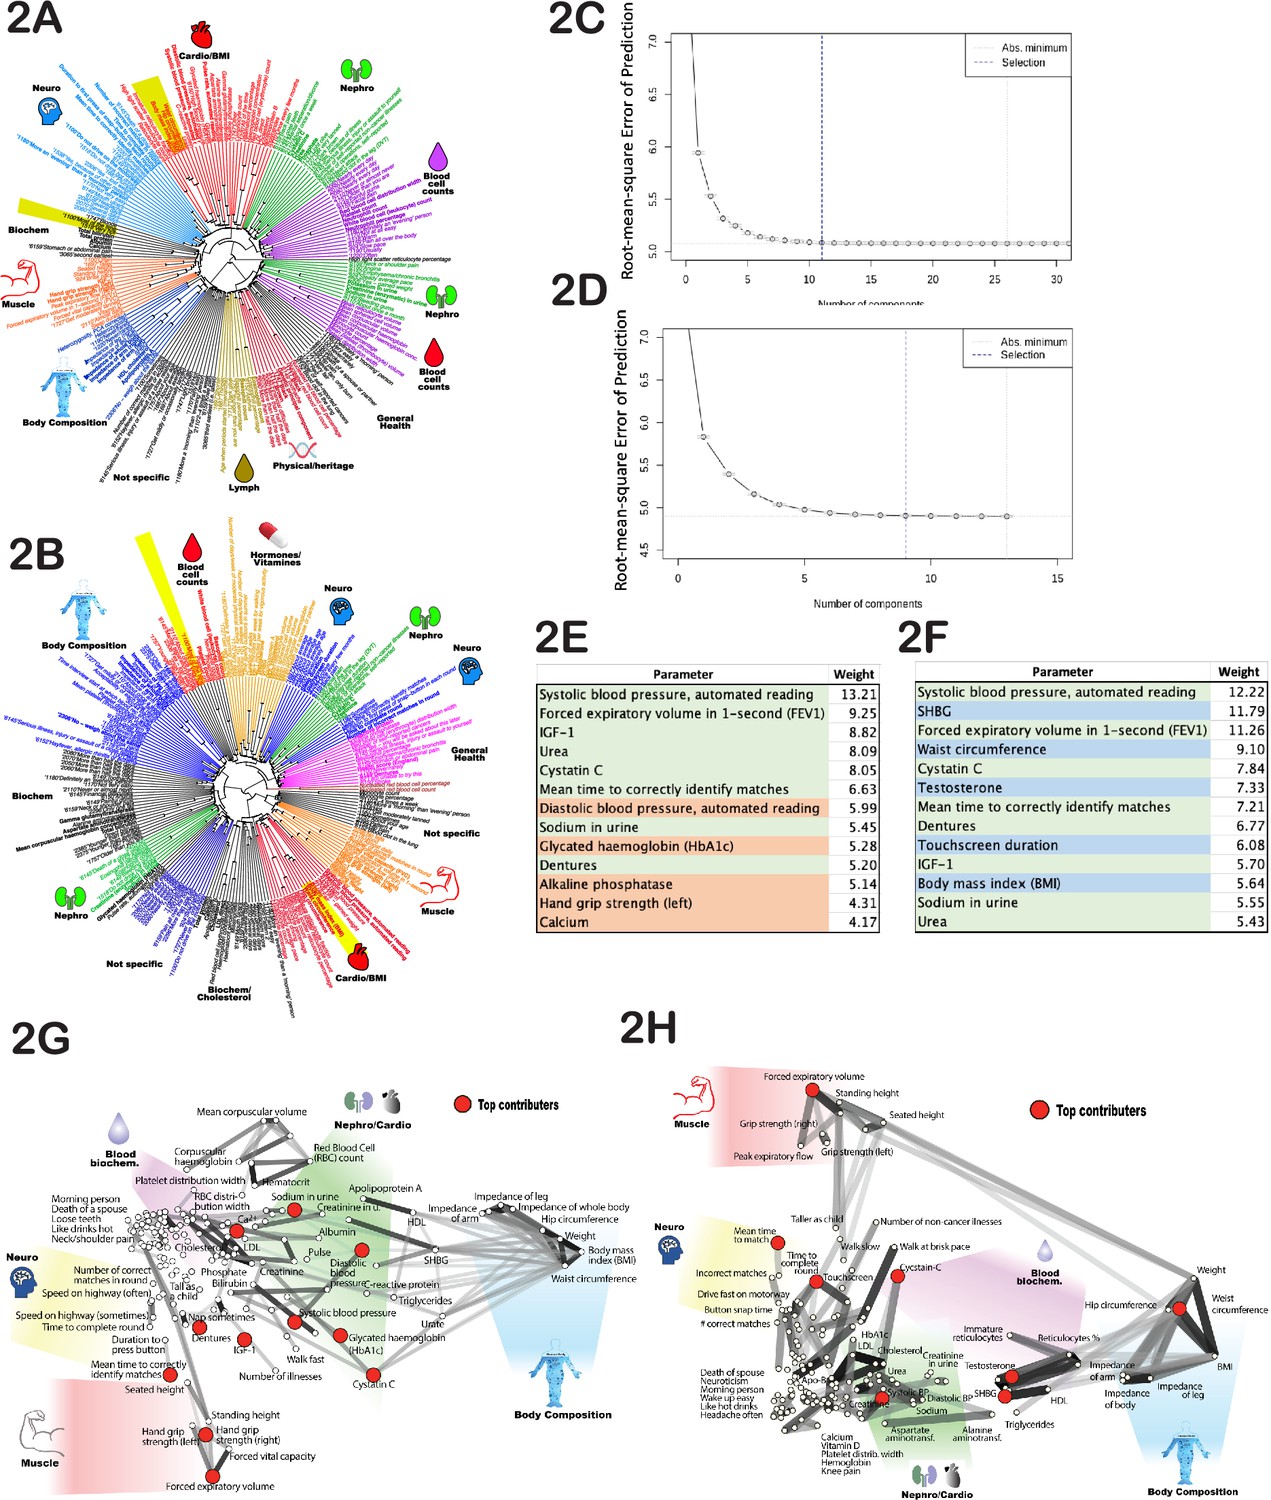
Age-dependent phenotypic clustering.
Dendrogram plots of age-dependent female (A) and male (B) phenotypes selected for age prediction. Numbers in the name of ‘rays’ represent United Kingdom BioBank (UKBB) ID numbers for multiple-choice questions (see Supplementary file 1 or the UKBB website), followed by the answer. Major clusters were colored and subjectively assigned a name that reflects a possible biological function of the cluster. The number of principal components included in the PLS (projection to latent structures) model to predict age vs root mean square error of the predictions is plotted for females (C) and (D) males. (E) The top phenotypes with the highest weights in the age-predicting PLS model are listed for (E) females and (F) males. Phenotypes shaded in green are shared between sexes, red are specific to females, and blue are specific to males. All phenotypes were used for both sexes, and this shading reflects only the position in the list of top 13 traits. (G) List of phenotypes used to predict age of females and (H) males projected on 2D space using correlation as the distance measure. The degree of correlation is also depicted by gray lines. The darker the shade, the stronger the correlation. Note that the distortion in positioning is an inevitable consequence of projecting high-dimensional data into 2D space. As before, groups of related phenotypes were subjectively assigned a name that likely depicts their physiology, and phenotypes with the highest weight in the PLS model were depicted by red dots.
Figure 3 with 1 supplement
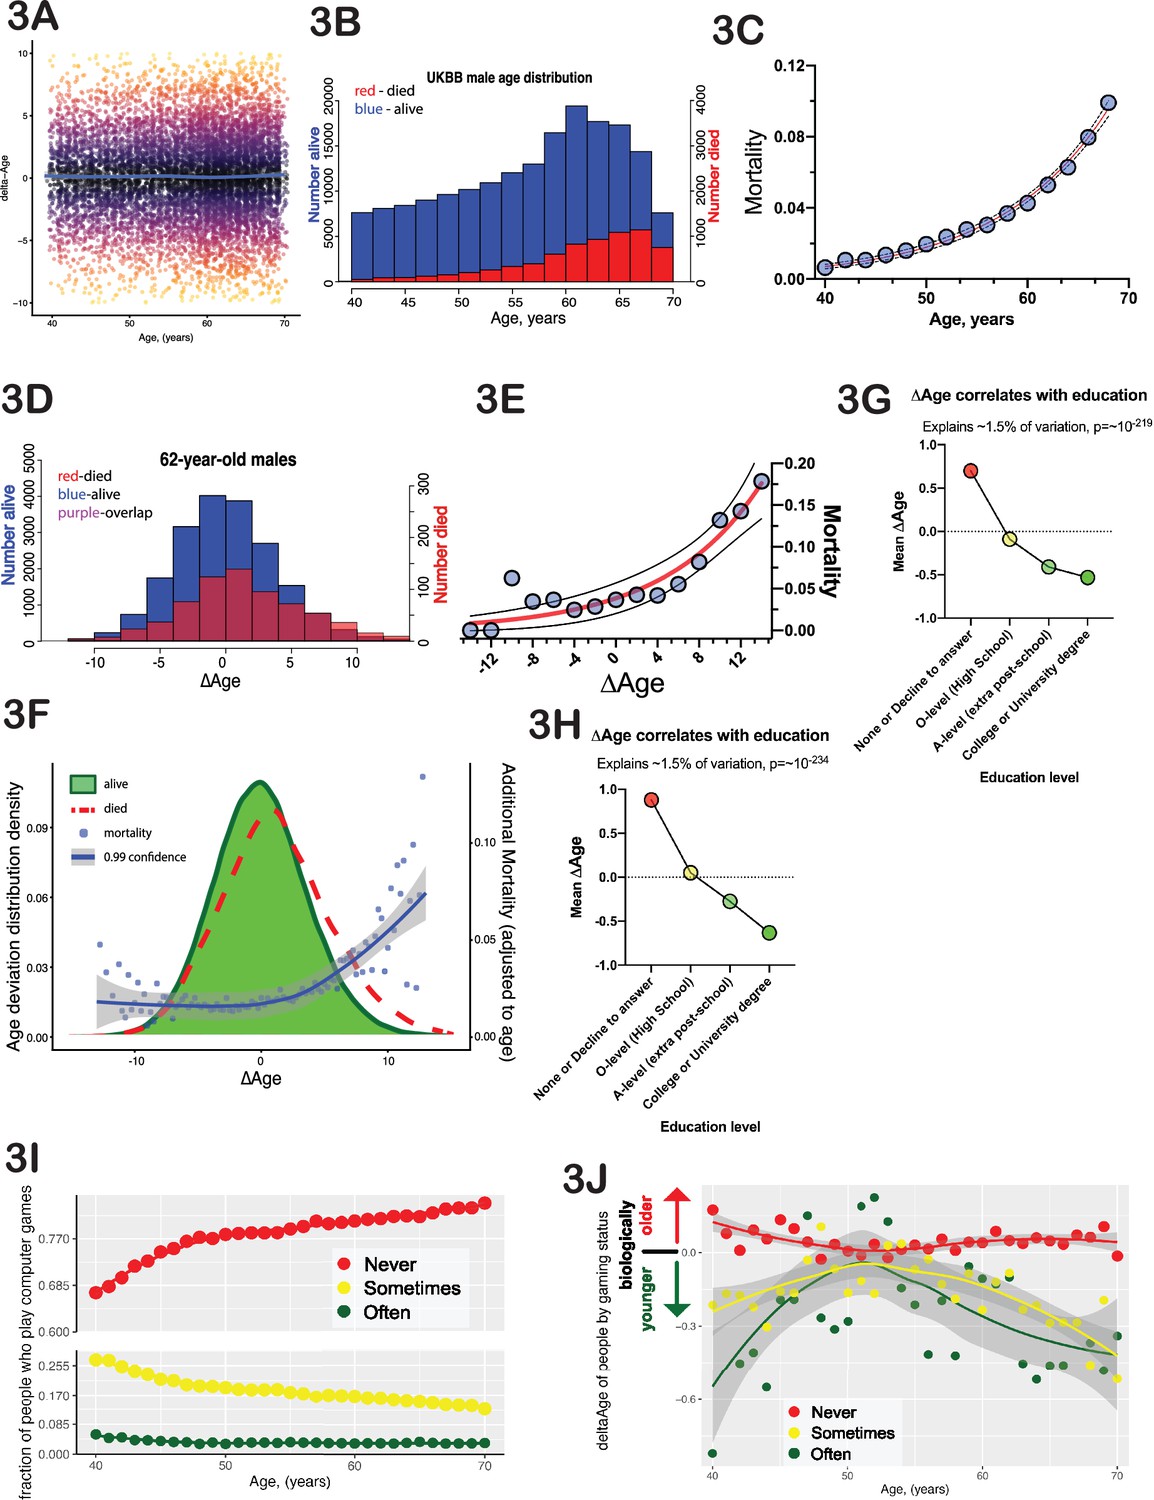
∆Age has biological meaning.
(A) Delta-age (∆Age, predicted biological age minus chronological age) is plotted against chronological age for a random subset of 10,000 United Kingdom BioBank (UKBB) participants. Note that there is no correlation between age and ∆Age. (B) Histogram of age distribution (blue) and death distribution (red, right y-axis) is presented for UKBB males. (C) Mortality of UKBB male participants vs their age is plotted; note the classical exponential (Gompertzian) shape. Blue dots are actual data, the red line is an exponential fit, and the black dash line is 95% confidence interval. (D) Histogram of the ∆Age distribution (blue) and death distribution (red, right y-axis) is presented for UKBB males of 62 years of age only. (E) Mortality of 62-year-old males is plotted against their ∆Age. Blue dots are actual data, the red line is an exponential fit, and the black dashed line is 95% confidence interval. Once again, note the classical exponential (Gompertzian) shape with ∆Age, even though all the subjects are the same age chronologically. (F) Distribution of ∆Age for all the people in UKBB (all ages and all genders, green shape). The distribution of ∆Age for people who died within 5 years after enrolling in the UKBB (red line) is shown for comparison; note a shift of the deceased distribution to the right toward larger ∆Age (predicted older on average). The mortality penalty due to ∆Age is plotted as blue dots (left y-axis), the exponential fit of these data is presented as a blue line, and the 99% confidence interval as a gray shade. (G) Average ∆Age is plotted for UKBB males (G) and females (H) against their highest education (qualification) level achieved. (I) The fraction of people who play computer games ‘sometimes’ (yellow dots), never (red dots), and people who play computer games ‘often’ (green dots). (J) Average ∆Age of people at different ages separated by their computer gaming habits (see I). As a group, people who play computer games ‘often’ are biologically younger than people who play computer games ‘sometimes’ or ‘never’.
Figure 3—figure supplement 1
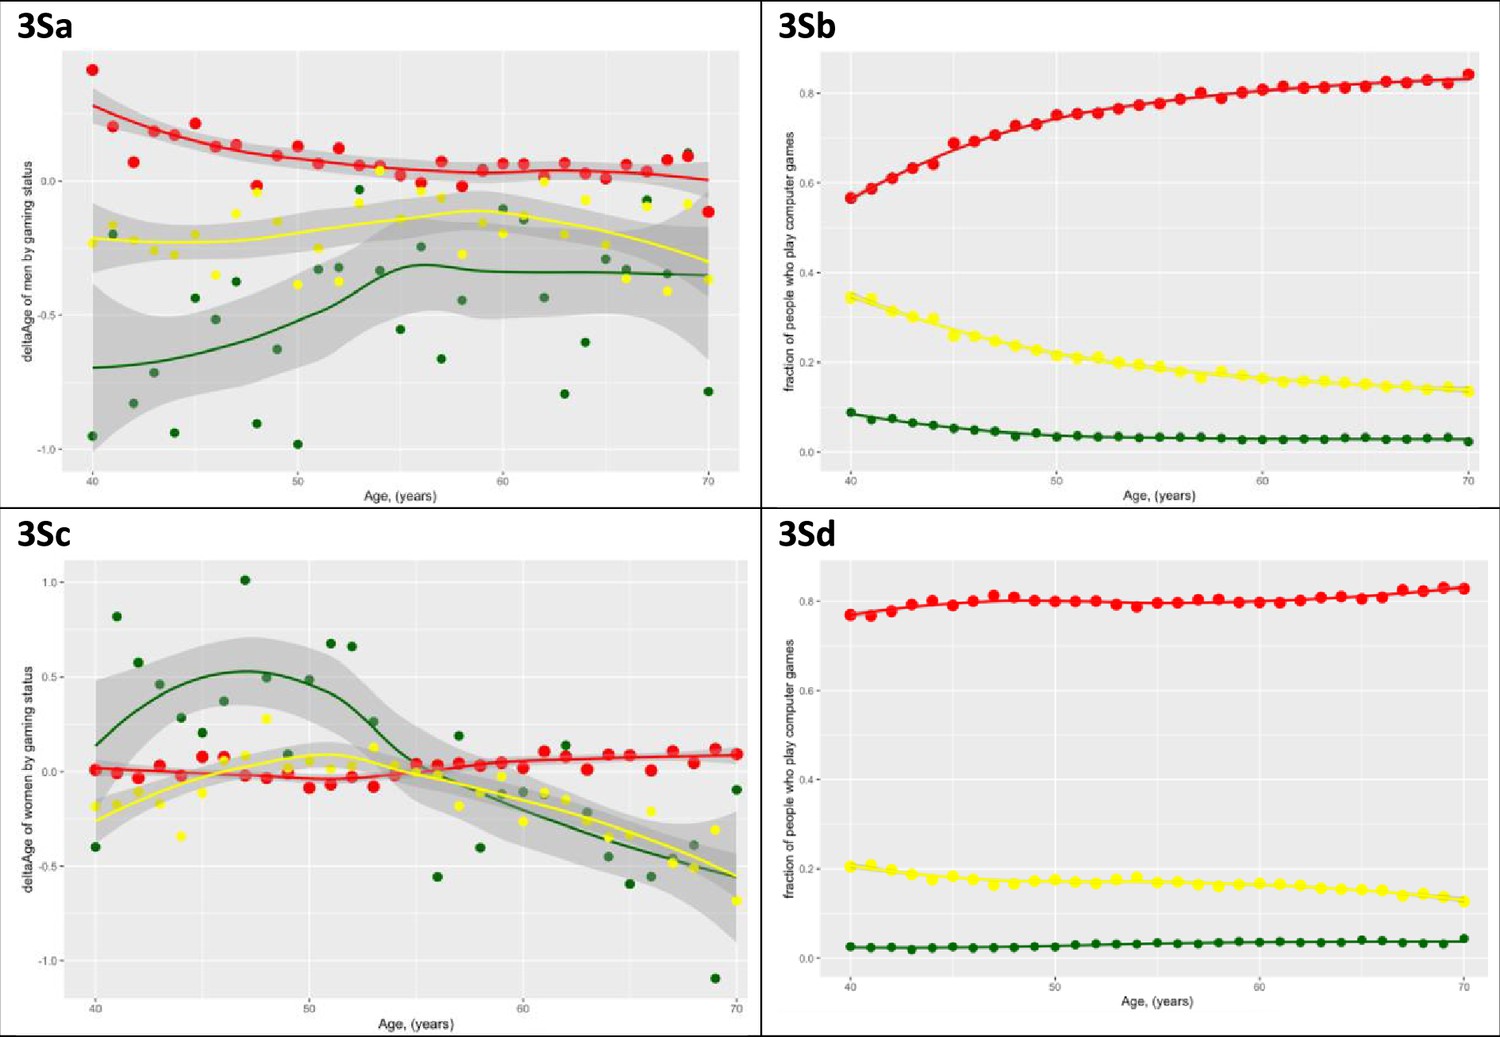
Men and older women who play computer games ‘often’ on average are more youthful.
This association is much stronger in men and holds true after age, education, and income are considered in the regression. (a) ∆Age (youthfulness) of males is plotted against age. Three subpopulations are presented - men who play computer games ‘often‘ (green dots), men who play computer games ’sometimes‘ (yellow dots), and men who ‘never‘ play computer games (red dots). Shaded lines denote 99% confidence intervals. (b) The fraction of men who play computer games ‘sometimes‘, ‘never‘, or ‘often’ is plotted against age. (c, d) The same graphs as (a) and (b), except for women. Note that observation is not identical between men and women and is reversed for younger (under the age of 55) women.
Figure 4
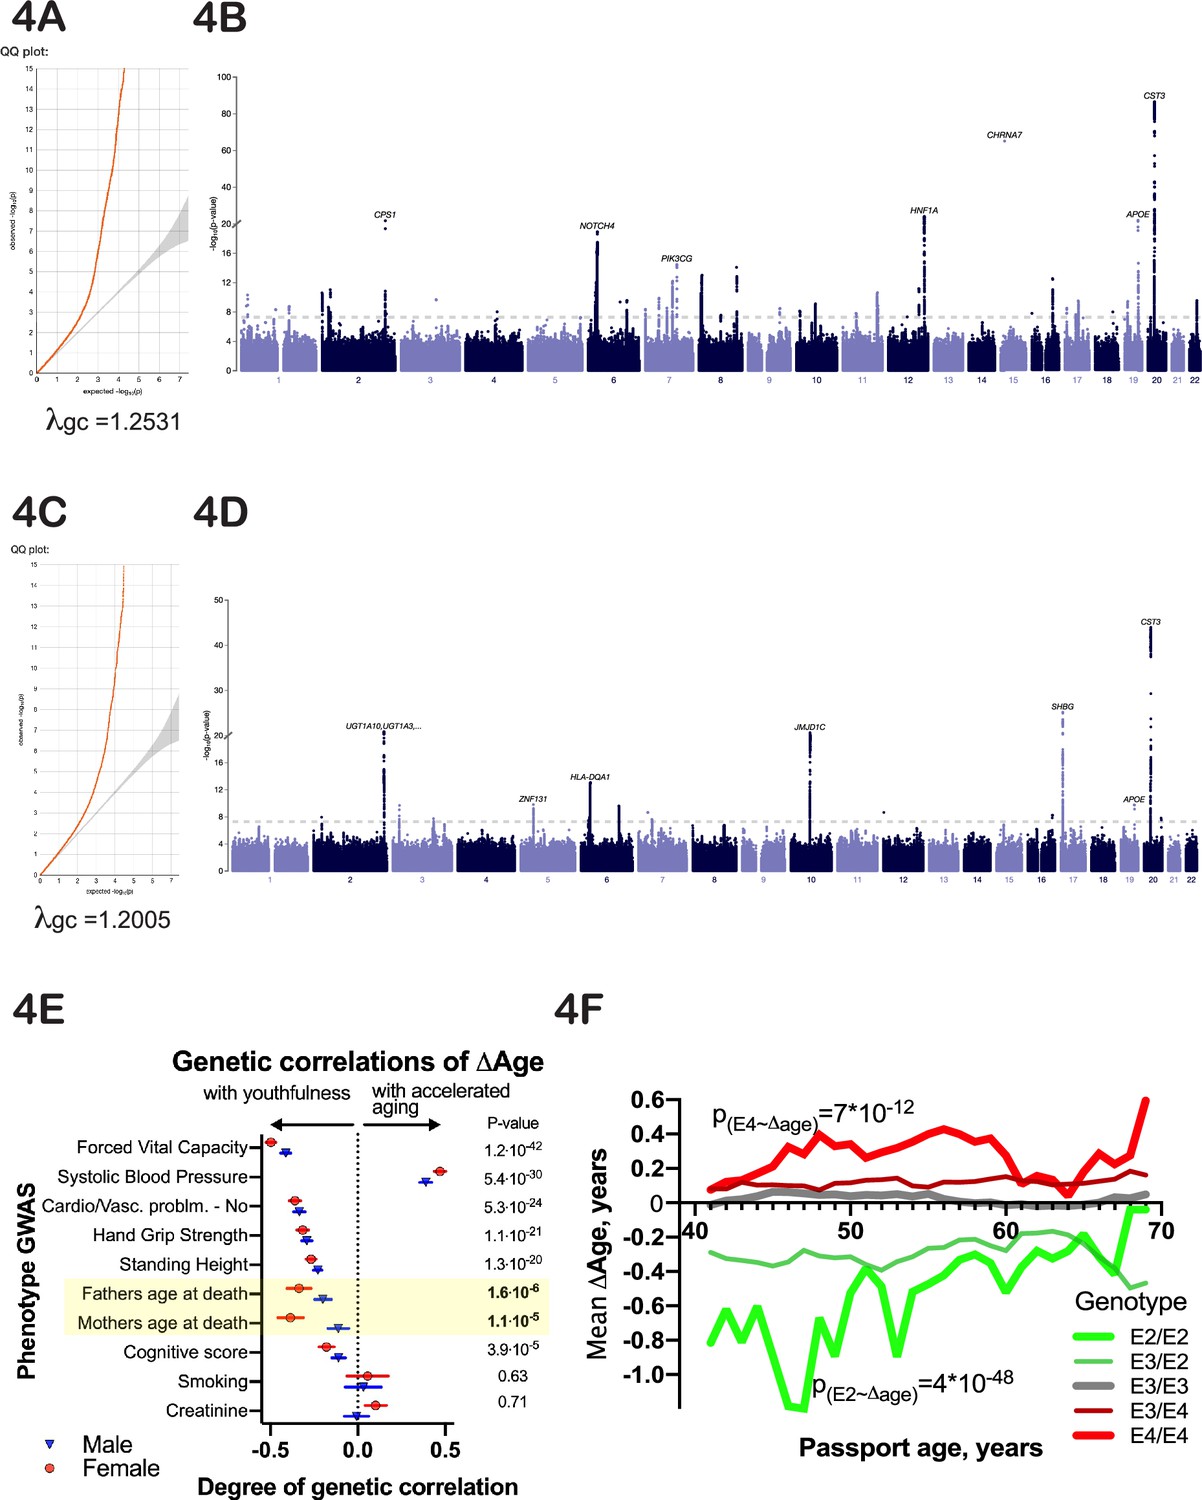
Genetic analysis of ∆Age.
(A, C) Quantile-quantile plots for female and male -log10 p-values. (B, D) Manhattan plots from genome-wide association analysis of female and male ∆Age. (E) Correlation of ∆Age genome-wide association study (GWAS) determination with other GWAS performed and reported by the United Kingdom BioBank (UKBB) consortium. Note the strong genetic relation between GWASs for ∆Age and parental age at death. (F) Effect of APOE alleles on average ∆Age plotted across different ages. Beneficial APOE2 alleles are in green, and detrimental APOE4 alleles are in red.
Figure 5
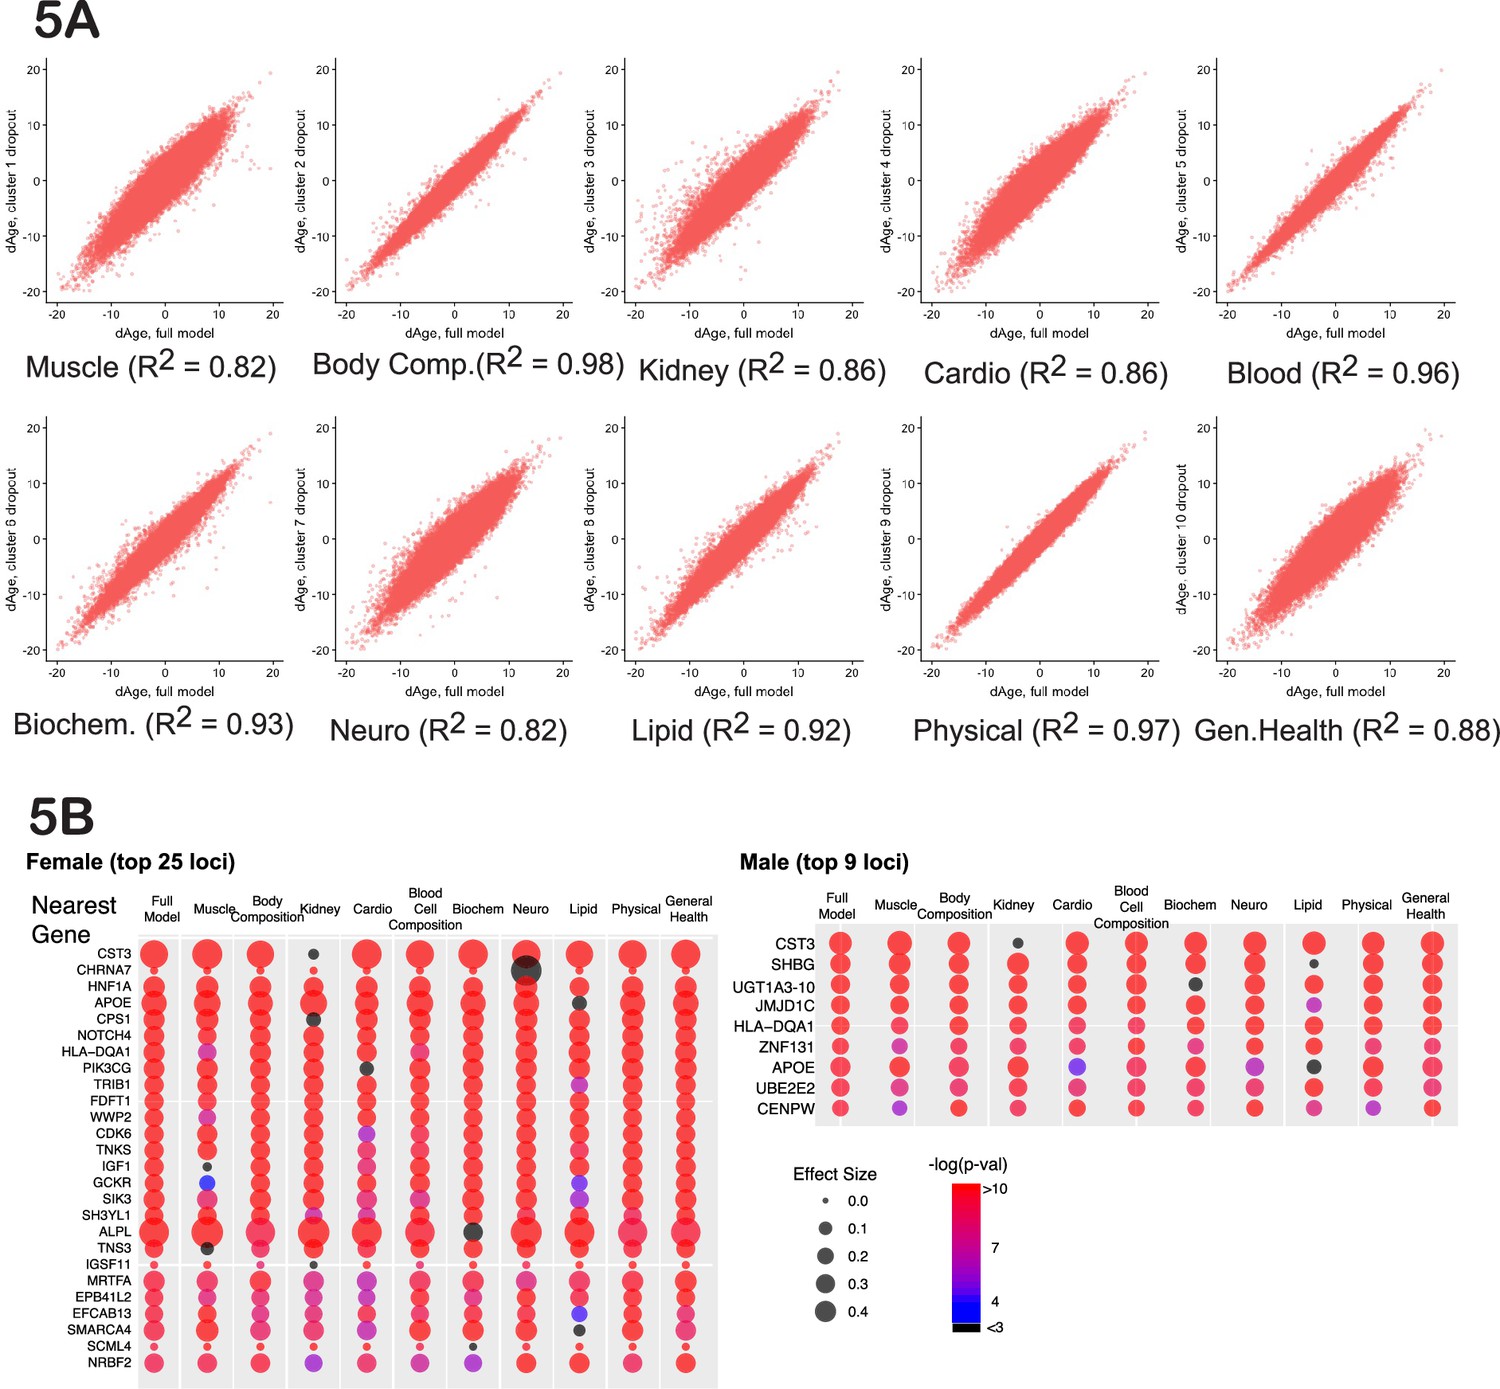
Cluster-dropout models.
(A) Correlation between ∆Age calculated using full set of identified parameters and each of 10 dropout models. Note that ∆Age values remain robust between models, meaning that if the person is predicted to have large ∆Age by the complete model, the ‘dropout’ models will predict large ∆Age as well. (B) The list of genes nearest to genome-wide association study (GWAS) loci that associate with female and male ∆Age in the full model. Each hit is presented as a bubble, colored according to the significance of association of the locus with ∆Age, with size representing the effect size of the top SNP in the locus. The full summary statistics is deposited to and available from https://www.ebi.ac.uk/gwas/, accession numbers: GCST90566392 (for females) and GCST90566393 (for males).
Tables
Table 1
Top gene ontology (GO) association of ∆Age genome-wide association study (GWAS) hits performed using an ontology resource previously described (Mi et al., 2019) using an online engine available at http://geneontology.org/ identifies synaptic category as the most overrepresented.
| GO biological process complete | Homo sapiens - genome | GWAS hits | Fold enrichment | Raw p-value | Corrected p-value |
|---|---|---|---|---|---|
| Modulation of excitatory postsynaptic potential (GO:0098815) | 43 | 5 | 17.74 | 1.49E-05 | 4.68E-02 |
| Regulation of cellular process (GO:0050794) | 11067 | 98 | 1.35 | 8.47E-06 | 6.67E-02 |
| Regulation of biological process (GO:0050789) | 11522 | 100 | 1.32 | 1.70E-05 | 4.47E-02 |
| Response to oxygen-containing compound (GO:1901700) | 1566 | 28 | 2.73 | 1.14E-06 | 1.79E-02 |
| Negative regulation of cellular metabolic process (GO:0031324) | 2545 | 35 | 2.1 | 1.82E-05 | 4.10E-02 |
| Cell communication (GO:0007154) | 5160 | 57 | 1.69 | 1.46E-05 | 7.68E-02 |
| Cellular response to stimulus (GO:0051716) | 6376 | 66 | 1.58 | 1.48E-05 | 5.84E-02 |
Additional files
-
Supplementary file 1
Table showing the significance of associations between all available United Kingdom BioBank (UKBB) phenotypes and human data points with participant age in female subjects.
- https://cdn.elifesciences.org/articles/92092/elife-92092-supp1-v1.xlsx
-
Supplementary file 2
Table showing the significance of associations between all available United Kingdom BioBank (UKBB) phenotypes and human data points with participant age in male subjects.
- https://cdn.elifesciences.org/articles/92092/elife-92092-supp2-v1.xlsx
-
Supplementary file 3
Table showing a description of all the phenotypes considered for ∆Age model computation.
This table includes the reasons for exclusion for each phenotype that was excluded as well as their assignment to correlation clusters for females.
- https://cdn.elifesciences.org/articles/92092/elife-92092-supp3-v1.xlsx
-
Supplementary file 4
Table showing a description of all the phenotypes considered for ∆Age model computation.
This table includes the reasons for exclusion for each phenotype that was excluded as well as their assignment to correlation clusters for males.
- https://cdn.elifesciences.org/articles/92092/elife-92092-supp4-v1.xlsx
-
Supplementary file 5
Table showing the significance of associations between computed ∆Age (the normalized difference between chronological and calculated biological age) and all available United Kingdom BioBank (UKBB) phenotypes for females.
- https://cdn.elifesciences.org/articles/92092/elife-92092-supp5-v1.xlsx
-
Supplementary file 6
Table showing the significance of associations between computed ∆Age (the normalized difference between chronological and calculated biological age) and all available United Kingdom BioBank (UKBB) phenotypes for males.
- https://cdn.elifesciences.org/articles/92092/elife-92092-supp6-v1.xlsx
-
Supplementary file 7
Table showing the list of strongest associations between environmental factors and computed ∆Age (the normalized difference between chronological and calculated biological age).
Additionally, all these associations are ranked by the size effect and the significance for all female participants.
- https://cdn.elifesciences.org/articles/92092/elife-92092-supp7-v1.xlsx
-
Supplementary file 8
Table showing the list of strongest associations between environmental factors and computed ∆Age (the normalized difference between chronological and calculated biological age).
Additionally, all these associations are ranked by the size effect and the significance for all male participants.
- https://cdn.elifesciences.org/articles/92092/elife-92092-supp8-v1.xlsx
-
Supplementary file 9
Table summarizing the calculated strength of the correlation between every United Kingdom BioBank (UKBB) phenotype and all the cluster-dropout models (main Figure 5A) in both males and females.
- https://cdn.elifesciences.org/articles/92092/elife-92092-supp9-v1.xlsx
-
MDAR checklist
- https://cdn.elifesciences.org/articles/92092/elife-92092-mdarchecklist1-v1.docx
Download links
A two-part list of links to download the article, or parts of the article, in various formats.
Downloads (link to download the article as PDF)
Open citations (links to open the citations from this article in various online reference manager services)
Cite this article (links to download the citations from this article in formats compatible with various reference manager tools)
A mathematical model that predicts human biological age from physiological traits identifies environmental and genetic factors that influence aging
eLife 13:RP92092.
https://doi.org/10.7554/eLife.92092.3


