Mycobacterium tuberculosis PhoP integrates stress response to intracellular survival by regulating cAMP level
- CSIR, Institute of Microbial Technology, India
- Academy of Scientific and Innovative Research, India
Figures
Figure 1 with 1 supplement
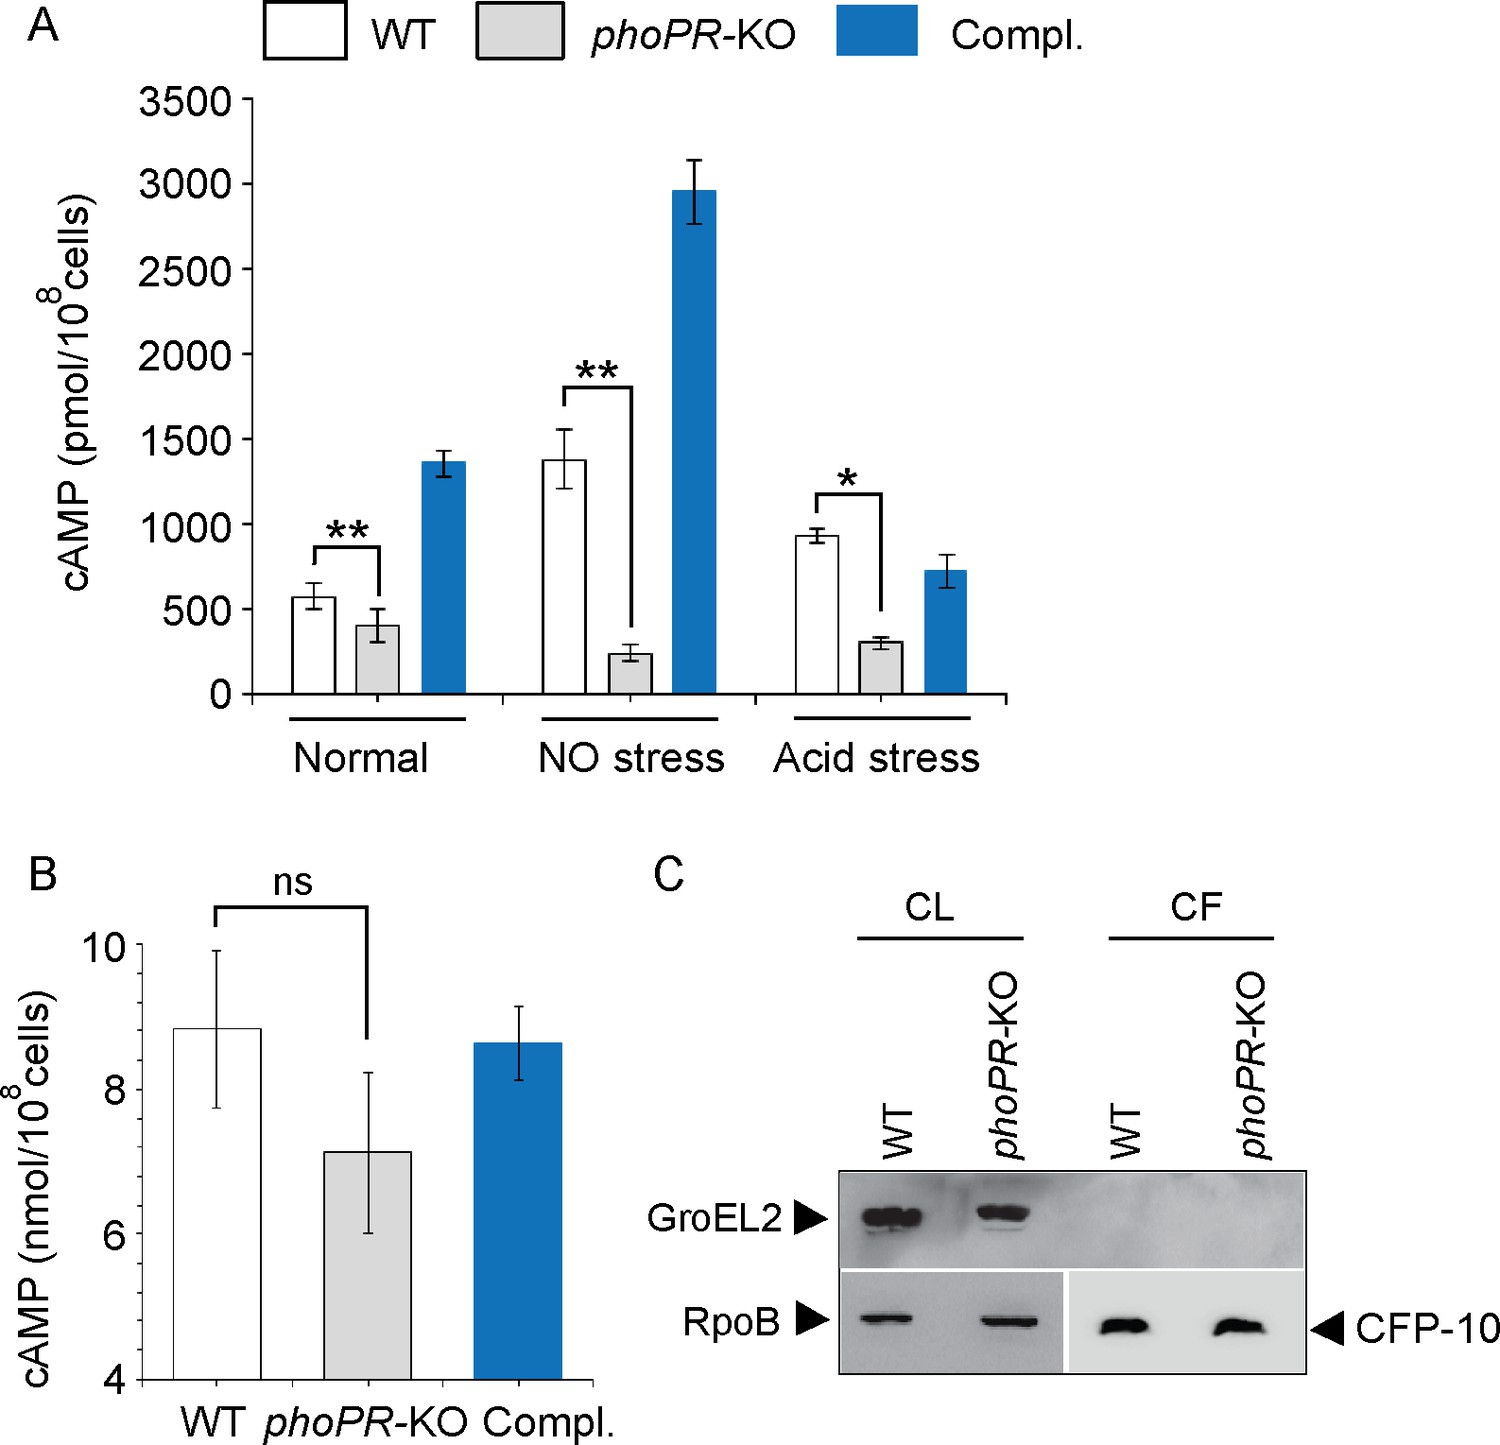
PhoP contributes to the maintenance of mycobacterial 3′,5-cyclic adenosine monophosphate (cAMP) level.
(A) Intra-mycobacterial cAMP levels were determined by a fluorescence-based assay as described in ‘Materials and methods’, and compared for indicated mycobacterial strains, grown under normal or specific stress conditions. For acid stress, mycobacterial strains were initially grown to the mid-log phase (OD600 0.4–0.6), and then transferred to acidic pH (7H9 media, pH 4.5) for further 2 hr of growth at 37°C. For NO stress, cells grown to the mid-log phase were exposed to 0.5 mM DetaNonoate for 40 min. The data represent average values from three biological repeats (*p≤0.05, **p≤0.01). (B) To compare the secretion of cAMP by WT and phoPR-KO, cAMP levels were also determined in the corresponding culture filtrates (CF) (ns., non- significant). (C) Immunoblotting analysis of 10 µg of cell lysates (CL) and 20 µg of CF of indicated M. tuberculosis strains. α-GroEL2 was used as a control to verify cytolysis of cells, CFP-10 detected as a secreted mycobacterial protein in the CFs, and RpoB used as the loading control.
-
Figure 1—source data 1
cAMP estimation in WT, phoPR-KO and the complemented mutant.
- https://cdn.elifesciences.org/articles/92136/elife-92136-fig1-data1-v2.xlsx
-
Figure 1—source data 2
Quantification of cAMP secretion of WT, phoPR-KO and the complemented mutant.
- https://cdn.elifesciences.org/articles/92136/elife-92136-fig1-data2-v2.xlsx
-
Figure 1—source data 3
GroEL2 levels in cell lysates of WT-H37Rv and phoPR-KO.
- https://cdn.elifesciences.org/articles/92136/elife-92136-fig1-data3-v2.pptx
-
Figure 1—source data 4
GroEL2 levels in cell lysates of WT-H37Rv and phoPR-KO.
- https://cdn.elifesciences.org/articles/92136/elife-92136-fig1-data4-v2.pptx
-
Figure 1—source data 5
Anti- RpoB blot as a loading control of comparable amount of cell lysates.
- https://cdn.elifesciences.org/articles/92136/elife-92136-fig1-data5-v2.pptx
-
Figure 1—source data 6
Anti-RpoB blot as a loading control of comparable amount of cell lysates.
- https://cdn.elifesciences.org/articles/92136/elife-92136-fig1-data6-v2.pptx
-
Figure 1—source data 7
CFP-10 in culture filtrates of H37Rv and phoPR-KO.
- https://cdn.elifesciences.org/articles/92136/elife-92136-fig1-data7-v2.pptx
-
Figure 1—source data 8
CFP-10 in the culture filtrates of H37Rv and phoPR-KO.
- https://cdn.elifesciences.org/articles/92136/elife-92136-fig1-data8-v2.pptx
Figure 1—figure supplement 1
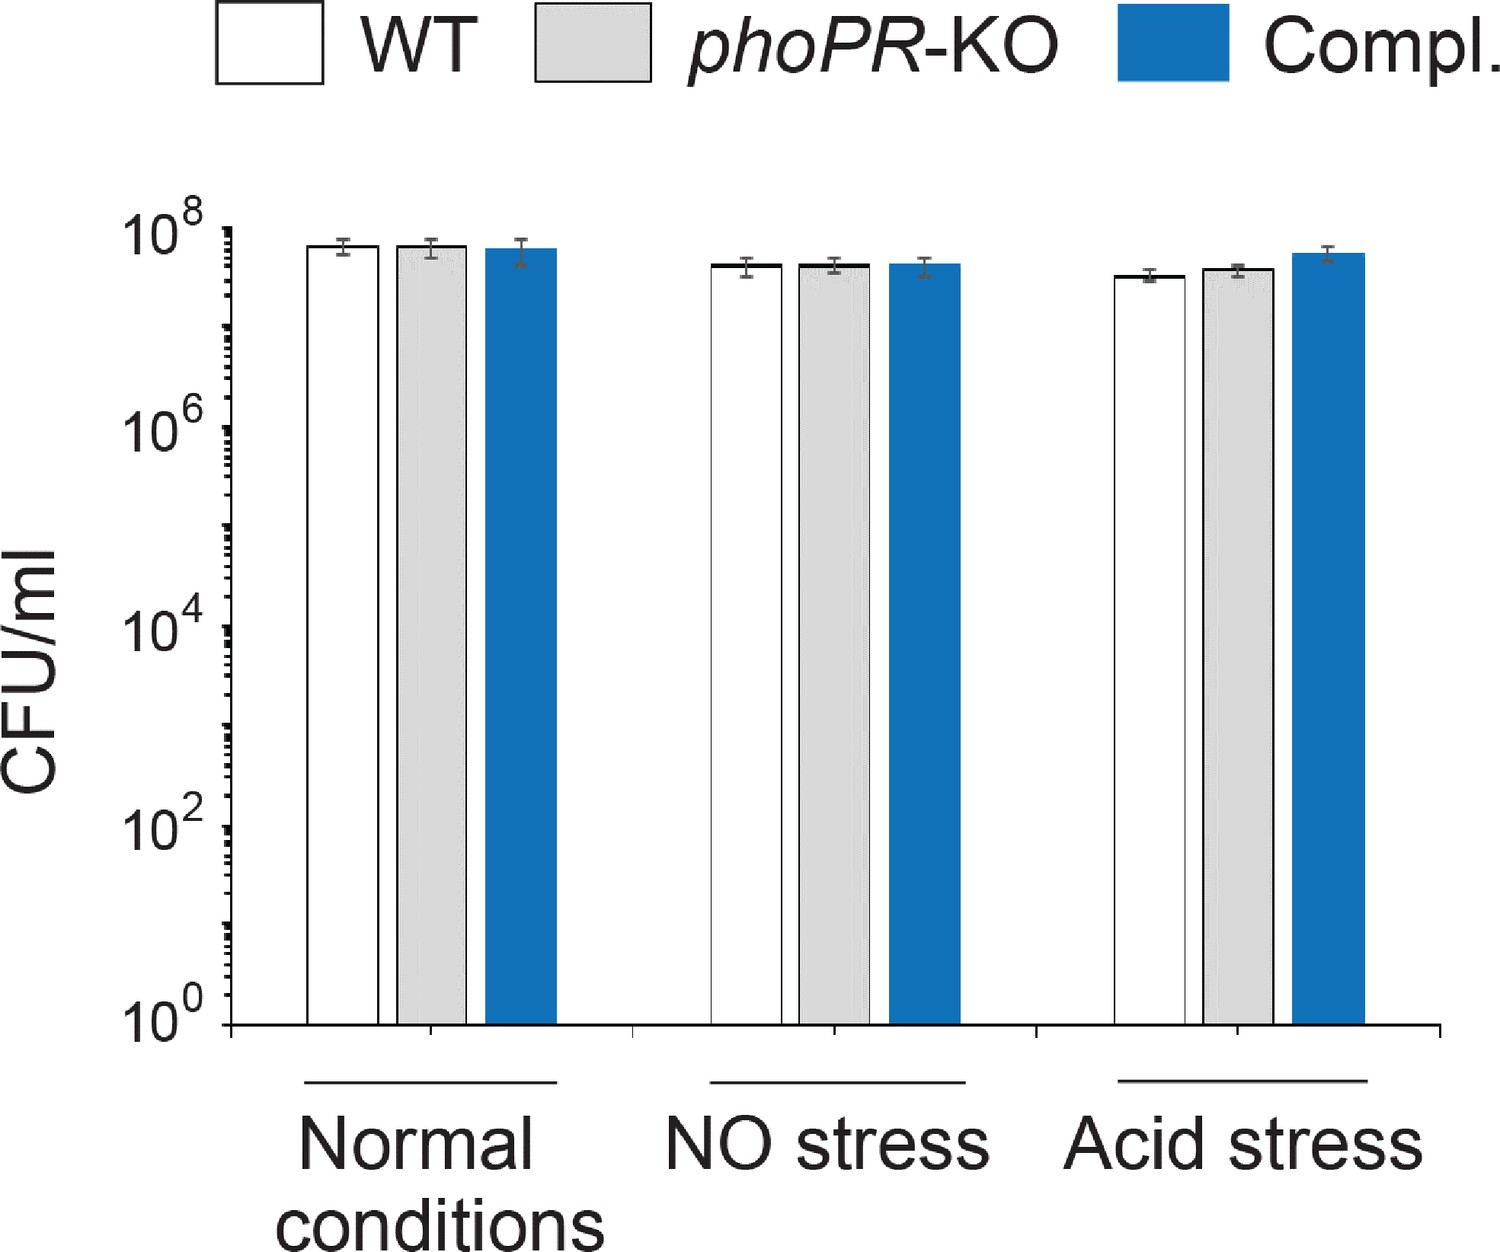
Defined and indicated stress conditions do not influence in vitro growth of mycobacterial strains.
To determine the impact of in vitro stress on bacterial growth under conditions when intra-mycobacterial 3′,5-cyclic adenosine monophosphate (cAMP) levels were measured, WT bacilli, phoPR-KO, and the complemented mutant (Compl.) were exposed to carefully controlled stress conditions as detailed in ‘Materials and methods’, and CFUs enumerated. The results clearly suggest that bacterial viability under indicated conditions of stress does not impact intra-mycobacterial cAMP level.
-
Figure 1—figure supplement 1—source data 1
CFU of indicated mycobacterial strains under normal and stress conditions.
- https://cdn.elifesciences.org/articles/92136/elife-92136-fig1-figsupp1-data1-v2.xlsx
Figure 2 with 1 supplement
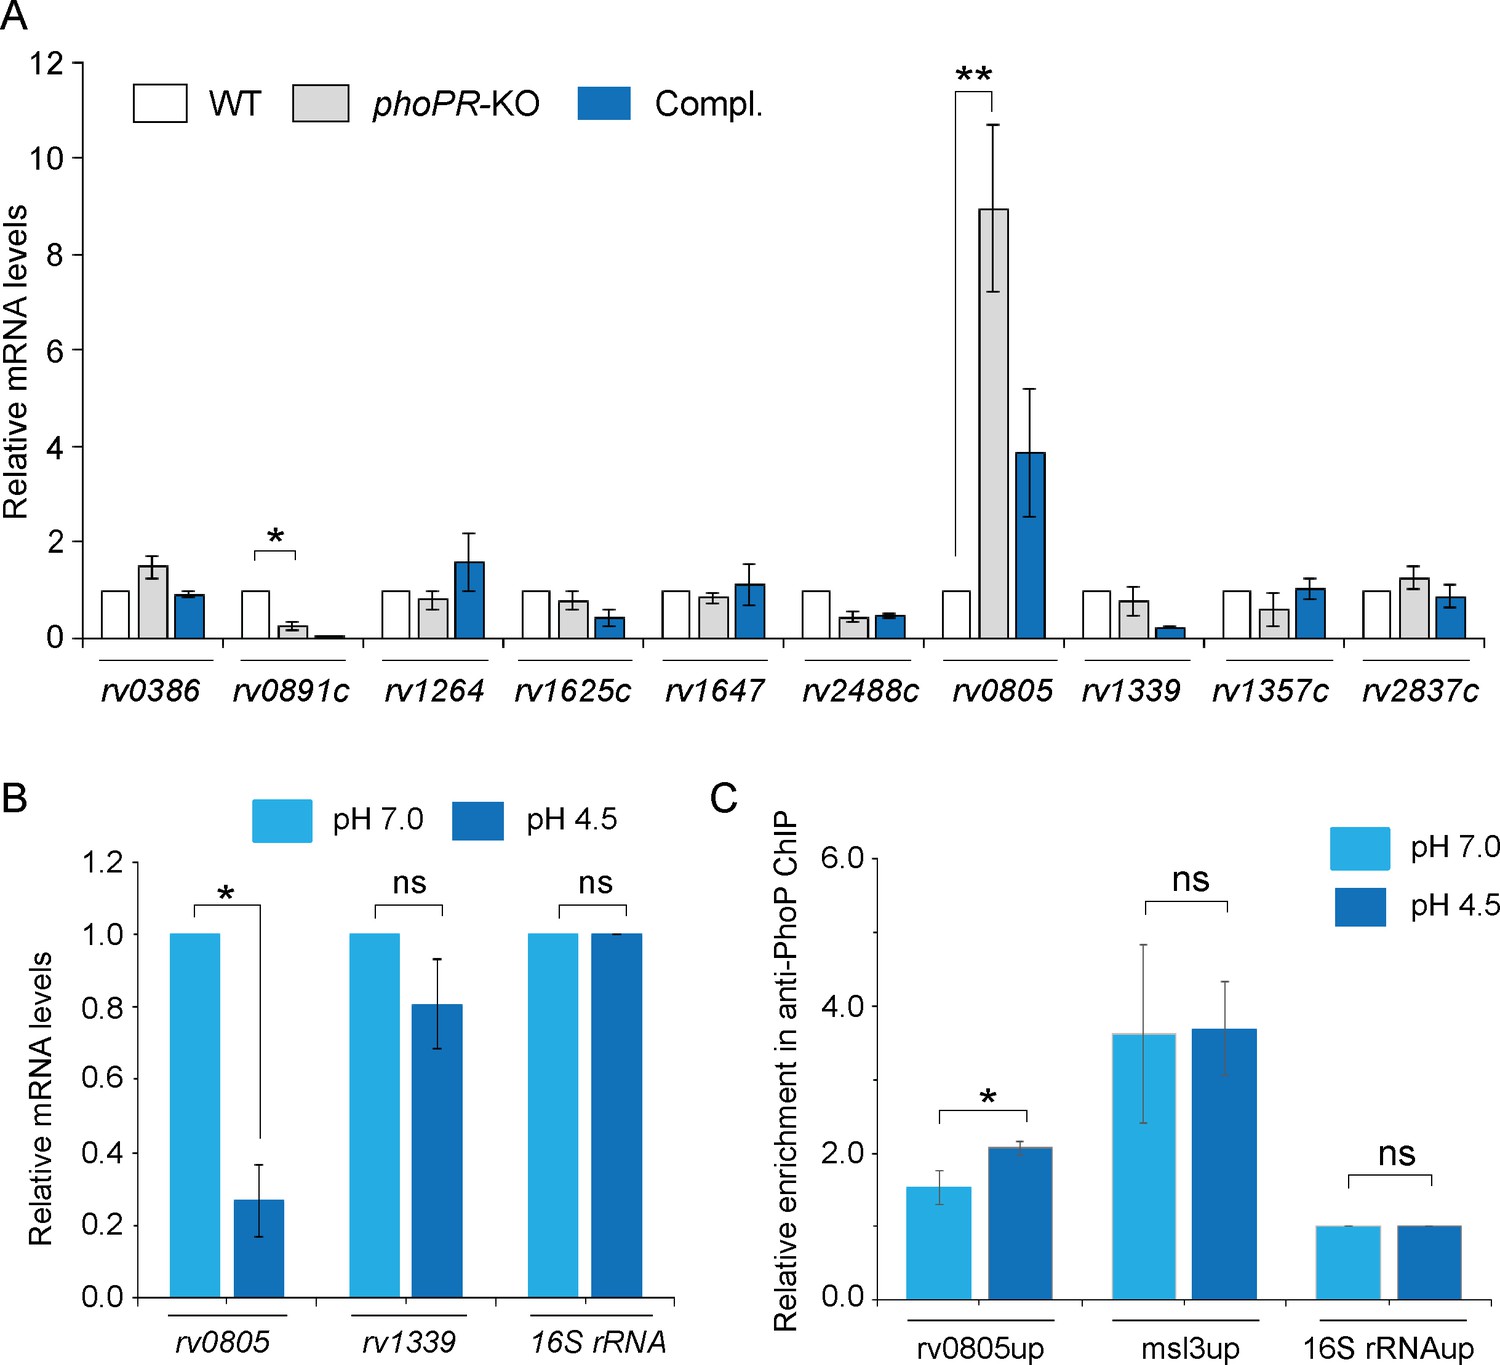
PhoP regulates the expression of phosphodiesterase (PDE) rv0805.
(A) To investigate the regulation of 3′,5-cyclic adenosine monophosphate (cAMP) level, mRNA levels of well-characterized adenylate cyclases, and phosphodiesterases (PDEs) were compared in indicated mycobacterial strains by RT-qPCR as described in ‘Materials and methods’. The results show average values from biological triplicates, each with two technical repeats (*p<0.05; **p<0.01). Note that the difference in expression levels of rv0805 between WT and phoPR-KO was significant (p<0.01), whereas the fold difference in mRNA level between WT and the complemented mutant (Compl.) remains nonsignificant (not indicated). (B) To determine the effect of acidic pH conditions of growth, mycobacterial rv0805 expression was compared in WT grown under normal (pH 7.0) and acidic pH (pH 4.5). Average fold difference in mRNA levels from biological duplicates (each with a technical repeat) was measured as described in ‘Materials and methods’ (**p≤0.05). As controls, expression of rv1339 and 16S rDNA was also measured. Nonsignificant difference is not indicated. (C) In vivo PhoP binding to rv0805 promoter (rv0805up) was compared in WT grown under normal and acidic conditions of growth using anti-PhoP antibody followed by ChIP-qPCR. Fold enrichment data represent mean values of two independent experiments with a statistically significant fold difference (**p-value<0.01; *p-value<0.05). The upstream regulatory regions of 16S rRNA (16S rRNAup) and msl3 (msl3up) were used as negative and positive controls, respectively. The assay conditions, sample analyses, and detection are described in ‘Materials and methods’.
-
Figure 2—source data 1
Relative mRNA levels of genes in WT, phoPR mutant and the complemented mutant.
- https://cdn.elifesciences.org/articles/92136/elife-92136-fig2-data1-v2.xls
-
Figure 2—source data 2
Relative mRNA levels of indicated genes under normal and acidic conditions.
- https://cdn.elifesciences.org/articles/92136/elife-92136-fig2-data2-v2.xlsx
-
Figure 2—source data 3
Relative enrichment of anti-PhoP ChIP within target promoters.
- https://cdn.elifesciences.org/articles/92136/elife-92136-fig2-data3-v2.xlsx
Figure 2—figure supplement 1
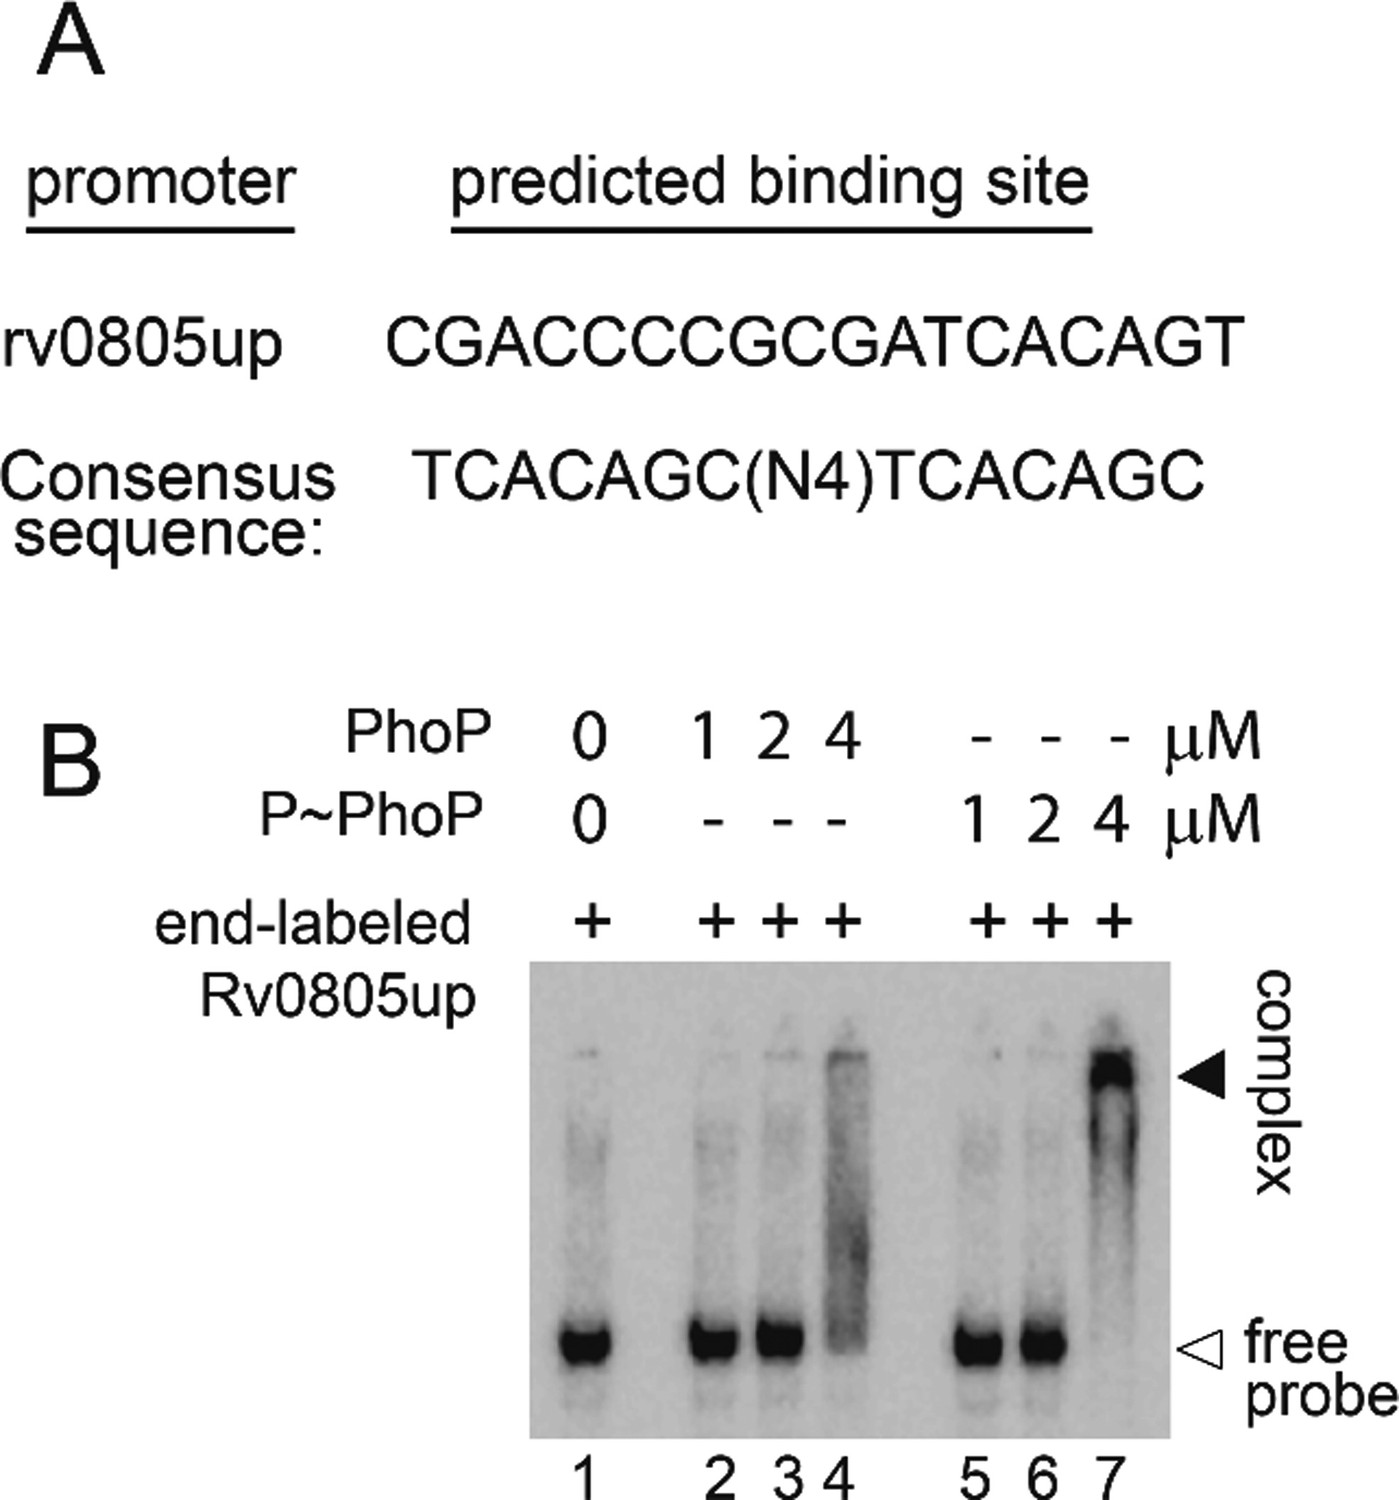
Probing in vitro DNA binding of PhoP to the rv0805 regulatory region.
(A) Core binding site of PhoP within the promoter region spanning –150 to +1 bp upstream regulatory region of rv0805 (rv0805up; relative to the ORF start site) was identified using the MEME Suit bioinformatic software using previously identified consensus PhoP binding sequence (He and Wang, 2014). Note that the predicted binding site spans from –110 to –127 relative to the ORF start site (p=0.000726). (B) To verify DNA binding in vitro, rv0805up was amplified, end-labeled, and EMSA was carried out using radio-labeled rv0805up for binding of increasing concentrations of PhoP (lanes 2–4) and PhoP, pre-incubated in phosphorylation mix with acetyl-phosphate (AcP) (lanes 5–7), respectively. Lane 1 shows the free probe. The binding mixtures in lanes 2–4 and lanes 5–7 contained indicated proteins at 1, 2, and 4 μM, respectively. The position of the radioactive material was determined by exposure to a phosphor storage screen. Open and filled arrows indicate free probe and slower-moving complexes with band shifts produced in the presence of P~PhoP, respectively.
-
Figure 2—figure supplement 1—source data 1
EMSA to examine PhoP binding to pde promoter region.
- https://cdn.elifesciences.org/articles/92136/elife-92136-fig2-figsupp1-data1-v2.pptx
-
Figure 2—figure supplement 1—source data 2
EMSA to examine PhoP binding to pde promoter region.
- https://cdn.elifesciences.org/articles/92136/elife-92136-fig2-figsupp1-data2-v2.pptx
Figure 3 with 1 supplement
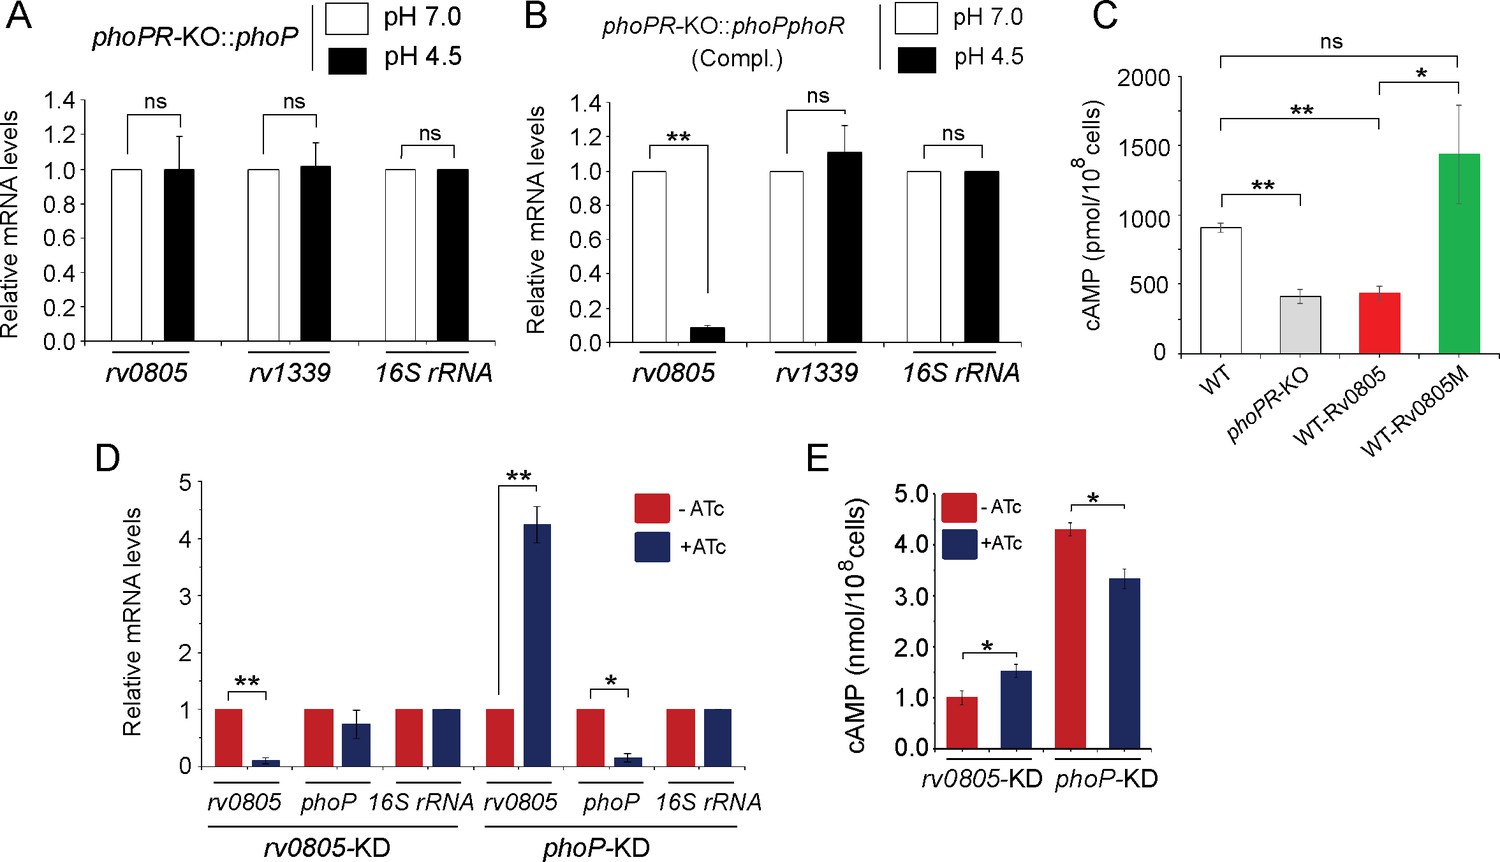
PhoP-dependent repression of rv0805 to maintain mycobacterial 3′,5-cyclic adenosine monophosphate (cAMP) level requires the presence of PhoR.
(A, B) To determine the impact of PhoR (the cognate sensor kinase of PhoP), expression of rv0805 was compared in indicated M. tuberculosis H37Rv strains: (A) phoPR-KO::phoP (phoPR mutant complemented with phoP) and (B) phoPR-KO::phoPR (phoPR mutant complemented with phoP-phoR) under normal and acidic conditions of growth. As expected, phoPR-KO::phoPR (Compl.) shows a significant repression of rv0805 (but not rv1339) under acidic pH (***p<0.001). However, rv0805 expression remains comparable in phoPR-KO::phoP under normal as well as acidic conditions of growth. As a control, rv1339 fails to show a variable expression in indicated mycobacterial strains. (C) To determine the effect of ectopic expression of rv0805 on intra-mycobacterial cAMP level, WT and mutant Rv0805 proteins (Rv0805M, defective for phosphodiesterase activity) were expressed in M. tuberculosis H37Rv (to construct WT-Rv0805, and WT-Rv0805M, respectively) as described in ‘Materials and methods’. Similar to phoPR-KO, WT-Rv0805 (but not WT-Rv0805M) showed a considerably lower level of cAMP relative to WT bacteria. Significance in variation of cAMP levels was determined by paired Student’s t-test (*p<0.05; **p<0.01). (D, E) Relative expression of phoP and PDE in phoP-KD and rv0805-KD (phoP and rv0805 knockdown constructs, respectively). In keeping with elevated expression of rv0805 in phoPR-KO, phoP-KD shows an elevated expression of rv0805 relative to WT bacilli. In contrast, phoP expression level remains unaffected in rv0805-KD mutant. Panel (E) measured corresponding intra-bacterial cAMP levels in the respective knockdown mutants, as described in the legend to Figure 1A.
-
Figure 3—source data 1
Relative mRNA levels of genes in indicated strains under normal and acidic pH.
- https://cdn.elifesciences.org/articles/92136/elife-92136-fig3-data1-v2.xlsx
-
Figure 3—source data 2
Relative mRNA levels of genes in indicated strains under normal and acidic pH.
- https://cdn.elifesciences.org/articles/92136/elife-92136-fig3-data2-v2.xlsx
-
Figure 3—source data 3
Intrabacterial cAMP levels in indicated mycobacterial strains.
- https://cdn.elifesciences.org/articles/92136/elife-92136-fig3-data3-v2.xlsx
-
Figure 3—source data 4
Relative mRNA levels of genes in indicated knock-down mutants of M. tuberculosis.
- https://cdn.elifesciences.org/articles/92136/elife-92136-fig3-data4-v2.xls
-
Figure 3—source data 5
cAMP levels of indicated knock-down mutants.
- https://cdn.elifesciences.org/articles/92136/elife-92136-fig3-data5-v2.xls
Figure 3—figure supplement 1
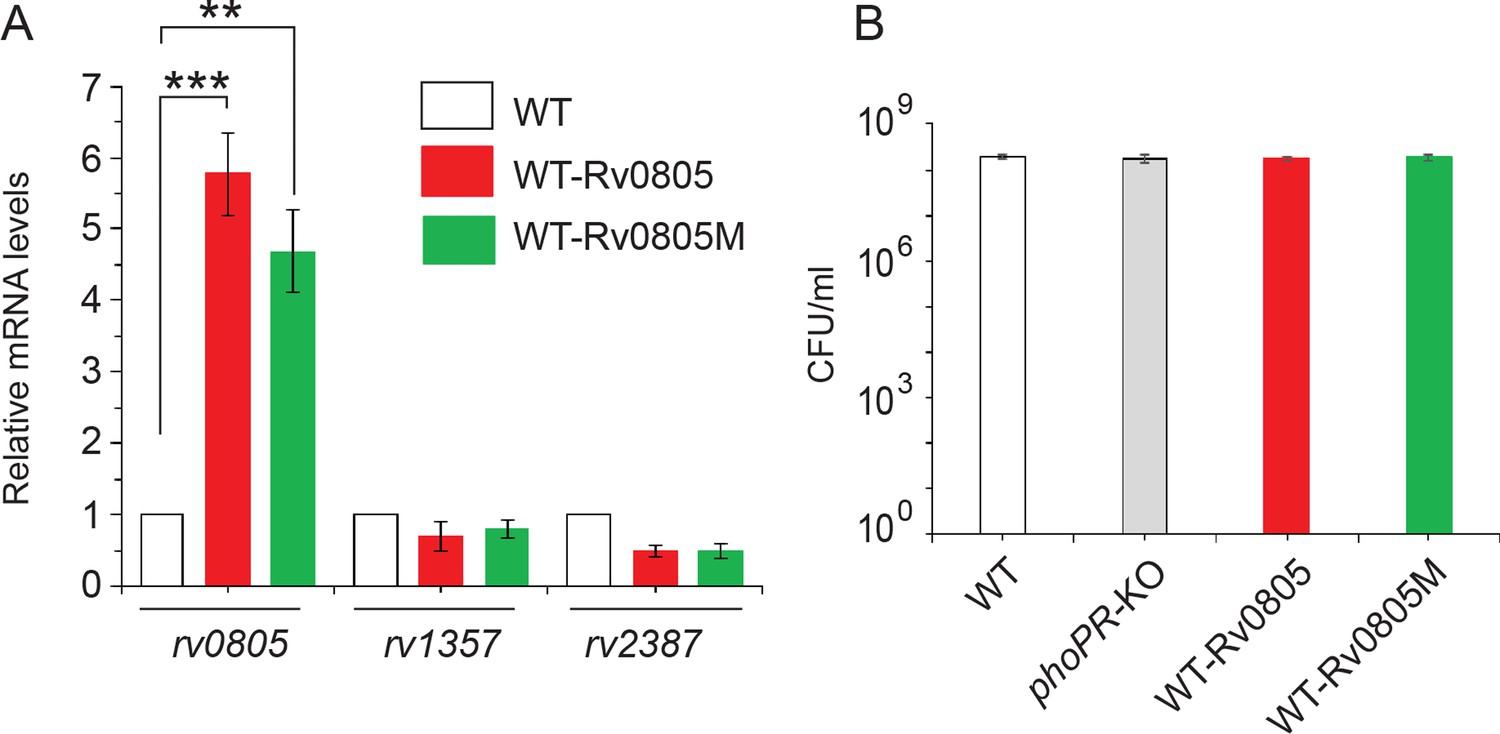
Ectopic expression of wild-type (WT) and mutant rv0805 (Rv0805M) in WT bacilli.
(A) Real-time RT-qPCR was carried out to compare the expression of indicated phosphodiesterases (PDEs) in WT (empty bar), WT-Rv0805 (red bar), and WT- Rv0805M (green bar), respectively, as described in ‘Materials and methods’. Average fold difference in mRNA levels from two biological repeats (each with a technical repeat) was determined as described in ‘Materials and methods’ (**p≤0.05; ***p≤0.01). Nonsignificant difference is not indicated. (B) To compare the growth of WT and the variant mycobacterial strains, CFU values were determined under normal conditions of growth as described in ‘Materials and methods’.
-
Figure 3—figure supplement 1—source data 1
Relative mRNA levels of genes in indicated mycobacterial strains.
- https://cdn.elifesciences.org/articles/92136/elife-92136-fig3-figsupp1-data1-v2.xlsx
-
Figure 3—figure supplement 1—source data 2
CFU enumeration of indicated mycobacterial strains.
- https://cdn.elifesciences.org/articles/92136/elife-92136-fig3-figsupp1-data2-v2.xlsx
Figure 4 with 1 supplement
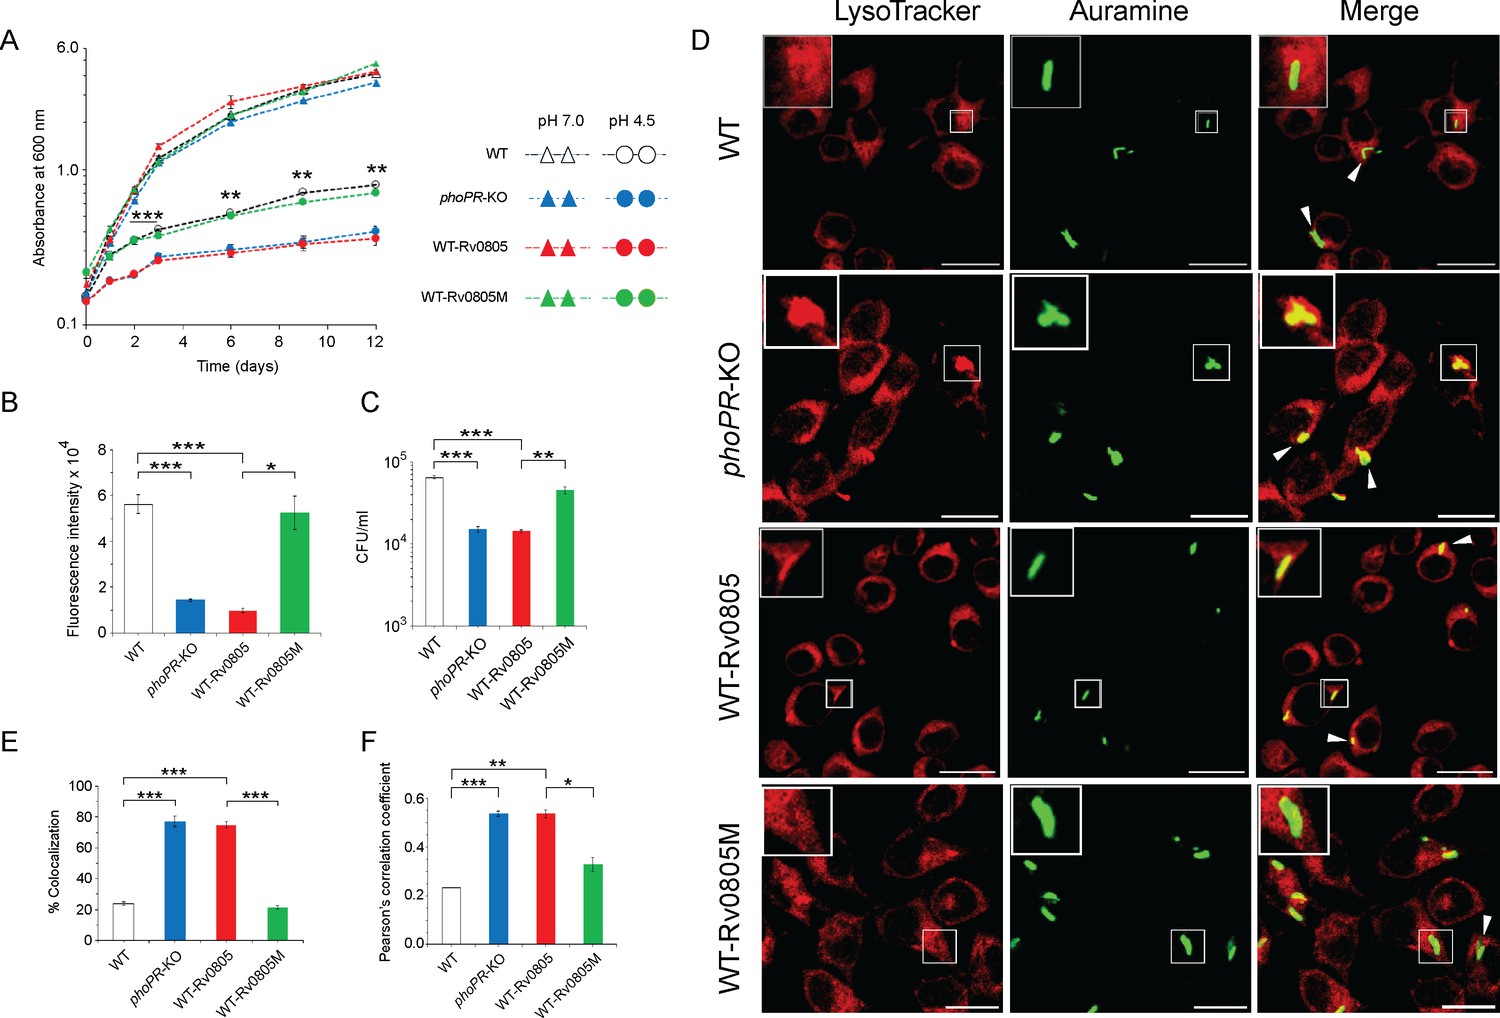
Regulation of 3′,5-cyclic adenosine monophosphate (cAMP) level and its effect on mycobacterial stress tolerance and survival in macrophages.
(A) To compare susceptibility to low pH conditions, the indicated mycobacterial strains were grown at pH 4.5, and similar to phoPR-KO (gray circles), WT-Rv0805 (red circles) shows a significant growth defect relative to WT (empty circles). However, WT-Rv0805M (green circles) grows comparably well as that of the WT (empty circles). In contrast, at pH 7.0 all four mycobacterial strains (WT, empty triangles; phoPR-KO, gray triangles; WT-Rv0805, red triangles; WT-Rv0805M, green triangles) displayed comparable growth. (B) Microplate-based assay using Alamar Blue was utilized to examine mycobacterial sensitivity to increasing concentrations of diamide. In this assay, reduction of Alamar Blue correlates with the change of a non-fluorescent blue to a fluorescent pink appearance, which is directly proportional to bacterial growth. Survival of indicated mycobacterial strains, under normal conditions and in the presence of 5 mM diamide, was determined by plotting fluorescence intensity (*p<0.05; **p<0.01; ***p<0.001). The data is normalized relative to WT grown in the presence of 5 mM diamide. (C) To compare susceptibility to stress conditions, these mycobacterial strains were next grown in the presence of 50 µM cumene hydrogen peroxide (CHP). In the presence of CHP, WT-Rv0805 (red column), but not WT-Rv0805M (green column), shows a significant growth defect (relative to WT [empty column]) in striking similarity to phoPR-KO (gray column). Note that similar to phoPR-KO, WT-Rv0805 shows a comparably higher sensitivity to CHP relative to WT bacilli. However, WT-Rv0805M expressing a mutant Rv0805 shows a significantly lower sensitivity to CHP relative to WT-Rv0805, as measured by the corresponding CFU values. The growth experiments were performed in biological duplicates, each with two technical replicates (**p≤0.01; ***p≤0.001). (D) Murine macrophages were infected with indicated M. tuberculosis H37Rv strains. The cellular organelle was made visible by LysoTracker; mycobacterial strains were stained with phenolic auramine solution, and the confocal images display merge of two fluorescence signals (LysoTracker: red; H37Rv: green; scale bar: 10 µm). The insets in the merge panels indicate bacteria, which either have inhibited or facilitated trafficking into lysosomes. White arrowheads in the merge panels indicate non-co-localization, which remains higher in WT-H37Rv and WT-Rv0805M relative to phoPR-KO or WT-Rv0805. (E) Bacterial co-localization of M. tuberculosis H37Rv strains. The percentage of auramine-labeled strains co-localized with LysoTracker was determined by counting at least 100 infected cells in 10 different fields. The results show the average values with standard deviation determined from three independent experiments (***p≤0.001). (F) Pearson’s correlation coefficient of images of internalized auramine-labeled mycobacteria and LysoTracker red marker in RAW 264.7 macrophages. Data are representative of mean ± SD, derived from three independent experiments (*p<0.05; ***p<0.001).
-
Figure 4—source data 1
Growth curves of indicated strains under normal and acidic pH.
- https://cdn.elifesciences.org/articles/92136/elife-92136-fig4-data1-v2.xlsx
-
Figure 4—source data 2
Relative flouresence intensity of indicated mycobacterial strains (Alamar Blue assays).
- https://cdn.elifesciences.org/articles/92136/elife-92136-fig4-data2-v2.xlsx
-
Figure 4—source data 3
CFU of indicated strains under oxidative stress.
- https://cdn.elifesciences.org/articles/92136/elife-92136-fig4-data3-v2.xlsx
-
Figure 4—source data 4
Confocal images showing colocalization or lack thereof of indicated mycobacterial strains in macrophage infection studies.
- https://cdn.elifesciences.org/articles/92136/elife-92136-fig4-data4-v2.pptx
-
Figure 4—source data 5
% Colocalization of indicated mycobacterial strains in infection studies.
- https://cdn.elifesciences.org/articles/92136/elife-92136-fig4-data5-v2.xlsx
-
Figure 4—source data 6
Pearson's correlation coefficient of indicated strains in infection studies.
- https://cdn.elifesciences.org/articles/92136/elife-92136-fig4-data6-v2.xlsx
Figure 4—figure supplement 1
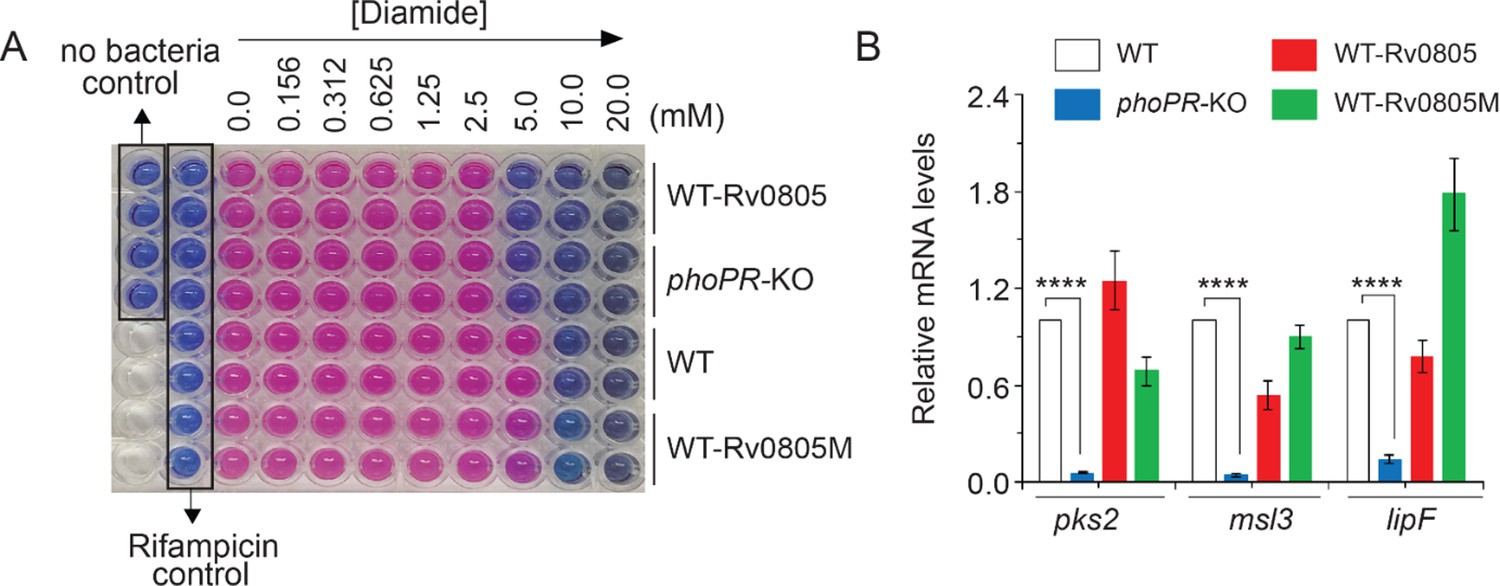
PhoP-dependent rv0805 expression contributes to mycobacterial survival under oxidative stress.
(A) In this experiment, we compared metabolic activity of WT, phoPR-KO, WT-Rv0805, and WT-Rv0805M, grown in the presence of increasing concentrations of diamide by using Alamar Blue assay. Because reduction of Alamar Blue correlates with the change of a non-fluorescent blue to a fluorescent pink appearance, mycobacterial metabolic activity could be assessed by monitoring fluorescence. Two following controls were included in the Alamar Blue assays: rifampicin control, reflecting mycobacterial growth inhibition to confirm validity of the assay, and no bacteria control indicated at the top-left corner of the plate. (B) Next, effect of overexpression of rv0805 on mycobacterial cell wall structure was assessed by analyzing the expression of lipid biosynthetic genes of indicated mycobacterial strains by RT-qPCR. Average fold difference in mRNA levels from two biological repeats (each with a technical repeat) was determined as described in ‘Materials and methods’ (***p≤0.001). Nonsignificant difference is not indicated.
-
Figure 4—figure supplement 1—source data 1
Alamar Blue assay of indicated strains (unlabeled data).
- https://cdn.elifesciences.org/articles/92136/elife-92136-fig4-figsupp1-data1-v2.pptx
-
Figure 4—figure supplement 1—source data 2
Alamar Blue assay of indicated strains in the presence of diamide.
- https://cdn.elifesciences.org/articles/92136/elife-92136-fig4-figsupp1-data2-v2.pptx
-
Figure 4—figure supplement 1—source data 3
Relative mRNA levels of specific genes in indicated mycobacterial strains.
- https://cdn.elifesciences.org/articles/92136/elife-92136-fig4-figsupp1-data3-v2.xls
Figure 5
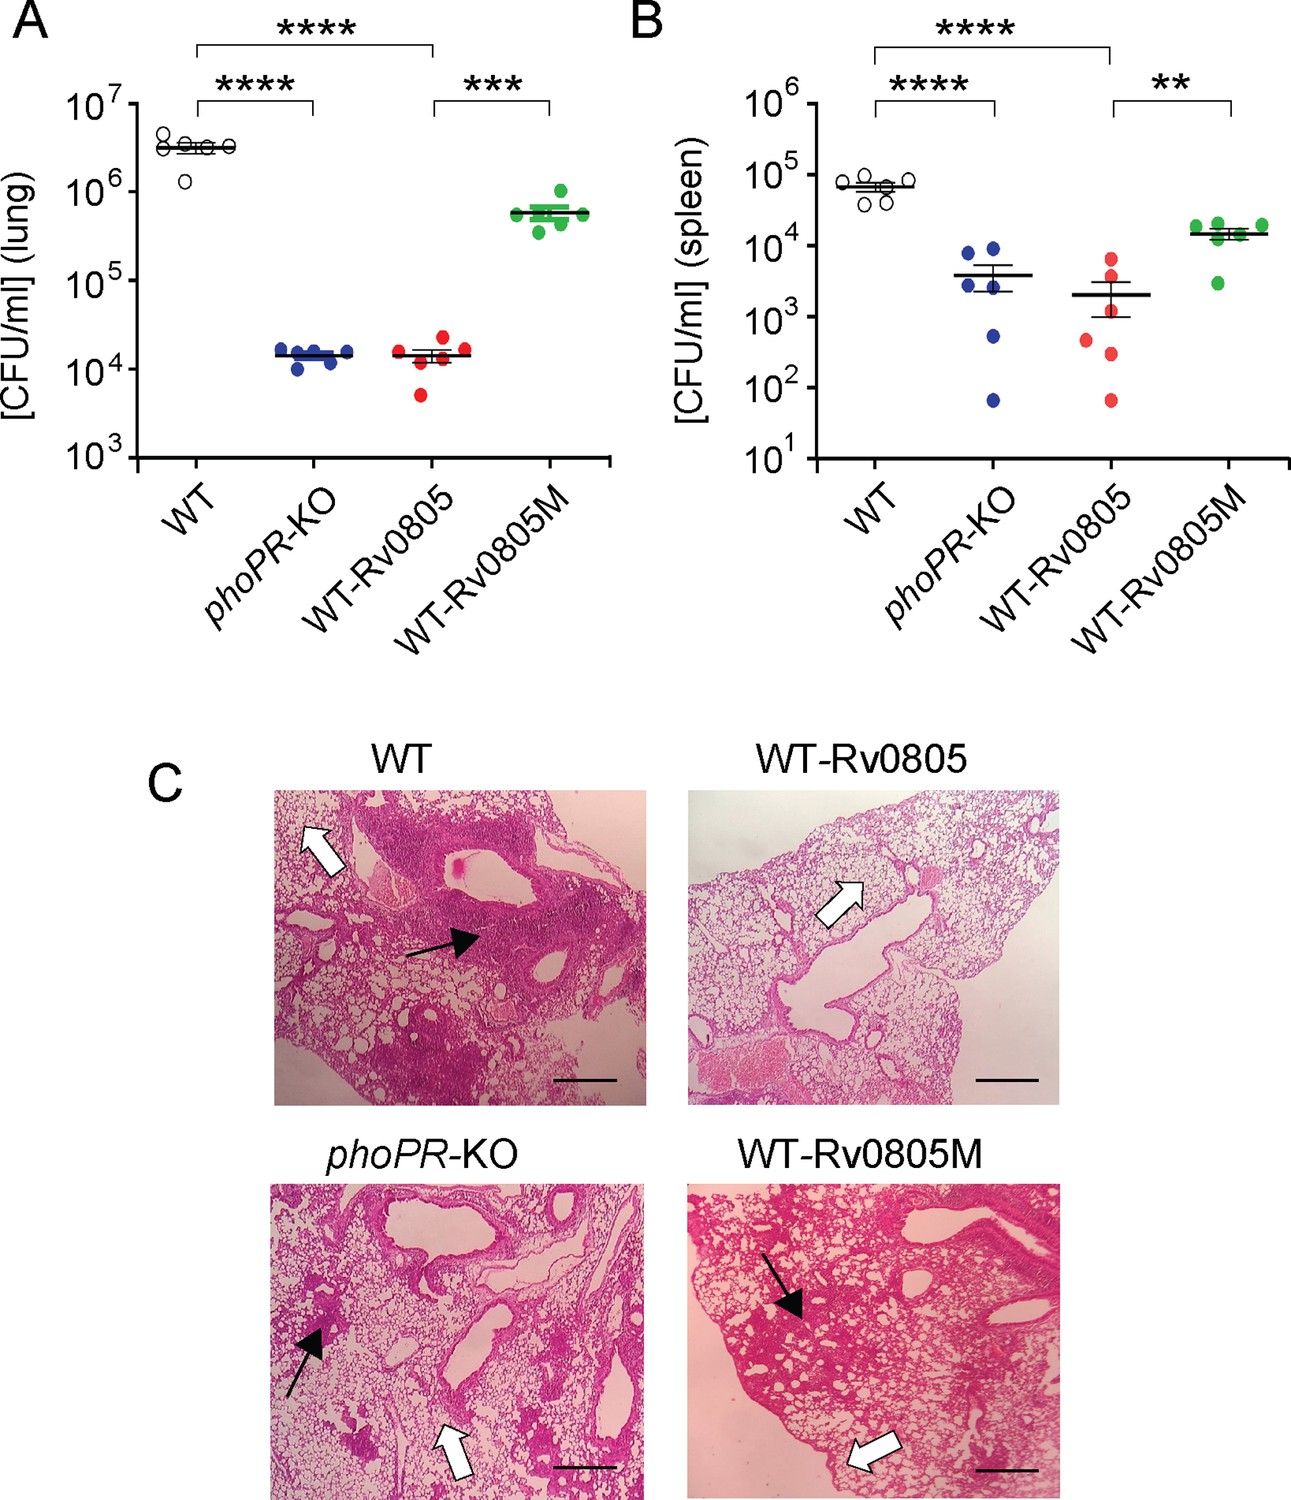
Dysregulation of mycobacterial 3′,5-cyclic adenosine monophosphate (cAMP) level impacts mycobacterial survival in vivo.
(A, B) Survival of mycobacterial strains in mice (A) lung and (B) spleen after animals were given an aerosol infection with ~100 CFU/lung. Mycobacterial load represents mean CFU values with standard deviations obtained from at least five animals per strains used (**p<0.01; ***p<0.001; ****p<0.0001). (C) Histopathology of lung sections after 4 wk of infection with indicated bacterial strains. Sections were stained with hematoxylin and eosin, observed under a light microscope, and images of the pathology sections collected at ×40 magnification display granulomas (filled arrows) and alveolar space (empty arrows) (scale bar, 200 µm).
-
Figure 5—source data 1
CFU of indicated mycobacterial strains in mice lung (lung burden).
- https://cdn.elifesciences.org/articles/92136/elife-92136-fig5-data1-v2.xlsx
-
Figure 5—source data 2
CFU of indicated mycobacterial strains in mice spleen (spleen burden).
- https://cdn.elifesciences.org/articles/92136/elife-92136-fig5-data2-v2.xlsx
-
Figure 5—source data 3
Histopathology of lung section unlabeled.
- https://cdn.elifesciences.org/articles/92136/elife-92136-fig5-data3-v2.pptx
-
Figure 5—source data 4
Histopathology of lung section of indicated strains.
- https://cdn.elifesciences.org/articles/92136/elife-92136-fig5-data4-v2.pptx
Figure 6

Increased 3′,5-cyclic adenosine monophosphate (cAMP) level and effective stress response versus decreased cAMP level and reduced stress tolerance of mycobacteria.
In this model, upon activation by an appropriate signal via the cognate sensor PhoR, P~PhoP binds to rv0805 regulatory region and functions as a specific repressor by preventing access for mycobacterial RNA polymerase (RNAP) to bind to the promoter and initiate transcription. In keeping with PhoP-dependent rv0805 repression, our results demonstrate a reproducibly lower level of cAMP in phoPR-KO relative to WT bacilli. Thus, phoPR-KO (or WT-Rv0805) remains ineffective to mount an appropriate stress response most likely due to its inability to coordinate regulated gene expression because of dysregulation of cAMP level, accounting for their reduced stress tolerance. Together, these molecular events suggest that failure to maintain cAMP level accounts for attenuated phenotype of the bacilli.
Tables
Appendix 1—key resources table
| Reagent type (species) or resource | Designation | Source or reference | Identifiers | Additional information |
|---|---|---|---|---|
| Strain, strain background (Mycobacterium tuberculosis) | WT-H37Rv | ATCC25618 | Wild-type M. tuberculosis H37Rv strain | |
| Strain, strain background (M. tuberculosis) | ΔphoP-H37Rv | Walters et al., 2006 | phoPR locus Rv0757-Rv0758 has been inactivated | |
| Strain, strain background (M. tuberculosis) | ΔphoP::phoP | Walters et al., 2006 | ΔphoP-complemented with phoP | |
| Sequence-based reagent | FPrv0386RT | This study | RT-qPCR primer | Gene-specific primer: GGCCCAGATCCTTACCTTTC |
| Sequence-based reagent | RPrv0386RT | This study | RT-qPCR primer | Gene-specific primer: TGTGCAGCACTTCCTGAGAC |
| Sequence-based reagent | FPrv0891cRT | This study | RT-qPCR primer | Gene-specific primer: TCAAACGGTACGAGGGTGAT |
| Sequence-based reagent | RPrv0891cRT | This study | RT-qPCR primer | Gene-specific primer: CACAACTGCATGACCCATTC |
| Sequence-based reagent | FPrv1264RT | This study | RT-qPCR primer | Gene-specific primer: CAGCTAGGCGAAGTGGTGTC |
| Sequence-based reagent | RPrv1264RT | This study | RT-qPCR primer | Gene-specific primer: GGGAAAGTTGTTGTCGGTGT |
| Sequence-based reagent | FPrv1339RT | This study | RT-qPCR primer | Gene-specific primer: CGCCGTTGGTTATCGACTTC |
| Sequence-based reagent | RPrv1339RT | This study | RT-qPCR primer | Gene-specific primer: AACAGTCGTCAATCTCCCCA |
| Sequence-based reagent | FPrv1625cRT | This study | RT-qPCR primer | Gene-specific primer: TGAATTTGCCCCACCGAATC |
| Sequence-based reagent | RPrv1625cRT | This study | RT-qPCR primer | Gene-specific primer: CAGCGCAATTGAAGGATCCA |
| Sequence-based reagent | FPrv1647RT | This study | RT-qPCR primer | Gene-specific primer: GCCCAAGATGCTGTGAAGTC |
| Sequence-based reagent | RPrv1647RT | This study | RT-qPCR primer | Gene-specific primer: AACTCACTTTGCGGGATCAG |
| Sequence-based reagent | FPrv2488cRT | This study | RT-qPCR primer | Gene-specific primer: TTGCTGTTGGCATCATGTCT |
| Sequence-based reagent | RPrv2488cRT | This study | RT-qPCR primer | Gene-specific primer: CTTCTGGGCATCATCTAGGC |
| Sequence-based reagent | FPrv0805RT | This study | RT-qPCR primer | Gene-specific primer: GCCGAACTACGCAAATTCTT |
| Sequence-based reagent | RPrv0805RT | This study | RT-qPCR primer | Gene-specific primer: ATCCAAAACACTCGGAATCG |
| Sequence-based reagent | FPrv1357cRT | This study | RT-qPCR primer | Gene-specific primer: TCCTCGTCTACCAGCCAATC |
| Sequence-based reagent | RPrv1357cRT | This study | RT-qPCR primer | Gene-specific primer: GAGACGTTGACGCTGACAAA |
| Sequence-based reagent | FPrv2837cRT | This study | RT-qPCR primer | Gene-specific primer: AGCAGGACCTTGATGGACAG |
| Sequence-based reagent | RPrv2837cRT | This study | RT-qPCR primer | Gene-specific primer: GTTCGACCTCCTTGAACACC |
| Sequence-based reagent | FPphoPRT | Khan et al., 2022 | RT-qPCR primer | Gene-specific primer: GCCTCAAGTTCCAGGGCTTT |
| Sequence-based reagent | RPphoPRT | Khan et al., 2022 | RT-qPCR primer | Gene-specific primer: CCGGGCCCGATCCA |
| Sequence-based reagent | FPpks2RT | Goyal et al., 2011 | RT-qPCR primer | Gene-specific primer: GTTGTGGAAGGCGTTGTTAC |
| Sequence-based reagent | RPpks2RT | Goyal et al., 2011 | RT-qPCR primer | Gene-specific primer: GTCGTAGAACTCGTCGCAAT |
| Sequence-based reagent | FPmsl3RT | Goyal et al., 2011 | RT-qPCR primer | Gene-specific primer: GTGAAAACAAACTTCGGTCAC |
| Sequence-based reagent | RPmsl3RT | Goyal et al., 2011 | RT-qPCR primer | Gene-specific primer: ACAAAGAGTTCAGTGTCAATCTCAG |
| Sequence-based reagent | FPlipFRT | Bansal et al., 2017 | RT-qPCR primer | Gene-specific primer: TAGTGGCCATCTCTCCGTTG |
| Sequence-based reagent | RPlipFRT | Bansal et al., 2017 | RT-qPCR primer | Gene-specific primer: AGCGGCTCATAGAGGTCTTC |
| Sequence-based reagent | FP16SrDNART | Khan et al., 2022 | RT-qPCR primer | Gene-specific primer: CTGAGATACGGCCCAGACTC |
| Sequence-based reagent | RP16SrDNART | Khan et al., 2022 | RT-qPCR primer | Gene-specific primer: CGTCGATGGTGAAAGAGGTT |
| Sequence-based reagent | FPrv0805up | This study | ChIP-qPCR primer | Promoter-specific primer: CGGCGTTCTGGTATCTCG |
| Sequence-based reagent | RPrv0805up | This study | ChIP-qPCR primer | Promoter-specific primer: TAAGAGAACGTAATCCGG |
| Sequence-based reagent | FPrv0805start | This study | Cloning primer | Gene-specific primer: AATAATGATATCGTGCATAGACTT |
| Sequence-based reagent | RPrv0805stop | This study | Cloning primer | Gene-specific primer: AATAATAAGCTTTCAGTCGACGGGA |
| Sequence-based reagent | FPrv0805N97A | This study | Cloning primer | Gene-specific primer: TGGGTGATGGGTGCACACGACGACCG |
| Sequence-based reagent | RPrv0805N97A | This study | Cloning primer | Gene-specific primer: CGGTCGTCGTGTGCACCCATCACCCA |
| Sequence-based reagent | FPphoPsg | This study | Guide RNA-specific primer | Gene-specific primer: GGGAGATCCAGCGCCTGTGCCCCG |
| Sequence-based reagent | RPphoPsg | This study | Guide RNA-specific primer | Gene-specific primer: AAACCGGGGCACAGGCGCTGGATC |
| Sequence-based reagent | FPrv0805sg | This study | Guide RNA-specific primer | Gene-specific primer: GGGAGCTCGACCAGGCCTCGGAGC |
| Sequence-based reagent | RPrv0805sg | This study | Guide RNA-specific primer | Gene-specific primer: AAACGCTCCGAGGCCTGGTCGAGC |
| Sequence-based reagent | FPpRH2521seq | This study | Vector-specific primer | Vector-specific primer: AAACTCTAGAAATATTGGATCG |
| Sequence-based reagent | RPpRH2521seq | This study | Vector-specific primer | Vector-specific primer: CCTAATGACCATGGTGACCTC |
| Recombinant DNA reagent | p19Kprob | De Smet et al., 1999 | Plasmid DNA | Mycobacteria expression vector, Hygr |
| Recombinant DNA reagent | p19Kpro-phoP | Anil Kumar et al., 2016 | Plasmid DNA | His6-tagged PhoP residues 1–247 cloned in p19Kpro |
| Recombinant DNA reagent | p19Kpro-phoP(FLAG) | This study | Plasmid DNA | FLAG-tagged PhoP residues 1–247 cloned in p19Kpro |
| Recombinant DNA reagent | pSTKic | Parikh et al., 2013 | Plasmid DNA | Integrative mycobacterial expression vector, Kanrc |
| Recombinant DNA reagent | pSTKi-pde | This study | Plasmid DNA | PDE (rv0805) residues 1–957 cloned in pSTKi |
| Recombinant DNA reagent | pSTKi-pdeM | This study | Plasmid DNA | PDE (rv0805M) Asn-97 codon mutated to Ala in pSTKi-pdeM |
| Recombinant DNA reagent | pRH2502 | Singh et al., 2016 | Plasmid DNA | Integrative mycobacterial expression vector, Kanr, c |
| Recombinant DNA reagent | pRH2521 | Singh et al., 2016 | Plasmid DNA | Episomal expression vector, Hygr,b |
| Recombinant DNA reagent | pRH2521-phoPsg | This study | Plasmid DNA | pRH2521 vector expressing phoP guide RNA, Hygr,b |
| Recombinant DNA reagent | pRH2521-rv0805sg | This study | Plasmid DNA | pRH2521 vector expressing rv0805 guide RNA, Hygr,b |
| Antibody | Anti-GroEL2 (rabbit polyclonal) | Abcam | Cat# ab90522 | 1:5000 |
| Antibody | Anti-RpoB (rabbit monoclonal) | Abcam | Cat# ab191598 | 1:3000 |
| Antibody | Anti-CFP10 (rabbit polyclonal) | Abcam | Cat# ab45074 | 1:1000 |
Additional files
-
Supplementary file 1
Sequences of oligonucleotide primers used in RT-qPCR, ChIP-qPCR, cloning and amplifications.
(a) Sequences of oligonucleotide primers used in RT-qPCR and ChIP-qPCR measurements reported in this study. (b) Sequences of oligonucleotide primers used for amplification and cloning, and plasmids used in this study.
- https://cdn.elifesciences.org/articles/92136/elife-92136-supp1-v2.docx
-
MDAR checklist
- https://cdn.elifesciences.org/articles/92136/elife-92136-mdarchecklist1-v2.docx
Download links
A two-part list of links to download the article, or parts of the article, in various formats.
Downloads (link to download the article as PDF)
Open citations (links to open the citations from this article in various online reference manager services)
Cite this article (links to download the citations from this article in formats compatible with various reference manager tools)
Mycobacterium tuberculosis PhoP integrates stress response to intracellular survival by regulating cAMP level
eLife 13:RP92136.
https://doi.org/10.7554/eLife.92136.4


