GLI1 facilitates collagen-induced arthritis in mice by collaborative regulation of DNA methyltransferases
- Department of Orthopedics, The First Affiliated Hospital of Soochow University, Orthopedic Institute, Medical College, Soochow University, China
- Medical 3D Printing Center, The First Affiliated Hospital, School of Biology & Basic Medical Sciences, Suzhou Medical College, Soochow University, China
- Department of Obstetrics and Gynecology, The First Affiliated Hospital of Soochow University, China
- Department of Orthopedics, The First Affiliated Hospital of USTC, Division of Life Sciences and Medicine, University of Science and Technology of China, China
- Department of Orthopaedics, Suzhou Kowloon Hospital Shanghai Jiao Tong University School of Medicine, China
- Collaborative Innovation Center of Hematology, Soochow University, China
Figures
Figure 1 with 3 supplements
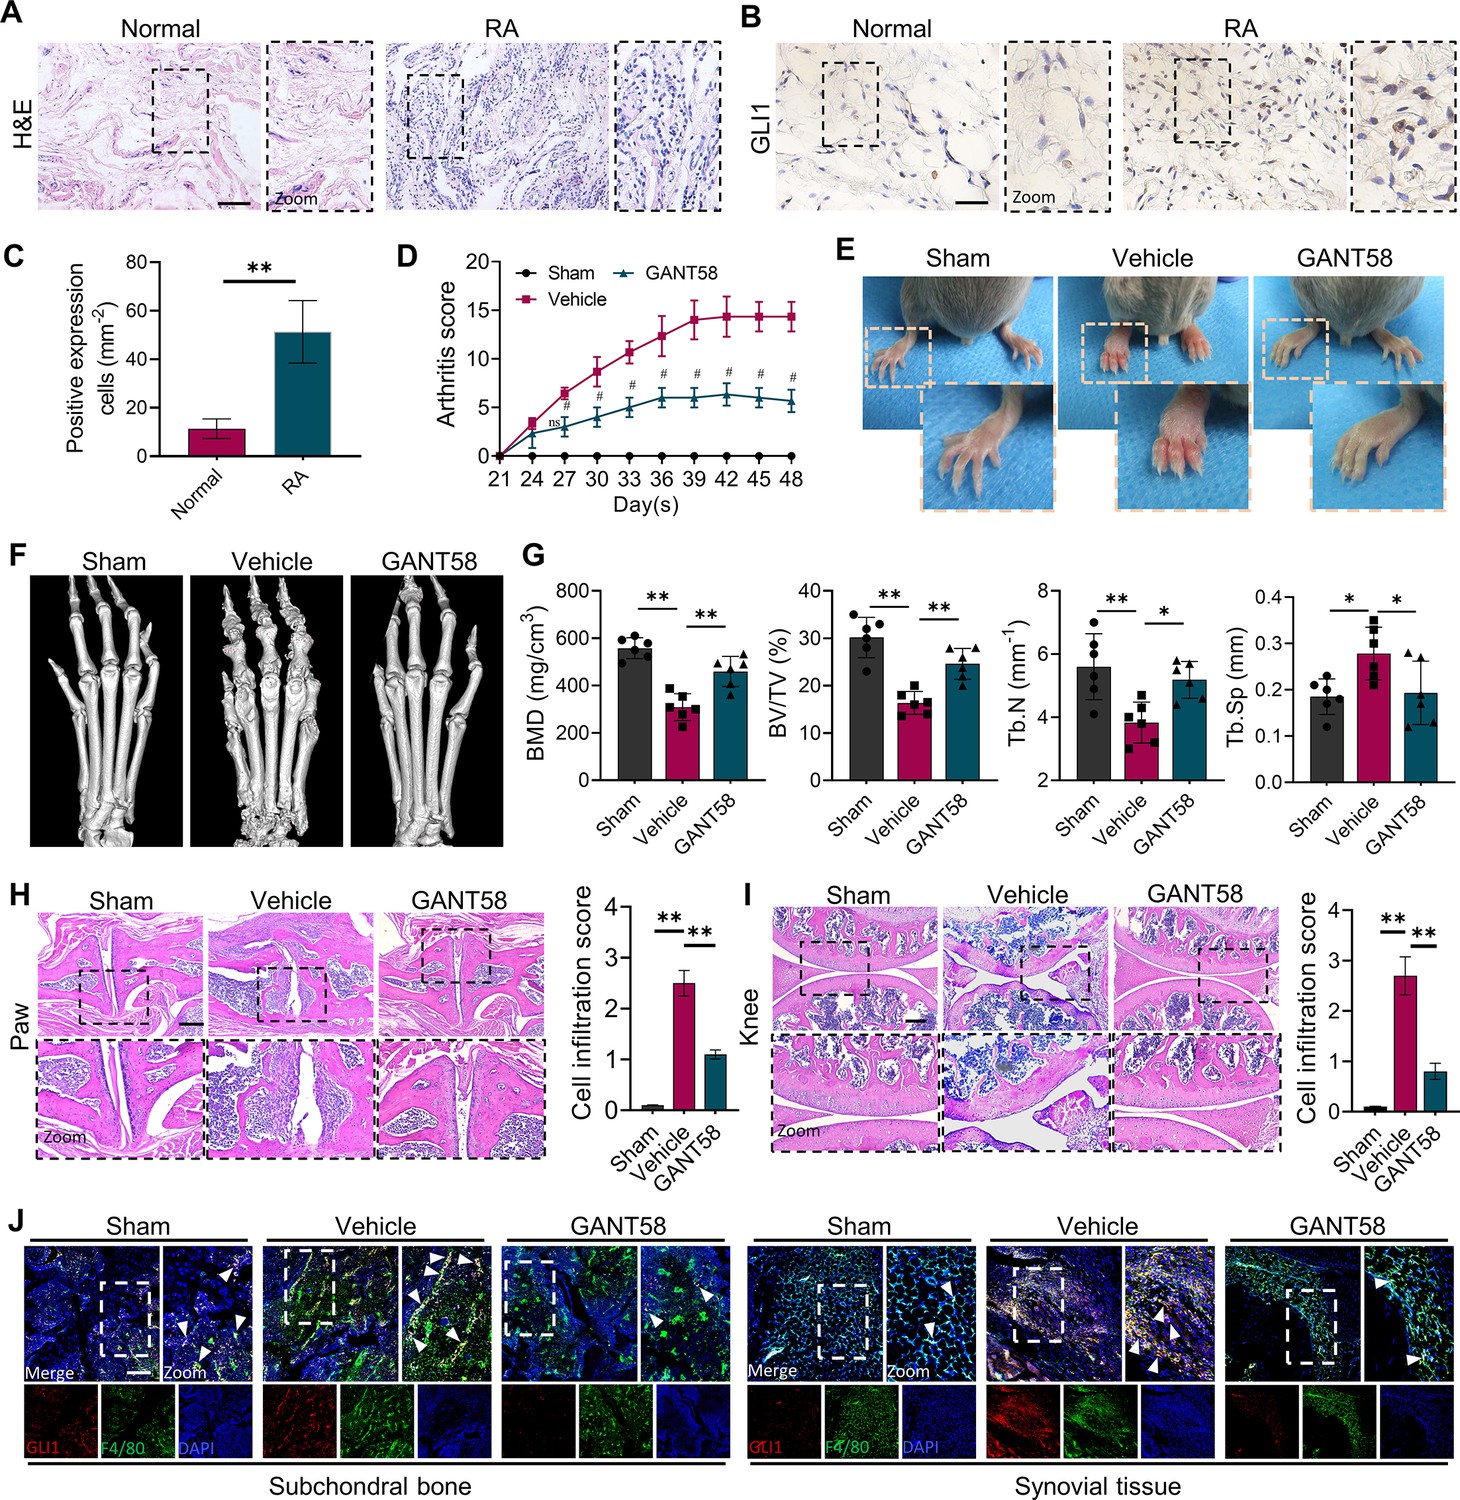
GLI1 is highly expressed in human RA synovium and regulates the pathological process of joint inflammatory bone destruction in CIA mice.
(A) H&E staining of normal and RA human synovium. Scale bars = 200 μm. (B) IHC staining of GLI1 in normal and RA human synovium and (C) quantification of positively stained cells. Scale bars = 50 μm. n=3. (D) Arthritis score of mouse limbs. (E) Photos of mouse paws. (F) Micro-CT scanning and 3D reconstruction of mouse paws. (G) Bone parameters of BMD, BV/TV, Tb. N, Tb.Th. (H) Images of H&E staining of mouse paw joints and inflammatory cell infiltration score knee joints. Scale bars = 200 μm. (I) Images of H&E staining of mouse knee joints and inflammatory cell infiltration score. Scale bars = 200 μm. (J) Immunofluorescence costaining image of F4/80 with GLI1 (red: GLI1, green: F4/80, blue: DAPI). Scale bars = 200 μm. The in vivo results are presented as the mean ± SD of 6 mice per group. Data shown represent the mean ± SD. Statistical analysis was performed using one-way ANOVA test. *p<0.05, **p<0.01.
Figure 1—figure supplement 1
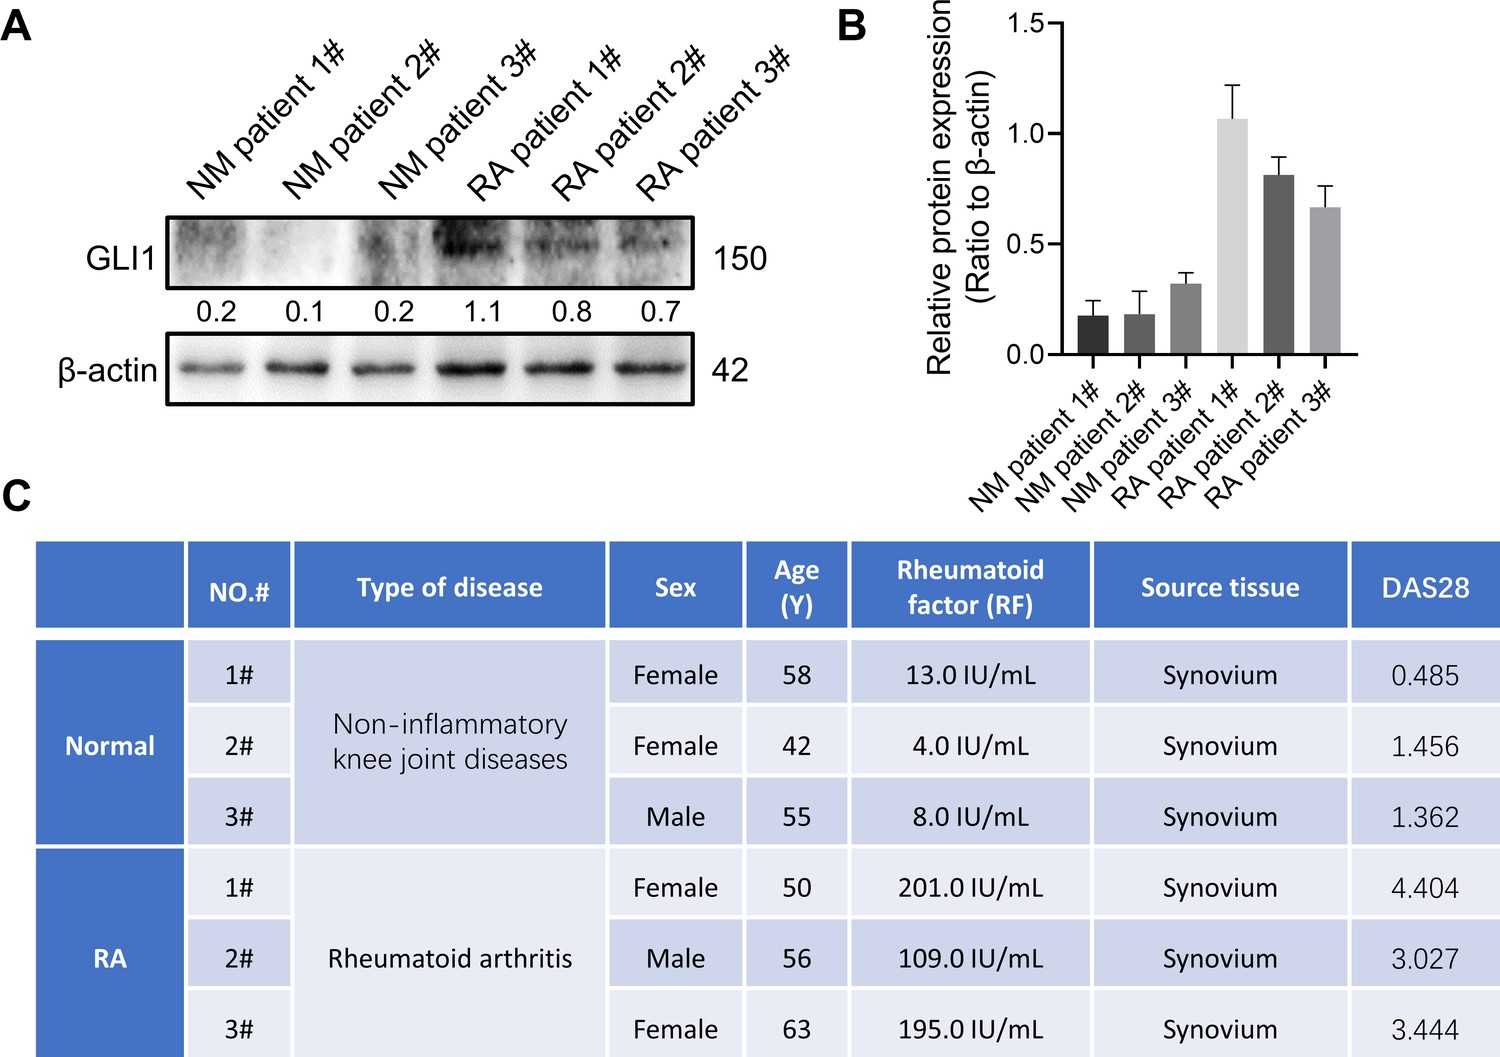
GLI1 is highly expressed in synovial tissue of rheumatoid arthritis patients.
-
Figure 1—figure supplement 1—source data 1
Uncropped western blot images for Figure 1—figure supplement 1.
- https://cdn.elifesciences.org/articles/92142/elife-92142-fig1-figsupp1-data1-v2.pptx
Figure 1—figure supplement 2
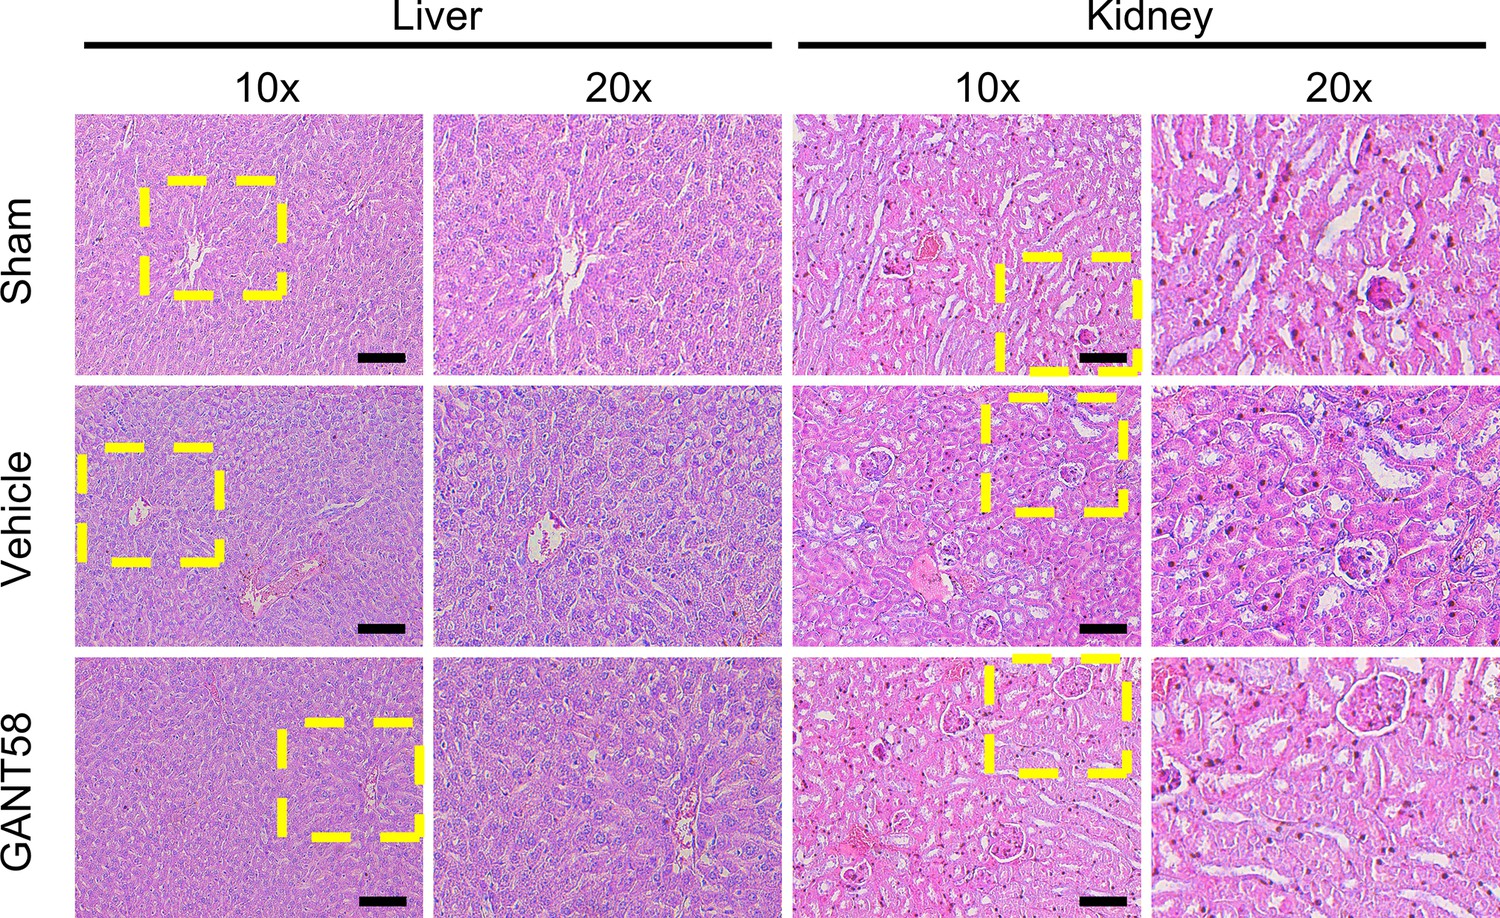
GANT58 shows no obvious toxicity in CIA mice.
Figure 1—figure supplement 3
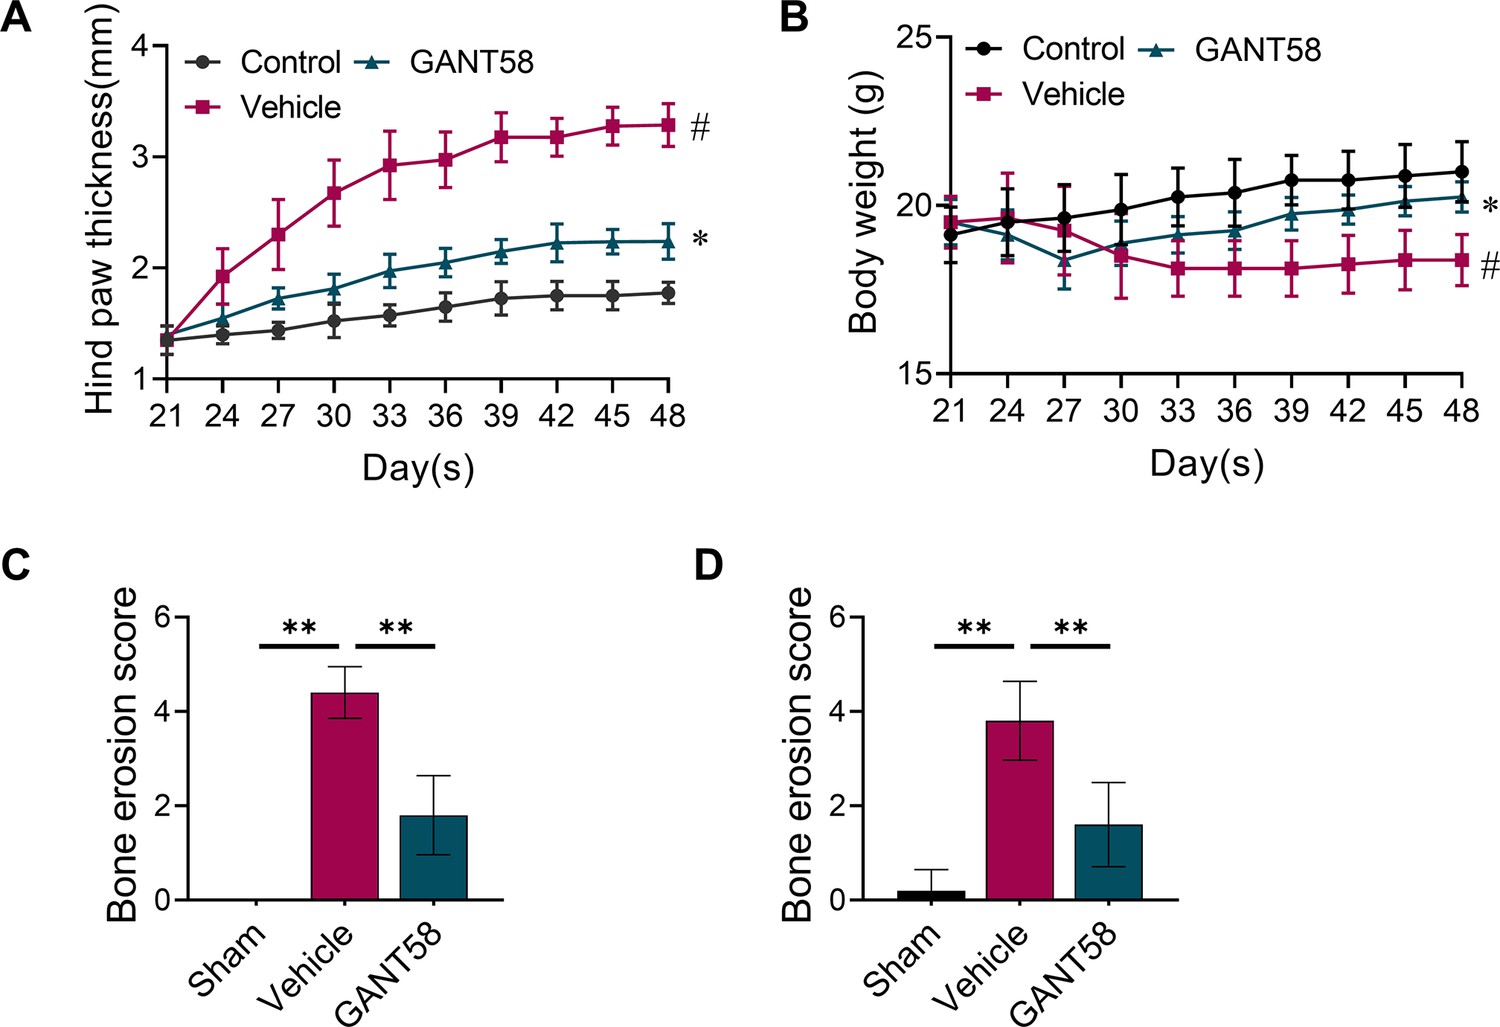
GANT58 reduces arthritis symptoms and bone destruction in CIA mice.
Figure 2 with 3 supplements
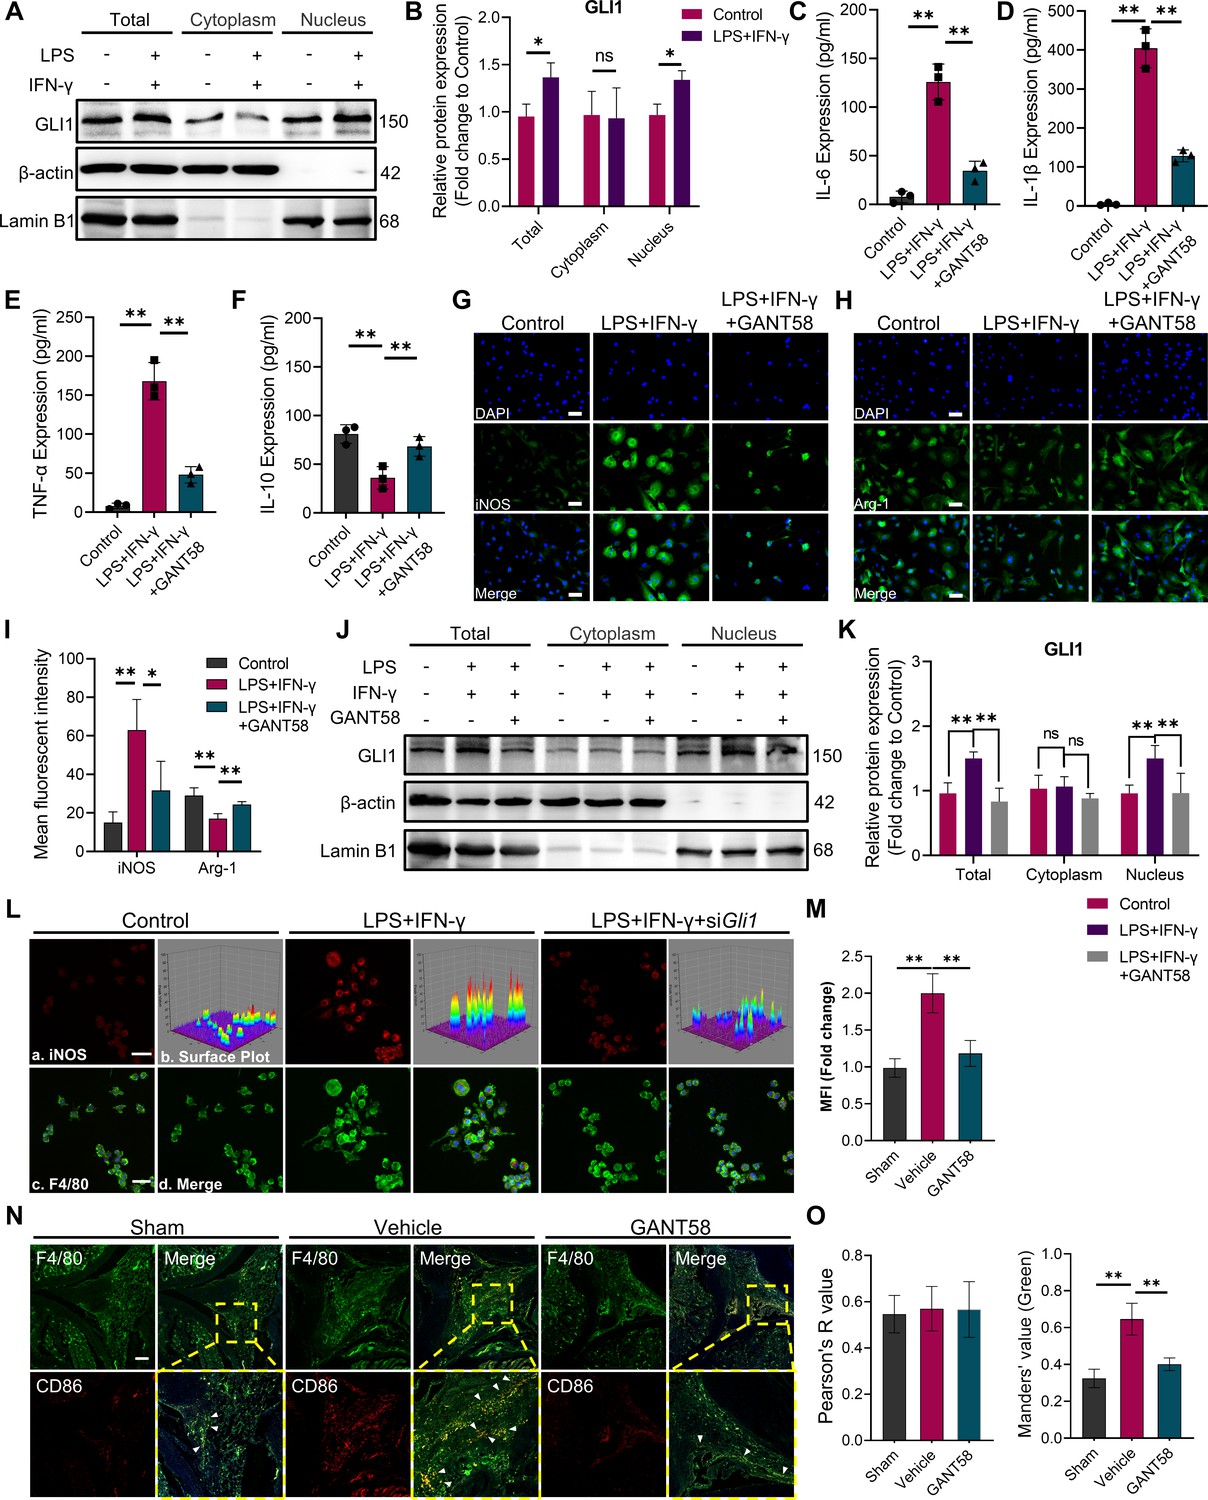
GLI1 plays an active role in M1 macrophage formation and the release of proinflammatory cytokines.
(A, B) RAW264.7 cells were stimulated with LPS/IFN-γ for 24 hr. The total proteins and proteins in the cytoplasm and nucleus were isolated and extracted. GLI1 protein was detected by western blot, and the grayscale value ratio to β-actin of the western blot results was analyzed. n=3. Statistical analysis was performed using Student’s t test. (C–F) Macrophages were stimulated with LPS/IFN-γ for 36 hr, with or without 10 μM GANT58 treatment. The supernatant was collected, and the volumes of IL-1β, IL-6, TNF-α and IL-10 were detected by ELISA. (G, H) Immunofluorescence staining of iNOS and arginase (Arg-1) after 24 hr of LPS/IFN-γ induction, with or without 10 μM GANT58 treatment. Scale bars = 25 μm. (I) The mean fluorescence intensity of immunofluorescence was analyzed using ImageJ. (J, K) RAW264.7 cells were stimulated with LPS/IFN-γ for 24 hr with or without 10 μM GANT58 pretreatment. GLI1 protein was detected by western blot, and the grayscale value ratio to β-actin of the western blot results was analyzed. n=3. (L) Immunofluorescence staining of iNOS in WT and siGli1 RAW264.7 cells after LPS/IFN-γ induction for 24 hr. Scale bars = 20 μm. (M) The mean fluorescence intensity of immunofluorescence was analyzed using ImageJ. (N) Immunofluorescence staining of mouse joint tissue (green: F4/80, red: CD86). Scale bars = 200 μm. (O) Pearson colocation coefficient and CD86-positive quantitative analysis were performed with ImageJ. Statistical analysis was performed using one-way ANOVA test. Data shown represent the mean ± SD. *p<0.05, **p<0.01, ns = no significance.
-
Figure 2—source data 1
Uncropped western blot images for Figure 2.
- https://cdn.elifesciences.org/articles/92142/elife-92142-fig2-data1-v2.pptx
Figure 2—figure supplement 1
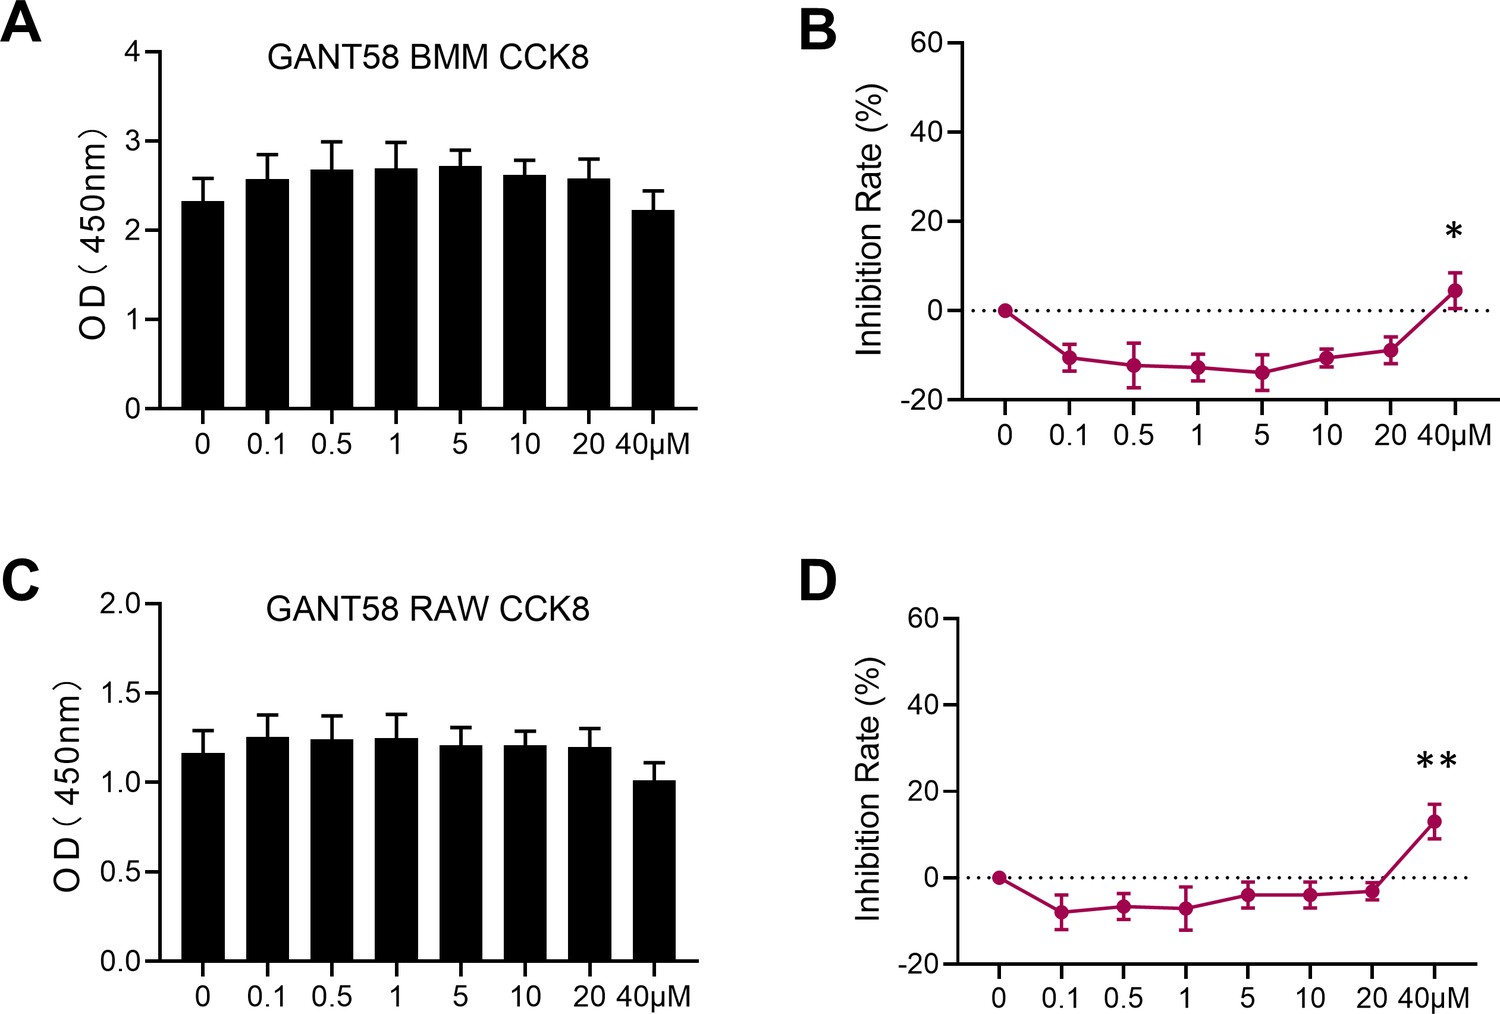
Cytotoxicity detection of GANT58.
Figure 2—figure supplement 2
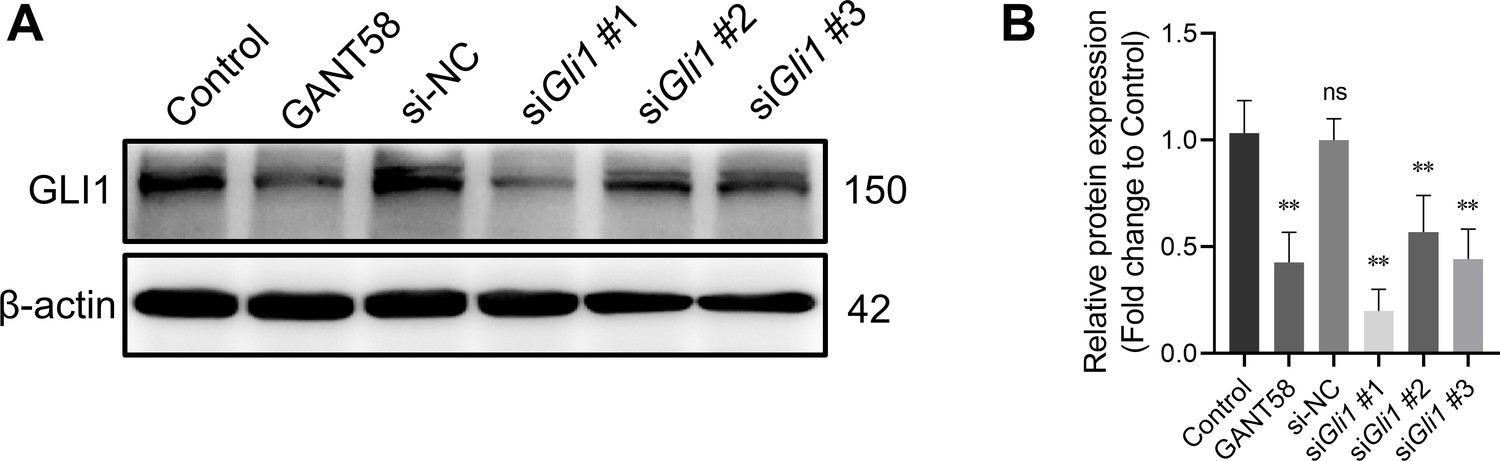
GLI1 protein expression after GANT58 and siRNA treatment.
-
Figure 2—figure supplement 2—source data 1
Uncropped western blot images for Figure 2—figure supplement 2.
- https://cdn.elifesciences.org/articles/92142/elife-92142-fig2-figsupp2-data1-v2.pptx
Figure 2—figure supplement 3
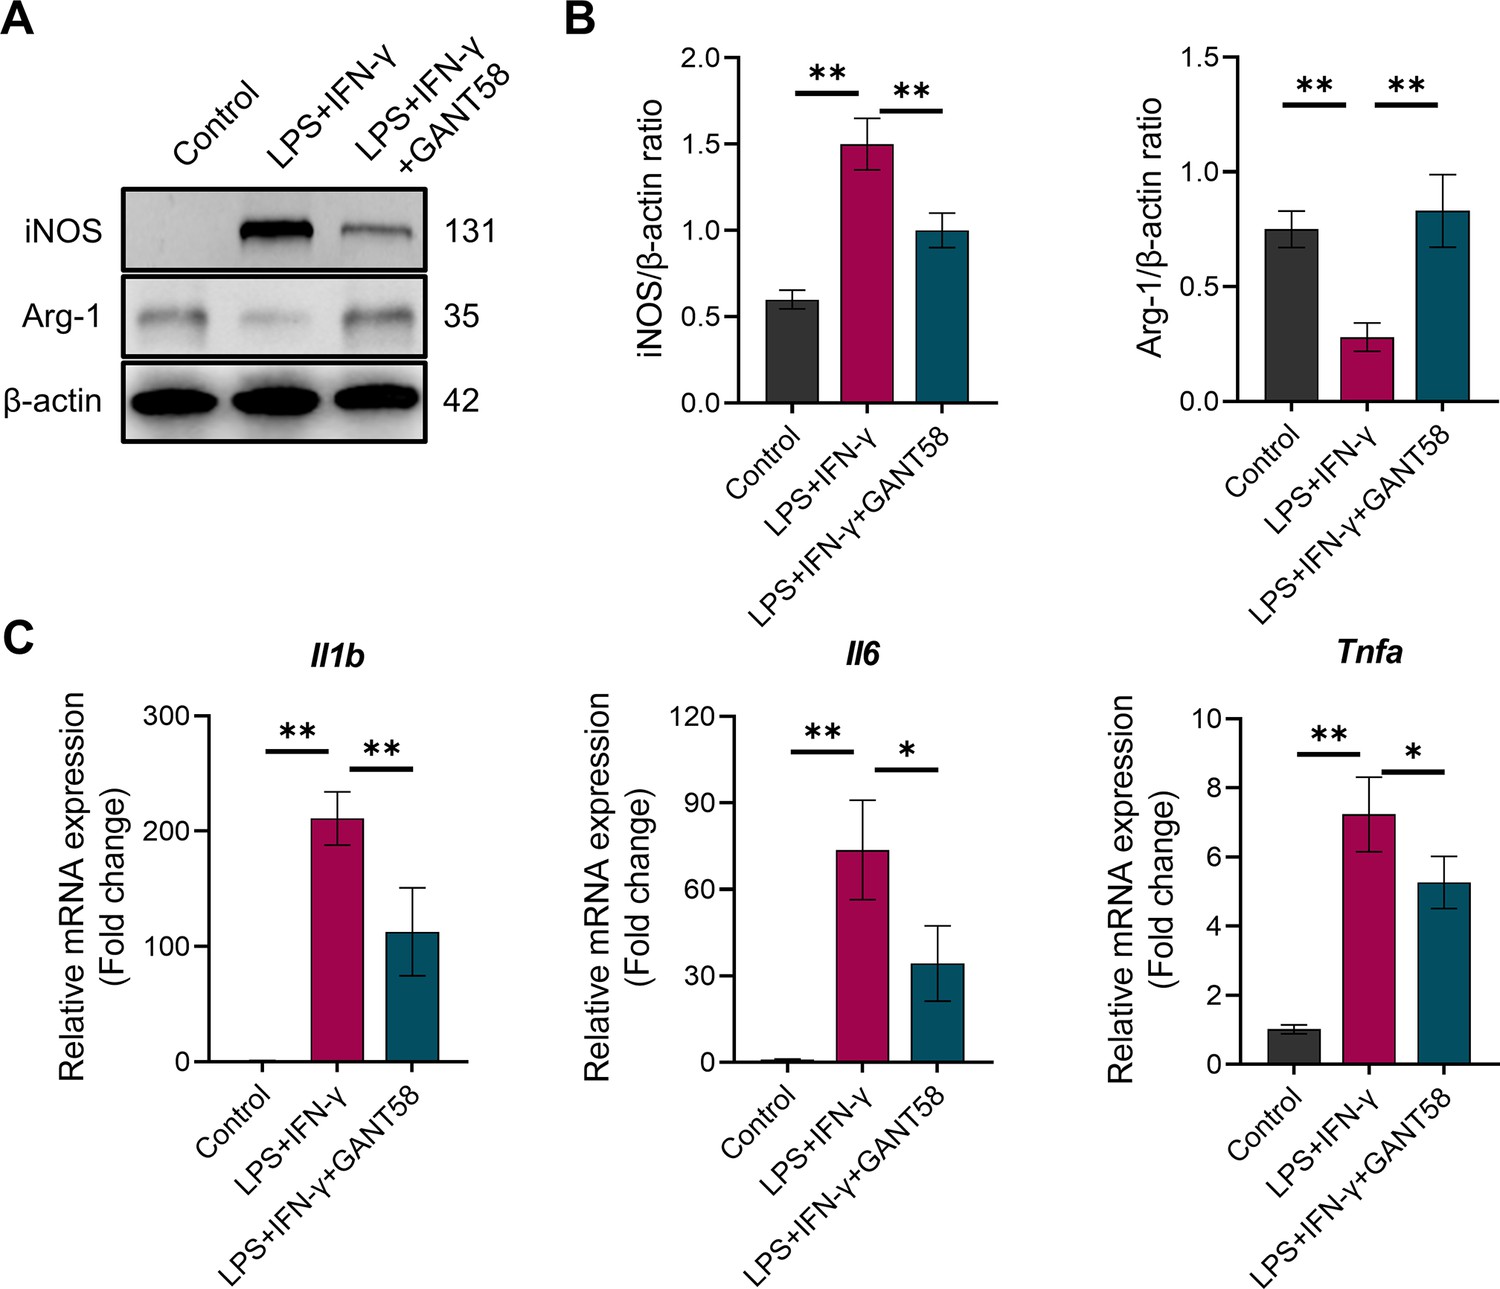
GANT58 inhibits M1 macrophage polarization.
-
Figure 2—figure supplement 3—source data 1
Uncropped western blot images for Figure 2—figure supplement 3.
- https://cdn.elifesciences.org/articles/92142/elife-92142-fig2-figsupp3-data1-v2.pptx
Figure 3 with 1 supplement
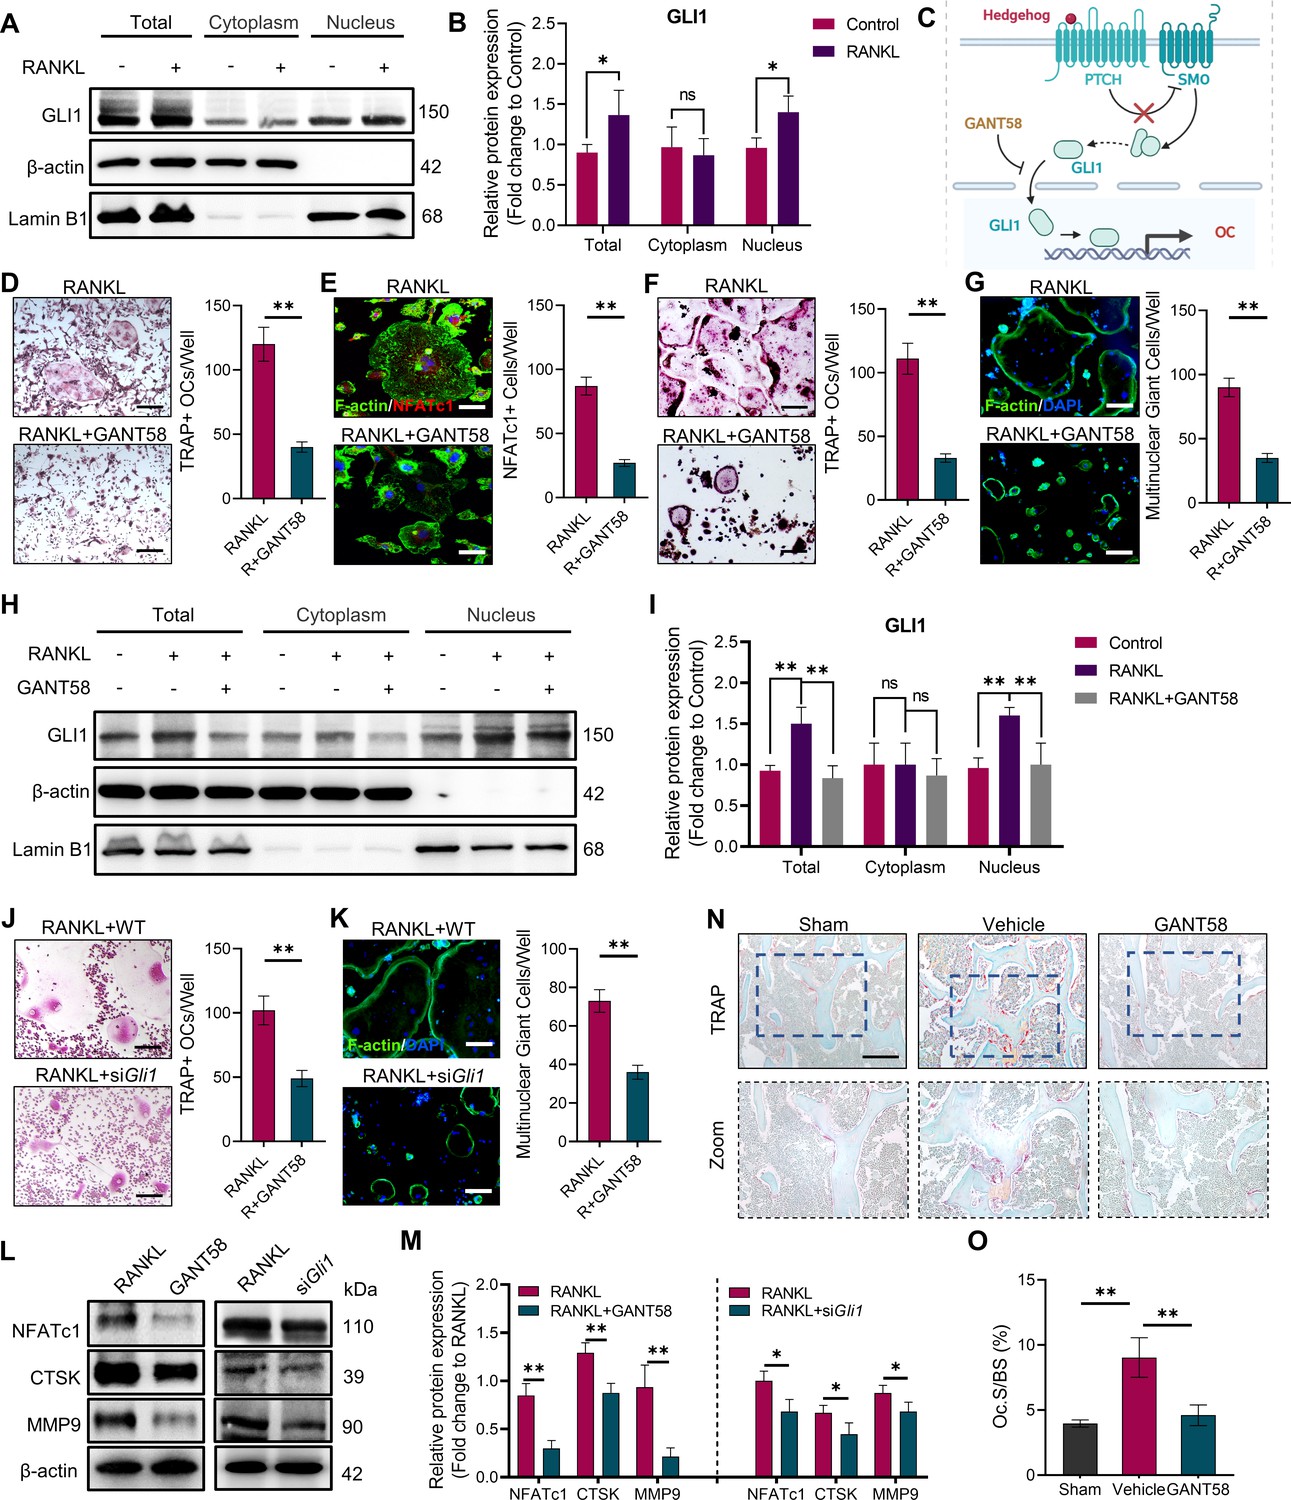
GLI1 regulates the formation of osteoclasts in vivo and in vitro.
(A, B) RAW264.7 cells were stimulated by RANKL for 48 hr. Total GLI1 protein and GLI1 in the cytoplasm and nucleus were detected by western blotting during osteoclast induction, and the fold change in the grayscale value compared to the control group was analyzed. n=3. (C) Schematic diagram of GLI1 activation. (D) TRAP staining of BMMs with RANKL induction and TRAP-positive osteoclast number per well. Scale bars = 25 μm. (E) F-actin and NFATc1 immunofluorescence staining of RANKL-stimulated BMM-derived osteoclasts and NFATc1-positive cell quantity per well. Scale bars = 25 μm. (F) TRAP staining of RAW264.7 cells with RANKL induction and TRAP-positive osteoclast quantity per well. Scale bars = 25 μm. (G) F-actin immunofluorescence staining of RANKL-stimulated RAW264.7-derived osteoclasts and multinucleated giant cell quantity per well. Scale bars = 25 μm. (H, I) RAW264.7 cells were stimulated by RANKL for 48 hr. Total GLI1 protein and GLI1 in the cytoplasm and nucleus were detected by western blot during osteoclast induction treated with or without GANT58, and the fold change in grayscale value compared to the control group was analyzed. Statistical analysis was performed using one-way ANOVA test. n=3. (J) TRAP staining of RAW264.7 cells with RANKL induction and TRAP-positive osteoclast number per well. Scale bars = 30 μm. (K) F-actin immunofluorescence staining of RANKL-stimulated RAW264.7-derived osteoclasts and multinucleated giant cell quantity per well. Scale bars = 25 μm. (L, M) RAW264.7 cells were stimulated by RANKL for 3 days. Western blot analysis of NFATc1, CTSK, and MMP9 was performed, and the fold change in grayscale value compared to the control group of western blot results was determined. n=3. Statistical analysis was performed using Student’s t test. (N) TRAP staining of mouse knee joint subchondral bone tissue. Scale bars = 100 μm. (O) Osteoclasts as a percentage of the bone surface analysis of histological TRAP staining results. n=5. Data shown represent the mean ± SD. *p<0.05, **p<0.01, ns = no significance.
-
Figure 3—source data 1
Uncropped western blot images for Figure 3.
- https://cdn.elifesciences.org/articles/92142/elife-92142-fig3-data1-v2.pptx
-
Figure 3—source data 2
Raw microscopy images for Figure 3.
- https://cdn.elifesciences.org/articles/92142/elife-92142-fig3-data2-v2.zip
Figure 3—figure supplement 1
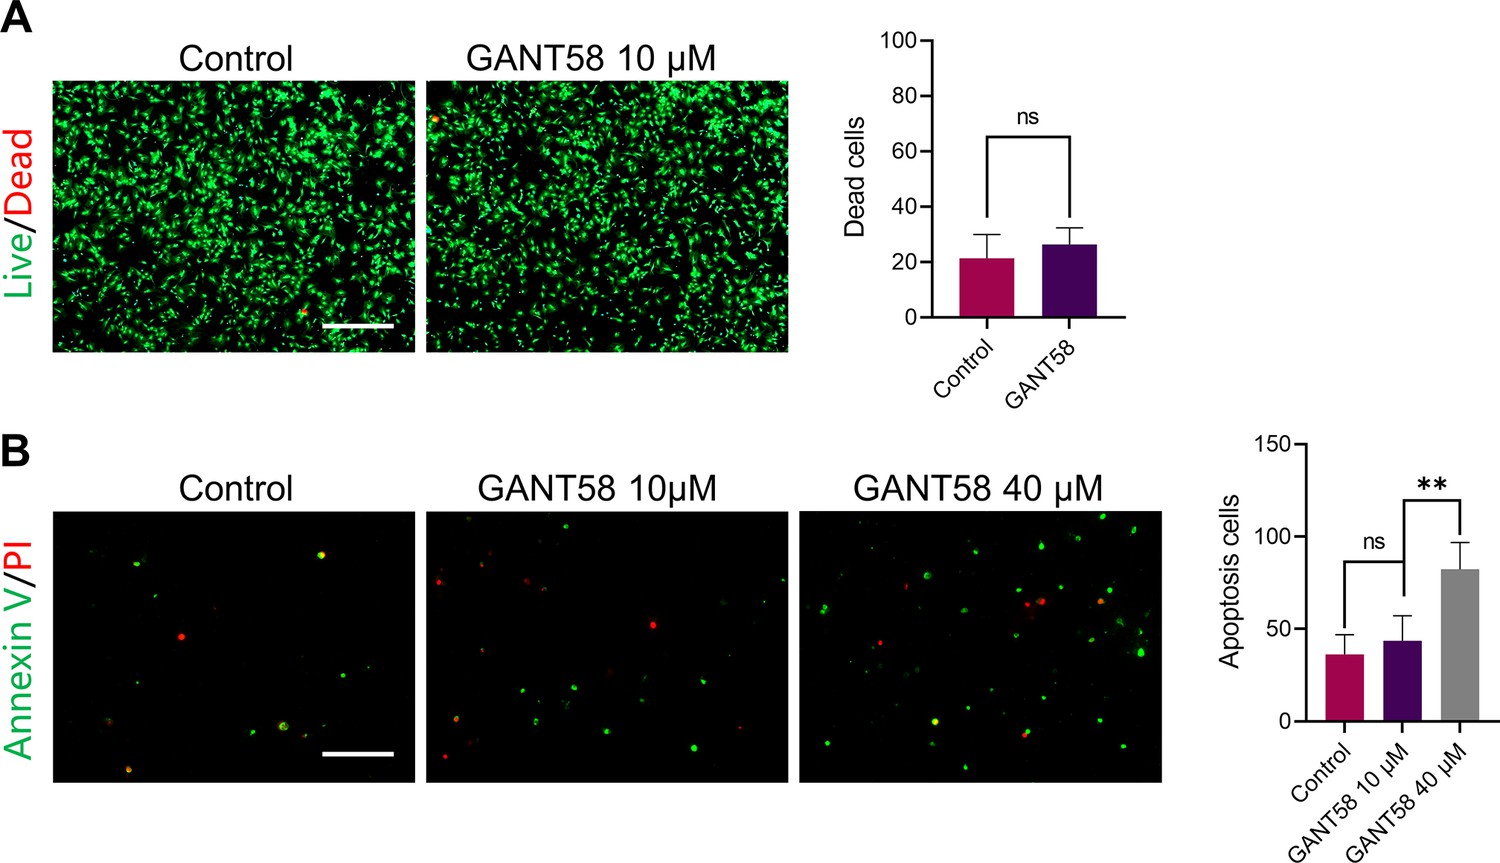
GANT58 at working concentration has no obvious apoptosis-promoting effect on cells.
Figure 4 with 3 supplements
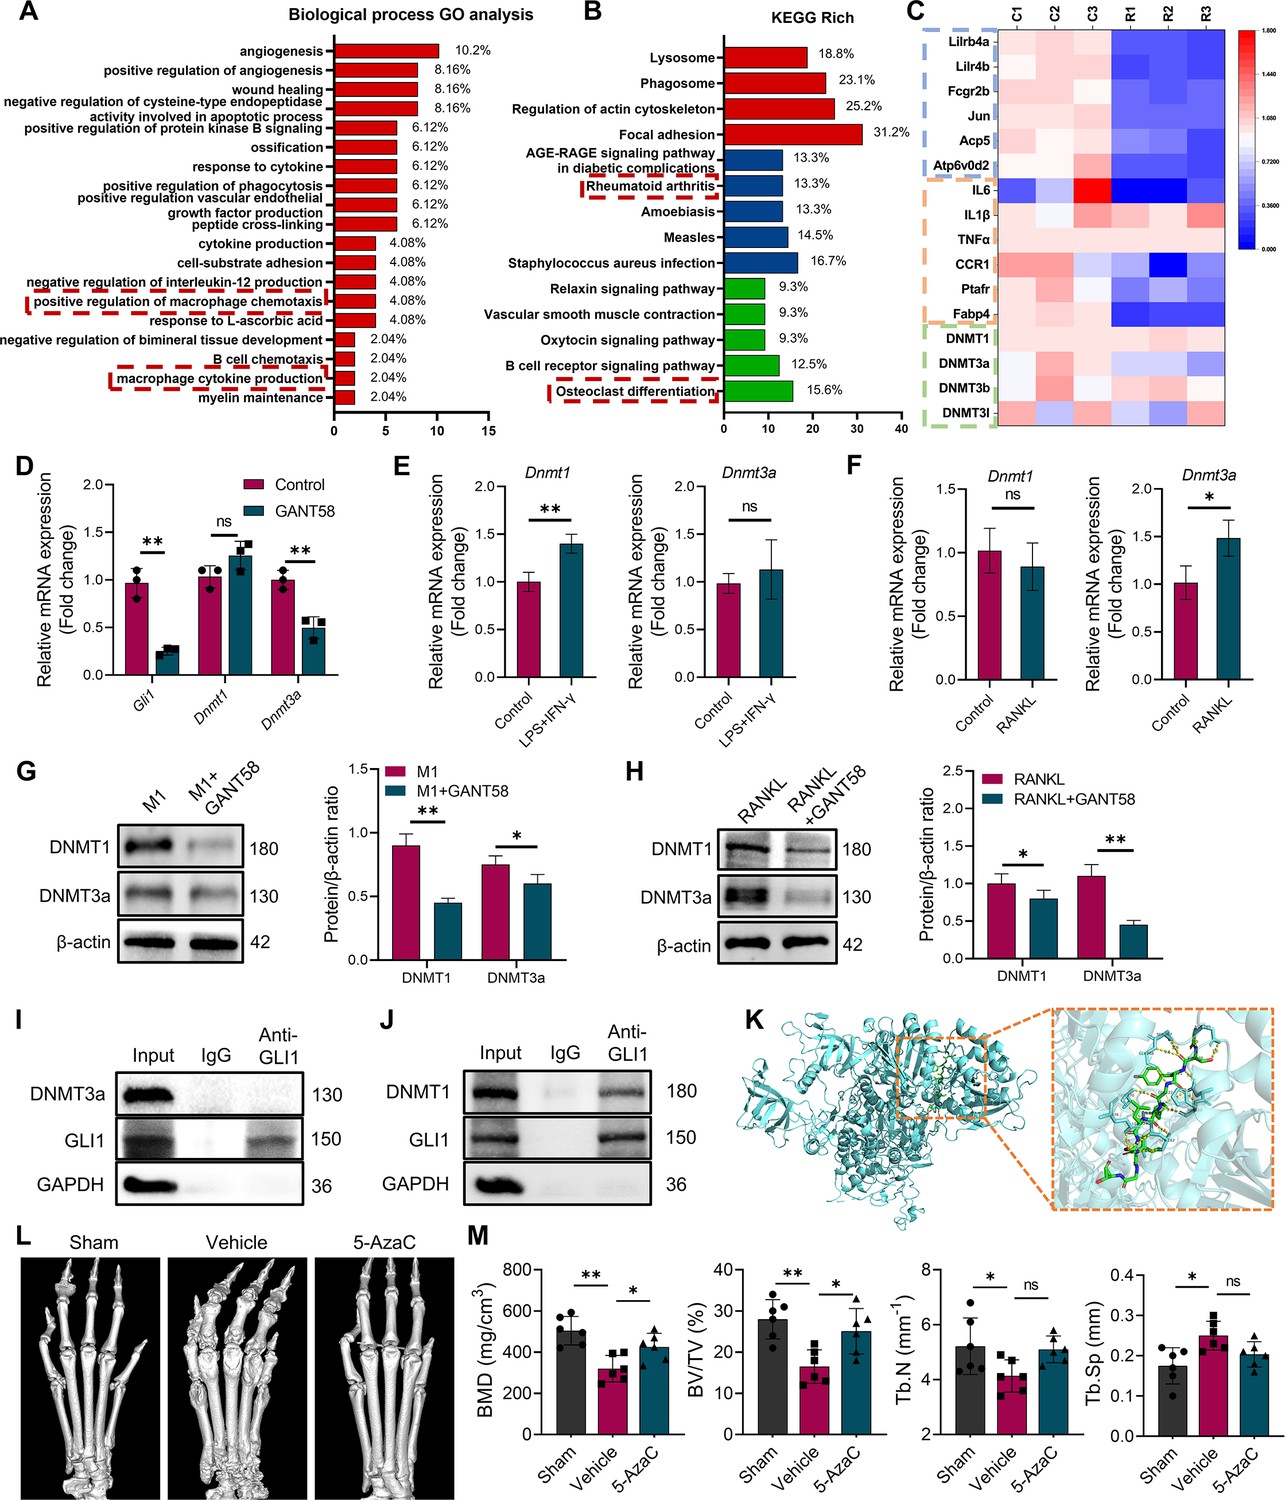
DNA methyltransferases might be a regulatory target downstream of GLI1.
(A) Biological process GO analysis of RNA-seq results for macrophages with or without GANT58 treatment. (B) KEGG rich analysis of RNA-seq results. (C) Heat map of parts of the relevant gene transcriptional expressions (C=control group; R=GANT58-treated group; red: increased expression; blue: decreased expression). (D) Relative mRNA expression of Gli1, Dnmt1 and Dnmt3a in macrophages with or without GANT58 treatment. Statistical analysis was performed using two-way ANOVA test. (E) RAW264.7 cells were stimulated by LPS and IFN-γ for 24 h, relative mRNA expression of Dnmt1 and Dnmt3a was detected by RT-qPCR. (F) RAW264.7 cells were stimulated by RANKL for 48 hr, relative mRNA expression of Dnmt1 and Dnmt3a was detected by RT-qPCR. n=3. Statistical analysis was performed using Student’s t test. (G) RAW264.7 cells were stimulated by LPS and IFN-γ (M1 induction) for 24 hr, with or without GANT58 co-intervention. Western blot results of DNMT1 and DNMT3a protein expression and grayscale value ratio to β-actin of western blot results. n=3. (H) RAW264.7 cells were stimulated by RANKL for 3 days, with or without GANT58 co-intervention. Western blot results of DNMT1 and DNMT3a protein expression and grayscale value ratio to β-actin of western blot results. n=3. Statistical analysis was performed using two-way ANOVA test. (I, J) Co-IP detection of protein binding between GLI1 and DNMT1/DNMT3a. n=3. (K) Protein–protein interface interaction of GLI1 and DNMT1 with PyMOL. (L) Micro-CT scanning and 3D reconstruction of mouse paws. (M) Bone parameters of BMD, BV/TV, Tb.N, Tb.Th. n=6. Statistical analysis was performed using one-way ANOVA test. Data shown represent the mean ± SD. *p<0.05, **p<0.01, ns = no significance.
-
Figure 4—source data 1
Uncropped western blot images for Figure 4.
- https://cdn.elifesciences.org/articles/92142/elife-92142-fig4-data1-v2.pptx
-
Figure 4—source data 2
RNA-seq data for Figure 4.
- https://cdn.elifesciences.org/articles/92142/elife-92142-fig4-data2-v2.xlsx
Figure 4—figure supplement 1
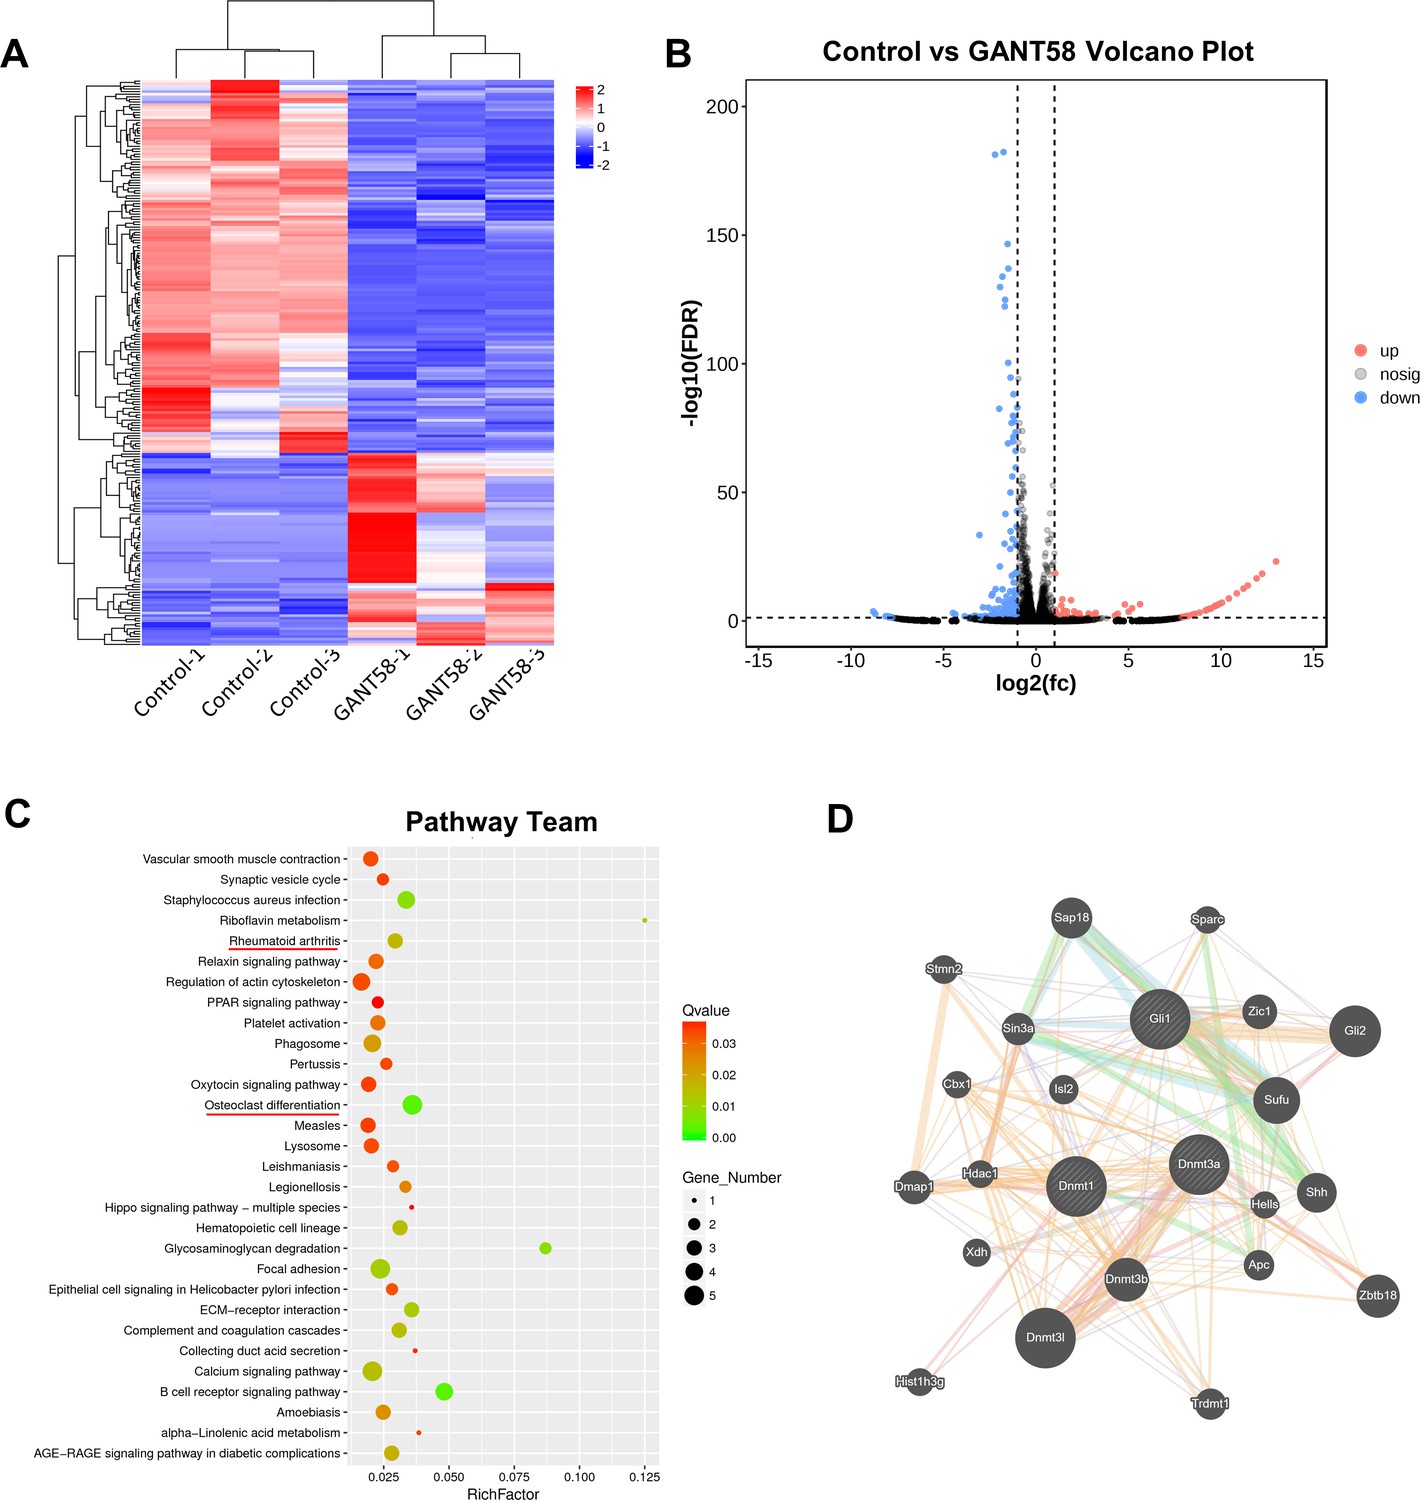
Analysis of differentially expressed genes and enrichment pathways of RNA-seq results.
Figure 4—figure supplement 2
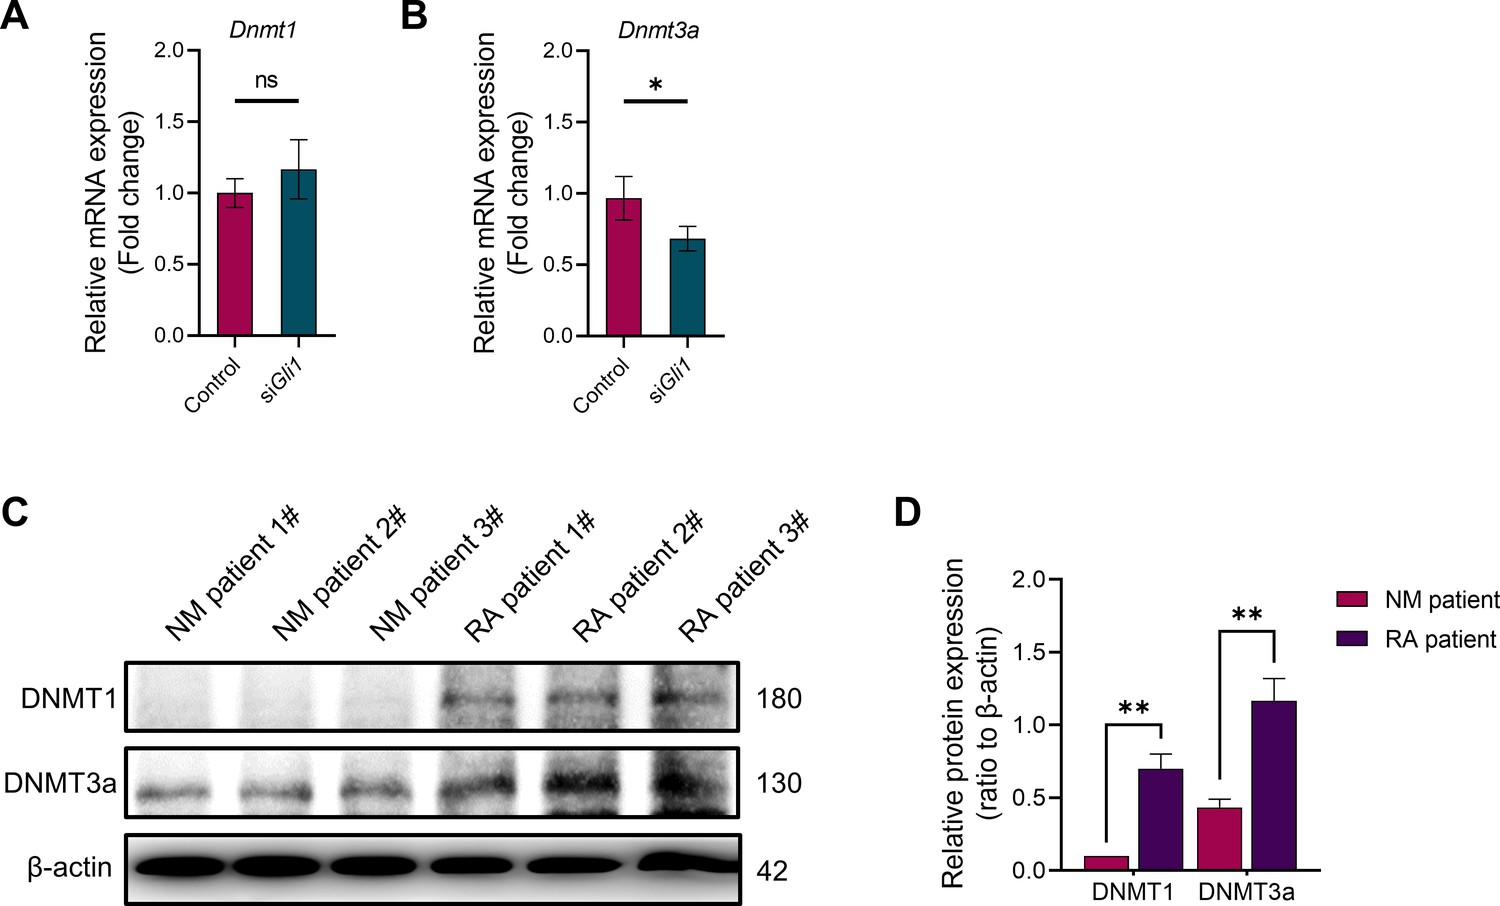
DNMT1 and DNMT3a are highly expressed in synovial tissue of patients with rheumatoid arthritis.
-
Figure 4—figure supplement 2—source data 1
Uncropped western blot images for Figure 4—figure supplement 2.
- https://cdn.elifesciences.org/articles/92142/elife-92142-fig4-figsupp2-data1-v2.pptx
Figure 4—figure supplement 3
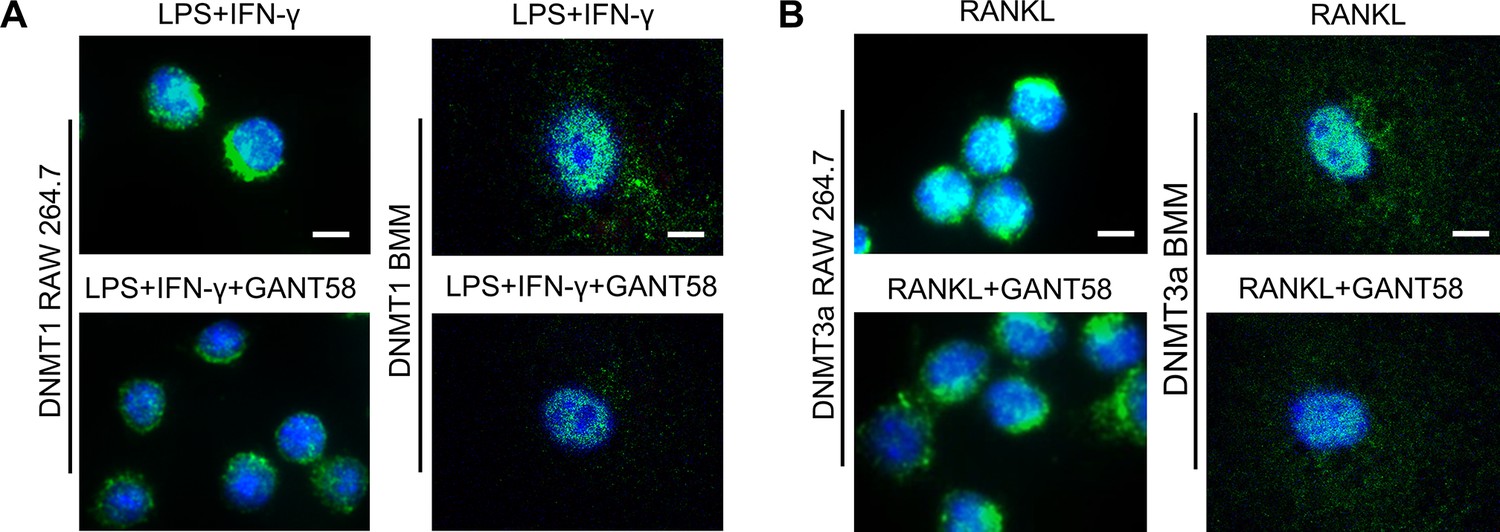
GANT58 reduced the expression of DNMT1 and DNMT3a in macrophages under different induction conditions.
Figure 5 with 4 supplements
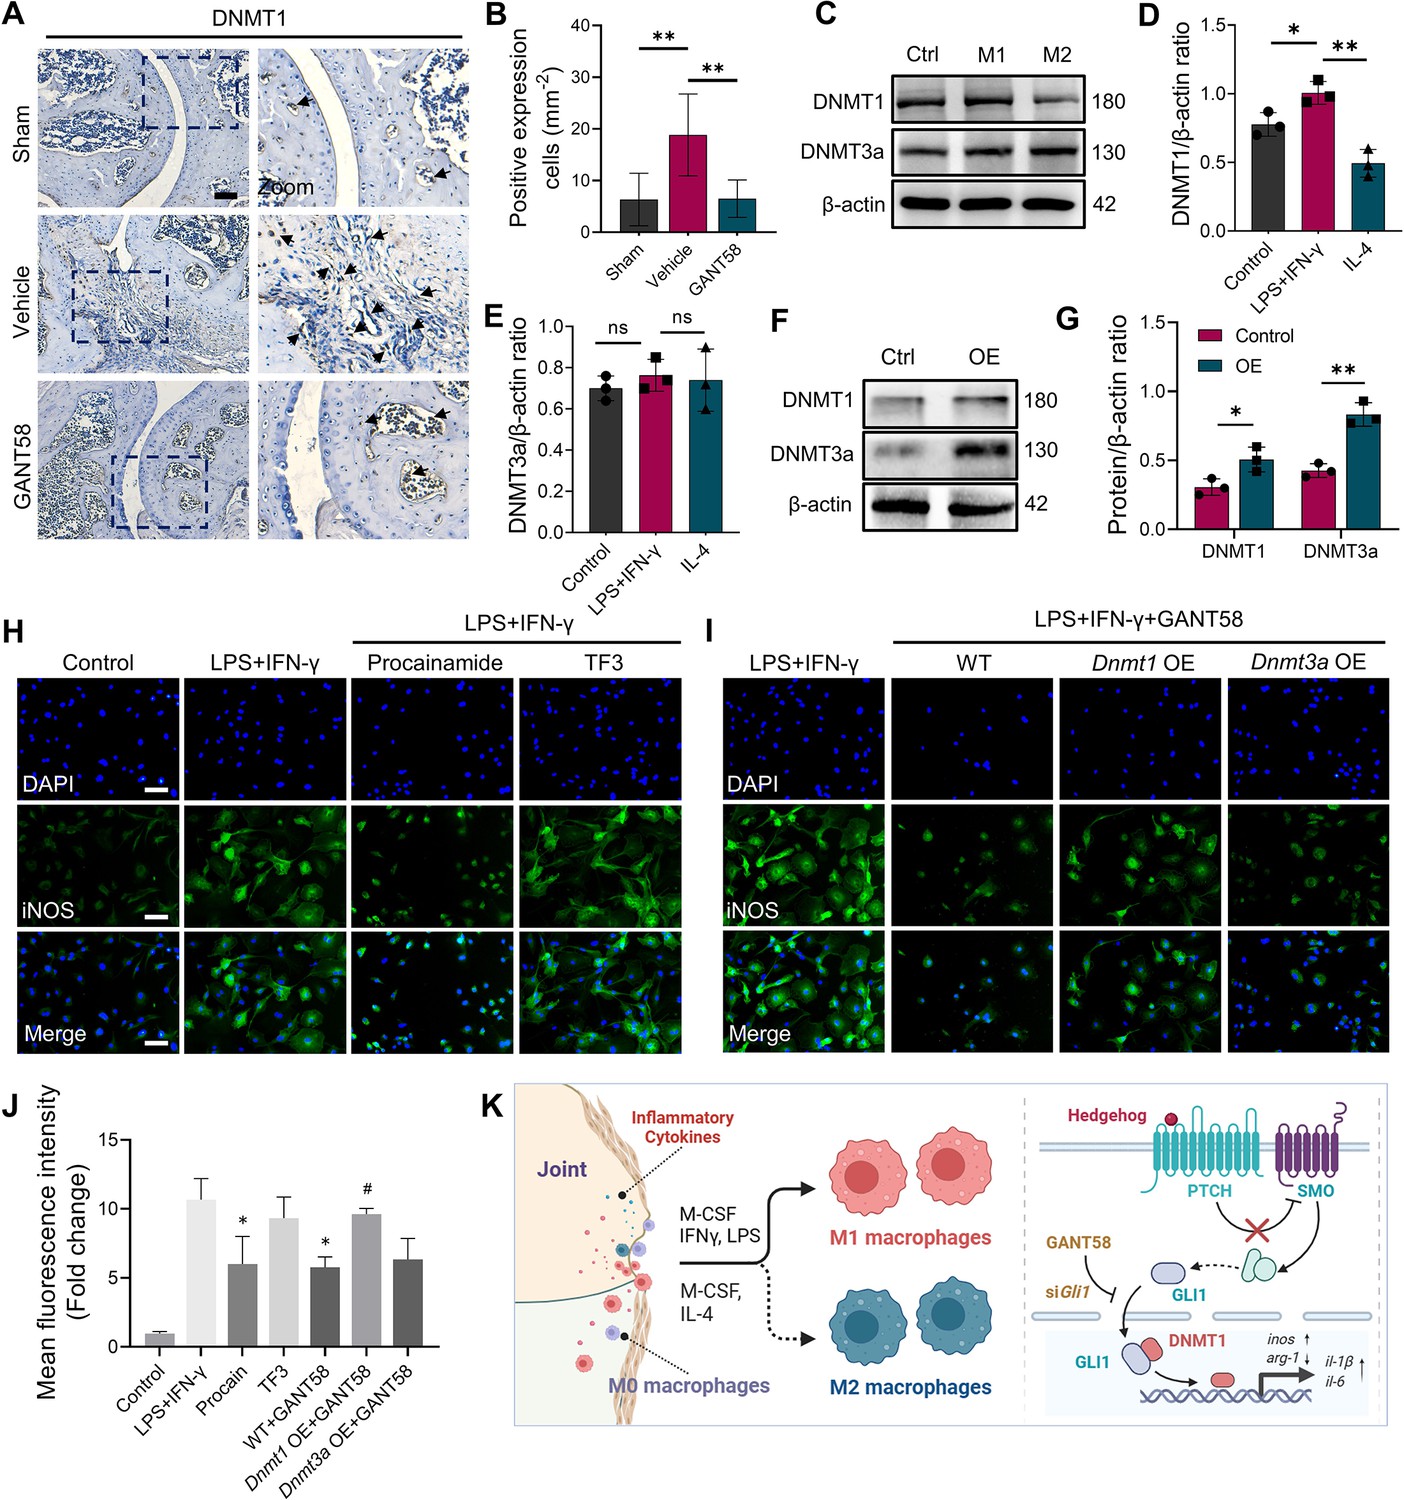
GLI1 regulates the expression of DNMT1, which affects macrophage phenotypes and the release of inflammatory cytokines.
(A) IHC staining of DNMT1 and (B) quantification of positive cell numbers in mouse ankle joints. n=5. Scale bars = 100 μm. Statistical analysis was performed using one-way ANOVA. (C) RAW264.7 cells were stimulated by LPS/IFN-γ and IL-4 for M1 and M2 polarization. Western blot detection of DNMT protein expression at 24 h. (D) DNMT1 grayscale value ratio to β-actin of western blot results. n=3. *p<0.05. (E) DNMT3a grayscale value ratio to β-actin of western blot results. n=3. ns = no significance. (F) RAW264.7 cells were transfected with Dnmt3a and Dnmt1 overexpression lentiviruses. Western blot analysis of DNMT1 and DNMT3a protein expression. (G) Grayscale value ratio to β-actin of western blot results. n=3. Statistical analysis was performed using Student’s t test. *p<0.05, **p<0.01. (H, I) BMMs were cultured and stimulated with LPS/IFN-γ in the presence of different interventions. Immunofluorescence staining of iNOS in LPS/IFN-γ-induced BMMs and (J) relative quantitative analysis of mean fluorescence intensity. Scale bars = 10 μm. n=3. (K) Schematic diagram of the regulatory mechanism. Statistical analysis was performed using one-way ANOVA test. Data shown represent the mean ± SD. *p<0.05 compared with the LPS/IFN-γ group; #p<0.05 compared with the WT+GANT58 group.
-
Figure 5—source data 1
Uncropped western blot images for Figure 5.
- https://cdn.elifesciences.org/articles/92142/elife-92142-fig5-data1-v2.pptx
Figure 5—figure supplement 1
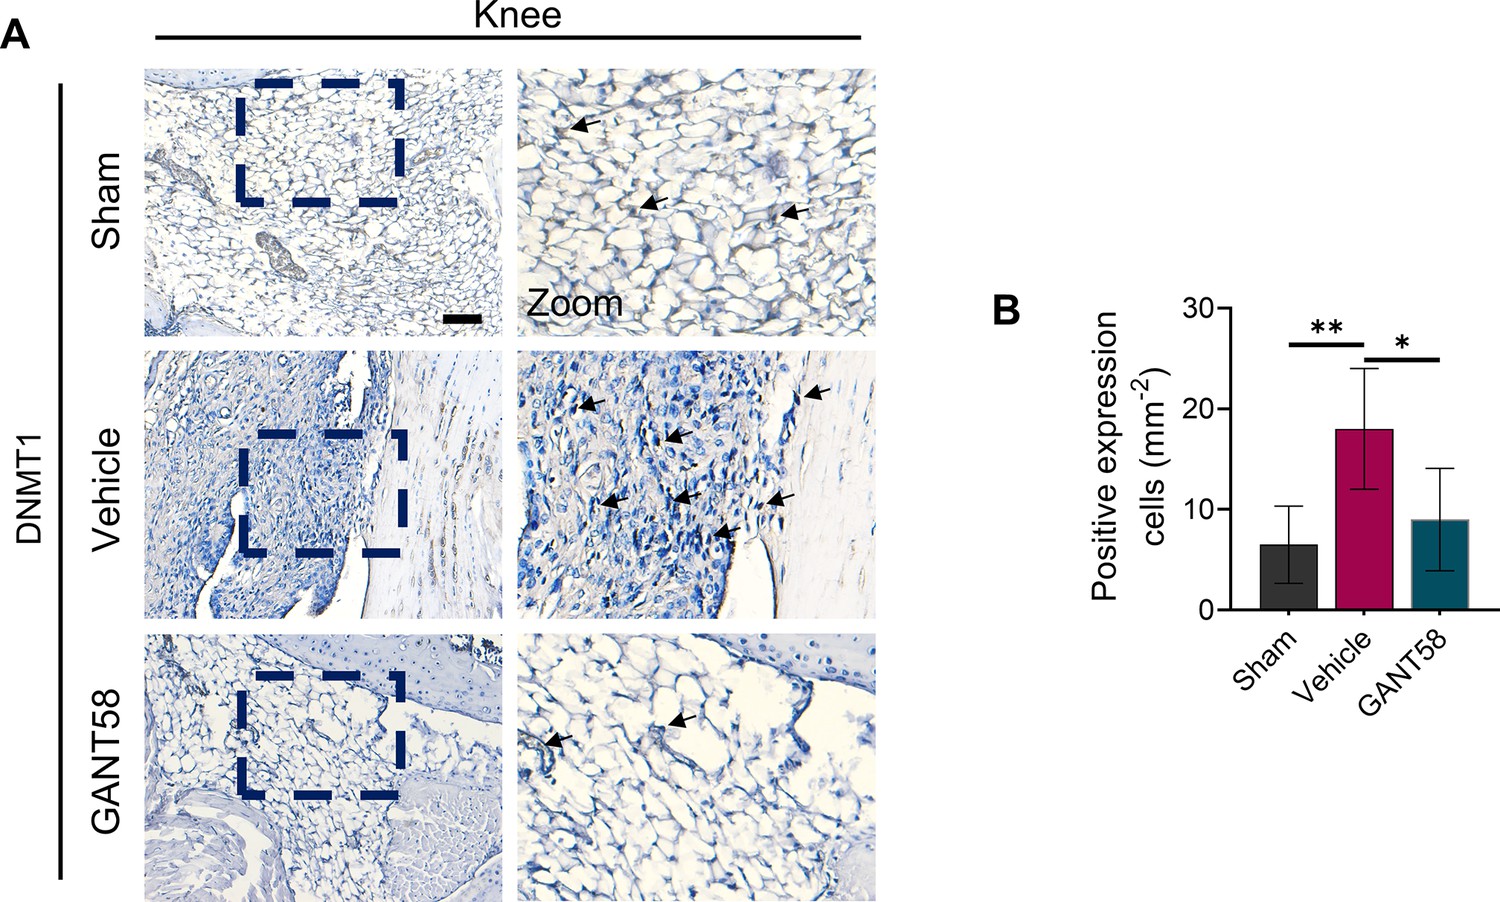
GANT58 decreased the expressions of DNMT1 in CIA mice.
Figure 5—figure supplement 2
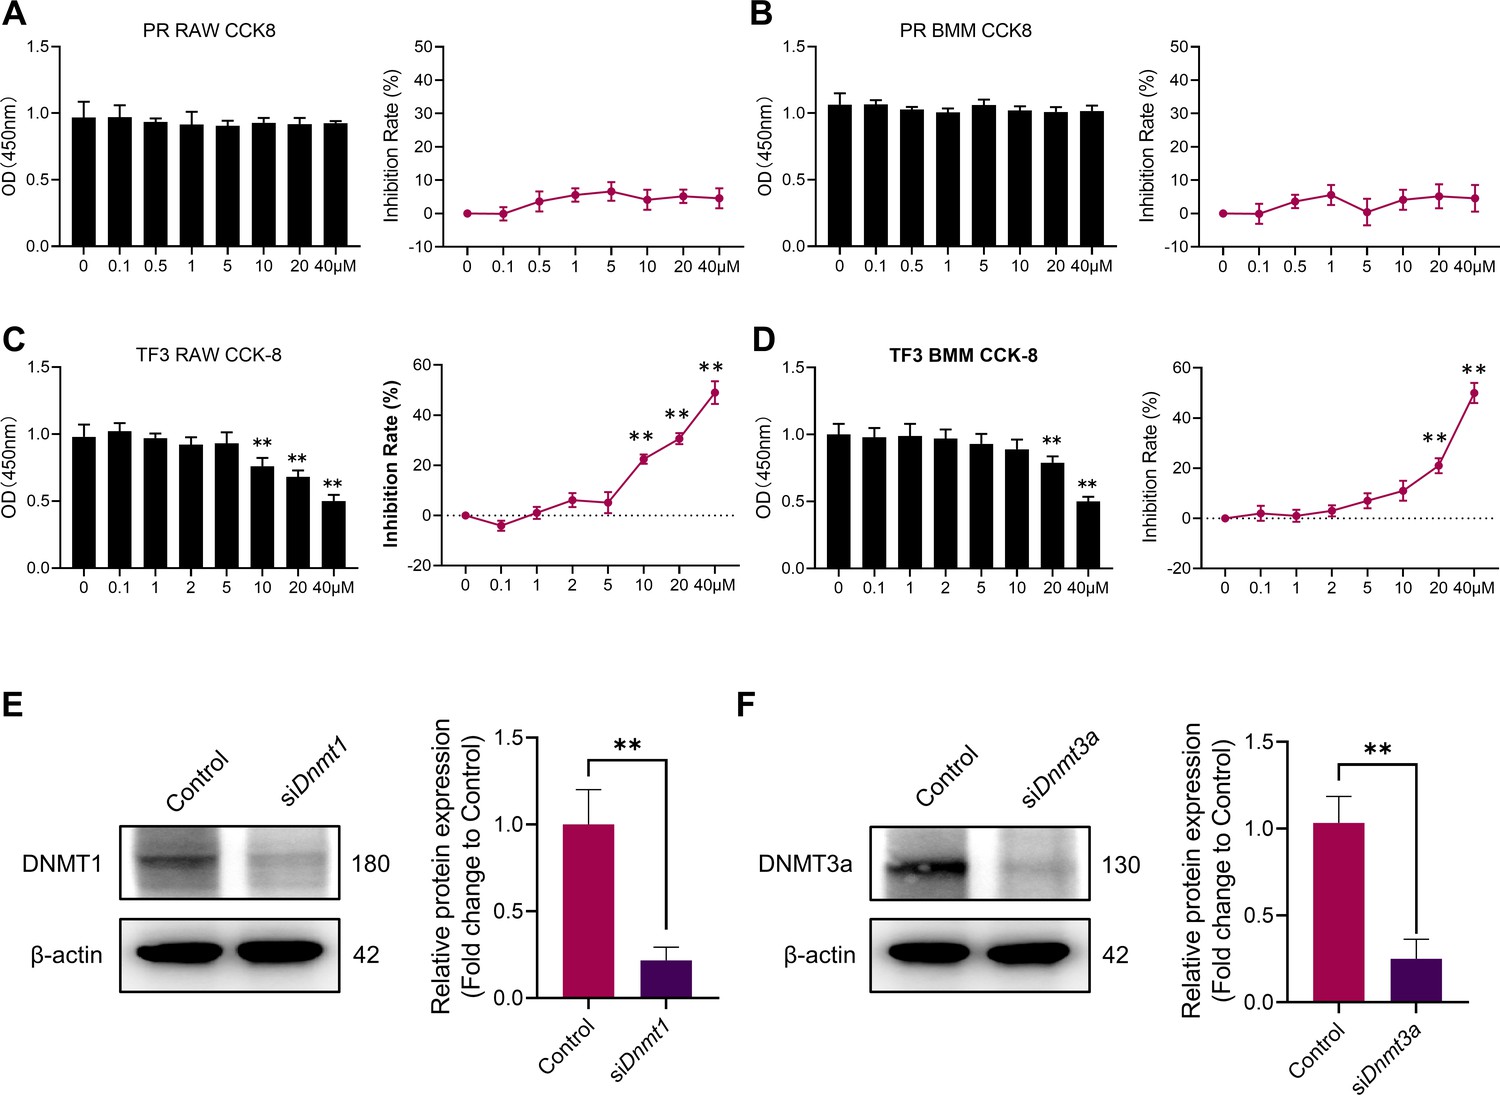
Cytotoxicity detection of procainamide and TF3.
-
Figure 5—figure supplement 2—source data 1
Uncropped western blot images for Figure 5—figure supplement 2.
- https://cdn.elifesciences.org/articles/92142/elife-92142-fig5-figsupp2-data1-v2.pptx
Figure 5—figure supplement 3
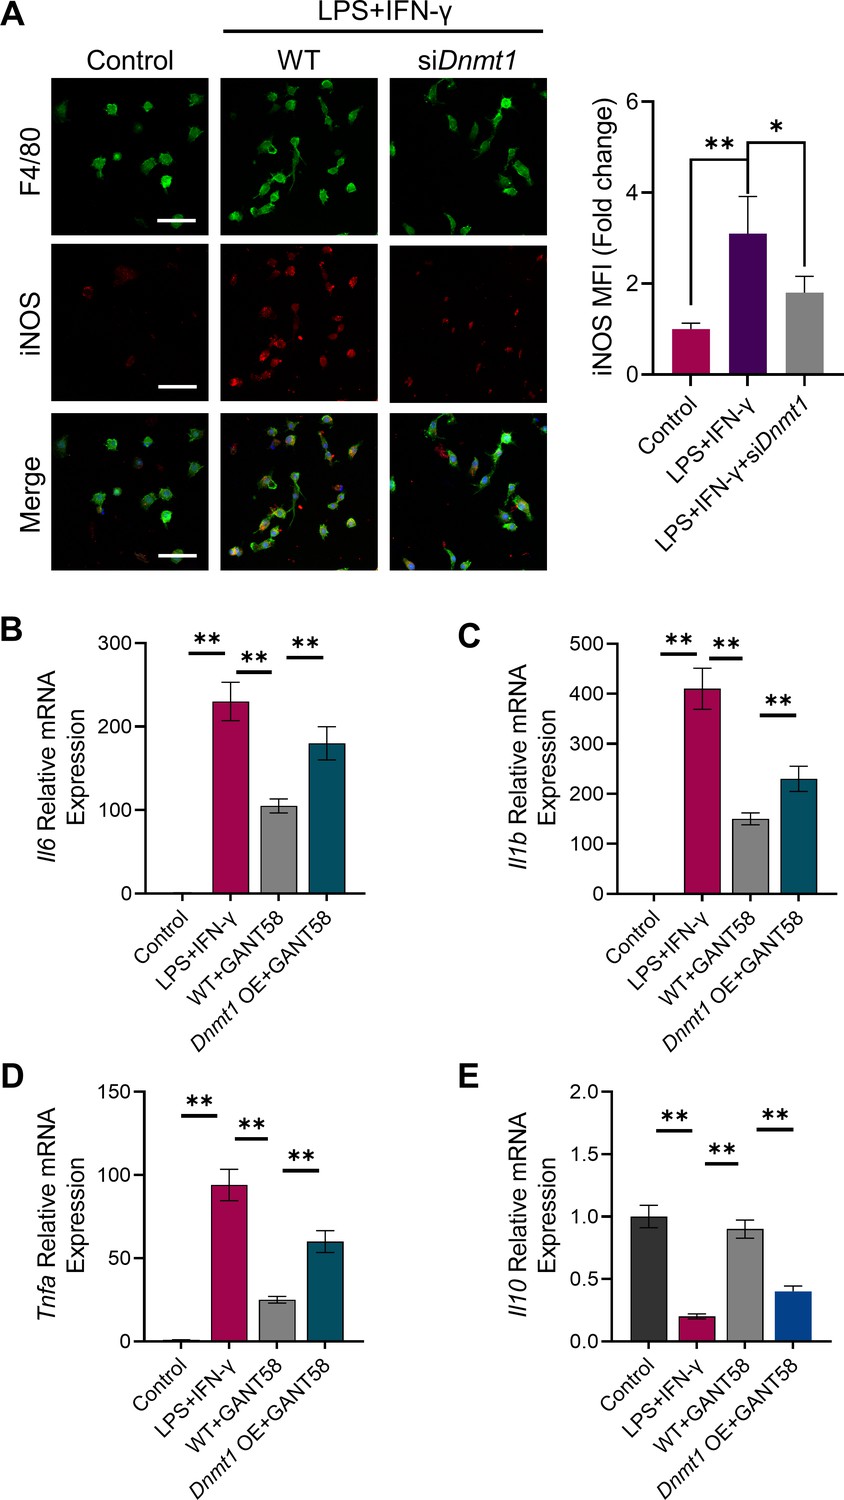
Overexpression of DNMT1 rescued the expression of pro-inflammatory cytokines in M1 macrophages treated by GANT58.
Figure 5—figure supplement 4
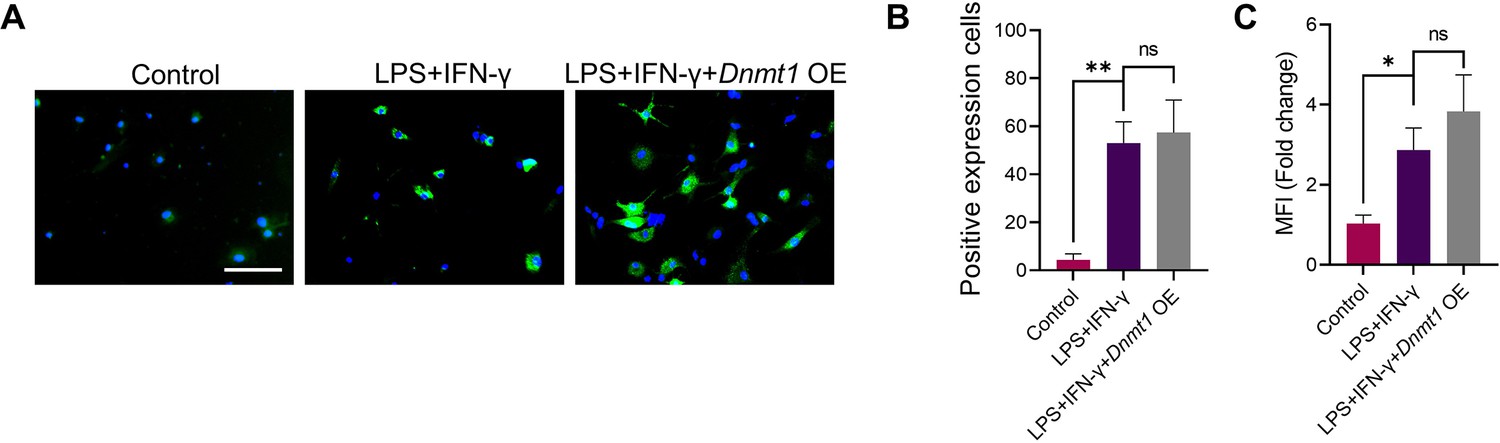
Effects of overexpression of DNMT1 on induction of M1 macrophages.
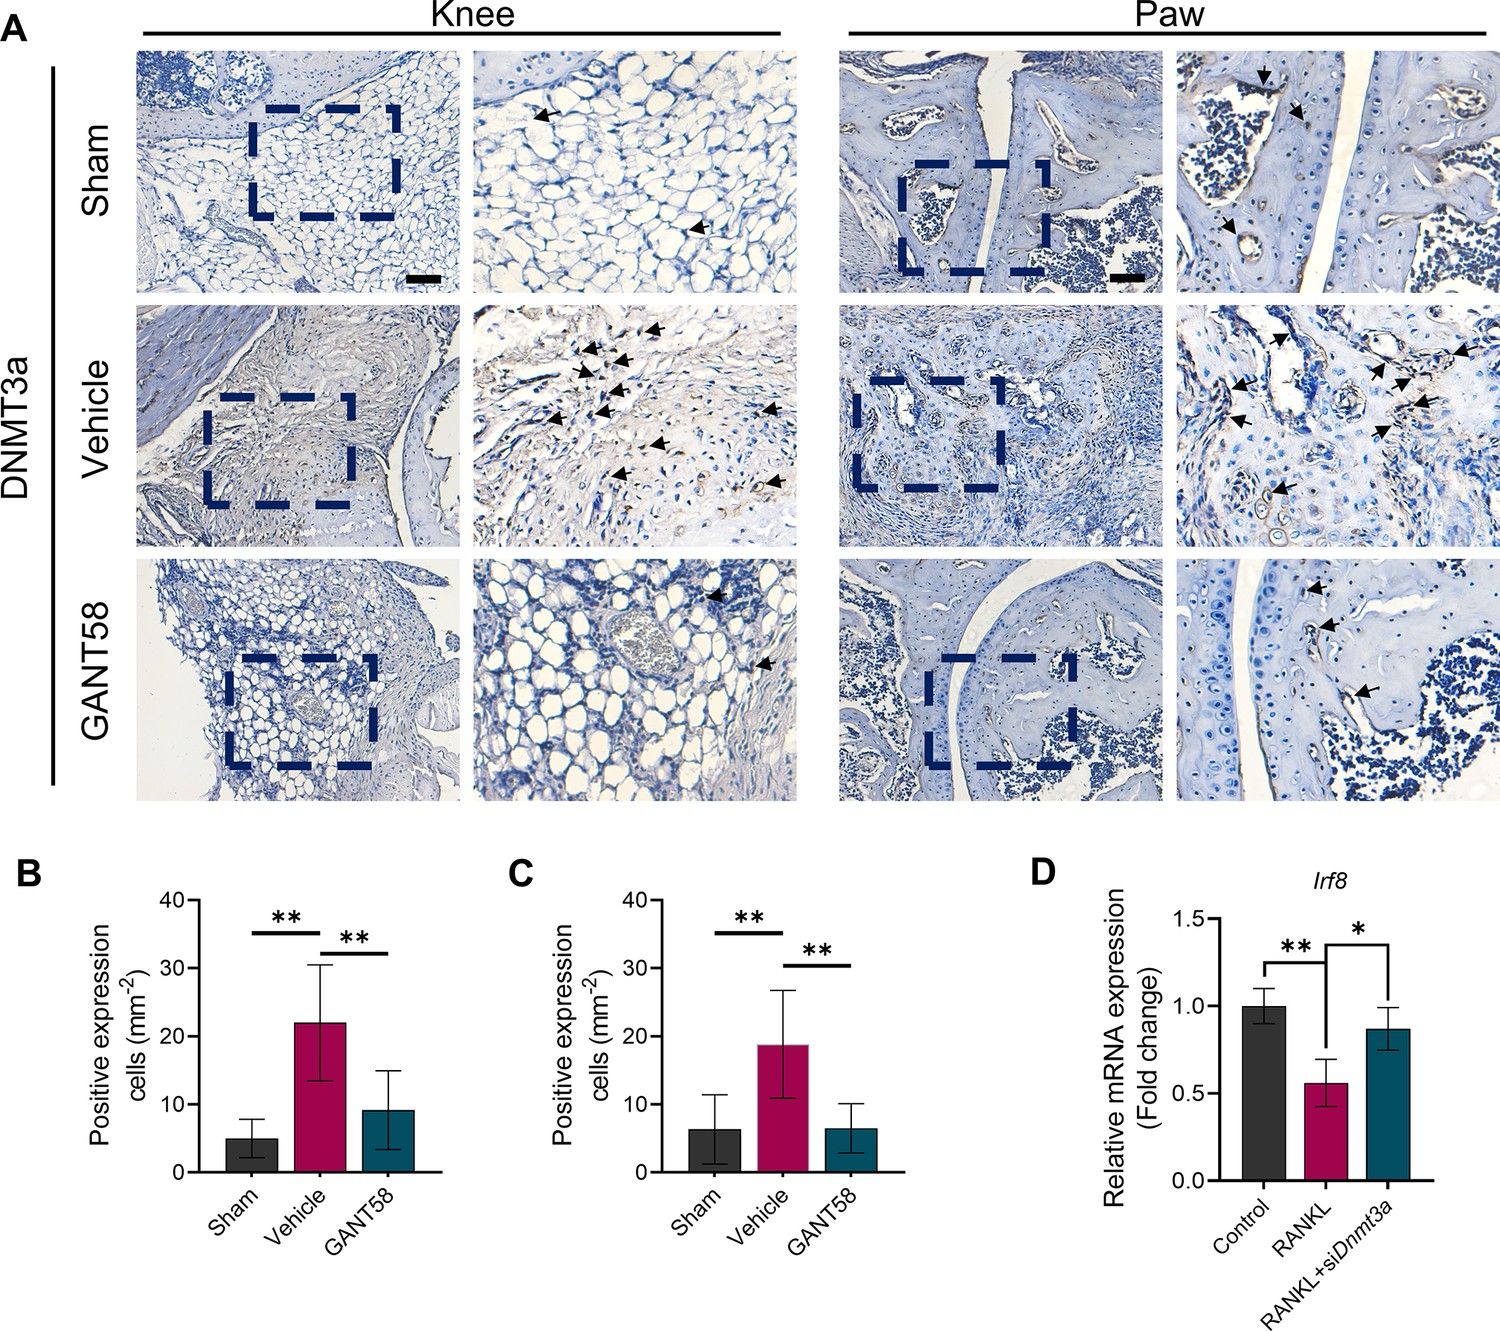
Figure 6 with 2 supplements
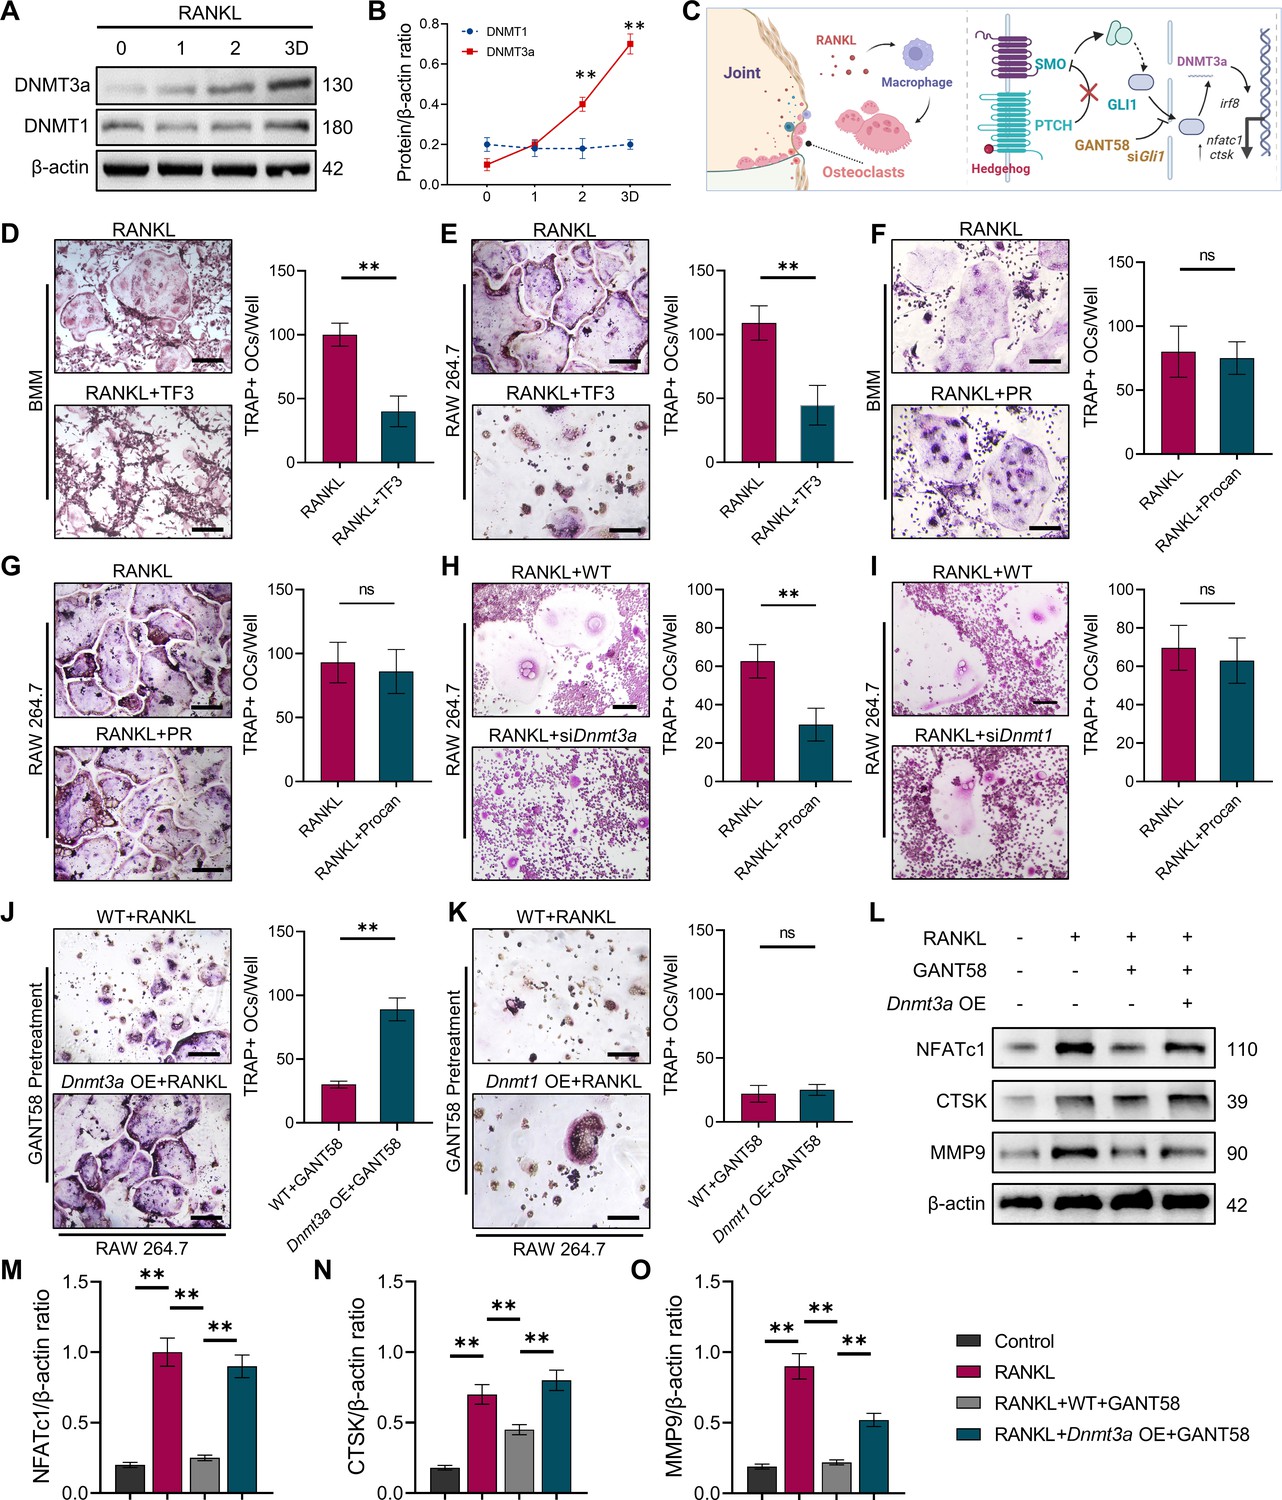
GLI1 regulates DNMT3a to affect the differentiation of osteoclasts.
(A) RAW264.7 cells were stimulated with RANKL for 3 days. Western blot analysis of DNMT3a and DNMT1 during the process of osteoclast induction and (B) grayscale value ratio to β-actin of western blot results. n=3. (C) Schematic diagram of the regulatory mechanism. (D, E) TRAP staining of BMMs and RAW264.7 cells stimulated by RANKL (50 ng/ml) in the presence or absence of TF3 (2 μM) and TRAP-positive osteoclast quantity per well. Scale bars = 25 μm. (F, G) TRAP staining of BMMs and RAW264.7 cells stimulated by RANKL (50 ng/ml) in the presence or absence of procainamide (PR, 10 μM) and TRAP-positive osteoclast quantity per well. Scale bars = 25 μm. (H) WT and siDnmt3a treated RAW264.7 cells were stimulated by RANKL. TRAP staining and TRAP-positive cell quantity per well. Scale bars = 25 μm. (I) WT and siDnmt1 treated RAW264.7 cells were stimulated by RANKL. TRAP staining and TRAP-positive cell quantity per well. Scale bars = 25 μm. (J) WT and Dnmt3a OE RAW264.7 cells were stimulated by RANKL in the presence of GANT58 intervention. TRAP staining and TRAP-positive cell quantity per well. Scale bars = 25 μm. (K) WT and Dnmt1 OE RAW264.7 cells were stimulated by RANKL in the presence of GANT58. TRAP staining and TRAP-positive cell quantity per well. Scale bars = 25 μm. Statistical analysis was performed using Student’s t test. (L) Western blot results of NFATc1, CTSK and MMP9 protein expression. (M–O) Grayscale value ratio to β-actin of western blot results. n=3. Statistical analysis was performed using one-way ANOVA test. Data shown represent the mean ± SD. *p<0.05, **p<0.01, ns = not significant.
-
Figure 6—source data 1
Uncropped western blot images for Figure 6.
- https://cdn.elifesciences.org/articles/92142/elife-92142-fig6-data1-v2.pptx
Figure 6—figure supplement 1
GANT58 decreased the expressions of DNMT3a in CIA mice.
Figure 6—figure supplement 2
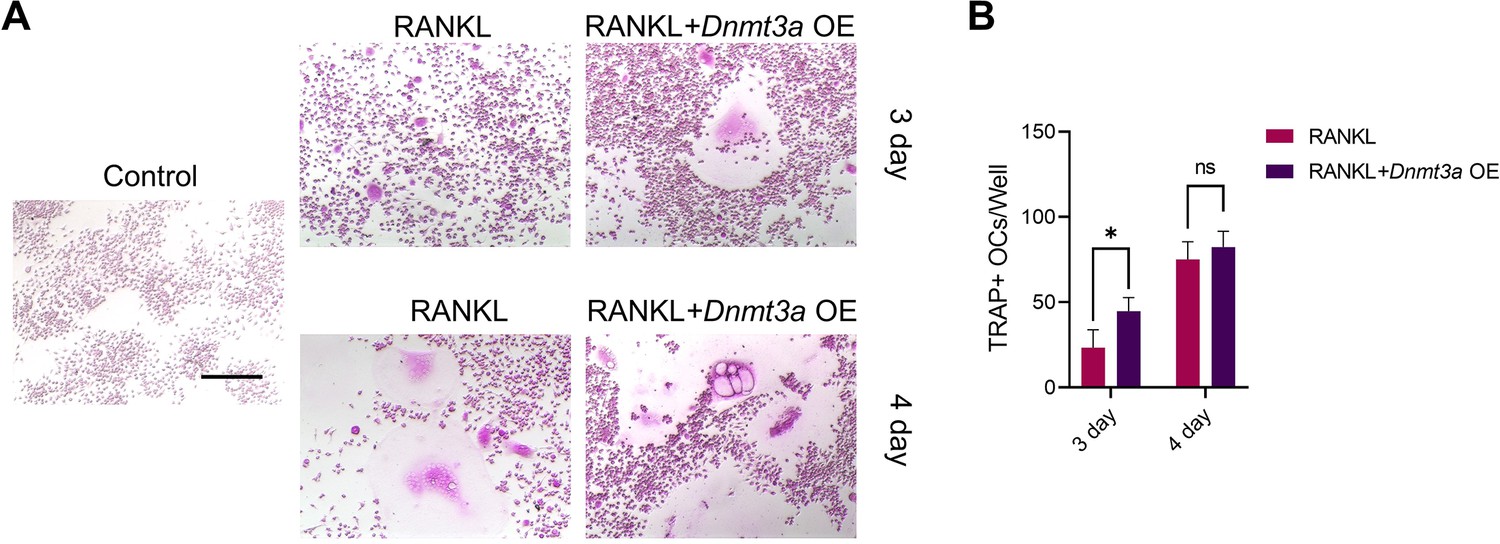
Effects of overexpression of DNMT3a on induction of osteoclasts.
Author response image 1
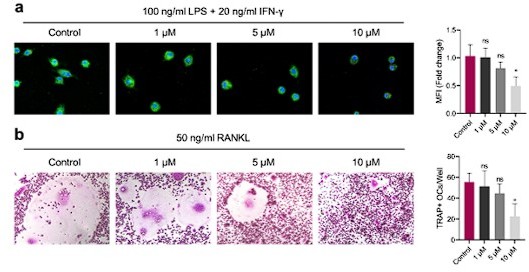
(a) M1 macrophages were induced for 24 h with intervention of different concentrations of GANT58.
Immunofluorescence staining of iNOS. (b) Osteoclast were induced for 4 days with intervention of different concentrations of GANT58. TRAP staining images and TRAP positive osteoclast number quantification results. Data shown represent the mean ± SD. *p < 0.05, ns = no significance.
Author response image 2
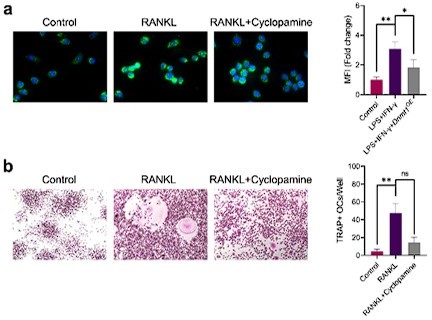
(a) Immunofluorescence staining of iNOS in RAW264.
7 cells during the stimulation by LPS/IFN-γ with or without 10 μM cyclopamine intervention and mean fluorescence intensity of the iNOS immunofluorescence. (b) TRAP staining of RAW264.7 cells after induction by RANKL with or without 10 μM cyclopamine intervention and TRAP positive stained osteoclasts quantification. Data shown represent the mean ± SD. Statistical analysis was performed using one-way ANOVA test. *p < 0.05, **p < 0.01, ns = no significance.
Additional files
-
Supplementary file 1
siRNA target sequences.
- https://cdn.elifesciences.org/articles/92142/elife-92142-supp1-v2.docx
-
Supplementary file 2
Predictive analysis of protein binding.
- https://cdn.elifesciences.org/articles/92142/elife-92142-supp2-v2.docx
-
Supplementary file 3
RT-qPCR primer sequences.
- https://cdn.elifesciences.org/articles/92142/elife-92142-supp3-v2.docx
-
MDAR checklist
- https://cdn.elifesciences.org/articles/92142/elife-92142-mdarchecklist1-v2.pdf
Download links
A two-part list of links to download the article, or parts of the article, in various formats.
Downloads (link to download the article as PDF)
Open citations (links to open the citations from this article in various online reference manager services)
Cite this article (links to download the citations from this article in formats compatible with various reference manager tools)
GLI1 facilitates collagen-induced arthritis in mice by collaborative regulation of DNA methyltransferases
eLife 12:e92142.
https://doi.org/10.7554/eLife.92142


