DNL343 is an investigational CNS penetrant eukaryotic initiation factor 2B activator that prevents and reverses the effects of neurodegeneration caused by the integrated stress response
- Denali Therapeutics, United States
Figures
Figure 1
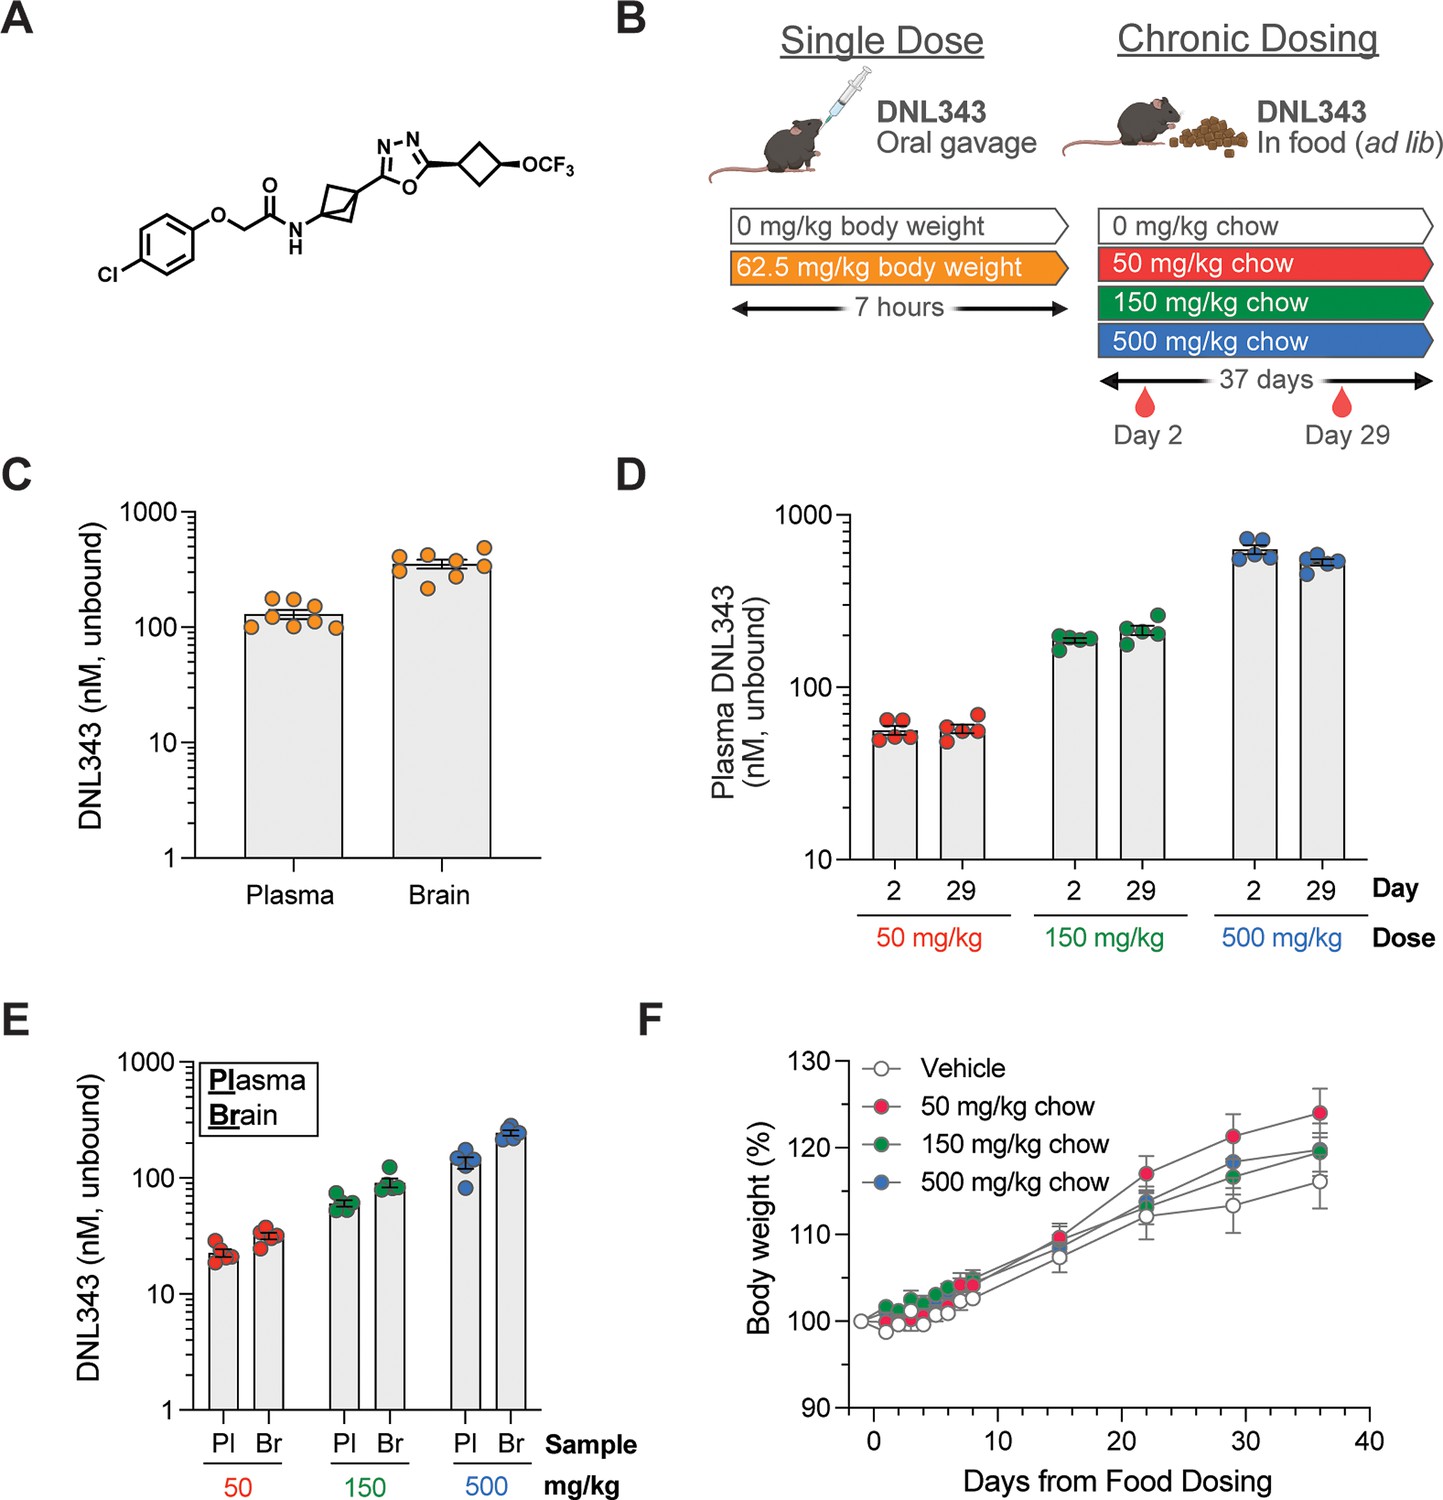
DNL343 is CNS penetrant and suitable for acute and chronic in vivo dosing.
(A) Chemical structure of DNL343. (B) Schematic of DNL343 dosing studies in wild-type mice. Left: DNL343 (62.5 mg/kg) was administered via oral gavage and mice were taken down 7 hr after. Right: DNL343 was formulated in food at a concentration of 0, 50, 150, or 500 mg/kg chow. Plasma was sampled on days 2 and 29 of dosing at 1 hr after lights on (zeitgeber, ZT1) and animals were taken down on day 37 at ZT6. (C) DNL343 unbound concentration in the plasma and brain at 7 hr after a single administration of DNL343 at 62.5 mg/kg. (D) DNL343 unbound concentration in the plasma after 2 and 29 days of in-food dosing. (E) DNL343 unbound concentration in the plasma and brain after 37 days of in-food dosing. (F) Body weight of mice maintained on DNL343-formulated diet. Data are presented as mean ± SEM of N=8/group (C) or N=5/group (D–F).
Figure 2 with 1 supplement
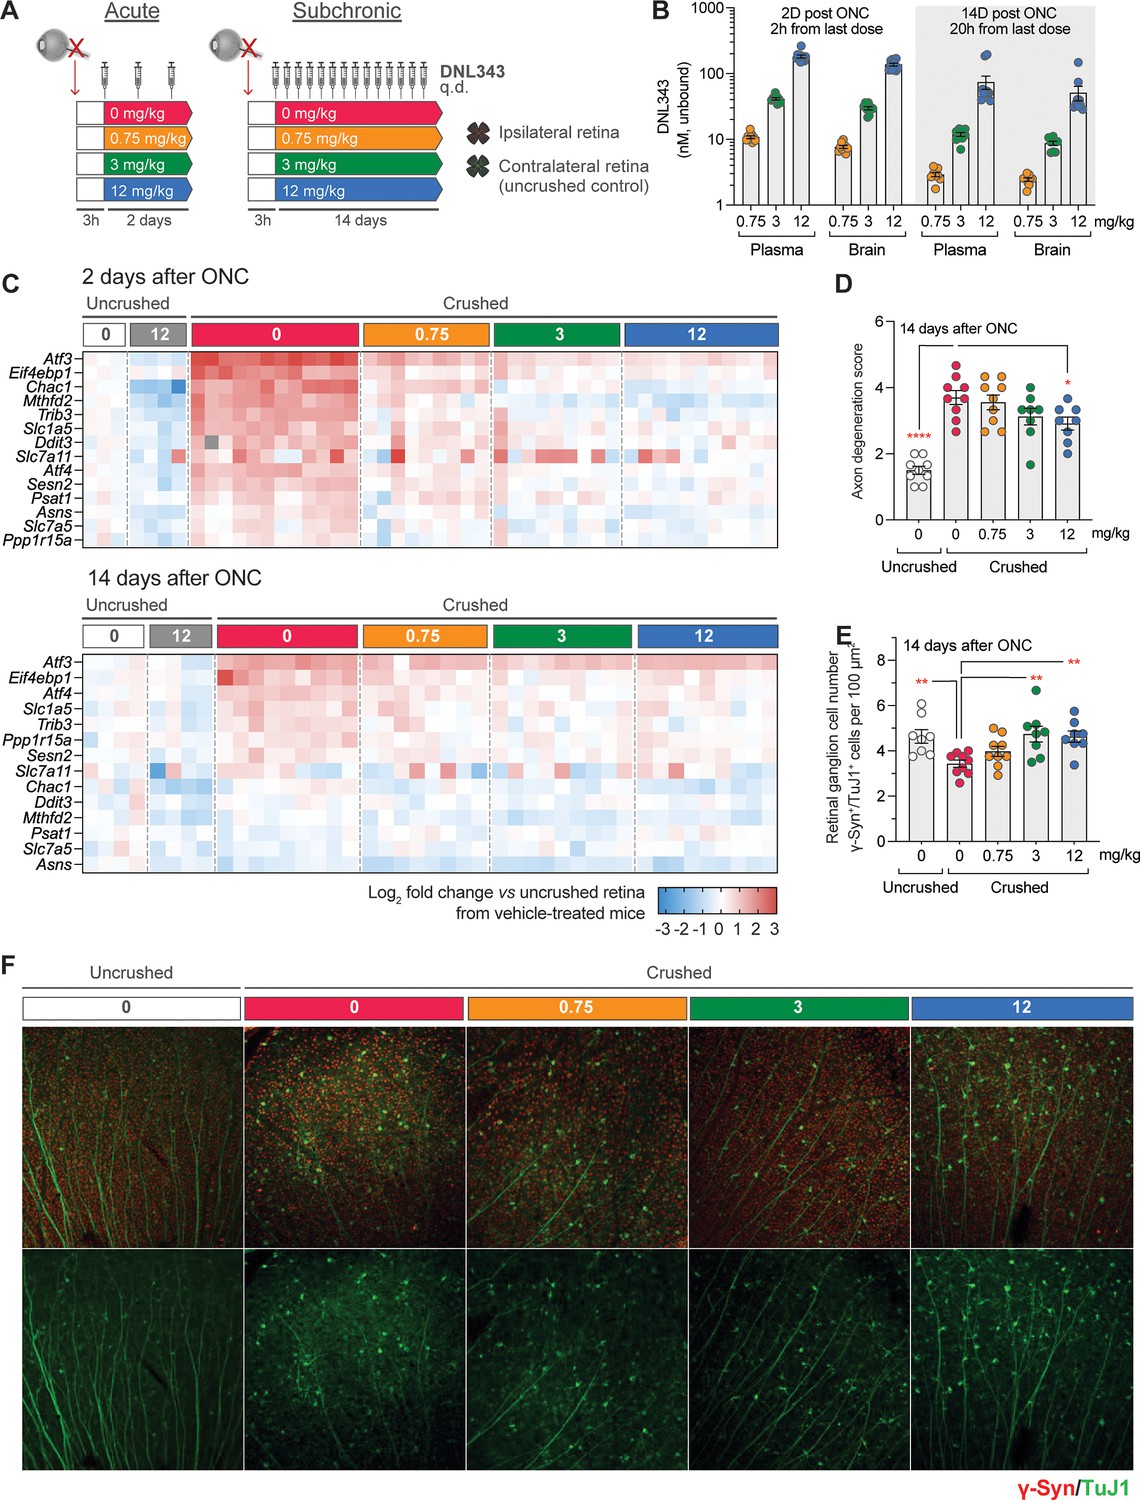
DNL343 engages the integrated stress response (ISR) and is neuroprotective in an acute ISR-driven neurodegeneration model, the optic nerve crush (ONC).
(A) Schematic of the DNL343 dosing study in the ONC model. Wild-type mice underwent ONC procedure and received once daily DNL343 administrations via oral gavage 3 hr later. Animals were taken down at 2 or 14 days after the ONC procedure and retinas, ipsi- and contralateral to the crushed site, were collected. (B) DNL343 unbound concentration in the plasma and brain. (C) Heatmap showing expression level of ISR mRNA markers as assessed by multiplex qPCR in the retina, ipsilateral to the crush at 2 and 14 days after ONC, relative to control retinas from the uncrushed side. See Supplementary files 1 and 2 for statistical data. (D–E) DNL343 reduced axonal degeneration score and retinal ganglion cell loss. (F) Representative immunofluorescent images of retinal ganglion cells as identified by TUJ1 (green) and γ-synuclein (red) immunoreactivity. Data are presented as mean ± SEM of N=8–12/group. Statistical significance for DNL343 effect was set at p<0.05 as determined by a one-way ANOVA followed by Dunnett’s multiple comparison tests against crushed retina from vehicle-treated animals (*, p<0.05. **, p<0.01, ***, p<0.001, ****, p<0.0001).
Figure 2—figure supplement 1
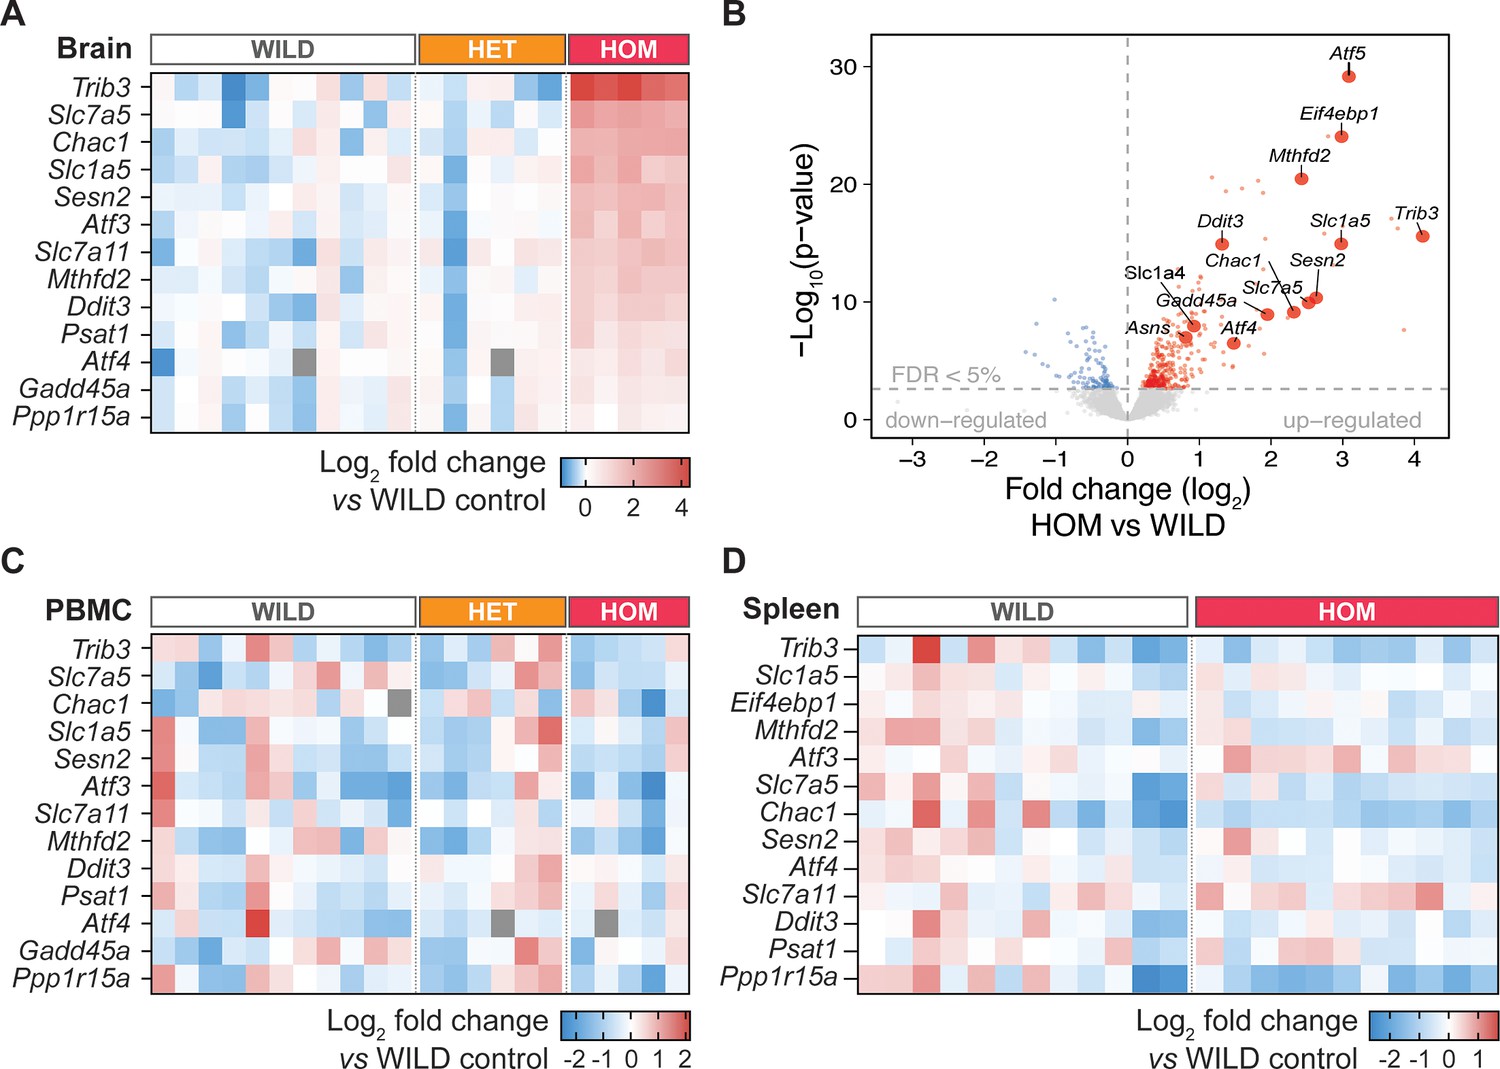
The integrated stress response (ISR) is activated in the brain of the eukaryotic initiation factor 2B (eIF2B) homozygous (HOM) mice.
(A) Heatmap visualization of ISR mRNA markers as assessed by multiplex qPCR in the brains of mice that are wild-type (WILD), heterozygous (HET), or HOM for the Eif2b5 R191H knock-in mutation. (B) Volcano plot showing the comparisons of eIF2B HOM to wild-type bulk brain samples (N=9–12/group, respectively) by RNA sequencing. Blue and red circles denote significantly up- or downregulated genes (FDR<5%), larger labeled points correspond to known activating transcription factor 4 (ATF4) target genes. (C–D) Heatmap visualization of select ISR transcript markers as assessed by multiplex qPCR in the peripheral blood mononuclear cell (PBMC) and spleen. Animals were 13–19 weeks of age. See Supplementary files 3–5 for statistical data.
-
Figure 2—figure supplement 1—source data 1
Data associated with Figure 2—figure supplement 1B.
- https://cdn.elifesciences.org/articles/92173/elife-92173-fig2-figsupp1-data1-v2.xlsx
Figure 3
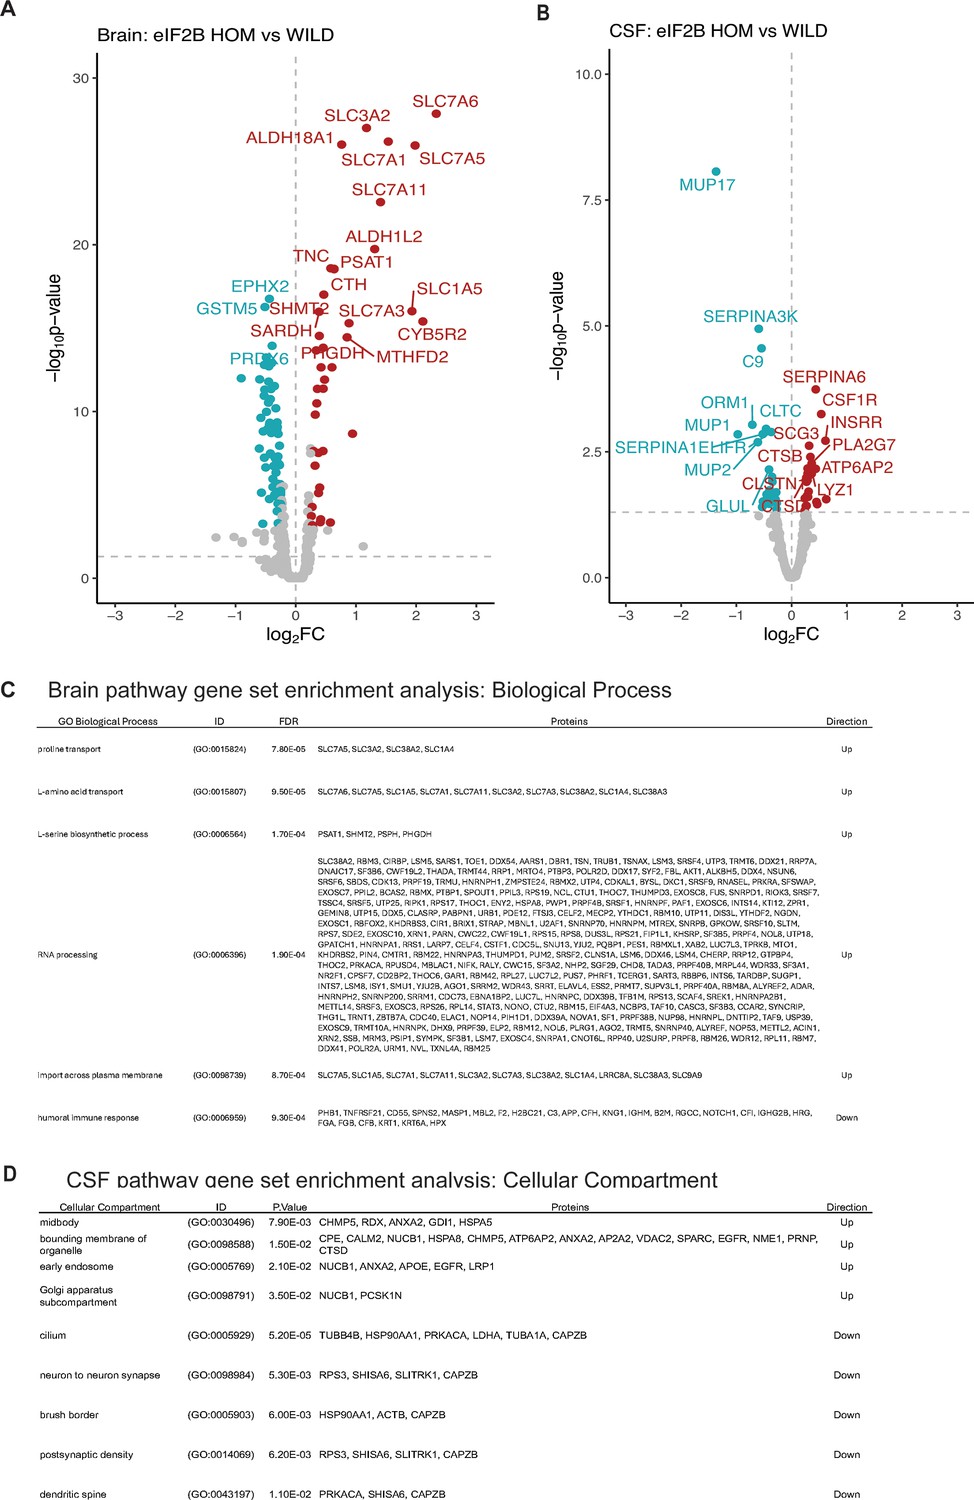
Bulk brain and CSF proteomics reveal distinct signatures of CNS integrated stress response (ISR) activation and neurodegeneration in the eukaryotic initiation factor 2B (eIF2B) homozygous (HOM) mice.
(A) Volcano plot showing protein expression changes in the brain of 11- to 15-week-old eIF2B HOM mice relative to wild-type control with absolute log2 fold change (FC)>0.5 and p<0.00005. Blue and red circles denote either down- or upregulated proteins, respectively. Larger symbols denote top 20 altered proteins. In this analysis, 7939 proteins were detected. (B) Volcano plot showing protein expression changes in the CSF of 11- to 15-week-old eIF2B HOM mice relative to wild-type. Blue and red circles denote either down- or upregulated proteins, respectively. Top 20 significantly dysregulated proteins are labeled. 572 proteins were detected in this analysis. (C) Gene set enrichment analysis (GSEA) was performed to identify and detect specific GO biological processes that were altered in eIF2B HOM vs wild-type control in the brain. False discovery rate (FDR) shows adjusted p-value calculated based on Benjamini-Yekutieli (BY) procedure. (D) Enriched cellular compartment associated with dysregulated CSF proteome in eIF2B HOM mice. Unadjusted p-values are shown. Statistical significance for univariate analysis was set at p<0.05 as determined by robust linear model using the limma r package. N=7/group. For detailed statistical data from (A) and (B), see Figure 3—source data 1.
-
Figure 3—source data 1
Data relating to Figure 3A and B.
- https://cdn.elifesciences.org/articles/92173/elife-92173-fig3-data1-v2.xlsx
Figure 4 with 2 supplements
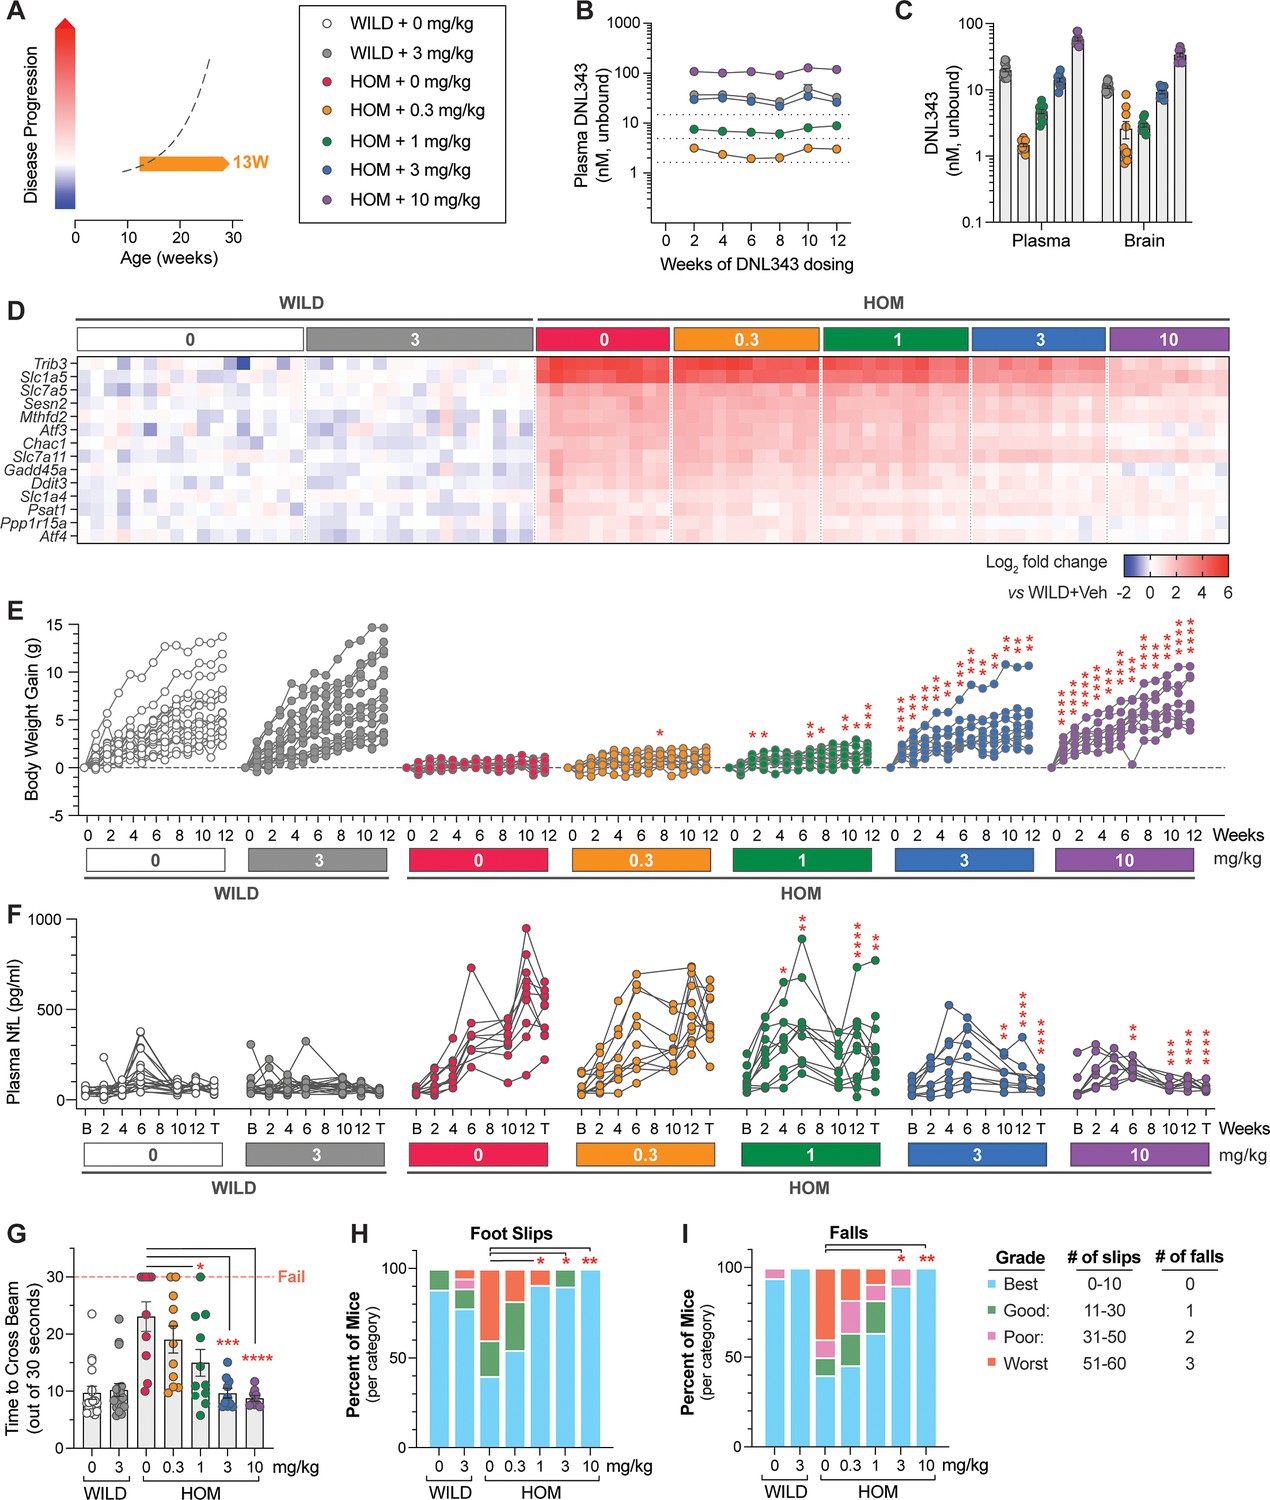
Chronic DNL343 dosing inhibits integrated stress response (ISR) overactivation in the brain, restores normal body weight, and prevents functional decline and neurodegeneration in the eukaryotic initiation factor 2B (eIF2B) mouse.
(A) Schematic of the prophylactic DNL343 dosing study in the eIF2B homozygous (HOM) mouse model. DNL343 treatment was initiated in pre-symptomatic animals at 10–17 weeks of age. Mice self-administered DNL343-formulated rodent chow to achieve levels equivalent to oral gavage doses of 0, 0.3, 1, 3, or 10 mg/kg. (B) Plasma DNL343 exposure measured biweekly from weeks 2 to 12 of dosing. (C) Terminal plasma and brain DNL343 exposure after 13 weeks of dosing. (D) Heatmap visualization of select brain ISR transcript markers measured by multiplex qPCR in vehicle- and DNL343-treated wild-type and eIF2B HOM mice relative to vehicle-treated wild-type controls. See Supplementary file 6 for statistical data. (E) Body weight gain measured weekly. (F) Plasma NfL levels assessed at baseline and throughout the study duration. B and T indicate baseline and terminal timepoints, respectively. (G) The balance beam test was performed after 12 weeks of dosing and the time to cross the beam out of 30 s were recorded. (H–I) The number of hindfoot slips and falls during the balance beam test. Data are presented as mean ± SEM of N=9–18 mice per group. Statistical significance for DNL343 effect was set at p<0.05 as determined by a mixed-effect analysis followed by Dunnett’s multiple comparison tests against vehicle-dosed animals of the same genotype at matching timepoints (E–F) or one-way ANOVA followed by Dunnett’s multiple comparison tests against vehicle-dosed animals of the same genotype (G–I). (*, p<0.05. **, p<0.01, ***, p<0.001, ****, p<0.0001).
Figure 4—figure supplement 1
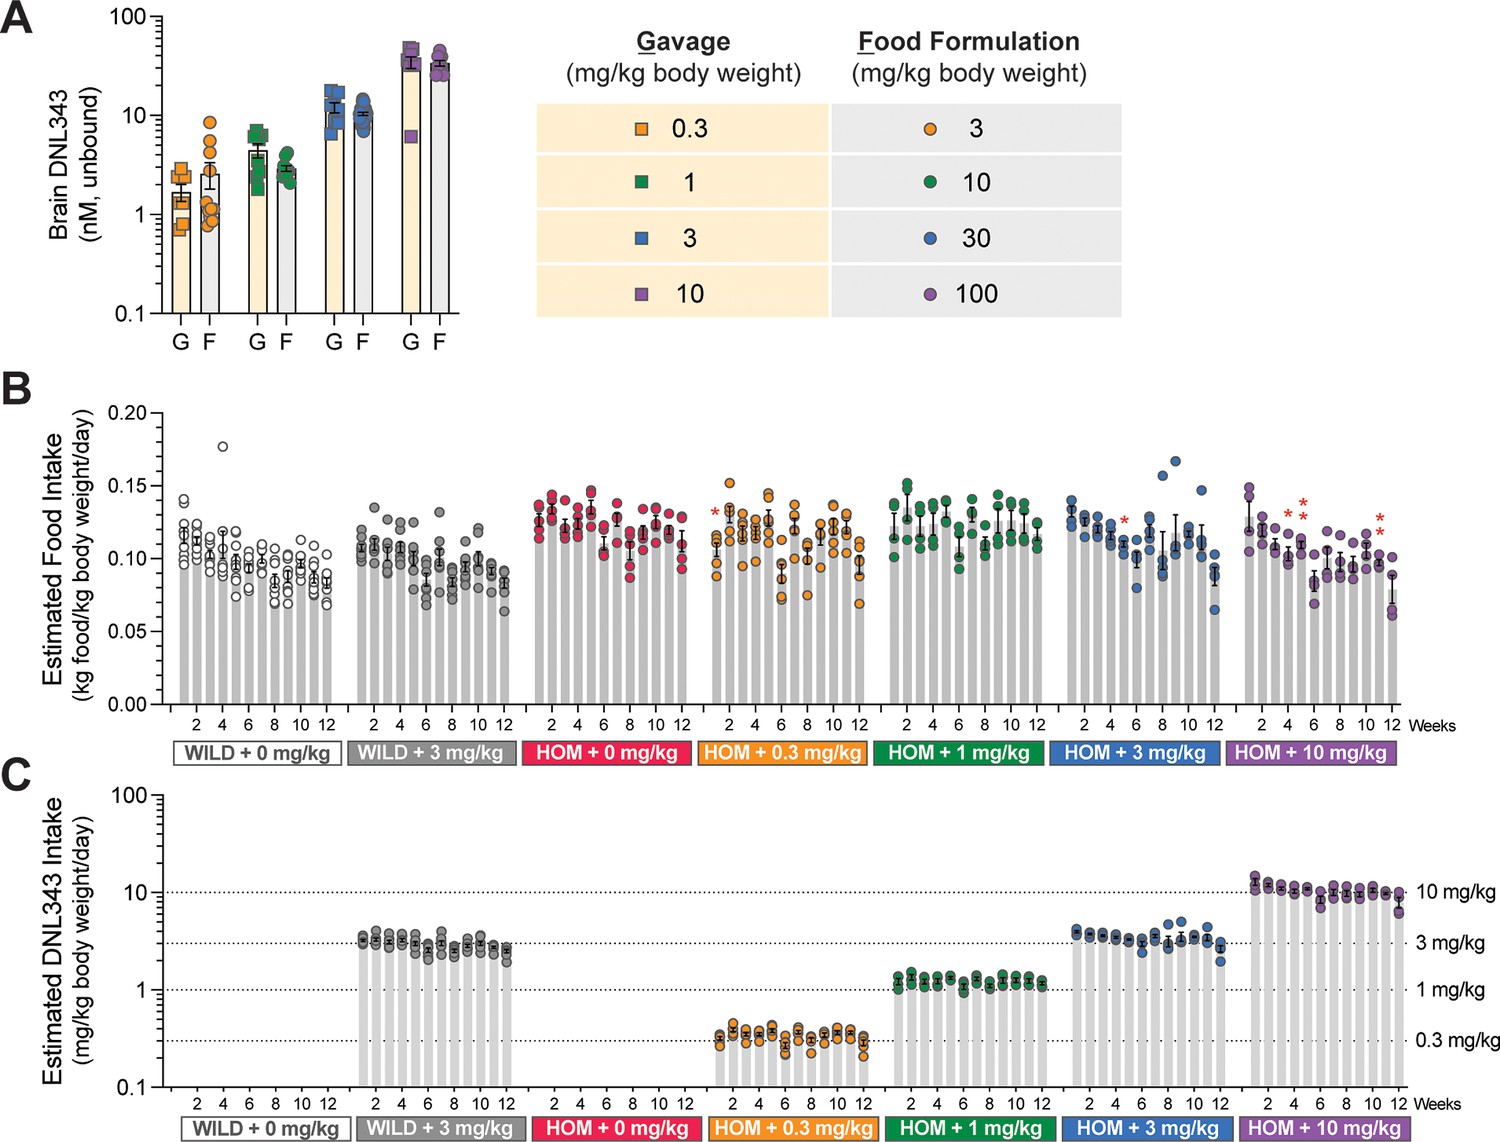
DNL343-formulated food is well tolerated in both wild-type and homozygous mutant mice and targeted DNL343 are achieved.
(A) Brain DNL343 exposures following consumption of food formulated with DNL343 at 3, 10, 30, and 100 mg/kg chow were equivalent to those following single oral gavage at 0.3, 1, 3, and 10 mg/kg body weight. (B) Food intake estimated based on the difference in hopper weight and adjusted for body weight. Statistical significance was set at p<0.05 as determined by a mixed-effect analysis followed by Dunnett’s multiple comparison tests against vehicle-dosed animals of the same genotype at matching timepoints (*, p<0.05. **, p<0.01). (C) DNL343 intake was calculated based on estimated food intake and DNL343 concentration in the food. Data are presented as mean ± SEM of N=8–18 mice per group.
Figure 4—figure supplement 2
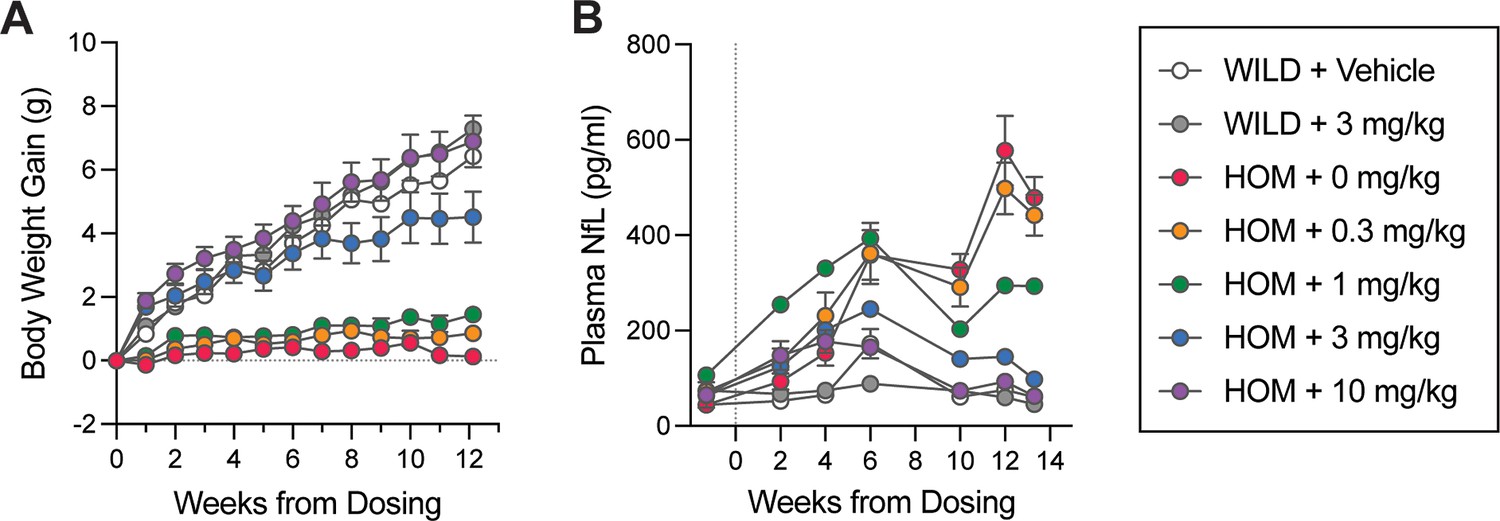
Alternative visualization of the effect of chronic DNL343 dosing on body weight and plasma NfL.
(A) Body weight gain was assessed weekly from study initiation. (B) Plasma NfL levels were assessed at baseline (9 days prior to dosing initiation) and throughout the study duration. Data are presented as mean ± SEM of N=9–18 mice per group.
Figure 5 with 1 supplement
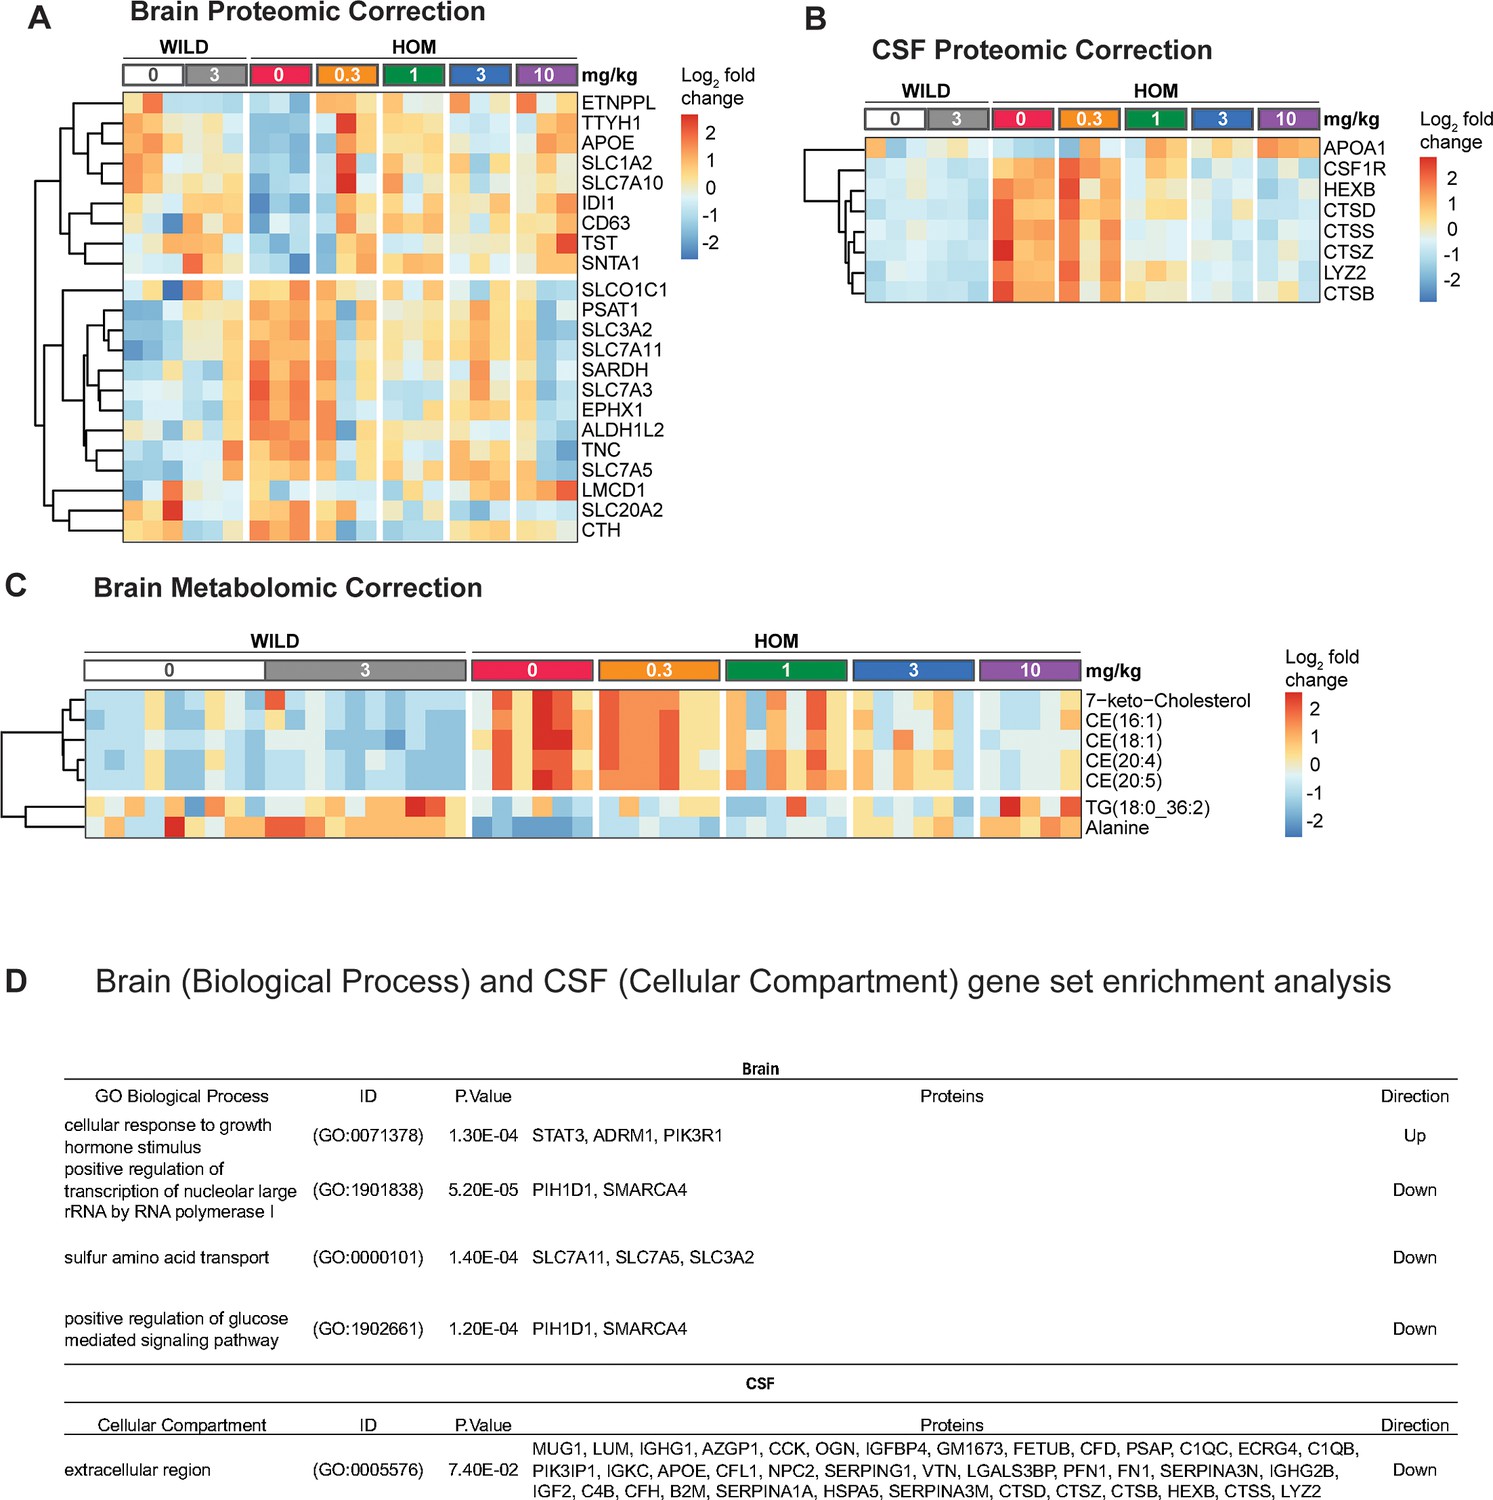
DNL343 dose-dependently normalized bulk brain and CSF protein and brain metabolite changes associated with integrated stress response (ISR) activation in the eukaryotic initiation factor 2B (eIF2B) homozygous (HOM) mouse.
(A) Heatmap visualization of differential expression of proteins in eIF2B HOM mice vs wild-type controls following treatment with vehicle or DNL343 for 13 weeks (N=3/group). Wild-type mice received vehicle or DNL343 at the 3 mg/kg dose level. Features with significant (p<0.05) dose responses were selected and clustered based on Euclidean distances. Results show two main clusters of responsive protein that were up- (top) or downregulated (bottom) in a dose-dependent manner. (B) CSF proteomic shifts in the same mice shown in panel A are shown. Results show that significant elevation in abundance of CSF markers of microglial activation was decreased with DNL343 treatment at dose higher than 3 mg/kg body weight for 2 weeks. (C) Heatmap visualization of metabolomic changes in the bulk brain of eIF2B HOM relative to wild-type mice. Statistical significance was set at p<0.05 as determined by robust linear model. N=5–10/group. (D) Proteins detected in the brain and in CSF were ranked by logFC and the directionality of enrichment for specific biological processes in the brain and cellular compartment of origin of dysregulated CSF proteins. p-Values denote unadjusted p-values estimated from gene set enrichment analysis (GSEA). Protein column denotes detected pathway proteins corresponding to processes and compartment indicated. For detailed statistical data from (A–C), see Figure 5—source data 1.
-
Figure 5—source data 1
Data relating to Figure 5.
- https://cdn.elifesciences.org/articles/92173/elife-92173-fig5-data1-v2.xlsx
Figure 5—figure supplement 1
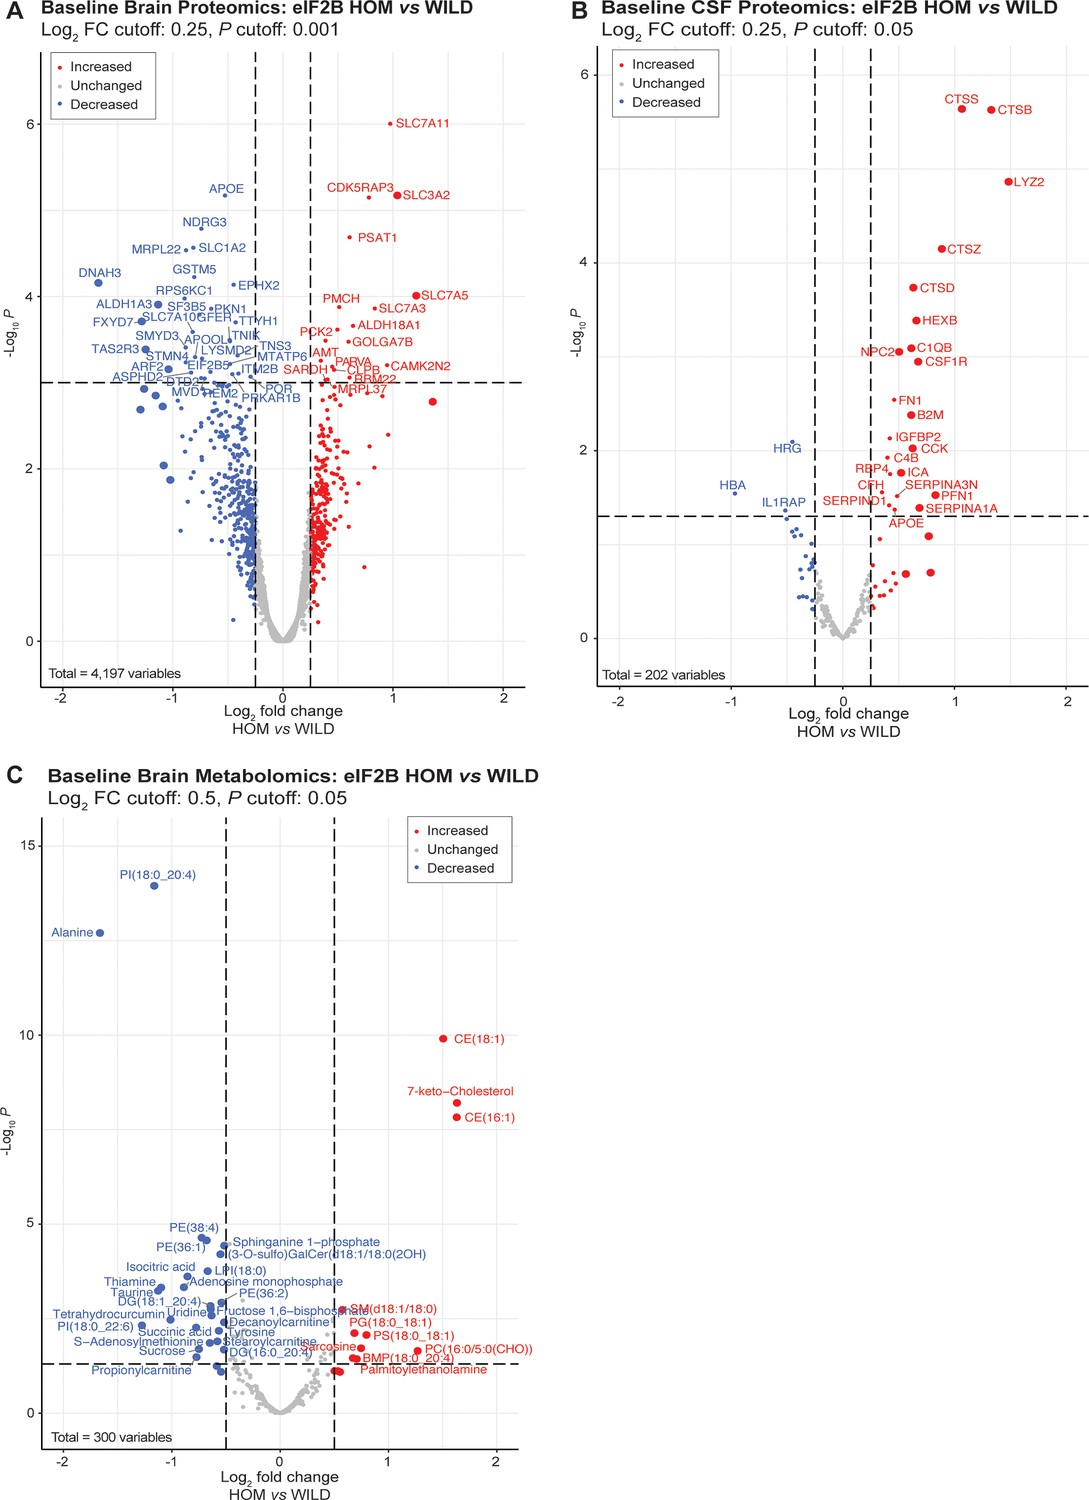
Confirmation of integrated stress response (ISR)-associated proteomics changes in bulk brain and CSF in a cohort of 5- to 7-month-old mice, establishing evidence for metabolomic perturbations in the eukaryotic initiation factor 2B (eIF2B) homozygous (HOM) mice relative to the wild-type controls.
(A) Volcano visualization of altered proteins in eIF2B HOM as compared to wild-type mice (N=3 per genotype). A total of 4197 proteins were quantified. Variables with absolute log2 FC≥0.25 and p<0.05 are labeled. Proteins with larger symbols have log2 FC≥0.5. Significant increases in solute carrier (SLC)-mediated transmembrane transport proteins, serine metabolism, and decreases in lipid metabolism proteins that were shown in Figure 3 were also seen in this independent cohort. (B) Corresponding proteomic changes in CSF proteome are shown. Proteins with absolute log2 expression change >0.25 and p<0.05 are denoted in boxed labels. A total of 202 proteins were quantified and results show significant increases in abundance of protein biomarkers of brain microglial activation. (C) Metabolomic analysis of bulk brain associated with proteomic shifts shown in Panels A and B. Metabolites or lipids with absolute log2 FC>0.5 and p<0.05 are labeled. As predicted by significant decreases in lipid metabolism proteins noted in the bulk brain of eIF2B HOM mice, levels of cholesterol esters and 7-keto-cholesterol (oxidized cholesterol) were highly elevated in the bulk brain. Despite increases in SLC-mediated transmembrane amino acid transporter expression, brain alanine, TCA cycle intermediates, and methyl-donor and thiamine metabolic cofactors were all lower in eIF2B HOM mice. Statistical significance was set at p<0.05 as determined by robust linear model. N=3/genotype.
Figure 6 with 2 supplements
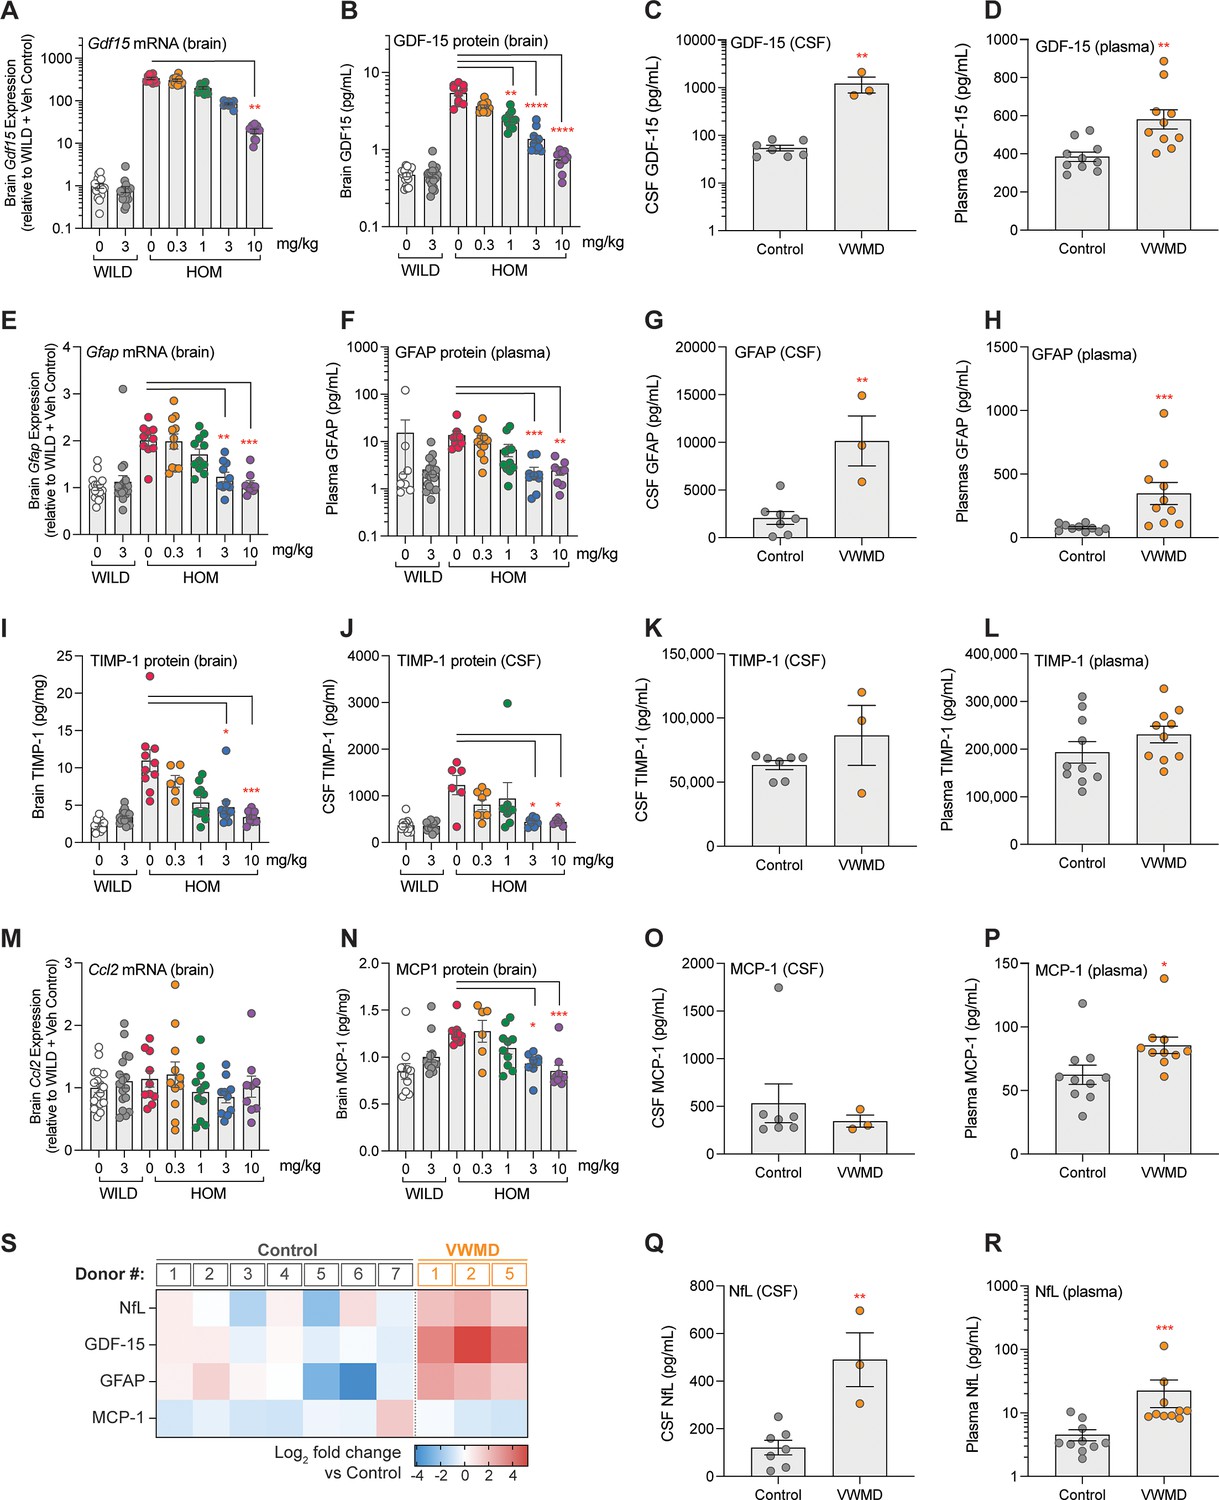
Exploratory biomarkers responsive to DNL343 in eukaryotic initiation factor 2B (eIF2B) mouse model and assessed in vanishing white matter disease (VWMD) in patient CSF and plasma.
(A–B) Expression of Gdf15 mRNA and GDF-15 protein in the brain of eIF2B homozygous (HOM) or wild-type mice treated with DNL343 or vehicle. (C–D) GDF-15 protein levels in the CSF and plasma of VWMD patients and healthy controls. (E–F) Expression of brain Gfap mRNA and plasma GFAP protein in eIF2B HOM or wild-type mice treated with DNL343 or vehicle. (G–H) GFAP protein levels in the CSF and plasma of VWMD patients and healthy controls. (I–J) TIMP-1 protein levels in the brain and CSF of eIF2B HOM or wild-type mice treated with DNL343 or vehicle. (K–L) TIMP-1 protein levels in the CSF and plasma of VWMD patients and healthy controls. (M–N) Expression of the Ccl2 transcript, which encodes the MCP-1 protein, and levels of MCP-1 protein in the brain of eIF2B HOM or wild-type mice treated with DNL343 or vehicle. (O–P) MCP-1 protein levels in the CSF and plasma of VWMD patients and healthy controls. (Q–R) NfL protein levels in the CSF and plasma of VWMD patients and healthy controls. (S) Heatmap visualization of relative changes in NfL, GDF-15, GFAP, and MCP-1 in the CSF of VWMD patients vs healthy controls, presented in log2 scale. VWMD patient ID#s correspond across Figure 6—figure supplement 2 (CSF) and Figure 6—figure supplement 2 (plasma). Statistical significance was set at p<0.05. For all animal model panels, DNL343 dose is indicated on the x-axis and data is presented as mean ± SEM of N=9–18 mice per group. Statistical significance for DNL343 effect in the mouse model was determined by a one-way ANOVA followed by Dunn’s multiple comparison tests against vehicle-dosed animals of the same genotype (*, p<0.05. **, p<0.01, ***, p<0.001, ****, p<0.0001). Data from VWMD patients and healthy controls is presented as mean ± SEM. Statistical significance for the difference between samples from VWMD patients and healthy controls was assessed on log2 fold change data using Welch’s t test (*, p<0.05. **, p<0.01, ***, p<0.001, ****, p<0.0001).
Figure 6—figure supplement 1
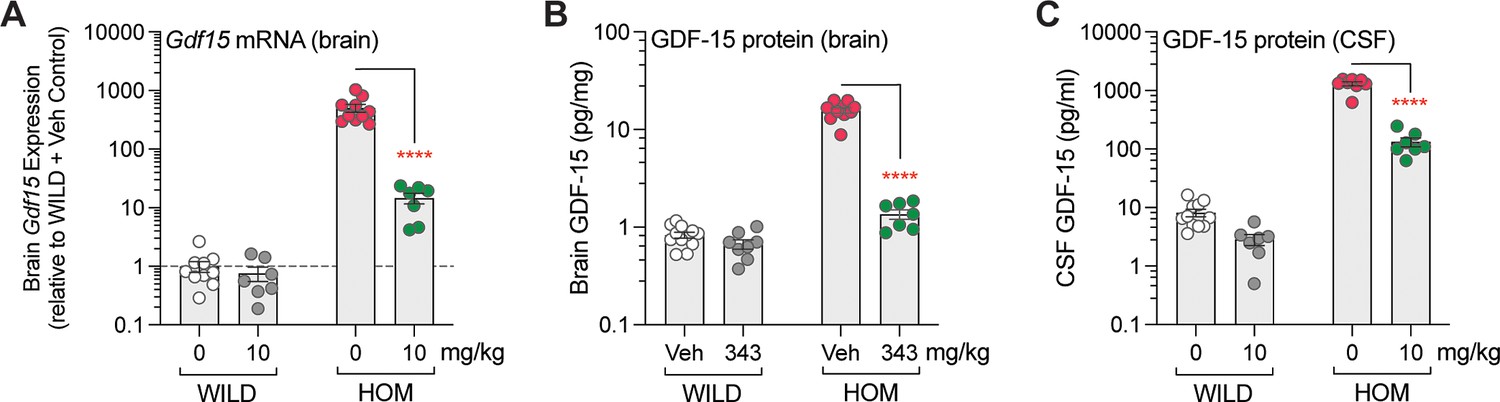
Elevation in GDF-15 mRNA and protein levels in the eukaryotic initiation factor 2B (eIF2B) homozygous (HOM) brain and correction by DNL343 is reflected by changes in the CSF.
(A–B) GDF-15 is increased on both the mRNA and protein level in the brain of eIF2B HOM mice relative to wild-type controls and 4 weeks of DNL343 in diet treatment at a dose equivalent to 10 mg/kg reduced its level. (C) Measurement of GDF-15 in the mouse CSF is feasible and shows changes that recapitulate findings in the brain. Data from the animal model is presented as mean ± SEM of N=7–11 mice per group. Statistical significance for DNL343 effect in the mouse model was determined by a two-way ANOVA followed by Šídák’s multiple comparison tests against vehicle-dosed animals of the same genotype (****, p<0.0001).
Figure 6—figure supplement 2
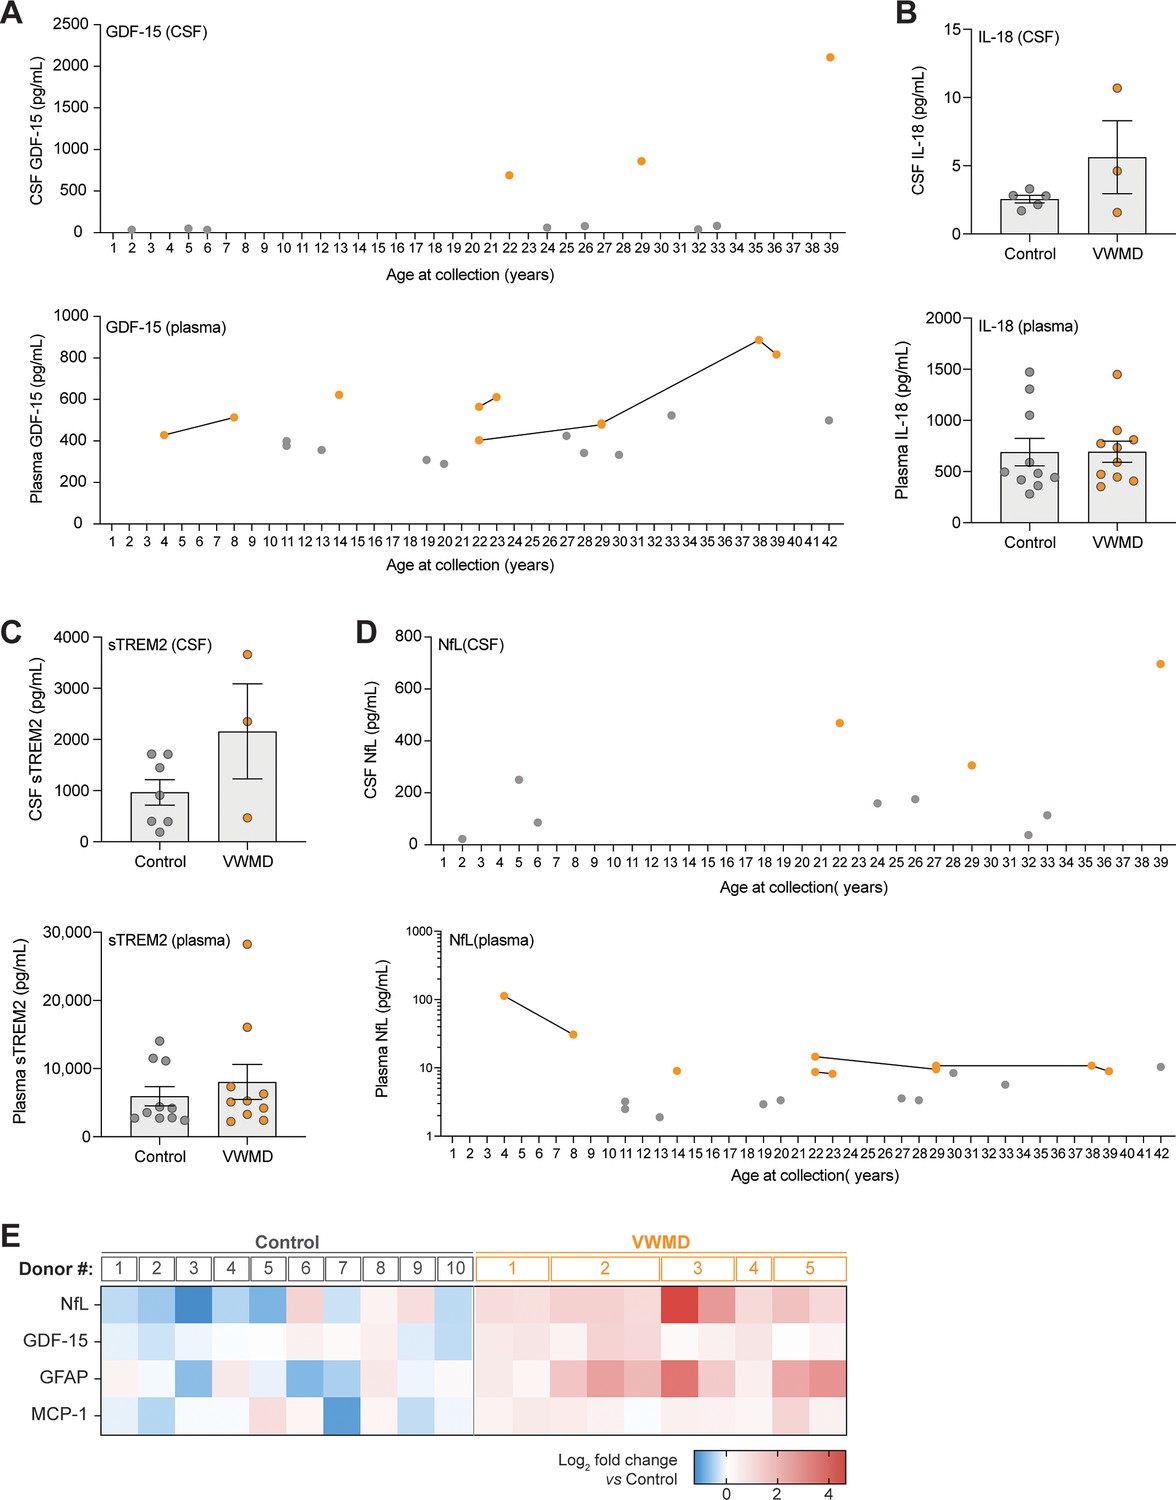
Evaluation of biomarkers for vanishing white matter disease (VWMD) in patient CSF and plasma.
(A) CSF and plasma protein levels of GDF-15 in patients with VWMD and healthy controls with age at time of collection shown. Data points from the same patient collected at different ages are connected with a solid black line. (B–C) Protein levels of IL-18 and soluble triggering receptor expressed on myeloid cells 2 (sTREM2) measured in CSF and plasma of VWMD patients and healthy controls. (D) NfL protein levels measured in CSF and plasma of VWMD patients and healthy controls and age at time of collection. Data points from the same patient collected at different ages are connected by a solid black line. (E) Level of denoted proteins in plasma shown as relative level compared to average of healthy controls on log2 scale in a heatmap. For patients with multiple samples, age increases from left to right across lanes. VWMD patient ID#s correspond across panel E (plasma) and Figure 6—figure supplement 2 (CSF). Plasma and CSF samples in the healthy control group are from non-matching/different individuals. Statistical significance for the difference between samples from VWMD patients and healthy controls was assessed on log2 fold change data using Welch’s t test (ns, not statistically significant).
Figure 7 with 2 supplements
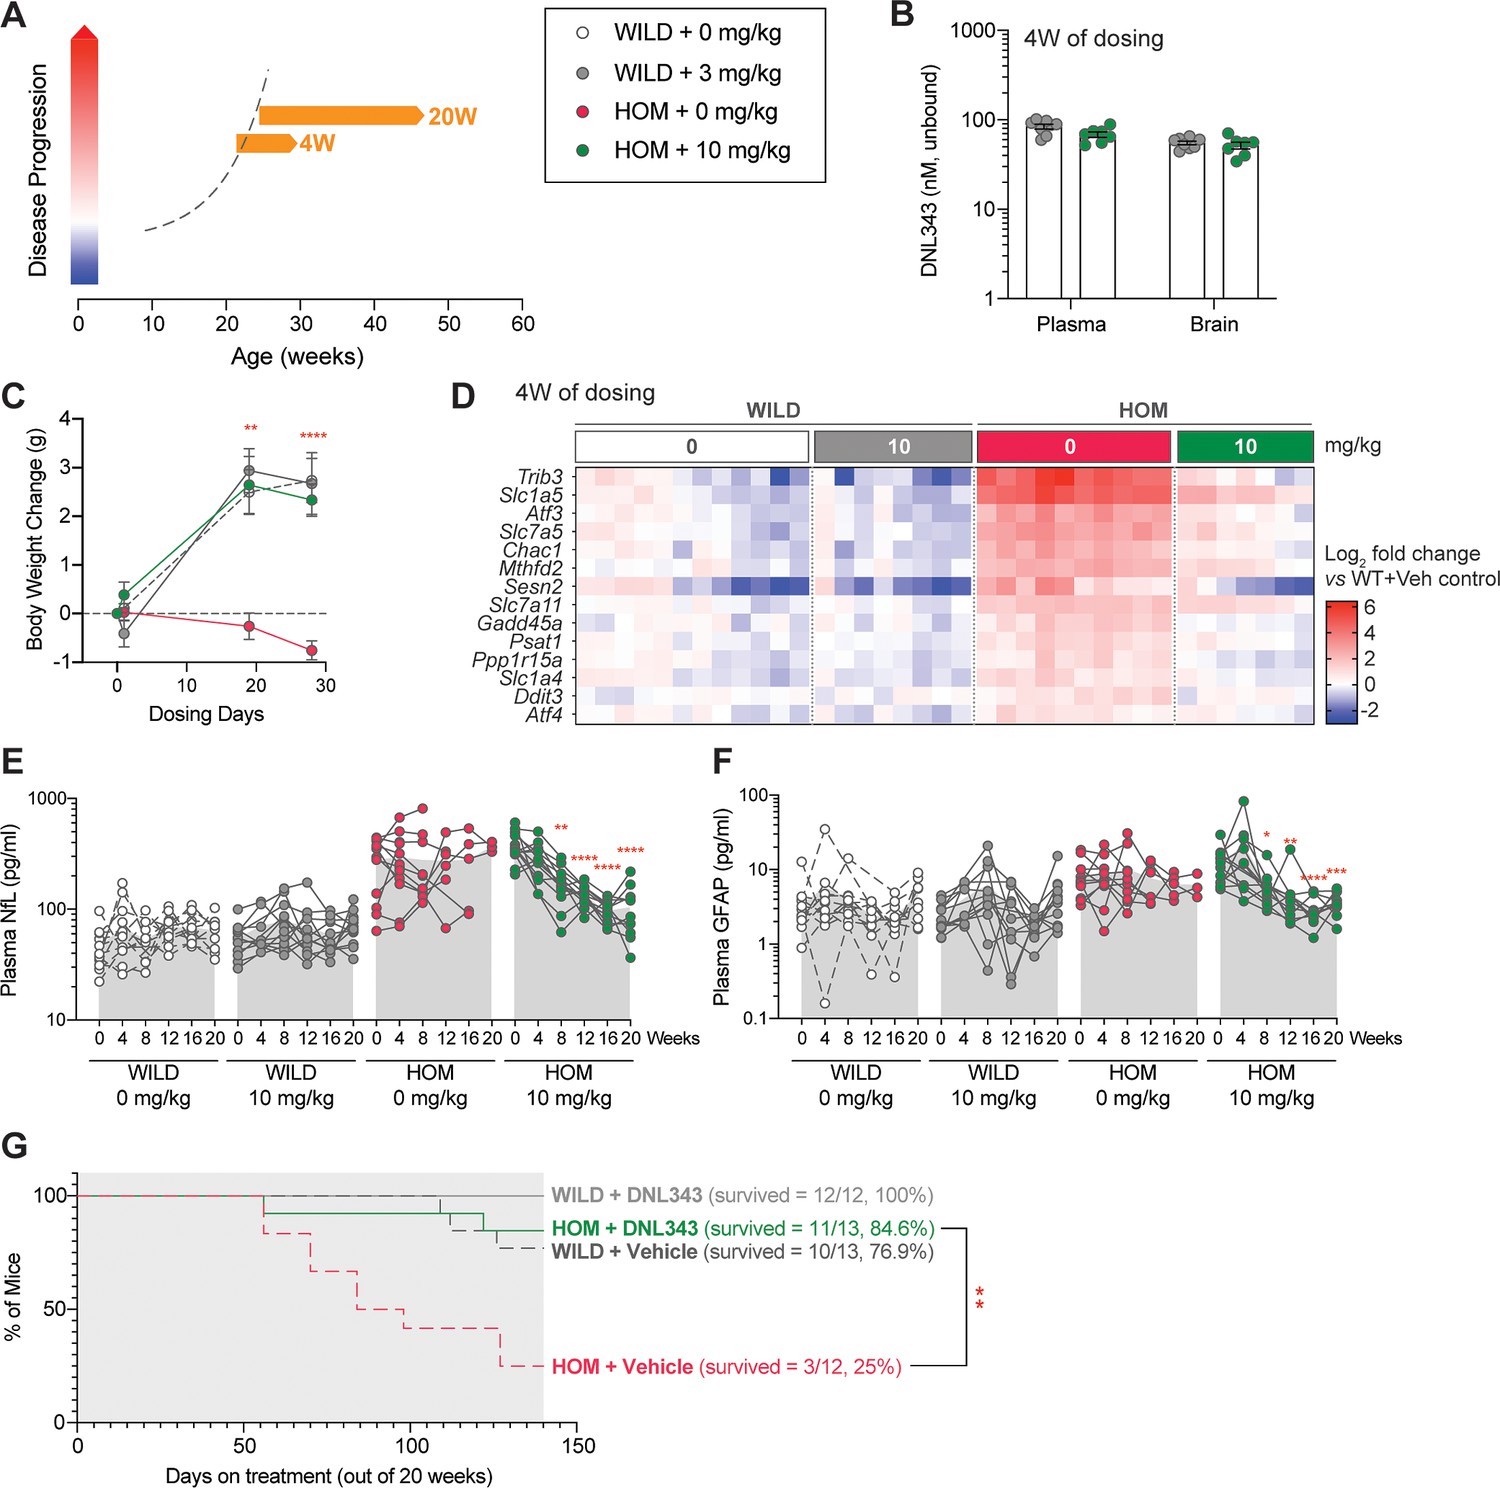
Reduction in integrated stress response (ISR) activation in the CNS is associated with reversal and normalization of plasma biomarker of neurodegeneration and extension of life when DNL343 treatment was initiated toward end of disease stage in the eukaryotic initiation factor 2B (eIF2B) homozygous (HOM) mouse.
(A) Schematic of DNL343 therapeutic dosing studies in the eIF2B HOM mouse. DNL343 treatment was initiated when animals already presented with disease phenotypes at 19–26 or 24–33 weeks of age for 4 or up to 20 weeks, respectively. Mice self-administered DNL343-formulated rodent chow to achieve levels equivalent to oral gavage dose of 10 mg/kg. (B) DNL343 exposure was assessed in terminal plasma and in the brain after 4 weeks of dosing. (C). Body weight was measured at baseline and up to 4 weeks of dosing. (D) Heatmap visualization of select ISR transcript markers in the brain following vehicle and DNL343 treatment for 4 weeks. See Supplementary file 8 for statistical data. (E–F) Plasma biomarker of neurodegeneration, NfL, and neuroinflammation, GFAP, was measured every 4 weeks for up to 20 weeks of dosing. (G) Kaplan-Meier graph shows that the reduced lifespan of the eIF2B HOM mice was extended when DNL343 treatment was initiated at 24–33 weeks of age. Data are presented as mean ± SEM of N=7–10 mice (panels B–D) or 10–13 mice per group (panels E–G). Statistical significance for DNL343 effect was set at p<0.05 as determined by a mixed-effect analysis followed by Šídák’s multiple comparison tests against vehicle-dosed animals of the same genotype at matching timepoints (C) or against baseline values for each group (E–F). Effect of DNL343 on eIF2B HOM survival was assessed with log-rank test (*, p<0.05. **, p<0.01, ***, p<0.001, ****, p<0.0001).
Figure 7—figure supplement 1
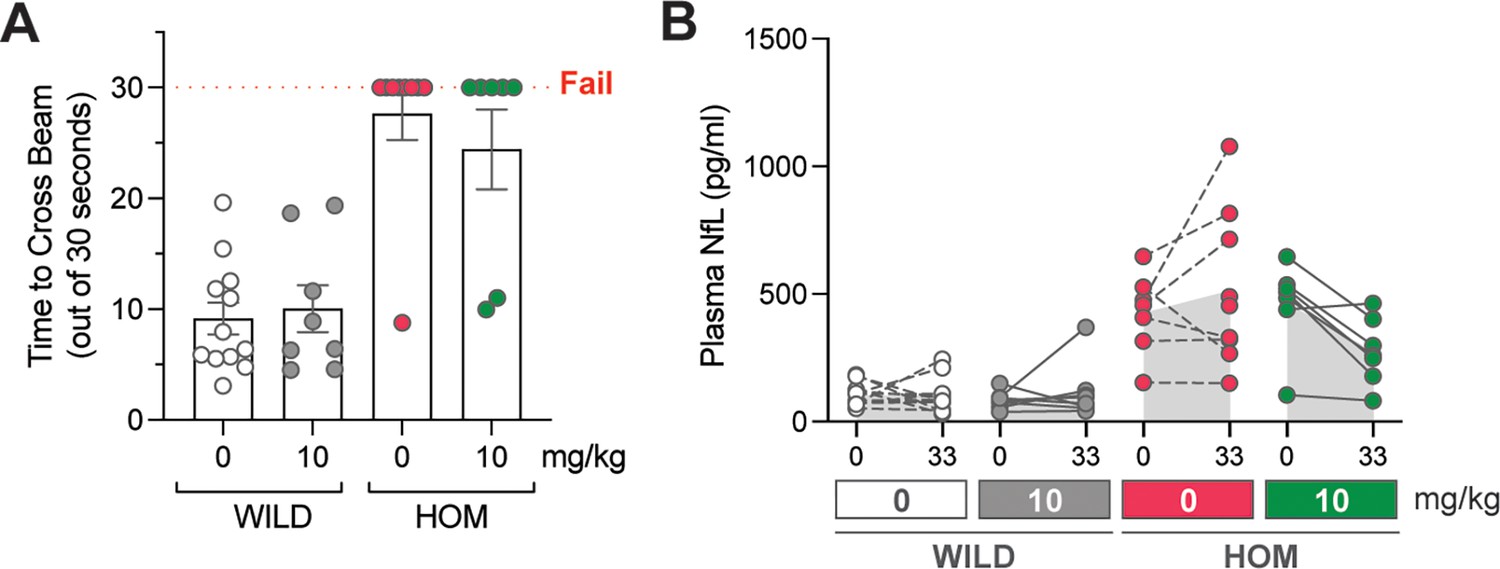
Four weeks of DNL343 treatment initiated at late stage of disease did not rescue motor function but led to a trend of plasma NfL reduction.
(A) Balance beam test was performed after 4 weeks of dosing and time to cross the beam out of 30 s were recorded. (B) Plasma biomarker of neurodegeneration, NfL, was measured at baseline and after 4 weeks of DNL343 dosing. Data are presented as mean ± SEM of N=7–12 mice per group. Statistical significance for DNL343 effect was set at p<0.05 as determined by one-way ANOVA followed by multiple comparison tests against vehicle-dosed animals of the same genotype (A) or mixed-effect analysis followed by multiple comparison tests against vehicle-dosed animals of the same genotype at matching timepoints.
Figure 7—figure supplement 2
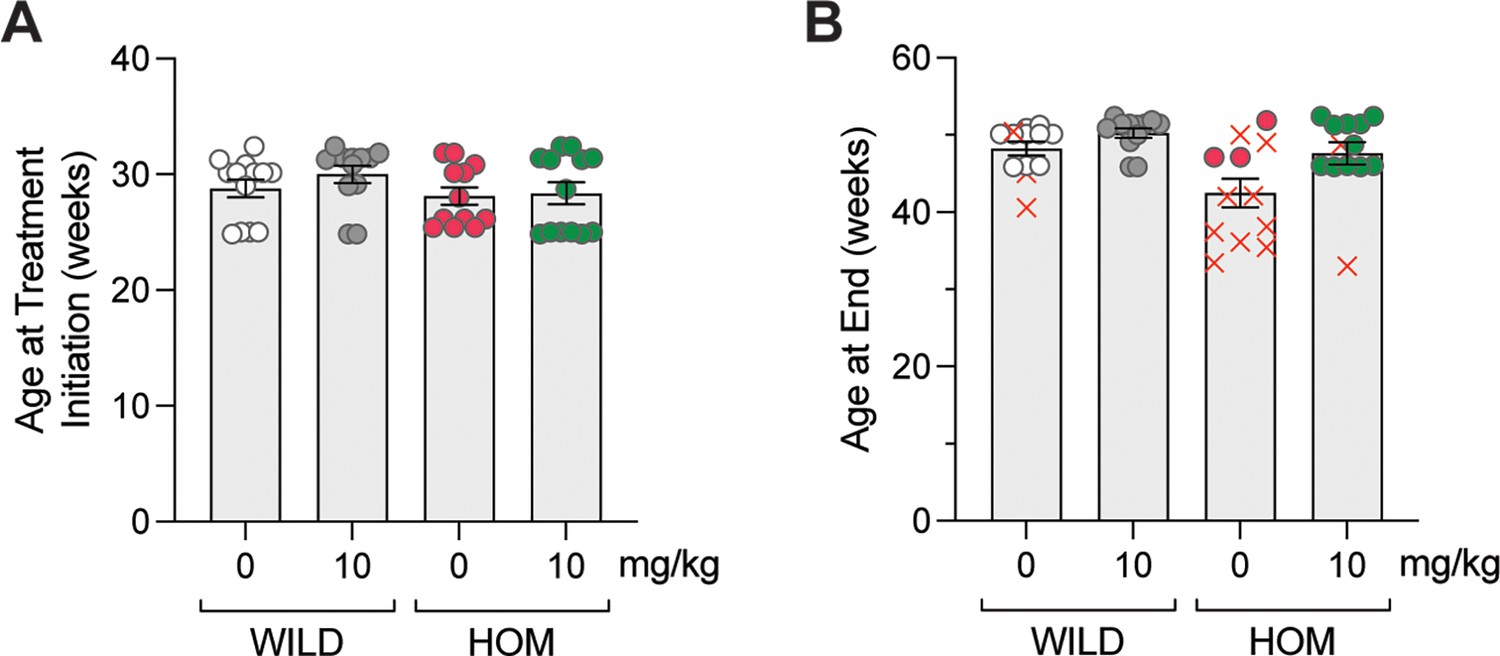
Baseline characteristic and age at the end of the 20-week DNL343 therapeutic dosing study in the eukaryotic initiation factor 2B (eIF2B) homozygous (HOM) model.
(A) Age at DNL343 treatment initiation was matched across all experimental groups. (B) Age of mice at the end of the 20-week study or when animals met at least one of the predetermined humane endpoints. X indicates mice that died or met a humane endpoint during the 20-week dosing study.
Additional files
-
Supplementary file 1
Expression of select integrated stress response (ISR)-dependent transcripts at 2 days after optic nerve crush.
Data is presented as mean expression level relative to the 0 mg/kg-treated uncrushed retina controls (Group 1). Statistical significance for DNL343 effects in uncrushed retina or the effect of optic nerve crush on non-drug-treated retina was determined by a two-way ANOVA followed by Šídák’s multiple comparisons tests against the 0 mg/kg-treated uncrushed retina controls (Group 2 vs Group 1, or Group 3 vs Group 1, respectively). Statistical significance for DNL343 effects in crushed retina was determined by a two-way ANOVA followed by Dunnett’s multiple comparisons test against the 0 mg/kg-treated crushed retina controls (Group 4/5/6 vs Group 3). Red font denotes a statistically significant effect (*, p<0.05. **, p<0.01, ***, p<0.001, ****, p<0.0001).
- https://cdn.elifesciences.org/articles/92173/elife-92173-supp1-v2.xlsx
-
Supplementary file 2
Expression of select integrated stress response (ISR)-dependent transcripts at 14 days after optic nerve crush.
Data is presented as mean expression level relative to the 0 mg/kg-treated uncrushed retina controls (Group 1). Statistical significance for DNL343 effects in uncrushed retina or the effect of optic nerve crush on non-drug-treated retina was determined by a two-way ANOVA followed by Šídák’s multiple comparisons tests against the 0 mg/kg-treated uncrushed retina controls (Group 2 vs Group 1, or Group 3 vs Group 1, respectively). Statistical significance for DNL343 effects in crushed retina was determined by a two-way ANOVA followed by Dunnett’s multiple comparisons test against the 0 mg/kg-treated crushed retina controls (Group 4/5/6 vs Group 3). Red font denotes a statistically significant effect (*, p<0.05. **, p<0.01, ***, p<0.001, ****, p<0.0001).
- https://cdn.elifesciences.org/articles/92173/elife-92173-supp2-v2.xlsx
-
Supplementary file 3
Expression of select integrated stress response (ISR)-dependent transcripts in the brain of eukaryotic initiation factor 2B (eIF2B) homozygous (HOM) mice relative to wild-type and heterozygous controls.
Data is presented as mean expression level relative to the wild-type controls (Group 1). Statistical significance for genotype effect was determined by a two-way ANOVA followed by Dunnett’s multiple comparisons tests against the wild-type controls (Group 2 vs Group 1, or Group 3 vs Group 1). Red font denotes a statistically significant effect (*, p<0.05. **, p<0.01, ***, p<0.001, ****, p<0.0001).
- https://cdn.elifesciences.org/articles/92173/elife-92173-supp3-v2.xlsx
-
Supplementary file 4
Expression of select integrated stress response (ISR)-dependent transcripts in the peripheral blood mononuclear cell (PBMC) of eukaryotic initiation factor 2B (eIF2B) homozygous (HOM) mice relative to wild-type and heterozygous controls.
Data is presented as mean expression level relative to the wild-type controls (Group 1). Statistical significance for genotype effect was determined by a two-way ANOVA followed by Dunnett’s multiple comparisons tests against the wild-type controls (Group 2 vs Group 1, or Group 3 vs Group 1).
- https://cdn.elifesciences.org/articles/92173/elife-92173-supp4-v2.xlsx
-
Supplementary file 5
Expression of select integrated stress response (ISR)-dependent transcripts in the spleen of eukaryotic initiation factor 2B (eIF2B) homozygous (HOM) mice relative to wild-type controls.
Data is presented as mean expression level relative to the wild-type controls (Group 1). Statistical significance for genotype effect was determined by a two-way ANOVA followed by Dunnett’s multiple comparisons tests against the wild-type controls (Group 2 vs Group 1).
- https://cdn.elifesciences.org/articles/92173/elife-92173-supp5-v2.xlsx
-
Supplementary file 6
Expression of select integrated stress response (ISR)-dependent transcripts in the eukaryotic initiation factor 2B (eIF2B) homozygous (HOM) mice following 13 weeks of prophylactic dosing.
Data is presented as mean expression level relative to the 0 mg/kg-treated wild-type controls (Group 1). Statistical significance for DNL343 effects in wild-type animals or the effect of the HOM mutation was determined by a two-way ANOVA followed by Šídák’s multiple comparisons tests against the 0 mg/kg-treated wild-type controls (Group 2 vs Group 1, or Group 3 vs Group 1, respectively). Statistical significance for DNL343 effects in the eIF2B HOM genotype was determined by a two-way ANOVA followed by Dunnett’s multiple comparisons test against the 0 mg/kg-treated eIF2B HOM group (Group 4/5/6/7 vs Group 3). Red font denotes a statistically significant effect (*, p<0.05. **, p<0.01, ***, p<0.001, ****, p<0.0001).
- https://cdn.elifesciences.org/articles/92173/elife-92173-supp6-v2.xlsx
-
Supplementary file 7
Vanishing white matter disease (VWMD) patient and healthy control sample information.
(A) VWMD patient and (B) healthy control information. VWMD samples were provided by Dr Schiffman at Baylor University. Healthy control samples were purchased or repurposed control samples from another study. Plasma and CSF samples in the healthy control group are from non-matching/different individuals.
- https://cdn.elifesciences.org/articles/92173/elife-92173-supp7-v2.xlsx
-
Supplementary file 8
Expression of select integrated stress response (ISR)-dependent transcripts in the eukaryotic initiation factor 2B (eIF2B) homozygous (HOM) mice following 4 weeks of dosing starting at an advanced disease stage.
Data is presented as mean expression level relative to the 0 mg/kg-treated wild-type controls (Group 1). Statistical significance for DNL343 effects in wild-type animals or the effect of the HOM mutation was determined by a two-way ANOVA followed by Dunnett’s multiple comparisons tests against the 0 mg/kg-treated wild-type controls (Group 2 vs Group 1, or Group 3 vs Group 1, respectively). Statistical significance for DNL343 effects in the eIF2B HOM genotype was determined by a two-way ANOVA followed by Šídák’s multiple comparisons test against the 0 mg/kg-treated eIF2B HOM group (Group 4 vs Group 3). Red font denotes a statistically significant effect (*, p<0.05, **, p<0.01, ***, p<0.001, ****, p<0.0001).
- https://cdn.elifesciences.org/articles/92173/elife-92173-supp8-v2.xlsx
-
MDAR checklist
- https://cdn.elifesciences.org/articles/92173/elife-92173-mdarchecklist1-v2.docx
Download links
A two-part list of links to download the article, or parts of the article, in various formats.
Downloads (link to download the article as PDF)
Open citations (links to open the citations from this article in various online reference manager services)
Cite this article (links to download the citations from this article in formats compatible with various reference manager tools)
DNL343 is an investigational CNS penetrant eukaryotic initiation factor 2B activator that prevents and reverses the effects of neurodegeneration caused by the integrated stress response
eLife 12:RP92173.
https://doi.org/10.7554/eLife.92173.3


