Uncharacterized yeast gene YBR238C, an effector of TORC1 signaling in a mitochondrial feedback loop, accelerates cellular aging via HAP4- and RMD9-dependent mechanisms
- Bioinformatics Institute (BII), Agency for Science, Technology and Research (A*STAR), Singapore
- Genome Institute of Singapore (GIS), Agency for Science, Technology and Research (A*STAR), Singapore
- LASA – Lausitz Advanced Scientific Applications gGmbH, Germany
- School of Biological Sciences (SBS), Nanyang Technological University (NTU), Singapore
Figures
Figure 1 with 2 supplements

YBR238C deletion increases the cellular lifespan.
(A and B) Expression analysis of YBR238C gene by quantitative reverse transcription-polymerase chain reaction (qRT-PCR) in yeast Saccharomyces cerevisiae genetic backgrounds BY4743 (A) and CEN.PK113-7D (B). qRT-PCR was performed using RNA extracted from logarithmic-phase cultures grown in synthetic defined medium supplemented with auxotrophic amino acids for BY4743 (A) and only the synthetic defined medium for CEN.PK113-7D (B). Data are represented as means ± standard deviation (SD) (n = 4). ****p < 0.0001 based on two-sided Student’s t-test. (C and D) Chronological lifespan (CLS) of the wild type and ybr238c∆ mutant was assessed in synthetic defined medium supplemented with auxotrophic amino acids for BY4743 (C) and only the synthetic defined medium for CEN.PK113-7D (D) strains in 96-well plate. Aged cells survival was measured relative to the outgrowth of day 2. Data are represented as means ± SD (n = 3) (C) and (n = 4) (D). **p < 0.01, ***p < 0.001, and ****p < 0.0001 based on two-way analysis of variance (ANOVA) followed by Šídák’s multiple comparisons test. (E, F) CLS of the wild type and ybr238c∆ mutant was performed in synthetic defined medium supplemented with auxotrophic amino acids for BY4743 and only the synthetic defined medium for CEN.PK113-7D strains using flasks. Outgrowth was performed for 10-fold serial diluted aged cells onto the YPD agar plate (E) and YPD medium in the 96-well plate (F). The serial outgrowth of aged cells on agar medium was imaged (E) and quantified the survival relative to outgrowth of day 2 (F). A representative of two experiments for (E) and (F) is shown.
-
Figure 1—source data 1
Genome-wide survey of aging-associated genes (AAGs) in Saccharomyces cerevisiae.
- https://cdn.elifesciences.org/articles/92178/elife-92178-fig1-data1-v1.zip
-
Figure 1—source data 2
Rapamycin response genes and aging-associated genes mapping.
- https://cdn.elifesciences.org/articles/92178/elife-92178-fig1-data2-v1.zip
Figure 1—figure supplement 1
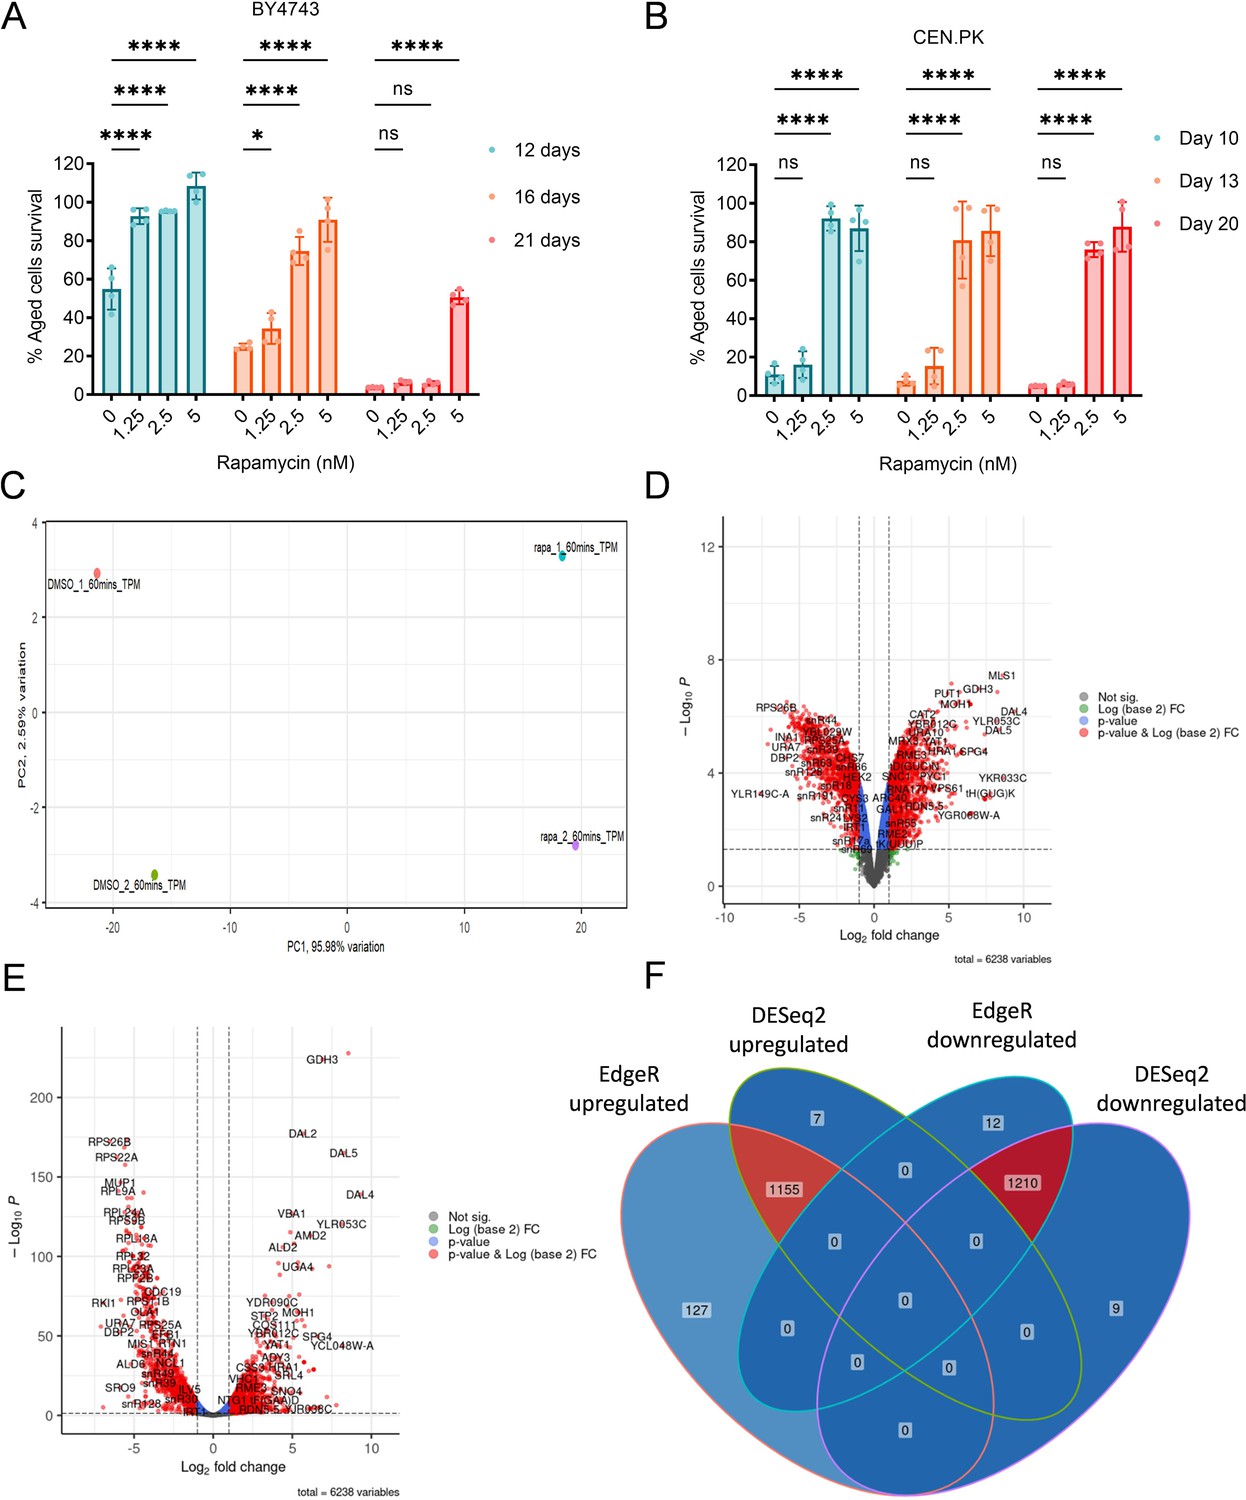
Transcriptomics analysis of rapamycin to identify the Target of Rapamycin Complex 1 (TORC1)-regulated genes.
(A and B) Chronological lifespan (CLS) of the wild-type BY4743 (A) and CEN.PK113-7D (B) yeast strains was assessed in the synthetic defined medium supplemented with auxotrophic amino acids for BY4743 (A) and only the synthetic defined medium for CEN.PK113-7D (B) in 96-well plate. Aged cells survival was measured relative to the outgrowth of day 2. Data are represented as means ± standard deviation (SD) (n = 4). *p < 0.05 and ****p < 0.0001 based on two-way analysis of variance (ANOVA) followed by Dunnett’s multiple comparisons test. ns: non-significant. (C) Principal component analysis (PCA) of the RNA sequencing (RNA-Seq) data from replicates of dimethyl sulfoxide (DMSO) and rapamycin (50 nM) treated logarithmic-phase yeast cells (BY4743) for 1 hr in synthetic defined medium supplemented with auxotrophic amino acids. PC1 represents 95.98% of the total variance in the experimental data, and PC2 represents 2.59% of the total variance. (D and E) Volcano plots produced by EdgeR (D) and DESeq2 (E) demonstrate the gene expression pattern and the differentially expressed genes (DEGs) with p-value <0.05, with a fold change of log2(fold change) >1 for upregulated genes and log2(fold change) <−1 for downregulated genes. (F) Overlap of identified DEGs using EdgeR and DESeq2 with the criteria for all two tools that p-value <0.05, with a fold change of log2(fold change) >1 for upregulated genes and log2(fold change) <−1 for downregulated genes. Up- and downregulated DEGs overlaps for both EdgeR and DESeq2 were further considered for functional gene ontology (GO) enrichment analysis.
Figure 1—figure supplement 2
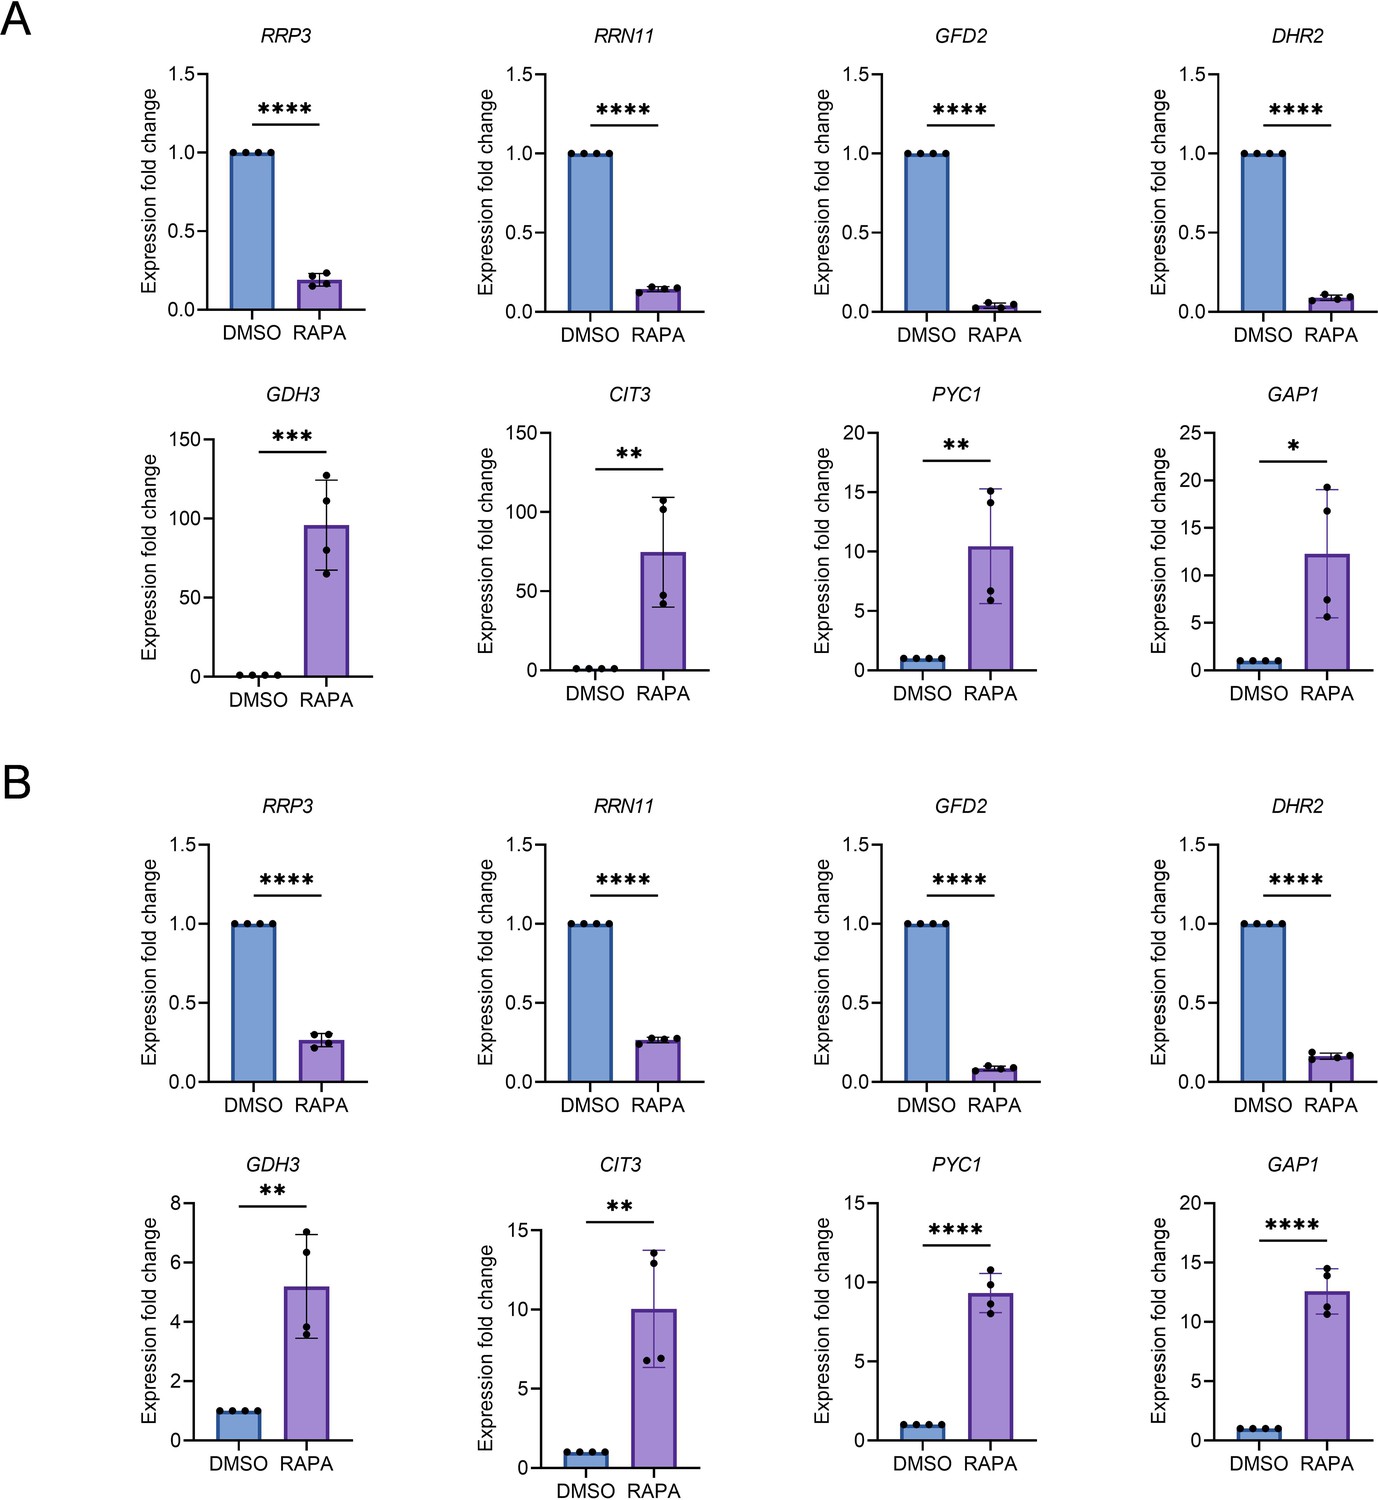
RNA sequencing (RNA-Seq) data validation by quantitative reverse transcription-polymerase chain reaction (qRT-PCR).
(A and B) Expression analysis of selected genes of RNA-Seq data by qRT-PCR in Saccharomyces cerevisiae genetic backgrounds BY4743 (A) and CEN.PK113-7D (B). Logarithmic-phase wild-type cells treated with dimethyl sulfoxide (DMSO) and rapamycin (50 nM) in synthetic defined medium supplemented with auxotrophic amino acids for BY4743 (A) and only the synthetic defined medium for CEN.PK113-7D (B) strains. Gene expression of rapamycin-treated samples were compared with DMSO control. Data are represented as means ± standard deviation (SD) (n = 4). *p < 0.05, **p < 0.01, ***p < 0.001, and ****p < 0.0001 based on two-sided Student’s t-tests.
Figure 2 with 2 supplements
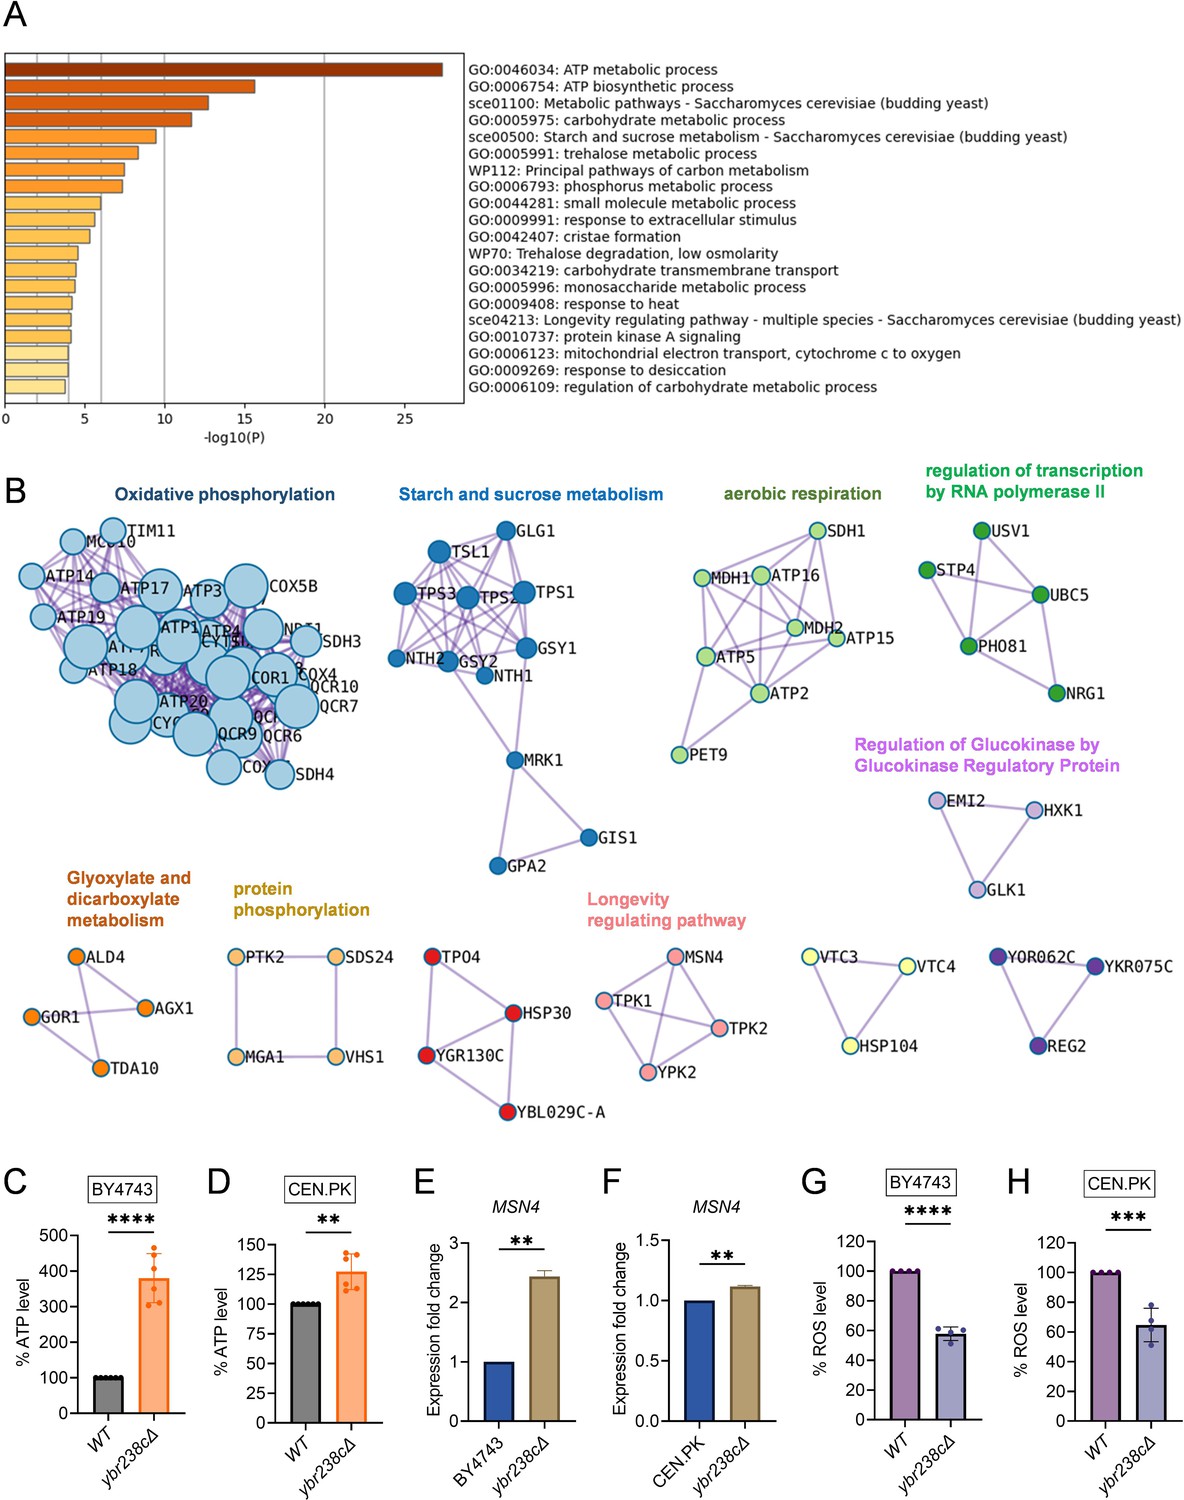
Longevity signatures of ybr238c∆ mutant.
(A, B) Functional enrichment analysis of upregulated genes in yeast Saccharomyces cerevisiae ybr238c∆ mutant compared to wild type (BY4743). Bar plots showing the enriched biological process (A) and identified MCODE complexes based on the top 3 ontology enriched terms (B). Full set of genes for functional enrichment analysis (A) and the MCODE complexes (B) are available in Figure 2—source data 1. (C and D) Adenosine triphosphate (ATP) analysis of wild type and ybr238c∆ mutant for BY4743 (C) and CEN.PK113-7D (D). Quantification was performed using ATP extracted from 72-hr stationary cultures grown in synthetic defined medium supplemented with auxotrophic amino acids for BY4743 and only the synthetic defined medium for CEN.PK113-7D strains. Data are represented as means ± standard deviation (SD) (n = 6). **p < 0.01 and ****p < 0.0001 based on two-sided Student’s t-test. (E and F) Expression analysis of MSN4 gene by quantitative reverse transcription-polymerase chain reaction (qRT-PCR) in yeast Saccharomyces cerevisiae genetic backgrounds BY4743 (E) and CEN.PK113-7D (F). qRT-PCR was performed using RNA extracted from logarithmic-phase cultures grown in synthetic defined medium supplemented with auxotrophic amino acids for BY4743 and only the synthetic defined medium for CEN.PK113-7D strains. Data are represented as means ± SD (n = 2). **p < 0.01 based on two-sided Student’s t-test. (G and H) Reactive oxygen species (ROS) analysis of wild type and ybr238c∆ mutant for BY4743 (G) and CEN.PK113-7D (H). Quantification was performed for logarithmic-phase cultures grown in synthetic defined medium supplemented with auxotrophic amino acids for BY4743 and only the synthetic defined medium for CEN.PK113-7D strains. Data are represented as means ± SD (n = 4). ***p < 0.001 and ****p < 0.0001 based on two-sided Student’s t-test.
-
Figure 2—source data 1
Transcriptomics and transcription factor analysis of ybr238c∆ cells.
- https://cdn.elifesciences.org/articles/92178/elife-92178-fig2-data1-v1.zip
Figure 2—figure supplement 1
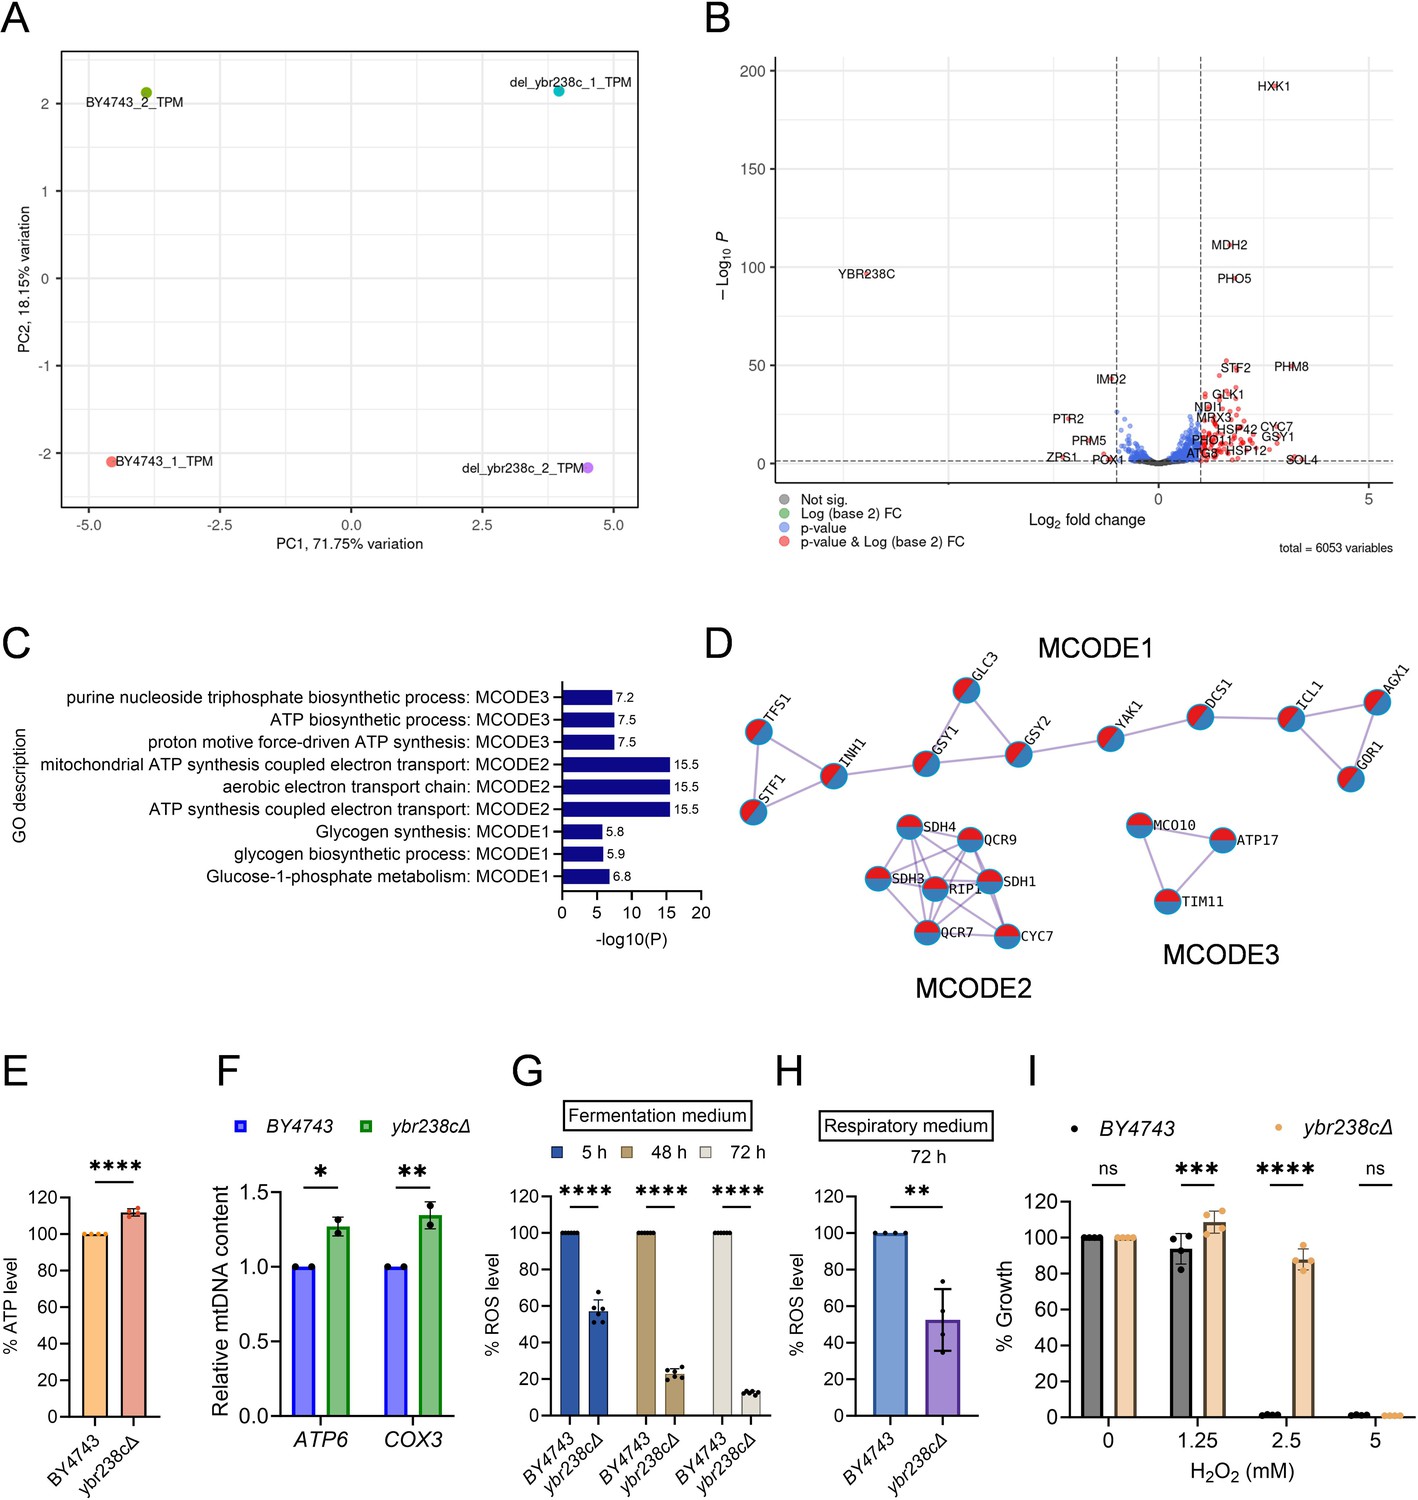
Identification of the role of uncharacterized YBR238C gene in cellular aging.
(A) Principal component analysis (PCA) of the RNA sequencing (RNA-Seq) data from replicates of logarithmic-phase wild-type BY4743 and ybr238c∆ yeast strains in the synthetic defined medium supplemented with auxotrophic amino acids. PC1 represents 71.75% of the total variance in the experimental data, and PC2 represents 18.15% of the total variance. (B) Volcano plots produced by DESeq2 demonstrate the gene expression pattern and the differentially expressed genes (DEGs) with p-value <0.05, with a fold change of log2(fold change) >0.5 for upregulated genes and log2(fold change) <−0.5 for downregulated genes. Gene ontology (GO) enrichment analysis was performed for upregulated DEGs. See also Figure 2—source data 1. (C, D) Comparison of functional enrichment analysis for upregulated DEGs of ybr238c∆ mutant and rapamycin (50 nM) treated wild-type BY4743 cells. Bar plots showing the common enriched biological process (C) and MCODE complexes based on the top 3 ontology enriched terms (D). (E) Adenosine triphosphate (ATP) analysis of wild-type BY4743 and ybr238c∆ mutant strains. Quantification was performed using ATP extracted from logarithmic-phase cultures grown in synthetic defined medium supplemented with auxotrophic amino acids. Data are represented as means ± standard deviation (SD) (n = 4). ****p < 0.0001 based on two-sided Student’s t-test. (F) Relative mitochondrial DNA (mtDNA) in logarithmic-phase wild-type BY4743 and ybr238c∆ mutant in synthetic defined medium supplemented with auxotrophic amino acids. Relative mtDNA content was determined by qPCR of mitochondrial genes (ATP6 and COX3) and normalized with nuclear-specific gene ACT1. Data are represented as means ± SD (n = 2). *p < 0.05 and **p < 0.01 based on two-way analysis of variance (ANOVA) followed by Šídák’s multiple comparisons test. (G and H) Reactive oxygen species (ROS) analysis of wild-type BY4743 and ybr238c∆ mutant in synthetic defined (G) fermentative glucose medium, and (H) respiratory glycerol medium, supplemented with auxotrophic amino acids, at indicated time points. (G) Data are represented as means ± SD (n = 6). ****p < 0.0001 based on two-way ANOVA followed by Šídák’s multiple comparisons test. (H) Data are represented as means ± SD (n = 4). **p < 0.01 based on two-sided Student’s t-tests. (I) Growth assay with H2O2 of wild-type BY4743 and ybr238c∆ strains in synthetic defined medium supplemented with auxotrophic amino acids. Data are represented as means ± SD (n = 4). ***p < 0.001, ****p < 0.0001, and ns: non-significant based on two-way ANOVA followed by Šídák’s multiple comparisons test.
Figure 2—figure supplement 2
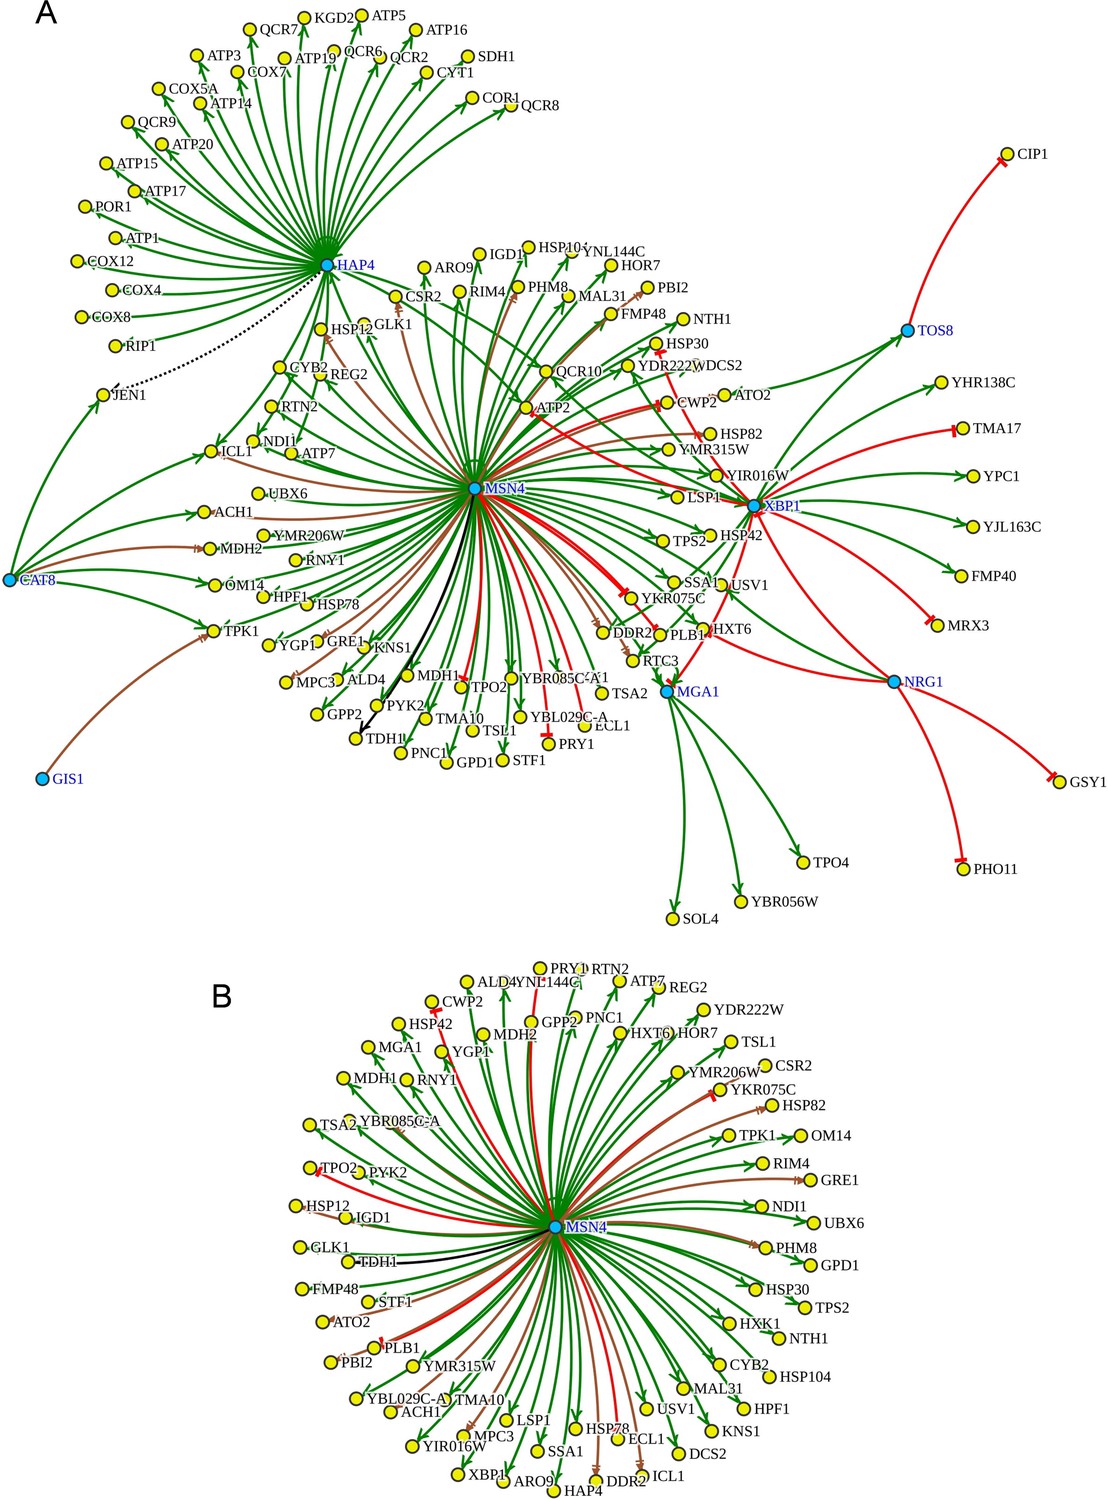
Transcription factors (TFs) analysis for upregulated differentially expressed genes (DEGs) of ybr238c∆ mutant.
(A) The whole regulatory network of overrepresented top 8 enriched TFs (blue) within the upregulated DEGs of ybr238c∆ mutant. Msn4 and Hap4 TFs are appearing as responsible for the highest number of regulated genes in ybr238c∆ mutant. (B) The Msn4 regulon within the upregulated DEGs of ybr238c∆ mutant.
Figure 3
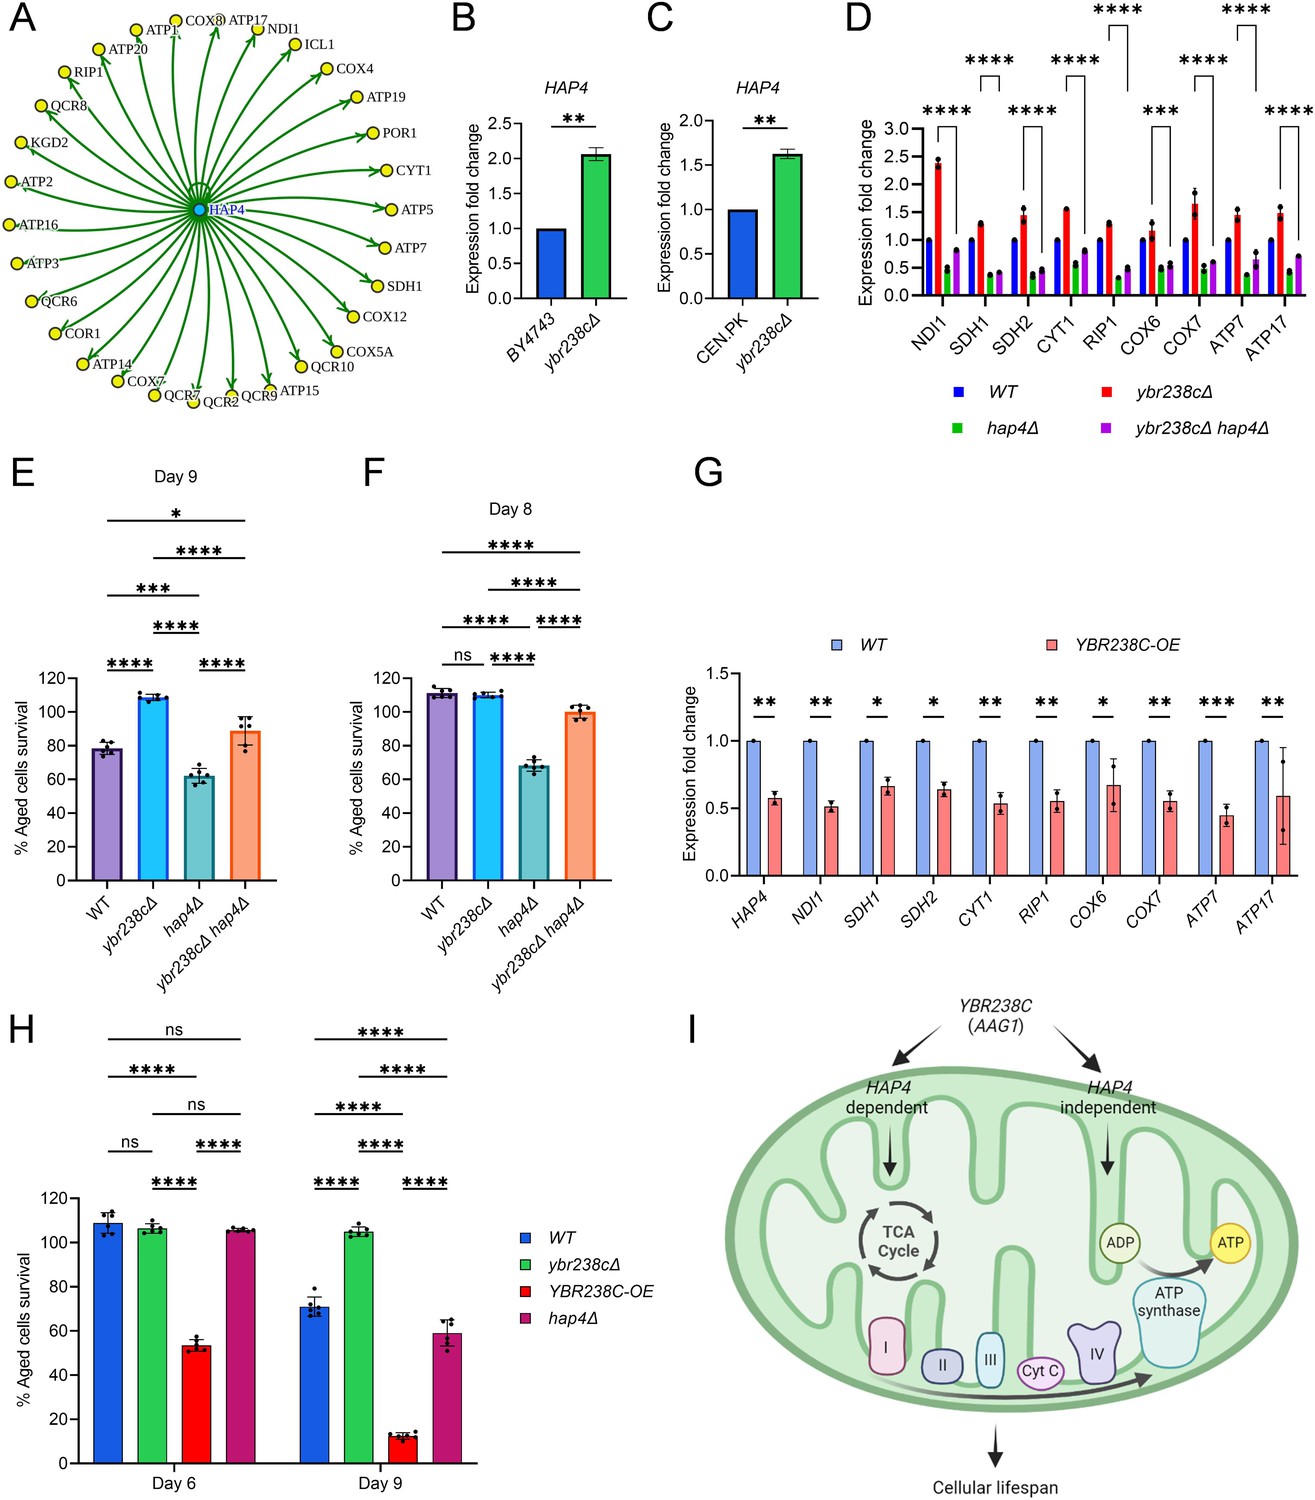
YBR238C affects cellular aging via HAP4-dependent and -independent mechanisms.
(A) The HAP4 regulon within the upregulated differentially expressed genes (DEGs) of ybr238c∆ mutant. See also Figure 2—source data 1. Expression analysis of HAP4 gene by quantitative reverse transcription-polymerase chain reaction (qRT-PCR) in yeast Saccharomyces cerevisiae genetic backgrounds BY4743 (B) and CEN.PK113-7D (C). qRT-PCR was performed using RNA extracted from logarithmic-phase cultures grown in synthetic defined medium supplemented with auxotrophic amino acids for BY4743 and only the synthetic defined medium for CEN.PK113-7D strains. Data are represented as means ± standard deviation (SD) (n = 2). **p < 0.01 based on two-sided Student’s t-test. (D) Expression analysis of mitochondrial ETC genes by qRT-PCR in wild type, ybr238c∆, hap4∆, and ybr238c∆ hap4∆, strains of yeast S. cerevisiae genetic background CEN.PK113-7D. qRT-PCR was performed using RNA extracted from logarithmic-phase cultures grown in synthetic defined medium. Data are represented as means ± SD (n = 2). Comparing data between ybr238c∆ and ybr238c∆ hap4∆. ***p < 0.001 and ****p < 0.0001 based on two-way analysis of variance (ANOVA) followed by Šídák’s multiple comparisons test. (E, F, H) Chronological lifespan (CLS) of yeast S. cerevisiae genetic background CEN.PK113-7D strains was performed in synthetic defined medium using 96-well plate. Aged cells survival was measured relative to the outgrowth of day 2. Data are represented as means ± SD (n = 6). *p < 0.05, ***p < 0.001, ****p < 0.0001, and ns: non-significant. Ordinary one-way ANOVA followed by Tukey’s multiple comparisons test (E, F). Two-way ANOVA followed by Šídák’s multiple comparisons test (H). (G) Expression analysis of HAP4 and ETC genes by qRT-PCR in wild-type and YBR238C overexpression (YBR238C-OE) strains of yeast S. cerevisiae genetic background CEN.PK113-7D (C). qRT-PCR was performed using RNA extracted from logarithmic-phase cultures grown in synthetic defined medium. Data are represented as means ± SD (n = 2). *p < 0.05, **p < 0.01, and ***p < 0.001 based on two-way ANOVA followed by Šídák’s multiple comparisons test. (I) Model representing regulation of cellular aging by YBR238C via HAP4-dependent and -independent mechanisms.
Figure 4 with 1 supplement

RMD9 deletion decreases the cellular lifespan.
(A, E) Chronological lifespan (CLS) of yeast Saccharomyces cerevisiae genetic background CEN.PK113-7D strains was performed in synthetic defined medium using 96-well plate. Aged cells survival was measured relative to the outgrowth of day 2. Data are represented as means ± standard deviation (SD) (n = 12) (A) and (n = 6) (B). ****p < 0.0001 and ns: non-significant. Ordinary one-way analysis of variance (ANOVA) followed by Tukey’s multiple comparisons test (A). Two-way ANOVA followed by Dunnett’s multiple comparisons test (E). (B, C, F, G) CLS of yeast strains was performed in synthetic defined medium using flask. Outgrowth was performed for 10-fold serial diluted aged cells onto the YPD agar plate (B, F) and YPD medium in the 96-well plate (C, G). The serial outgrowth of aged cells on agar medium was imaged (B, F) and quantified the survival relative to outgrowth of day 1 (C, G). A representative of two experiments for B, C, F, and G is shown. (D) Serial dilution growth assays of the yeast strains on fermentative glucose medium (YPD) and respiratory glycerol medium (YPG). (H) Adenosine triphosphate (ATP) level in yeast strains. Quantification was performed using ATP extracted from 72-hr stationary cultures grown in synthetic defined medium. Data are represented as means ± SD (n = 3). *p < 0.05 and ***p < 0.001 based on ordinary one-way ANOVA followed by Dunnett’s multiple comparisons test.
Figure 4—figure supplement 1
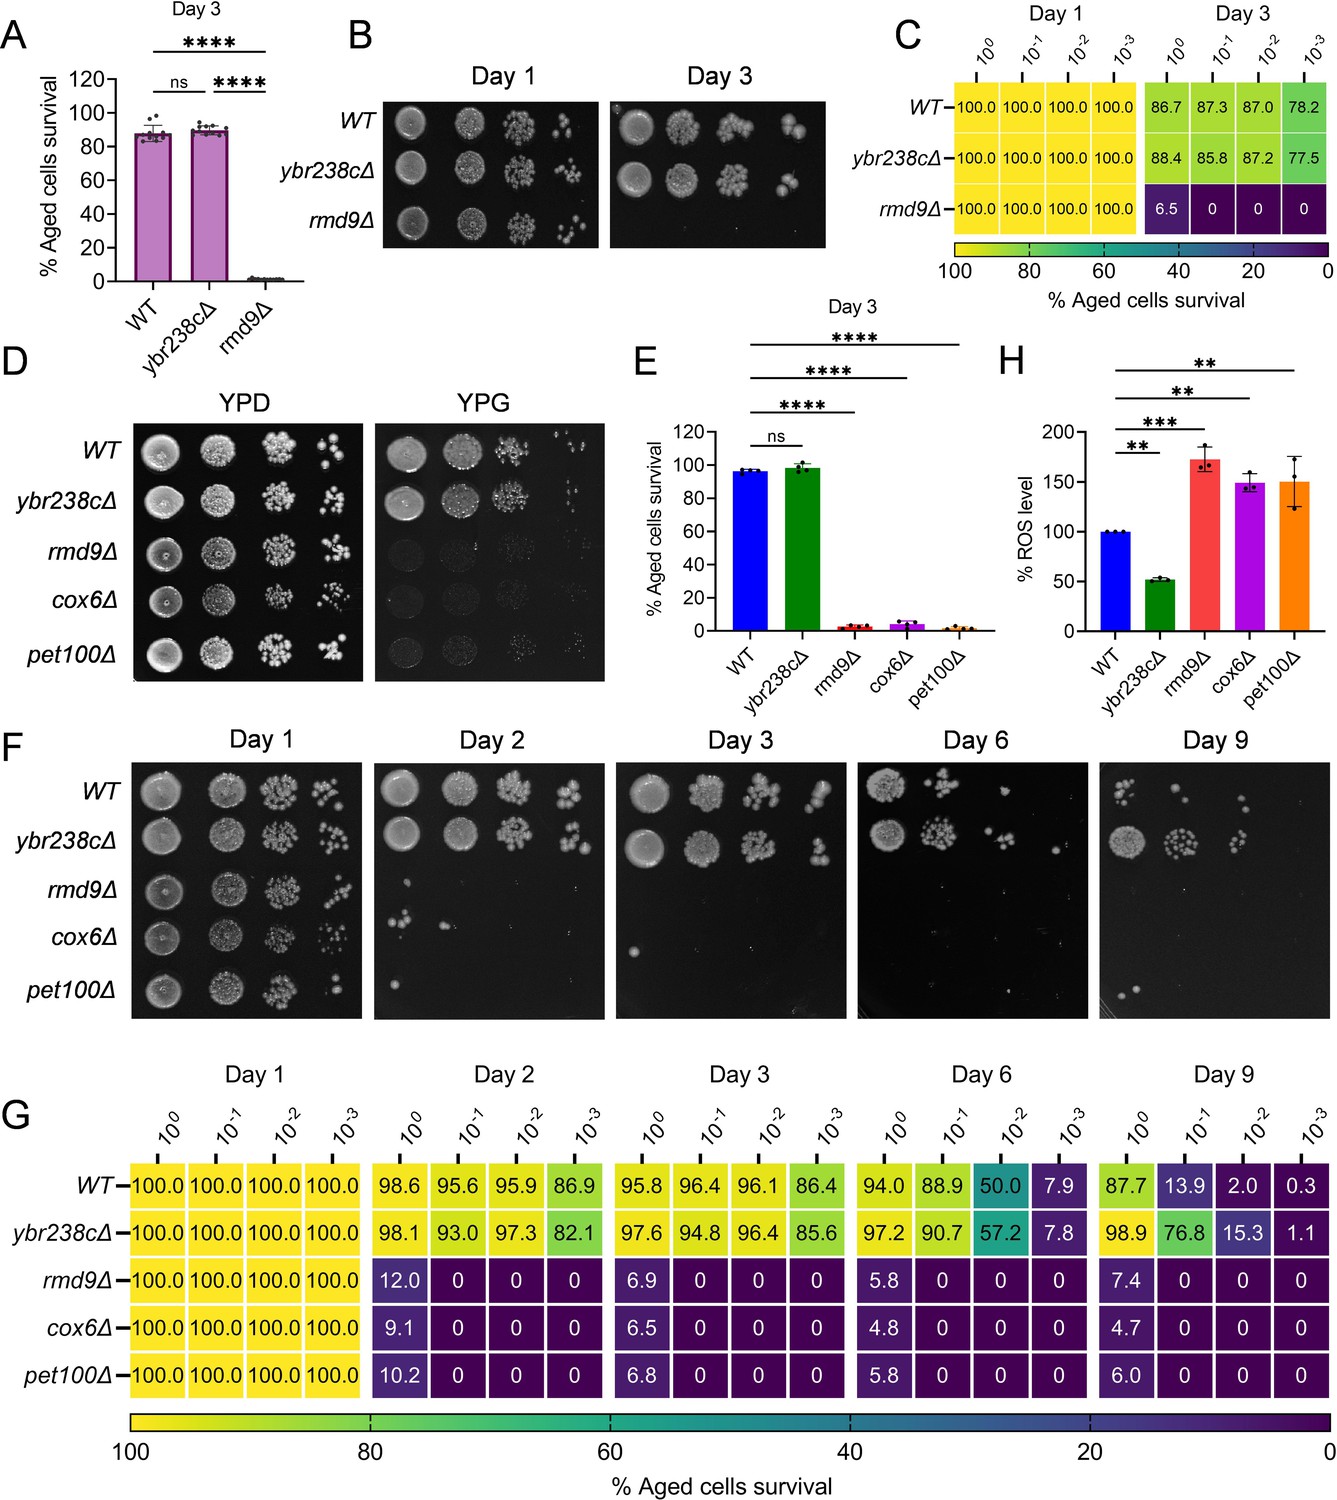
YBR238C homolog RMD9 deletion leads to mitochondrial dysfunction associated with accelerated cellular aging.
(A, E) Chronological lifespan (CLS) of yeast wild-type BY4743 and deletion strains was performed in synthetic defined medium supplemented with auxotrophic amino acids using 96-well plate. Aged cells survival was measured relative to the outgrowth of day 1. (A) Data are represented as means ± standard deviation (SD) (n = 12). ****p < 0.0001 based on two-way analysis of variance (ANOVA) followed by Tukey’s multiple comparisons test. (E) Data are represented as means ± SD (n = 4). ****p < 0.0001 based on ordinary one-way ANOVA followed by Dunnett’s multiple comparisons test. ns: non-significant. (B, C, F, G) CLS of yeast wild-type BY4743 and deletion strains was performed in synthetic defined medium supplemented with auxotrophic amino acids using the flask. Outgrowth was performed for 10-fold serial diluted aged cells onto the YPD agar plate (B, F) and YPD medium in the 96-well plate (C, G). The serial outgrowth of aged cells on agar medium was imaged (B, F) and quantified the survival relative to outgrowth of day 1 (C, G). A representative of two experiments for B, C, F, and G is shown. (D) Serial dilution growth assays of the yeast strains on fermentative glucose medium (YPD) and respiratory glycerol medium (YPG). (H) Reactive oxygen species (ROS) level of logarithmic-phase yeast wild-type BY4743 and deletion strains in synthetic defined medium supplemented with auxotrophic amino acids. Data are represented as means ± SD (n = 3). **p < 0.01 and ***P < 0.001 based on ordinary one-way ANOVA followed by Dunnett’s multiple comparisons test.
Figure 5

YBR238C affects cellular aging via RMD9-dependent mechanism.
(A, B, G, H) Chronological lifespan (CLS) of yeast Saccharomyces cerevisiae genetic background CEN.PK113-7D strains was performed in synthetic defined medium using flask. Outgrowth was performed for 10-fold serial diluted aged cells onto the YPD agar plate (A, G) and YPD medium in the 96-well plate (B, H). The serial outgrowth of aged cells on agar medium was imaged (A, G) and quantified the survival relative to outgrowth of day 2 (B, H). A representative of two experiments for A, B, G, and H is shown. (C, I) CLS of yeast strains was performed in synthetic defined medium using 96-well plate. Aged cells survival was measured relative to the outgrowth of day 2. Data are represented as means ± standard deviation (SD) (n = 6) (C) and (n = 12) (I). ****p < 0.0001 based on two-way analysis of variance (ANOVA) followed by Tukey’s multiple comparisons test (C) and Dunnett’s multiple comparisons test (I). ns: non-significant. (D, J) Adenosine triphosphate (ATP) level in yeast strains. Quantification was performed using ATP extracted from 72-hr stationary cultures grown in synthetic defined medium. Data are represented as means ± SD (n = 4). *p < 0.05, ***p < 0.001, and ****p < 0.0001 based on ordinary one-way ANOVA followed by Tukey’s multiple comparisons test. (E, K) Reactive oxygen species (ROS) level in yeast strains. Quantification was performed for logarithmic-phase cultures grown in synthetic defined medium. Data are represented as means ± SD (n = 3). **p < 0.01, ***p < 0.001, and ****p < 0.0001 based on ordinary one-way ANOVA followed by Tukey’s multiple comparisons test. ns: non-significant. (F) Expression analysis of RMD9 gene by quantitative reverse transcription-polymerase chain reaction (qRT-PCR) in yeast strains. qRT-PCR was performed using RNA extracted from logarithmic-phase cultures grown in synthetic defined medium. Data are represented as means ± SD (n = 4). ***p < 0.001 and ****p < 0.0001 based on ordinary one-way ANOVA followed by Tukey’s multiple comparisons test. (L) Effect of antimycin A (AMA) treatment on CLS of yeast strain was assessed in synthetic defined medium using 96-well plate. Aged cells survival was measured relative to the outgrowth of day 1. A representative heatmap data of three experiments is shown. (M) Model representing regulation of cellular aging by YBR238C via HAP4- and RMD9-dependent mechanisms.
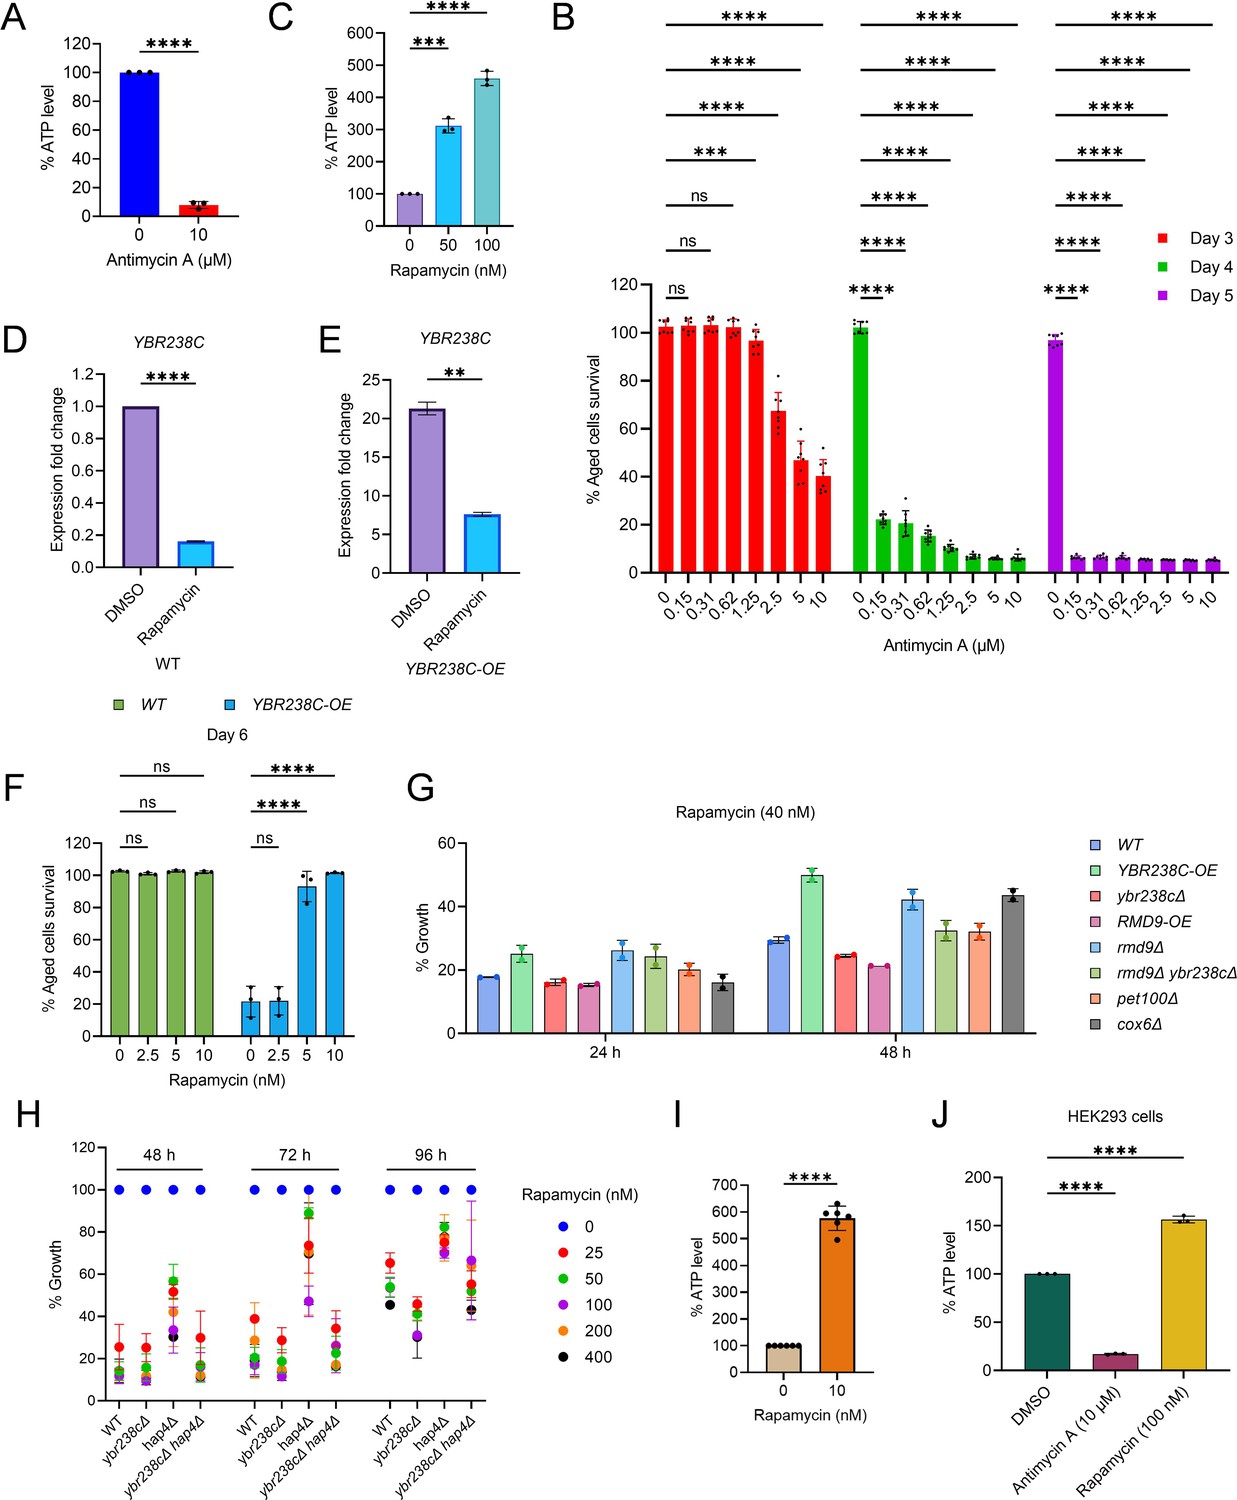
Figure 6 with 1 supplement
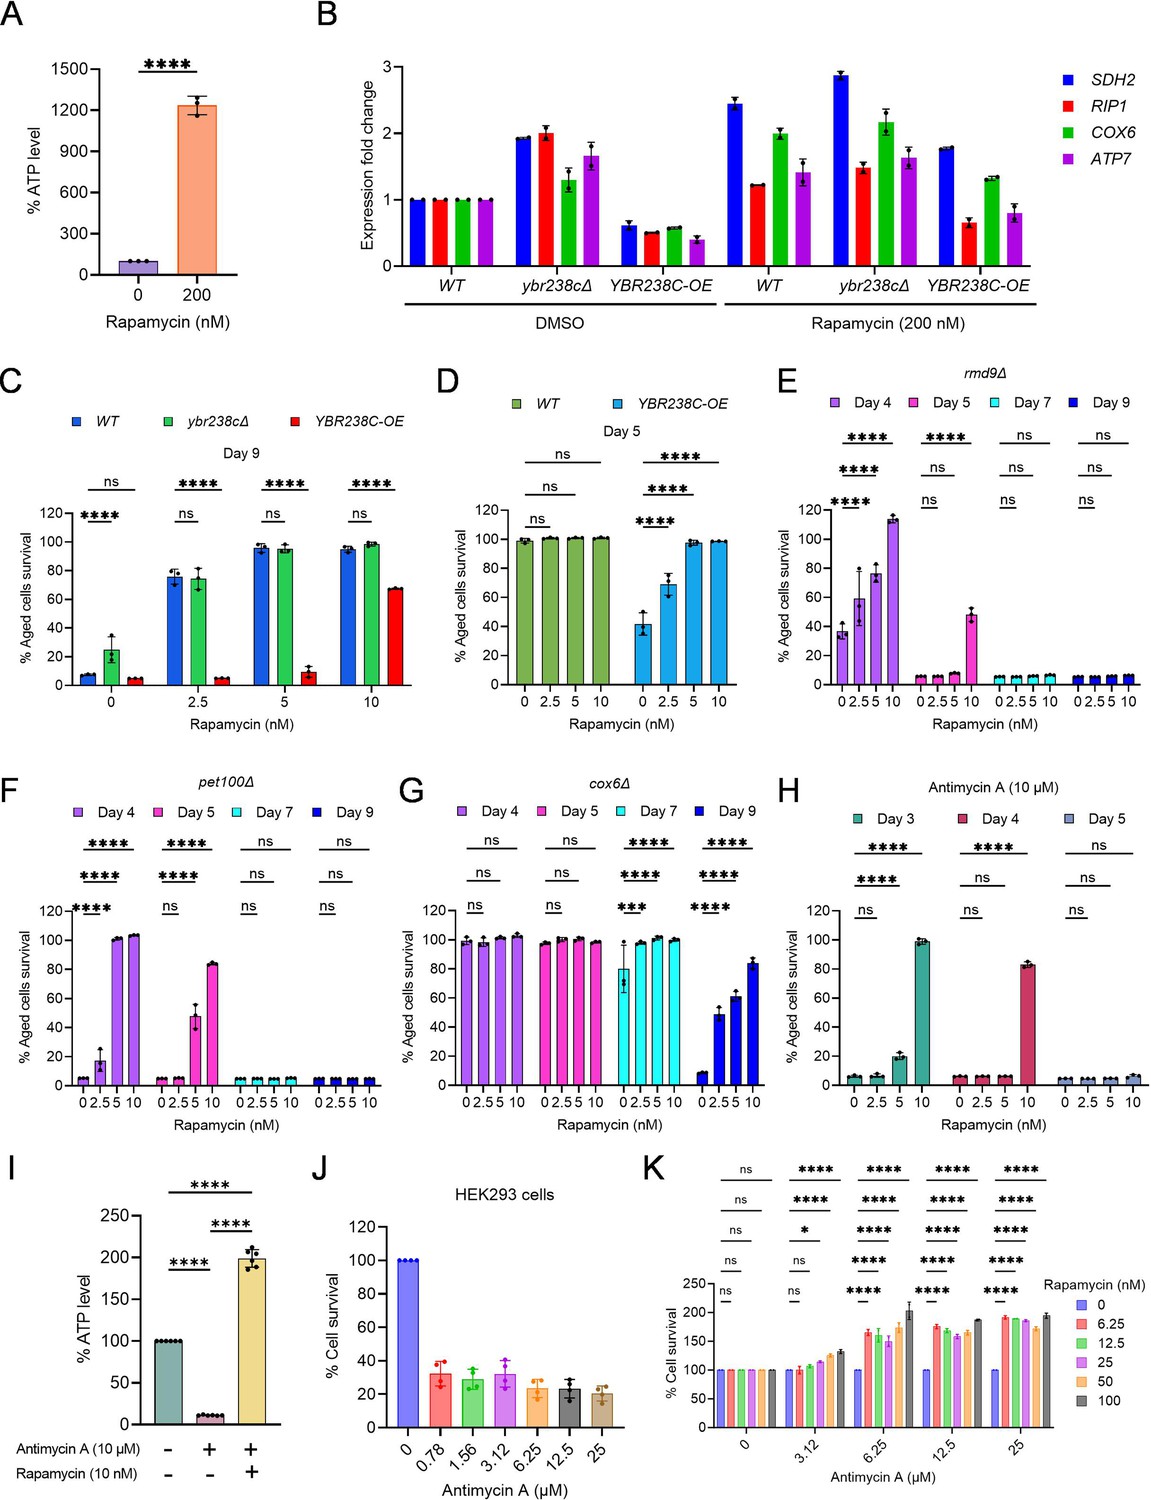
TORC1–MItochondria–TORC1 (TOMITO) signaling axis regulate cellular aging.
(A) Adenosine triphosphate (ATP) analysis of logarithmic-phase wild-type CEN.PK113-7D yeast cells treated with rapamycin for 1 hr in synthetic defined medium. Data are represented as means ± standard deviation (SD) (n = 3). ****p < 0.0001 based on ordinary one-way analysis of variance (ANOVA) followed by Dunnett’s multiple comparisons test. See also Figure 6—figure supplement 1C. (B) Expression analysis of mitochondrial ETC genes by quantitative reverse transcription-polymerase chain reaction (qRT-PCR). Analysis was performed using RNA extracted from logarithmic-phase wild-type CEN.PK113-7D yeast cell treated with rapamycin for 1 hr in synthetic defined medium. Data are represented as means ± SD (n = 2). (C–G) Chronological lifespan (CLS) of yeast strains with indicated concentrations of rapamycin was performed in synthetic defined medium using 96-well plate. Aged cells survival was measured relative to the outgrowth of day 2. Data are represented as means ± SD (n = 3). ***p < 0.001 and ****p < 0.0001 based on two-way ANOVA followed by Dunnett’s multiple comparisons test. ns: non-significant. (H) CLS of wild-type yeast strain with indicated concentrations of rapamycin and antimycin A (10 µM) was performed in synthetic defined medium using 96-well plate. Aged cells survival was measured relative to the outgrowth of day 1. Data are represented as means ± SD (n = 3). ****p < 0.0001 based on two-way ANOVA followed by Dunnett’s multiple comparisons test. ns: non-significant. (I) ATP analysis of stationary-phase wild-type CEN.PK113-7D yeast cells were incubated with rapamycin (10 nM) and antimycin A (10 µM) in synthetic defined medium. Data are represented as means ± SD (n = 6). ****p < 0.0001 based on ordinary one-way ANOVA followed by Tukey’s multiple comparisons test. See also Figure 6—figure supplement 1H. (J) Determination of human HEK293 cells survival incubated with indicated concentrations of antimycin A for 6 days. Untreated control is considered 100% cell survival. Cells survival was measured relative to the control. Data are represented as means ± SD (n = 6). (K) Cell survival analysis of human HEK293 cells incubated with indicated concentrations of antimycin A and rapamycin for 6 days. Antimycin A and rapamycin individual treated concentrations considered 100% cell survival control. Cells survival of combined treated cells was measured relative to the control. Data are represented as means ± SD (n = 2). *p < 0.05,****p < 0.0001, and ns: non-significant based on two-way ANOVA followed by Dunnett’s multiple comparisons test.
Figure 6—figure supplement 1
Target of Rapamycin Complex 1 (TORC1)–mitochondrial function signaling pathways control cellular aging.
Adenosine triphosphate (ATP) analysis of wild-type CEN.PK113-7D yeast cells treated with (A) antimycin A (72-hr stationary-phase culture) and (C) rapamycin (logarithmic-phase culture) in synthetic defined medium. Data are represented as means ± standard deviation (SD) (n = 3). ***p < 0.001 and ****p < 0.0001 based on ordinary one-way analysis of variance (ANOVA) followed by Dunnett’s multiple comparisons test. (C) See also Figure 6A. (B) Chronological lifespan (CLS) of wild-type CEN.PK113-7D yeast strain with indicated concentrations of antimycin A was performed in the synthetic defined medium in 96-well plate. Aged cells survival was measured relative to the outgrowth of day 1. Data are represented as means ± SD (n = 8). ***p < 0.001 and ****p < 0.0001 based on two-way ANOVA followed by Dunnett’s multiple comparisons test. ns: non-significant. (D, E) Expression analysis by quantitative reverse transcription-polymerase chain reaction (qRT-PCR) for YBR238Cof logarithmic-phase yeast CEN.PK113-7D strains treated with rapamycin (200 nM) for 1 hr in synthetic defined medium. Data are represented as means ± SD (n = 2). **p < 0.01 and ****p < 0.0001 based on two-sided Student’s t-test. (F) CLS of yeast CEN.PK113-7D strains with indicated concentrations of rapamycin was performed in synthetic defined medium using 96-well plate. Aged cells survival was measured relative to the outgrowth of day 2. Data are represented as means ± SD (n = 3). ****p < 0.0001 based on two-way ANOVA followed by Dunnett’s multiple comparisons test. ns: non-significant. See also Figure 6D. (G) Growth assay of yeast CEN.PK113-7D strains with rapamycin (40 nM) for 24 and 48 hr in synthetic defined medium. Growth was normalized with untreated control. (H) Growth assay of yeast CEN.PK113-7D strains with indicated concentrations of rapamycin for 48, 72, and 96 hr in synthetic defined medium. Growth was normalized with untreated control. (I) ATP analysis of stationary-phase wild-type CEN.PK113-7D yeast cells in synthetic defined medium incubated with 10 nM rapamycin. Data are represented as means ± SD (n = 6). ****p < 0.0001 based on ordinary one-way ANOVA followed by Tukey’s multiple comparisons test. (J) ATP analysis of human HEK293 cells treated with antimycin A (10 µM) and rapamycin (100 nM) for 48 hr. Data are represented as means ± SD (n = 3). ****p < 0.0001 based on ordinary one-way ANOVA followed by Tukey’s multiple comparisons test.
Tables
Table 1
Numbers of known aging-associated genes (AAGs) reported in the scientific literature to affect (increase/decrease chronological lifespan [CLS]/replicative lifespan [RLS]) under a variety of conditions.
The gene lists were extracted, after processing, from downloaded files (as of November 8, 2022) using the databases SGD (Engel et al., 2022) and GenAge (Townes et al., 2020). The actual gene lists are available in Figure 1—source data 1. The signs ‘+’ and ‘−’ indicate that the respective annotation property is present or missing in that group of genes. We present the total number of genes in each category as the number of, as a trend, severely understudied/uncharacterized genes among those. The columns ‘RUG’ and ‘RDG’ show the numbers of rapamycin-up- and -downregulated genes in each of the 15 categories.
| Category | CLS increase | CLS decrease | RLS increase | RLS decrease | Number of genes | Understudied genes | RUG | RDG |
|---|---|---|---|---|---|---|---|---|
| 1 | + | − | − | − | 328 | 20 | 68 | 62 |
| 2 | − | + | − | − | 615 | 22 | 108 | 73 |
| 3 | − | − | + | − | 349 | 19 | 73 | 64 |
| 4 | − | − | − | + | 318 | 15 | 43 | 56 |
| 5 | + | + | − | − | 108 | 0 | 17 | 18 |
| 6 | + | − | + | − | 72 | 2 | 12 | 26 |
| 7 | + | − | − | + | 72 | 3 | 9 | 18 |
| 8 | − | + | + | − | 120 | 3 | 14 | 28 |
| 9 | − | + | − | + | 180 | 0 | 24 | 34 |
| 10 | − | − | + | + | 59 | 0 | 8 | 14 |
| 11 | + | + | + | − | 29 | 1 | 7 | 7 |
| 12 | + | + | − | + | 45 | 1 | 7 | 9 |
| 13 | + | − | + | + | 30 | 1 | 2 | 11 |
| 14 | − | + | + | + | 55 | 1 | 5 | 11 |
| 15 | + | + | + | + | 19 | 0 | 0 | 2 |
Additional files
Download links
A two-part list of links to download the article, or parts of the article, in various formats.
Downloads (link to download the article as PDF)
Open citations (links to open the citations from this article in various online reference manager services)
Cite this article (links to download the citations from this article in formats compatible with various reference manager tools)
Uncharacterized yeast gene YBR238C, an effector of TORC1 signaling in a mitochondrial feedback loop, accelerates cellular aging via HAP4- and RMD9-dependent mechanisms
eLife 12:RP92178.
https://doi.org/10.7554/eLife.92178.3


