Maturation and detoxification of synphilin-1 inclusion bodies regulated by sphingolipids
- State Key Laboratory of Subtropical Silviculture, Zhejiang A&F University, China
- Department of Chemistry and Molecular Biology, University of Gothenburg, Sweden
- Functional Biology, KU Leuven, Belgium
- Guangzhou National Laboratory, Guangzhou, China
Figures
Figure 1
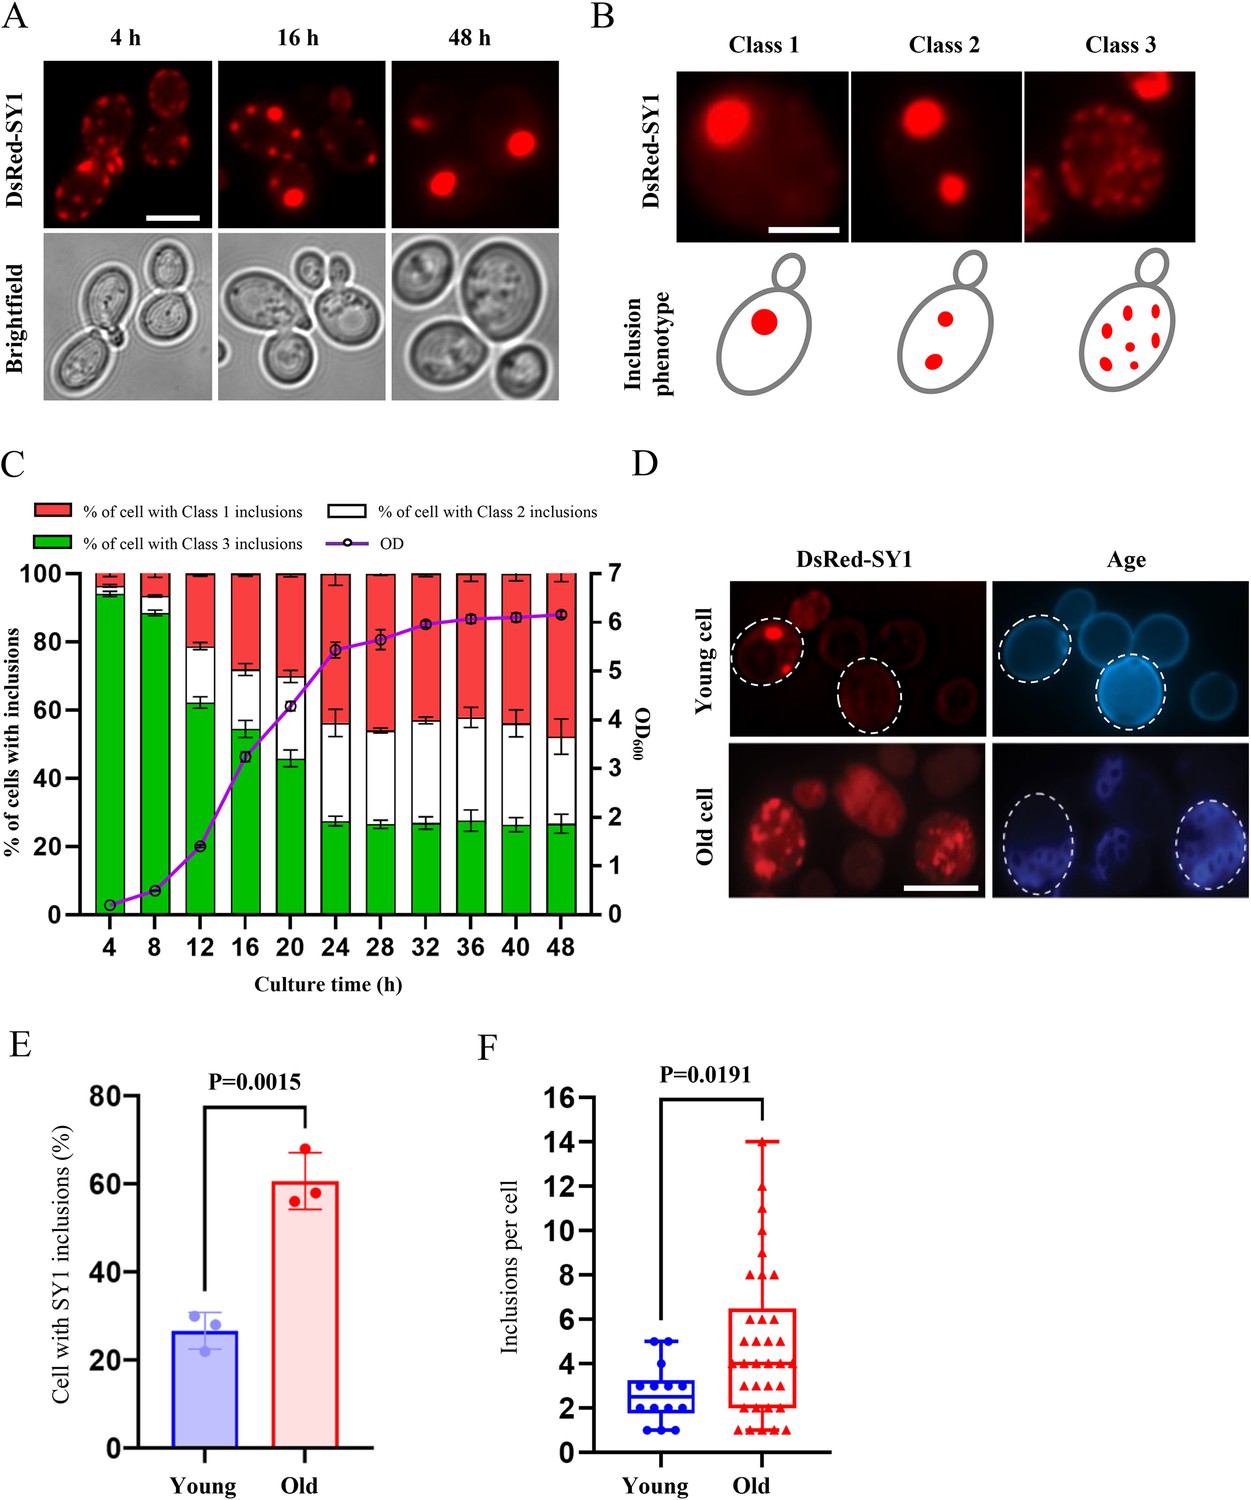
SY1 aggregates mature into large IBs over time in normal cells, but this process is defective in aged cells.
(A) The maturation process of SY1 aggregates in yeast cells from scattered small aggregates to large single IBs over time. DsRed-SY1 was expressed in yeast with the constitutive promoter TPI1, the phenotype of SY1 aggregates was visualized at 4 hr, 16 hr and 48 hr. Scale bar = 2 μm. (B) Cells with different phenotypes of SY1 IBs are defined as three classes: Class 1 refers to only one IB in a cell, Class 2 refers to two IBs in a cell, and Class 3 indicates three or more IBs in a cell. Scale bar = 2 μm. (C) Time-course study showing that SY1 aggregates mature after 24 hr of cultivation, when the cells have traversed the diauxic shift to enter the respiratory and stationary growth phase. IBs were examined every 4 hr from 4 to 48 hr; green bars indicate percentage of Class 3; white bars indicate percentage of Class 2; red bars indicate percentage of Class 1; the purple curve indicates the optical density of the cell culture, indicated by the vertical axis on the right. Error bars indicate the SD, n=3 biological replicates. (D) Maturation of SY1 IBs was defective in old yeast cells. Scale bar = 5 μm. (E) The proportion of cells with SY1 IBs was increased in old cells (61%) compared to young cells (27%). Data were analyzed using the Student’s t-test. Error bars indicate the SD, n=3 biological replicates. (F) The number of SY1 IBs in a cell was increased in young cells (2.64±1.29) versus old cells (4.91±3.32). Data were analyzed using the Student’s t-test. Error bars indicate the SD, Young n=14, Old n=34 biological replicates.
Figure 2 with 1 supplement

Genome-wide high-content imaging screen identifying the serine C-palmitoyltransferase complex (SPT) as a modulator of SY1 inclusion maturation.
(A) Schematic workflow for identifying mutants that regulate SY1 inclusion maturation. (B) The GO enrichment analysis of genes whose mutants exhibited increased SY1 Class 3 aggregates (ClueGO, cut-off: p<0.05). (C) The network of the most enriched modules obtained above in 2B. (D–E) The increased SY1 Class 3 aggregates in the SPT mutant (lcb1-4, lcb2-1, tsc3-2) were rescued by backer-introducing the corresponding wild-type gene (a MoBY plasmid carries a WT gene, and p5472 is the empty vector control). Representative images from three independent experiments are shown in D, and quantifications were shown in E. Scale bar = 2 μm. Data were analyzed using the Student’s t-test. Error bars indicate the SD, n=3 biological replicates.
Figure 2—figure supplement 1
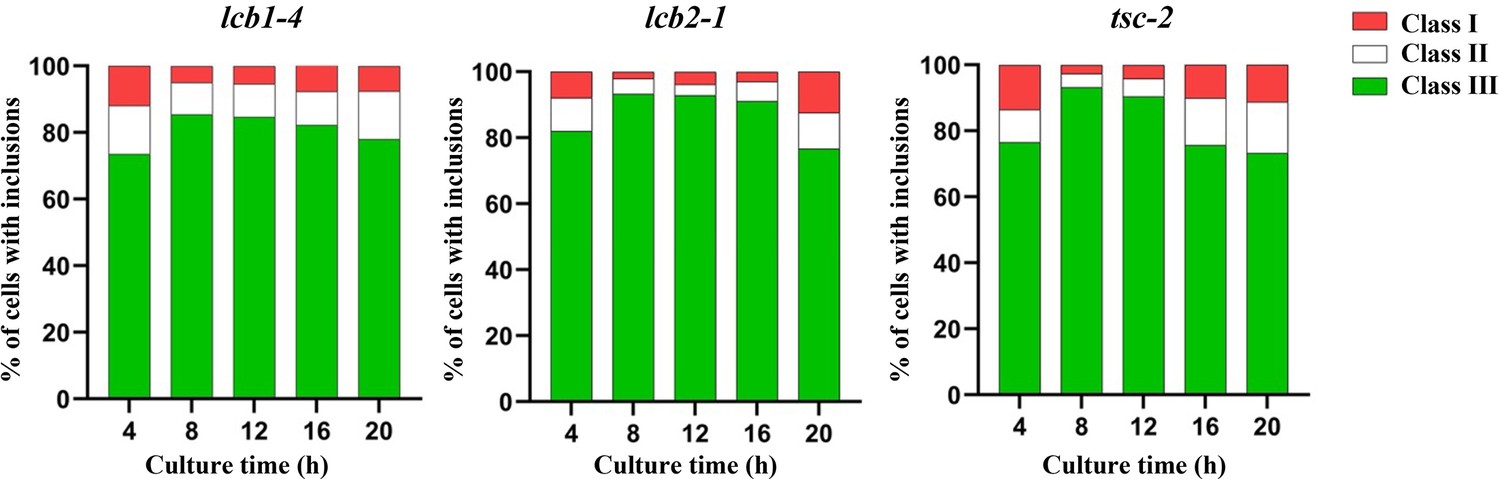
The time course of SY1 IB maturation in the SPT mutants.
SPT mutants (lcb1-4, lcb2-1, tsc3-2) expressing the pYX212-DsRed-SY1 plasmid were harvested and observed every 4 hr.
Figure 3
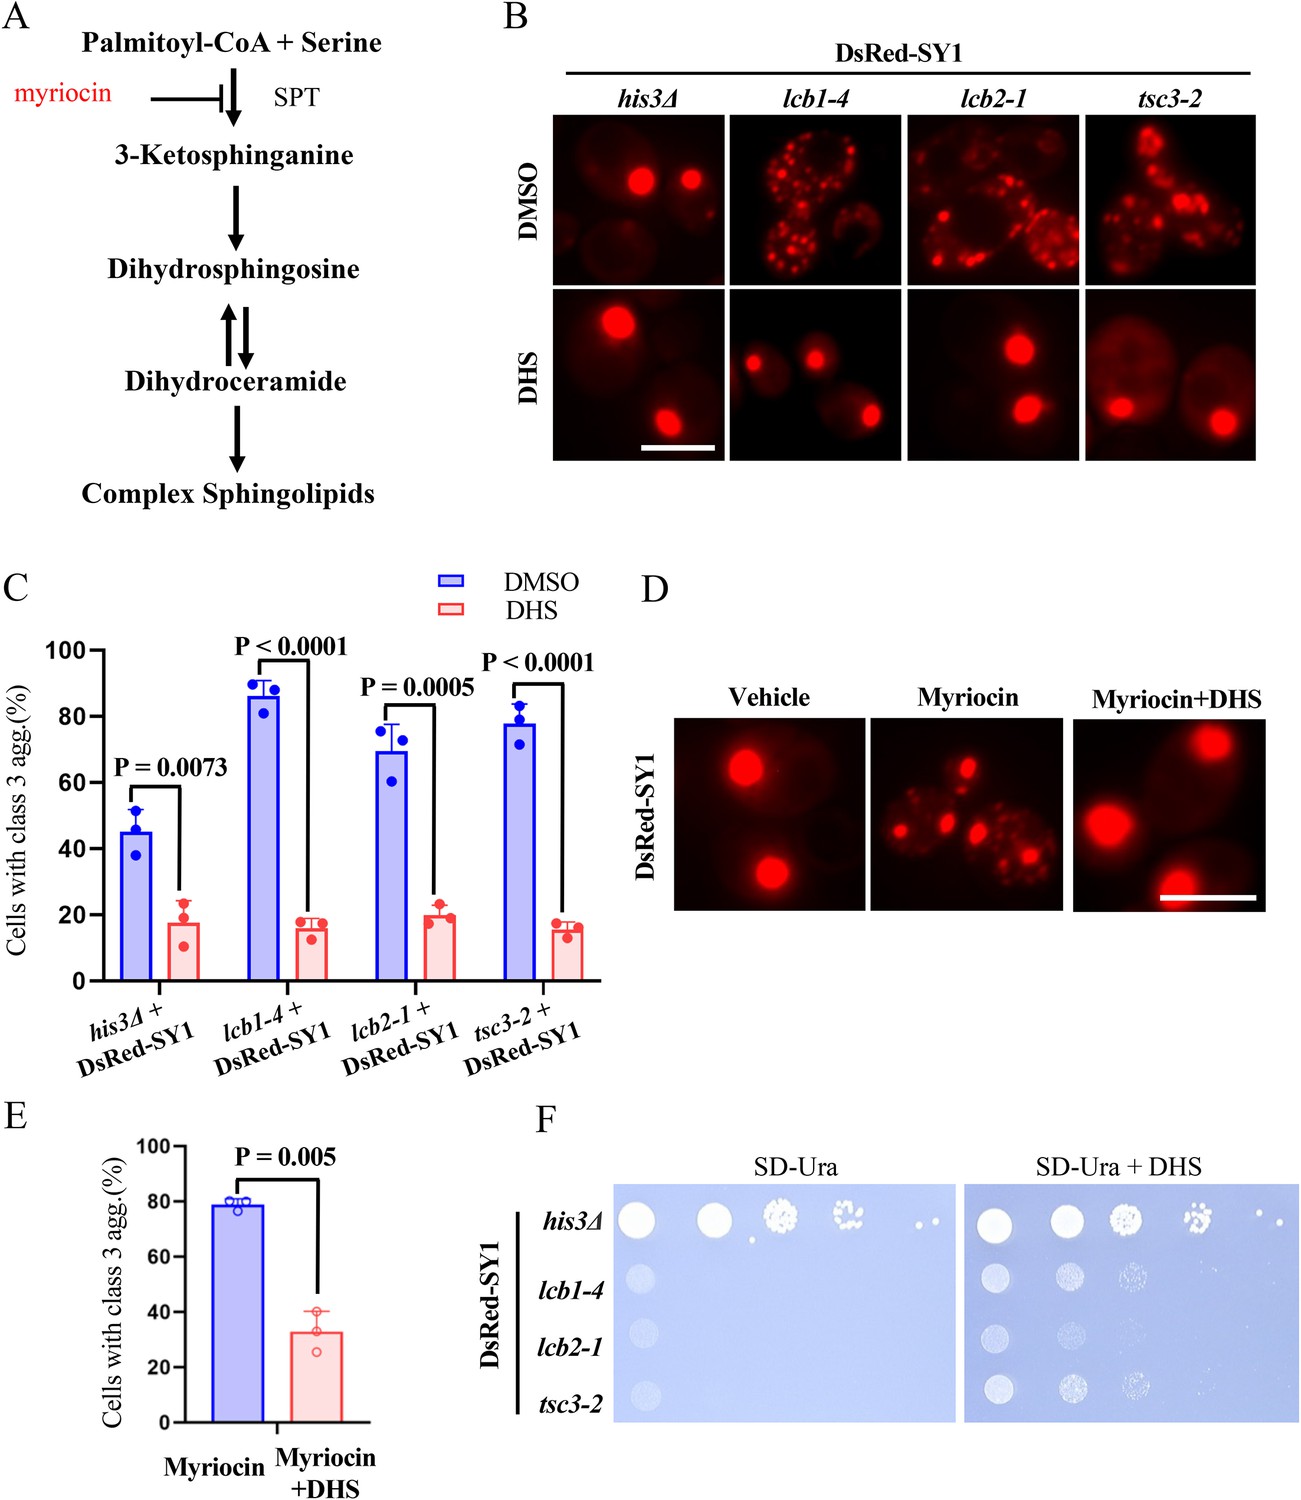
Sphingolipids regulate SY1 IB maturation and cytotoxicity in yeast cells.
(A) A schematic diagram of the sphingolipid pathway in yeast cells. Myriocin blocks sphingolipid synthesis via inhibition of the serine C-palmitoyltransferase (SPT) complex. (B–C) Dihydrosphingosine (DHS) supplementation rescued the deficiency of SY1 IBs maturation in SPT mutants (lcb1-4, lcb2-1, tsc3-2). Representative images from three independent experiments are shown in B, and quantifications are shown in C. Scale bar = 2 μm. Data were analyzed using the Student’s t-test. Error bars indicate the SD, n=3 biological replicates. (D–E) Blocking intracellular sphingolipid synthesis with myriocin resulted in defective maturation of SY1 IBs, and exogenous addition of DHS could reverse the effect of myriocin. Representative images from three independent experiments are shown in D, and quantifications are shown in E. Scale bar = 2 μm. Data were analyzed using the Student’s t-test. Error bars indicate the SD, n=3 biological replicates. (F) DHS ameliorated the cytotoxicity of SY1 in SPT mutants (lcb1-4, lcb2-1, tsc3-2).
Figure 4 with 2 supplements
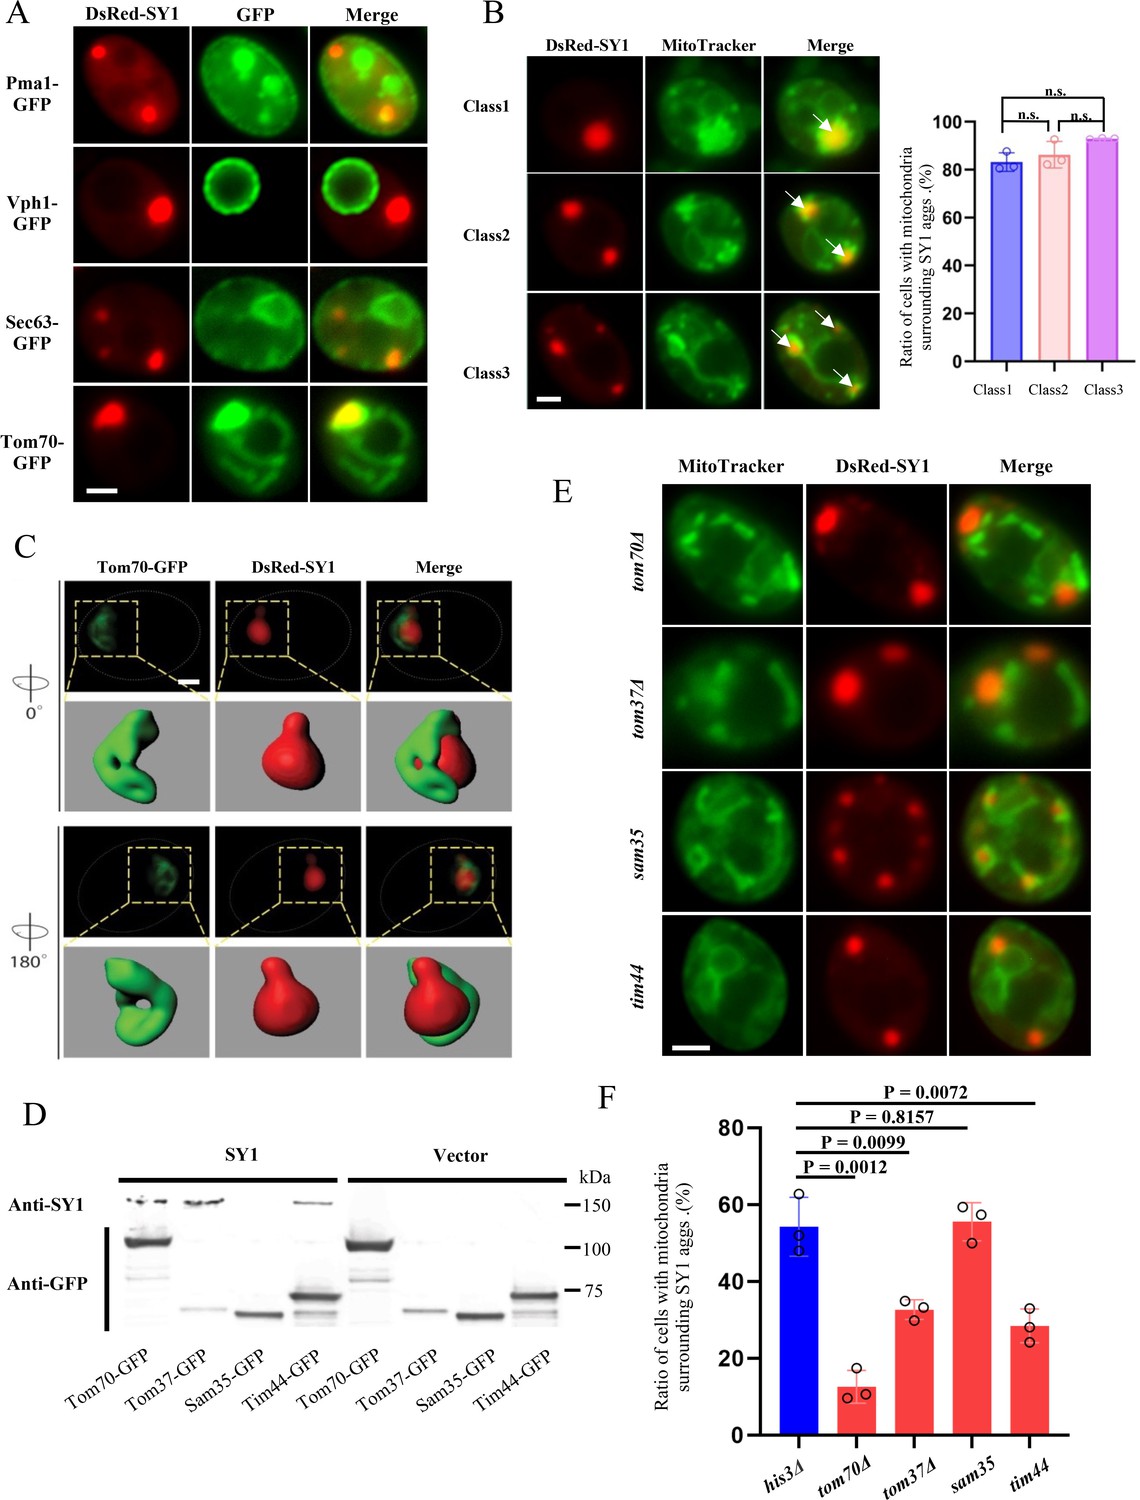
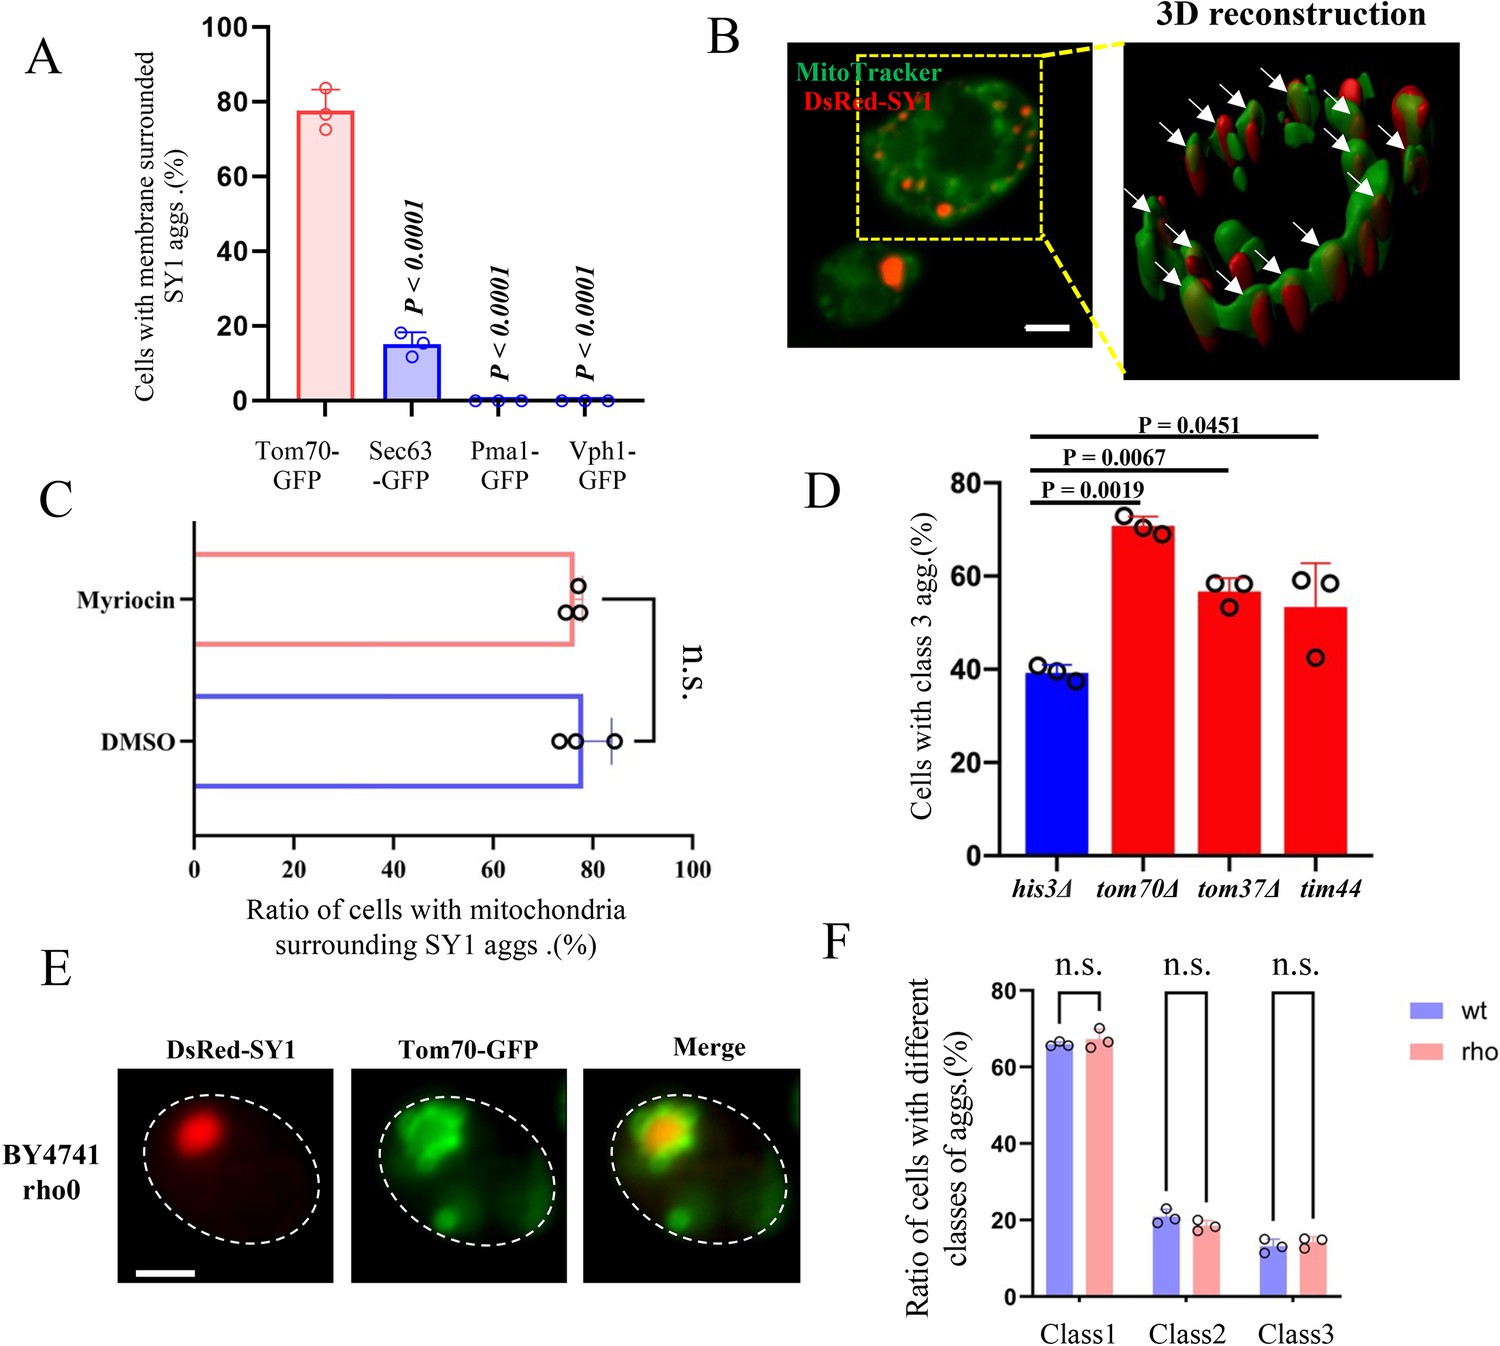
SY1 IBs associate with mitochondria in yeast cells.
(A) SY1 IBs had no obvious association with the plasma membrane (Pma1-GFP), vacuoles (Vph1-GFP), or ER (Sec63-GFP), but were strongly associated with mitochondria (Tom70-GFP) (See also Figure 4—figure supplement 1A). Scale bar = 2 μm. (B) MitoTracker probe confirmed that all the three classes of IBs were closely associated with mitochondria (arrow heads indicate SY1 aggregates surrounded by mitochondria). Scale bar = 2 μm. n.s., not statistically significant. Data were analyzed using the Student’s t-test. Error bars indicate the SD, n=3 biological replicates. (C) Super-resolution microscopy and 3D-SIM construction demonstrated that the SY1 IBs are packed and surrounded by mitochondria. Scale bar = 1 μm. (D) Co-immunoprecipitation assays showing that SY1 physically binds to several mitochondrial membrane proteins, including Tom70, Tom37, and Tim44. The yeast mitochondrial membrane proteins Tom70, Tom37, Sam35, and Tim44 were individually C-terminally tagged with GFP, and the strains were then transformed with a control plasmid (Vector) or a SY1-overproducing plasmid (SY1), respectively. Cells were grown for 24 hr and harvested for subsequent IP experiments. (E–F) The association of SY1 IBs with mitochondria decreases when the physical interaction between SY1 and mitochondrial membrane proteins is disrupted (tom70Δ, tom37Δ, tim44). Representative images from three independent experiments are shown in E and quantifications are shown in F. Scale bar = 2 μm. Data were analyzed using the Student’s t-test. Error bars indicate the SD, n=3 biological replicates.
-
Figure 4—source data 1
PDF file containing original western blot for Figure 4D, indicating the relevant bands.
- https://cdn.elifesciences.org/articles/92180/elife-92180-fig4-data1-v1.pdf
-
Figure 4—source data 2
Original file for western blot analysis displayed in Figure 4D.
- https://cdn.elifesciences.org/articles/92180/elife-92180-fig4-data2-v1.zip
Figure 4—figure supplement 1
Statistics of SY1 IBs surrounded by cellular organelles.
(A) Statistics of the proportion of SY1 IBs surrounded by different organelles, corresponding to Figure 4A. Data were analyzed using the Student’s t-test. Error bars indicate the SD, n=3 biological replicates. (B) The 3D reconstruction using Imaris software to demonstrate the interrelationship between SY1 Class 3 aggregates and mitochondria (arrow heads indicate SY1 aggregates surrounded by mitochondria). BY4741 cells expressing DsRed-SY1 and mitochondria were stained using MitoTracker green dye. Scale = 2 μm. (C) Statistics of the proportion of SY1 IBs surrounded by mitochondria in myriocin treatment and the DMSO treatment control. n.s., not statistically significant. Data were analyzed using the Student’s t-test. Error bars indicate the SD, n=3 biological replicates. (D) Statistics of the proportion of Cells with SY1 Class 3 aggregates in tom70Δ, tom37Δ, and tim44 mutants. Data were analyzed using the Student’s t-test. Error bars indicate the SD, n=3 biological replicates. (E) SY1 IBs are surrounded by mitochondria in the rho0 strain. Mitochondria of the rho0 strain were labeled with Tom70-GFP and photographed after expression of the pYX212-DsRed-SY1 plasmid. Scale = 2 μm. (F) Statistics of the proportion of three different classes of SY1 IBs in BY4741 wild-type and rho0 strains, and there is no significant difference between two strains. n.s., not statistically significant. Data were analyzed using the Student’s t-test. Error bars indicate the SD, n=3 biological replicates.
Figure 4—figure supplement 2
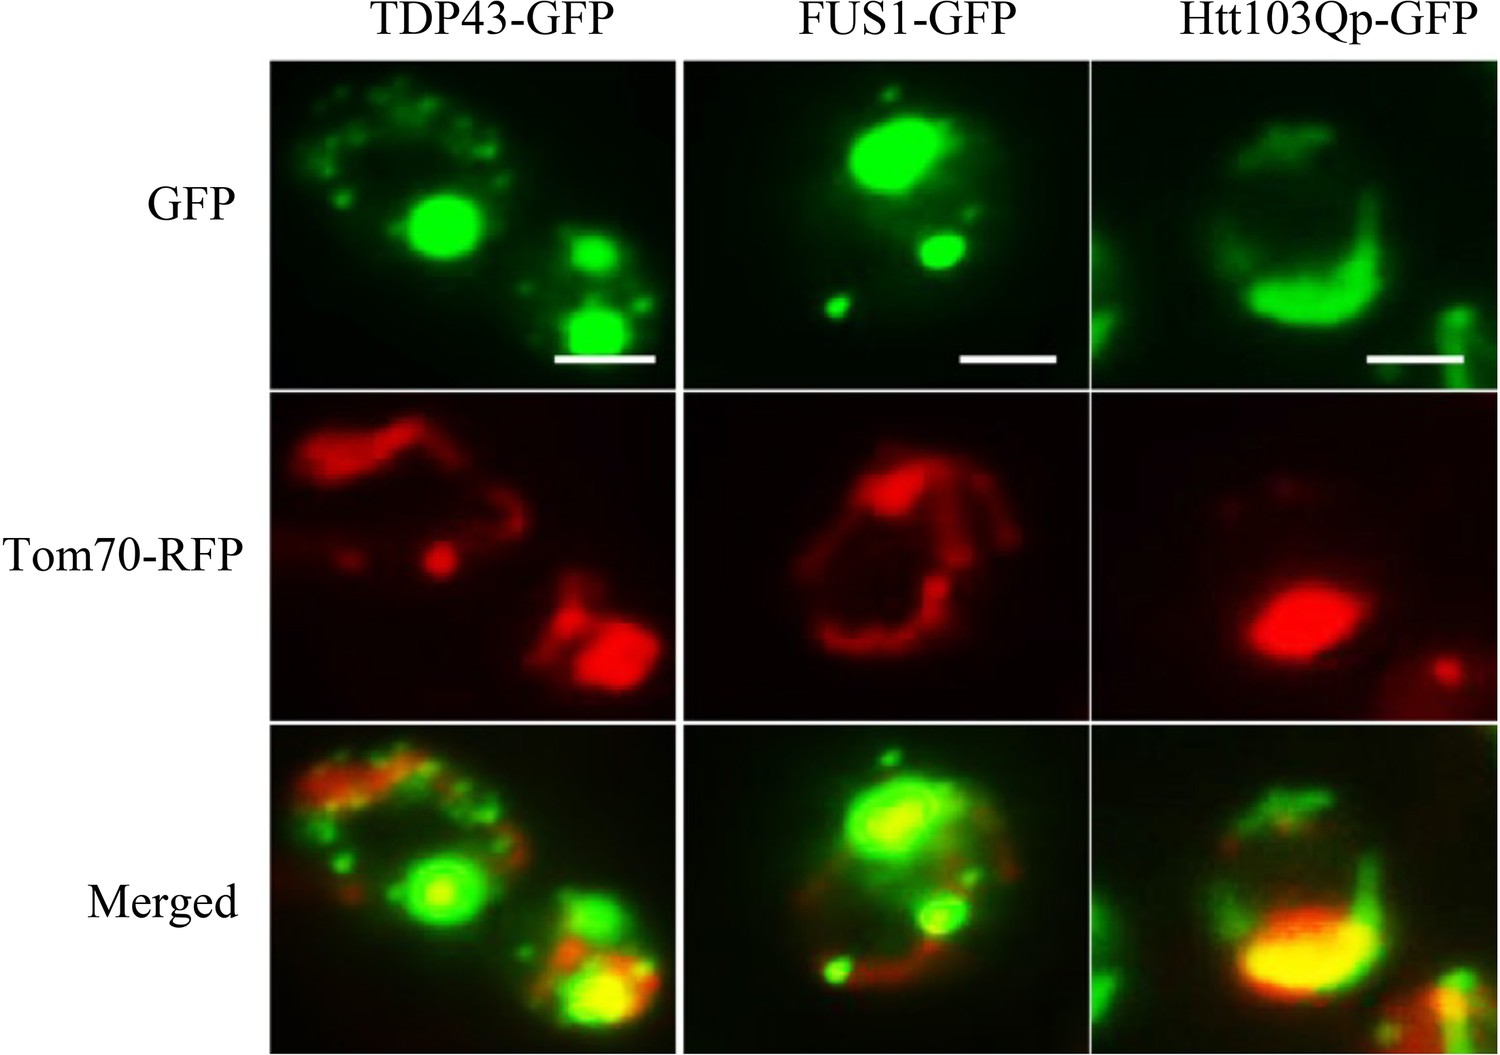
IBs of TDP43, FUS1, and Htt103Qp interact with mitochondria.
Shown are the IBs formed by TDP43, FUS1, and Htt103Qp when fused to GFP and their co-localization with Tom70, which was genomically tagged with RFP. Scale = 2 μm.
Figure 5 with 2 supplements
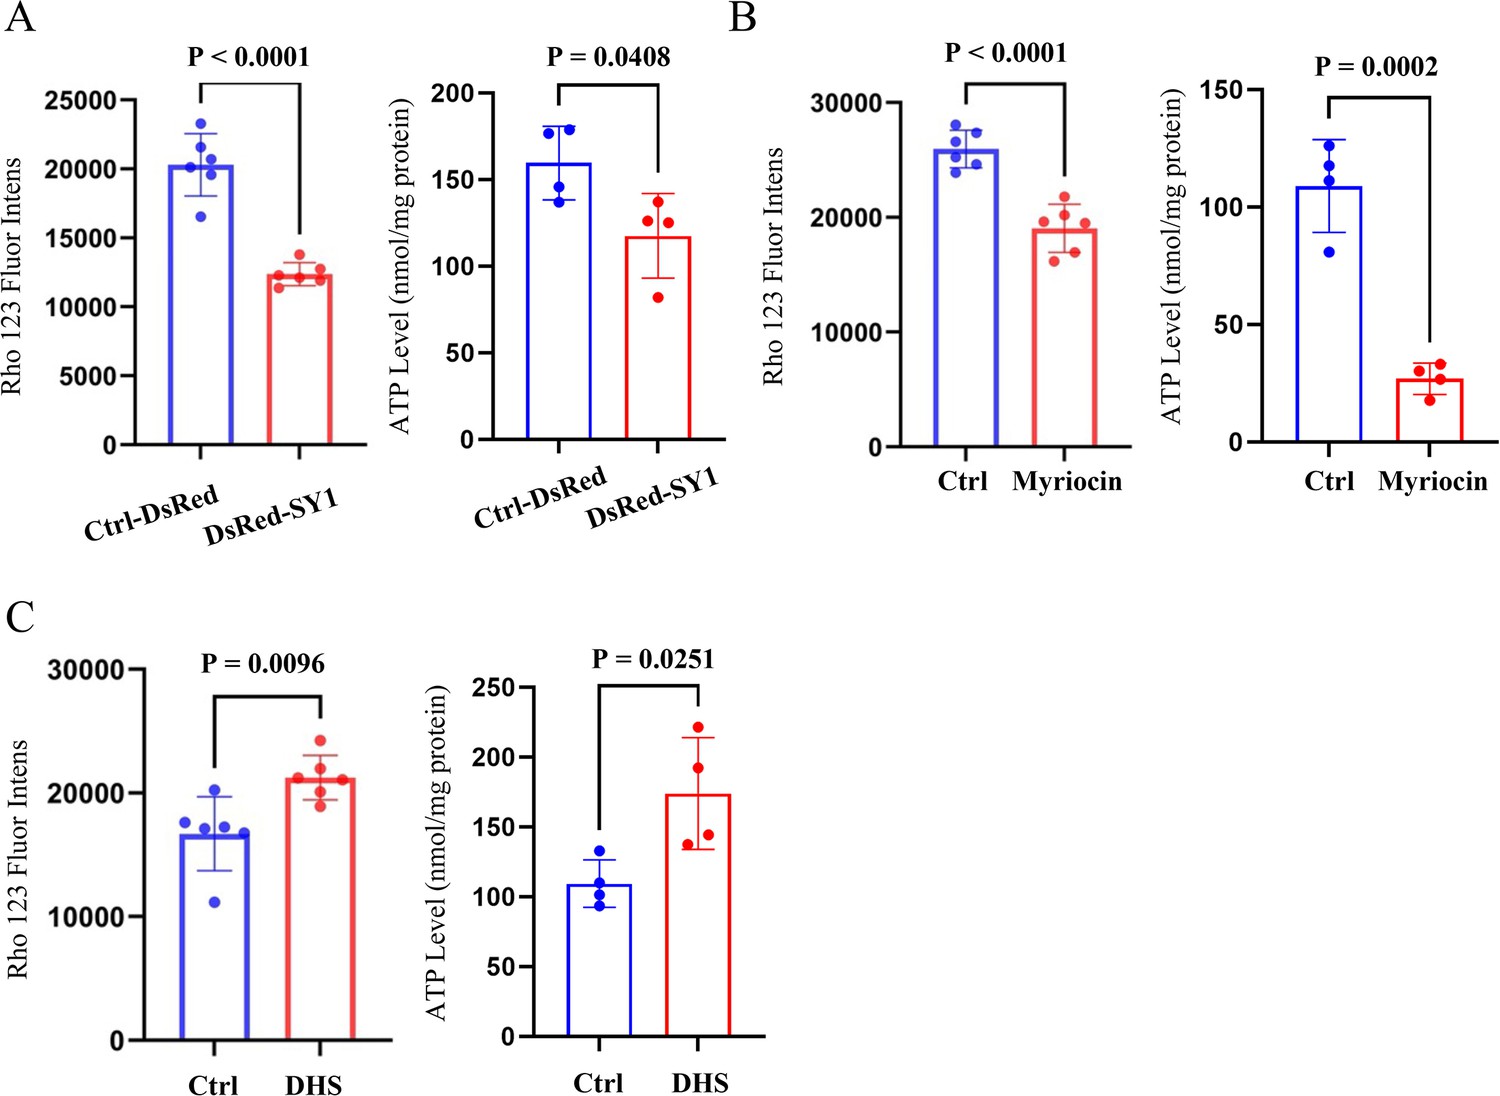
Sphingolipids regulate SY1-induced mitochondrial toxicity in yeast cells.
(A) Overexpression of SY1 decreased mitochondrial membrane potential (indicated by Rho 123 fluor intensity) and reduced cell viability (indicated by ATP level) in yeast cells. Data were analyzed using the Student’s t-test. Error bars indicate the SD, n=4-6 biological replicates. (B) Effects of myriocin treatment on SY1 cytotoxicity in yeast cells as judged by mitochondrial membrane potential and cell viability. Data were analyzed using the Student’s t-test. Error bars indicate the SD, n=4-6 biological replicates. (C) Effects of exogenous addition of DHS on SY1 cytotoxicity in yeast cells based on mitochondrial membrane potential and cell viability. Data were analyzed using the Student’s t-test. Error bars indicate the SD, n=4-6 biological replicates.
Figure 5—figure supplement 1
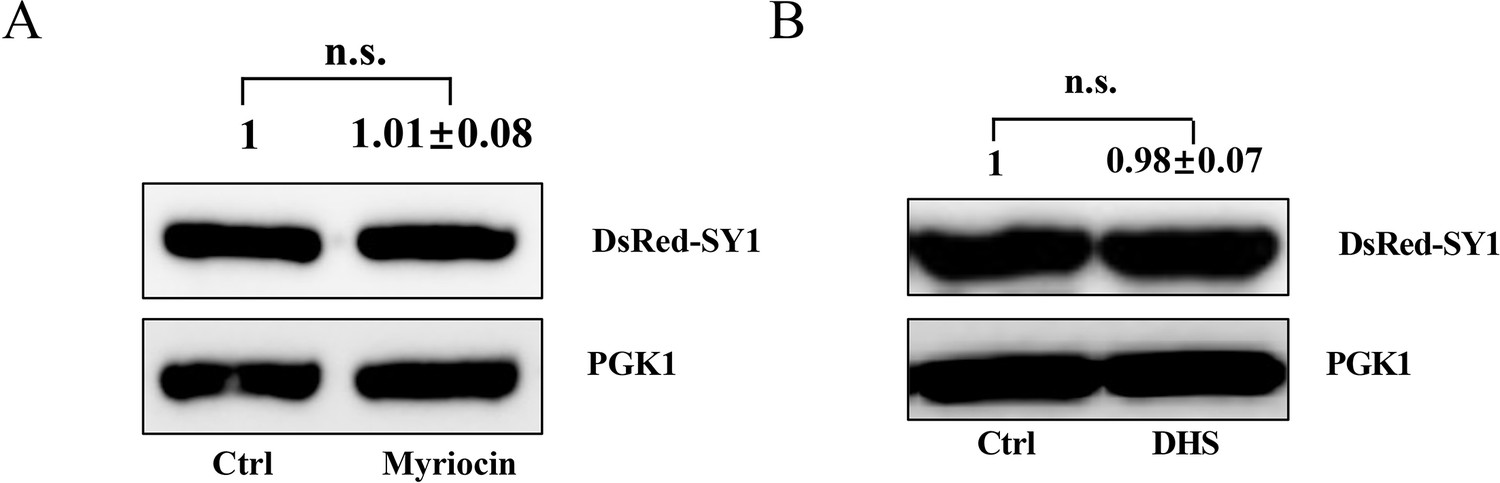
The effect of myriocin (A) and DHS (B) treatment on SY1 protein expression in yeast cells.
SY1 expression was examined by western blot analysis in samples prepared from cells used in the experiments corresponding to Figure 5B and C respectively. n.s., not statistically significant. Data were analyzed using the Student’s t-test, n=3 biological replicates.
-
Figure 5—figure supplement 1—source data 1
PDF file containing original western blot for Figure 5—figure supplement 1A and B, indicating the relevant bands.
- https://cdn.elifesciences.org/articles/92180/elife-92180-fig5-figsupp1-data1-v1.pdf
-
Figure 5—figure supplement 1—source data 2
Original files for western blot analysis displayed in Figure 5—figure supplement 1A and B.
- https://cdn.elifesciences.org/articles/92180/elife-92180-fig5-figsupp1-data2-v1.zip
Figure 5—figure supplement 2
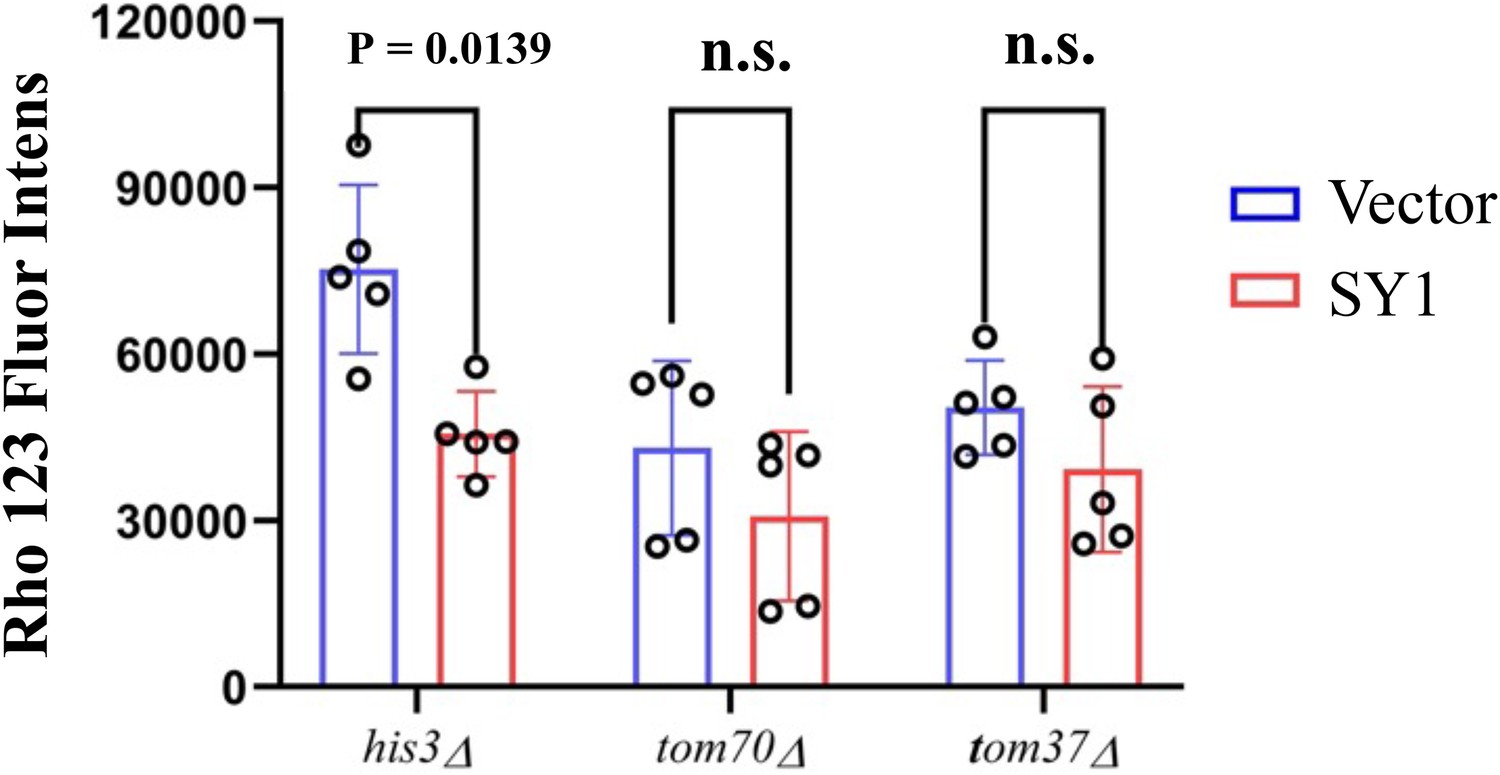
SY1-induced mitochondrial toxicity decreased in tom70Δ and tom37Δ cells.
Mitochondrial membrane potential was examined by expressing SY1 in his3Δ, tom70Δ, and tom37Δ strains. n.s., not statistically significant. Data were analyzed using the Student’s t-test. Error bars indicate the SD, n=5 biological replicates.
Figure 6 with 3 supplements
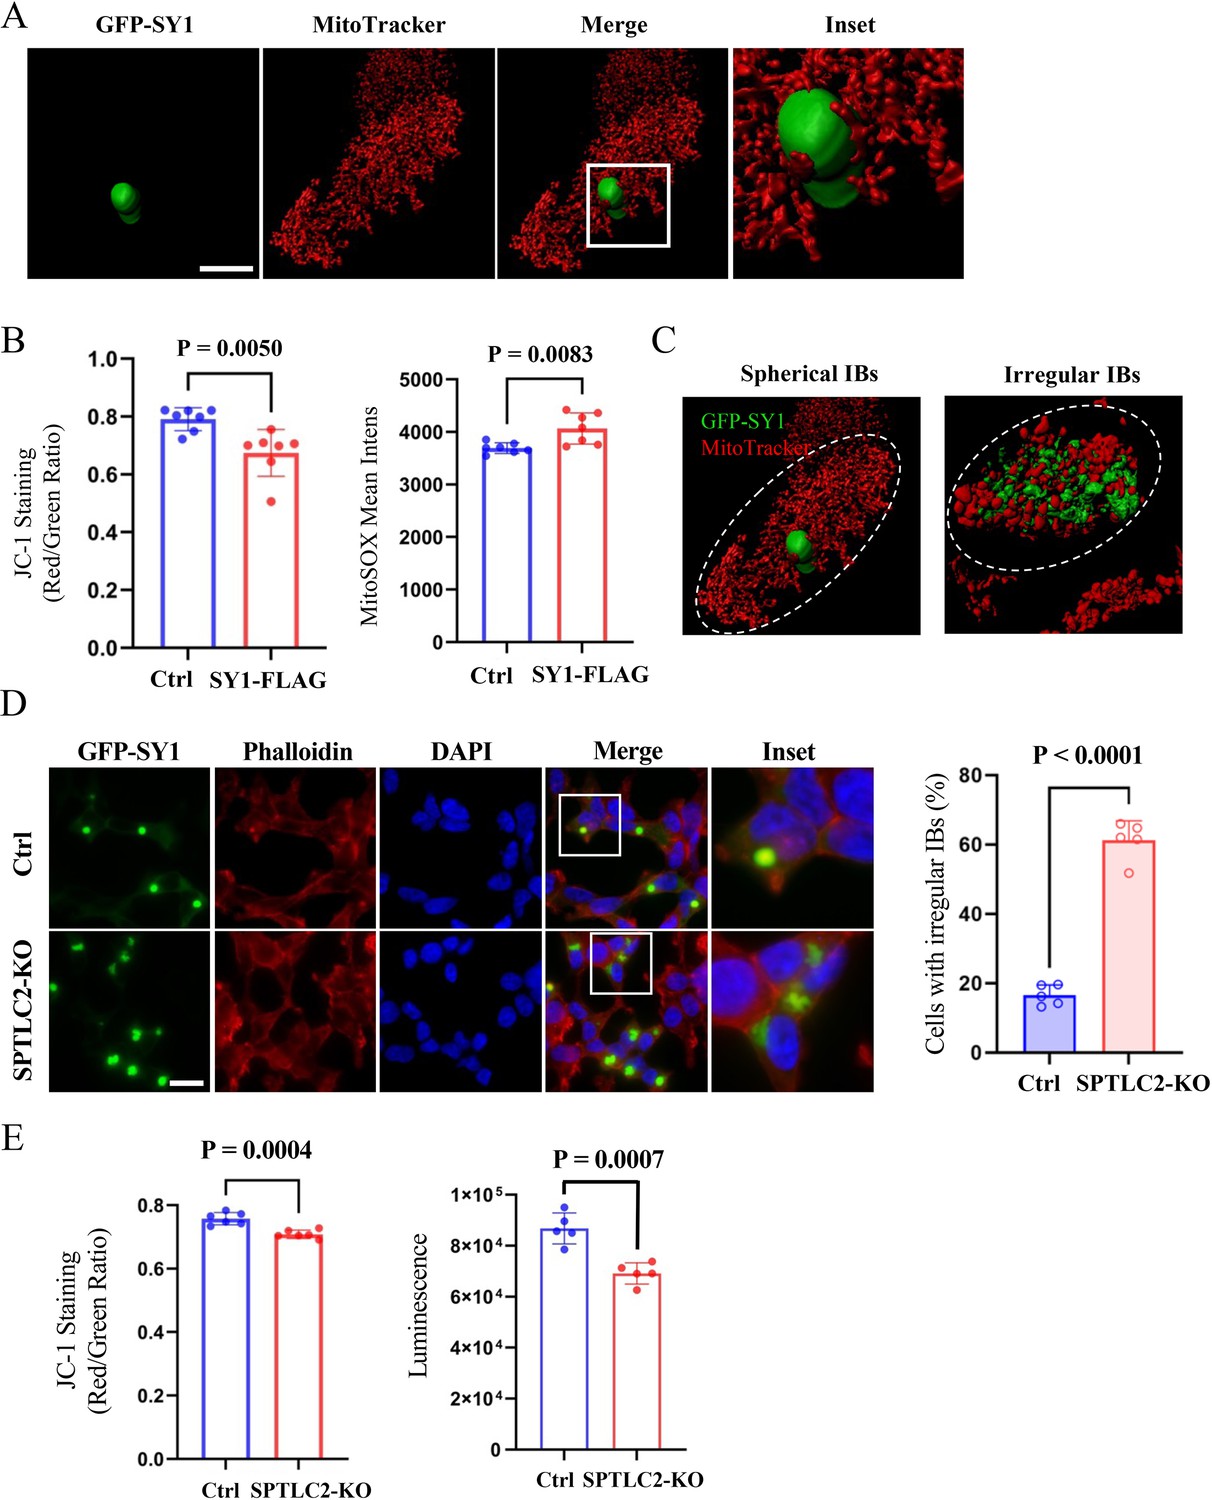
SPTLC2 knockout alters the morphology of SY1 IBs and increases the cytotoxicity in mammalian cells.
(A) The 3D reconstruction showed that SY1 IBs were associated with mitochondria in mammalian HEK293t cells. GFP-SY1 was expressed in HEK293t cells and mitochondria were probed with MitoTracker. The 3D structure was constructed using Imaris software. Scale bar = 10 μm. (B) SY1 expression decreased mitochondrial function in HEK293t cells. Mitochondrial membrane potential was monitored by JC-1 staining, mitochondrial superoxide was analyzed by MitoSOX mean intensity values. Data were analyzed using the Student’s t-test. Error bars indicate the SD, n=7 biological replicates. (C) The 3D structures of spherical and irregular SY1 IBs, as well as their interaction with mitochondria was visualized using Imaris software (see also Figure 6—figure supplement 2). (D) SPTLC2 knockout HEK293t cells had impaired management of SY1 IBs, with increased dispersed irregular IB structures. Scale bar = 20 μm. Data were analyzed using the Student’s t-test. Error bars indicate the SD, n=5 biological replicates. (E) SPTLC2 knockout increased SY1 cytotoxicity. Mitochondrial membrane potential (indicated by JC-1 staining) assays / cell viability (indicated by luminescence) were analyzed. Data were analyzed using the Student’s t-test. Error bars indicate the SD, n=5-6 biological replicates.
Figure 6—figure supplement 1
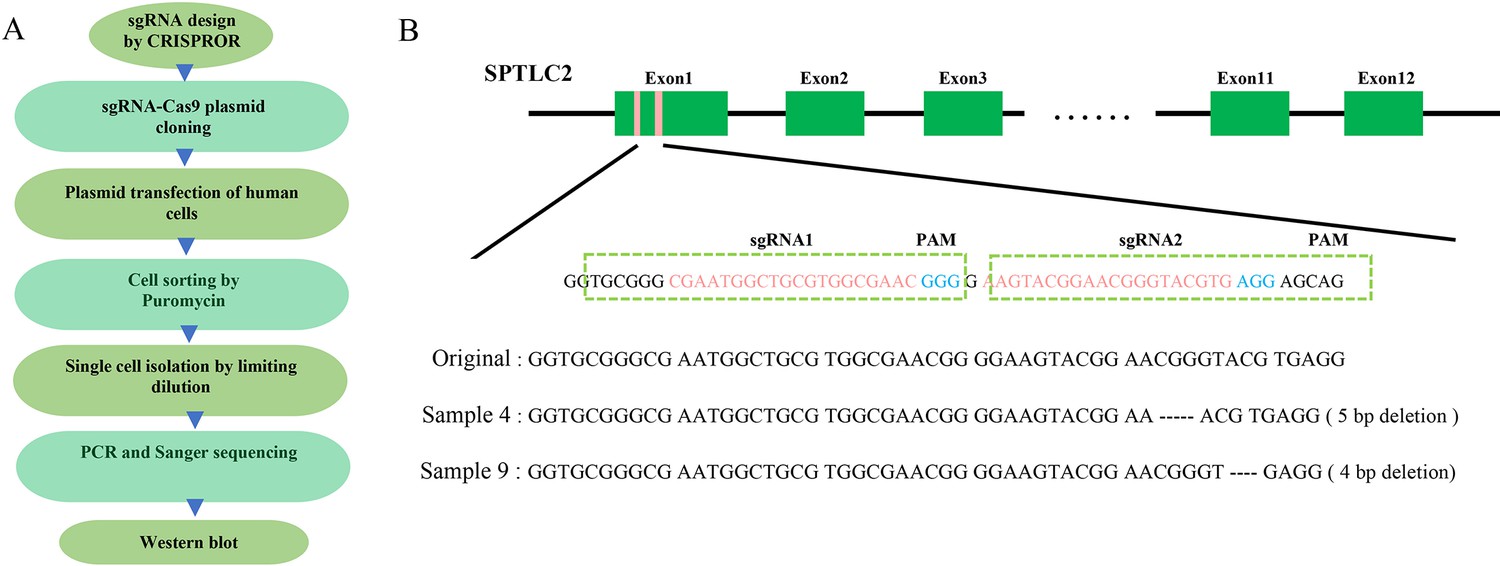
SPTLC2-Knockout by CRISPR/Cas9 genome editing.
(A) The experimental flow chart for SPTLC2 knockout in HEK293t cells using CRISPR/Cas9. (B) The sequencing results of the corresponding deletion sites of two obtained knockout cell lines.
Figure 6—figure supplement 2

Statistics of SY1 IB formation.
(A) Statistics of SY1 IB formation in wild type HEK293t and SPTLC2 knockout cells. Data were analyzed using the Student’s t-test. Error bars indicate the SD, n=10 biological replicates. (B) SPTLC2 knockout HEK293t cells were simultaneously transfected with GFP-SY1 expression vector and SPTLC2 complementary plasmid (EXS0597-Lv242- SPTLC2) or empty vector control (EX-NEG-Lv242), and the percentage of IB-forming cells and the percentage of irregular IB in IB-forming cells were counted. Data were analyzed using the Student’s t-test. Error bars indicate the SD, n=5-9 biological replicates.
Figure 6—figure supplement 3
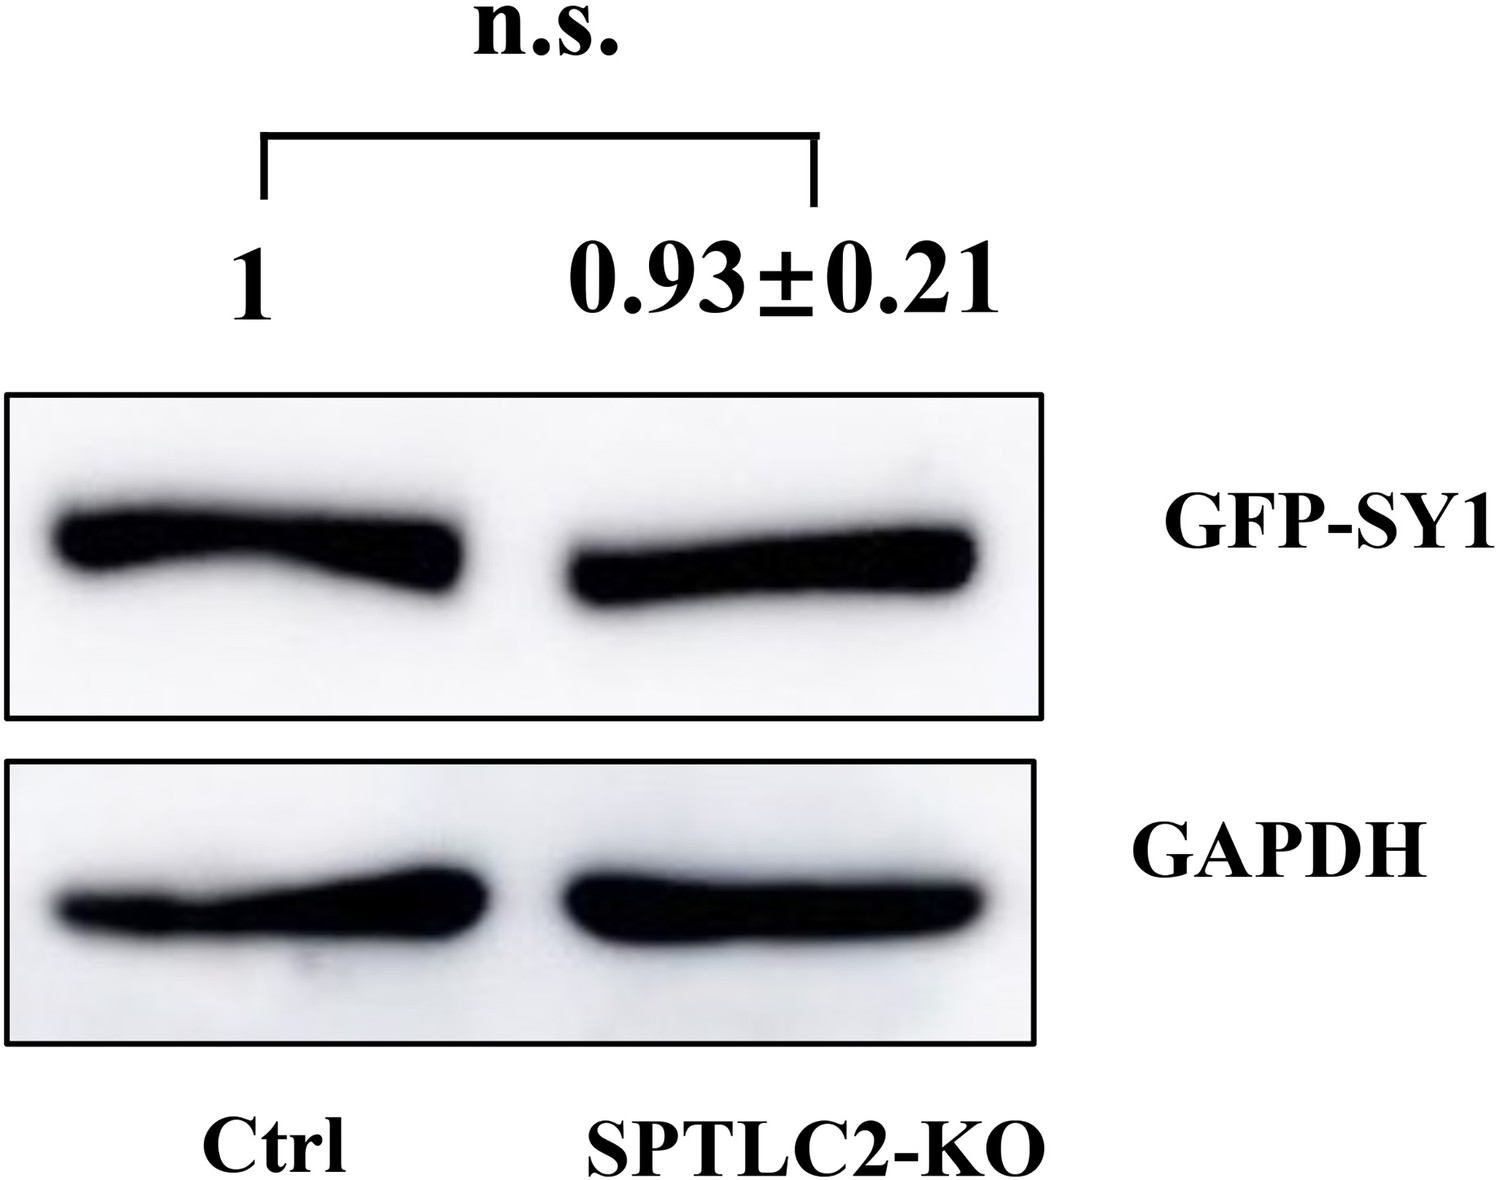
The expression of SY1 protein.The expression of SY1 protein in HEK293t SPTLC2 knockout cells.
n.s., not statistically significant. Data were analyzed using the Student’s t-test, n=3 biological replicates.
-
Figure 6—figure supplement 3—source data 1
PDF file containing original western blot for Figure 6—figure supplement 3, indicating the relevant bands.
- https://cdn.elifesciences.org/articles/92180/elife-92180-fig6-figsupp3-data1-v1.zip
-
Figure 6—figure supplement 3—source data 2
Original files for western blot analysis displayed in Figure 6—figure supplement 3.
- https://cdn.elifesciences.org/articles/92180/elife-92180-fig6-figsupp3-data2-v1.zip
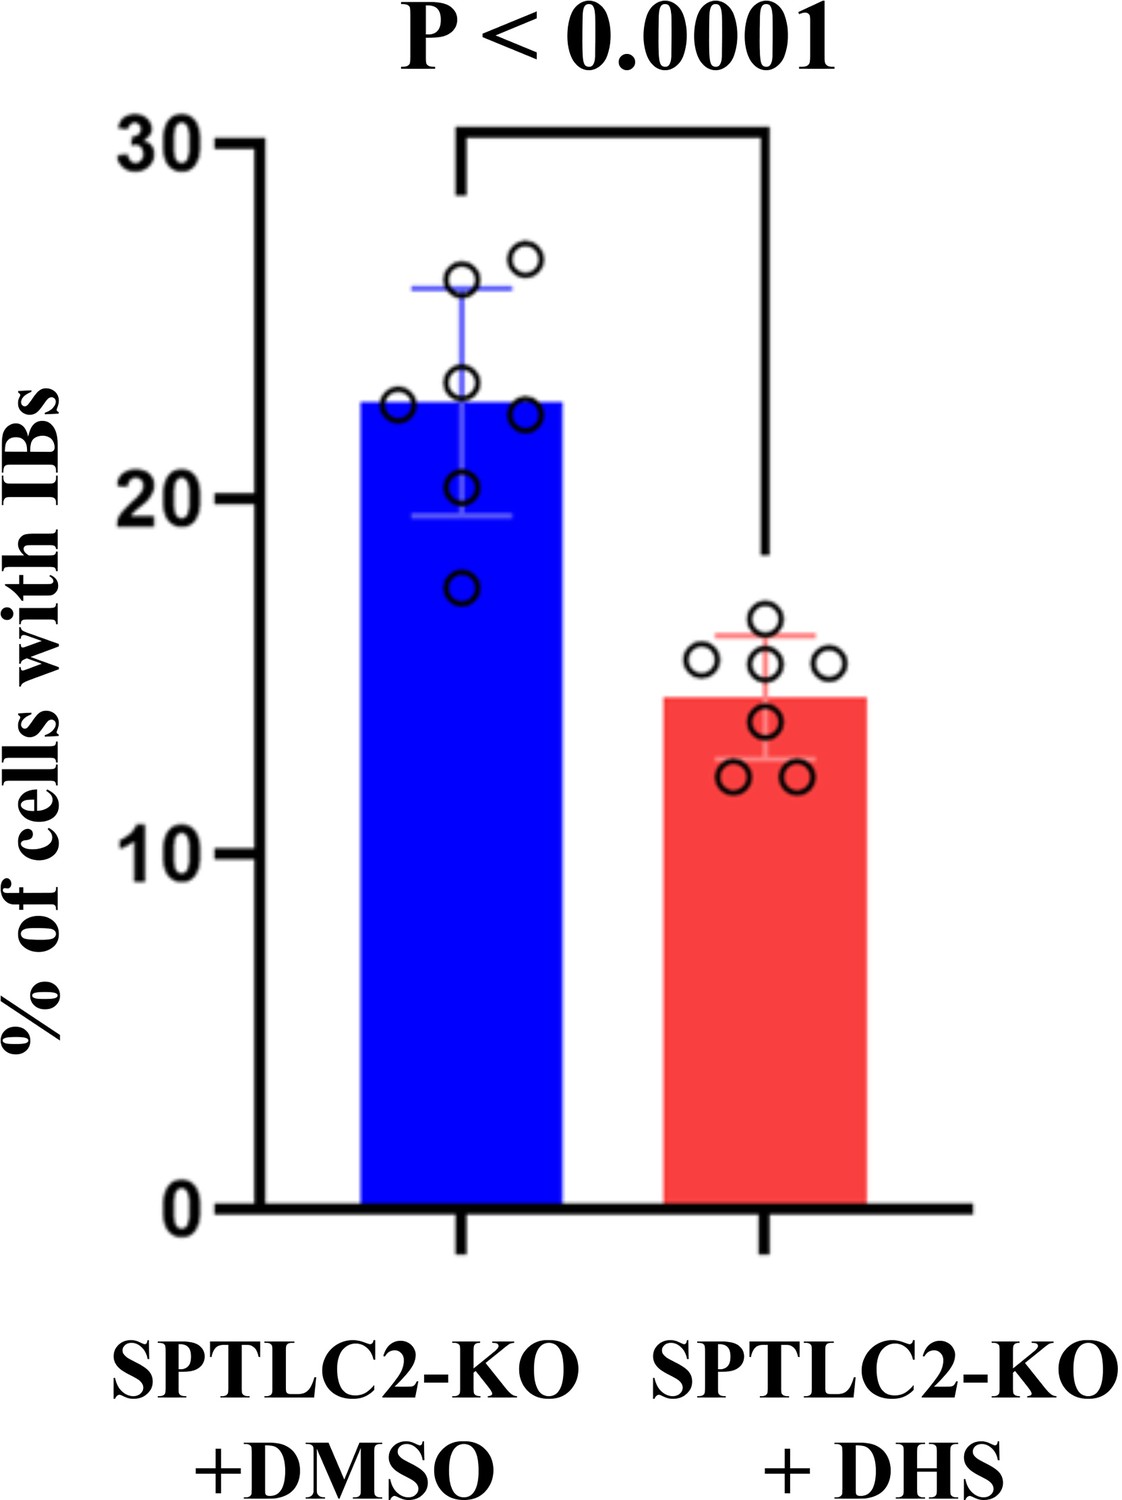
Figure 7 with 2 supplements
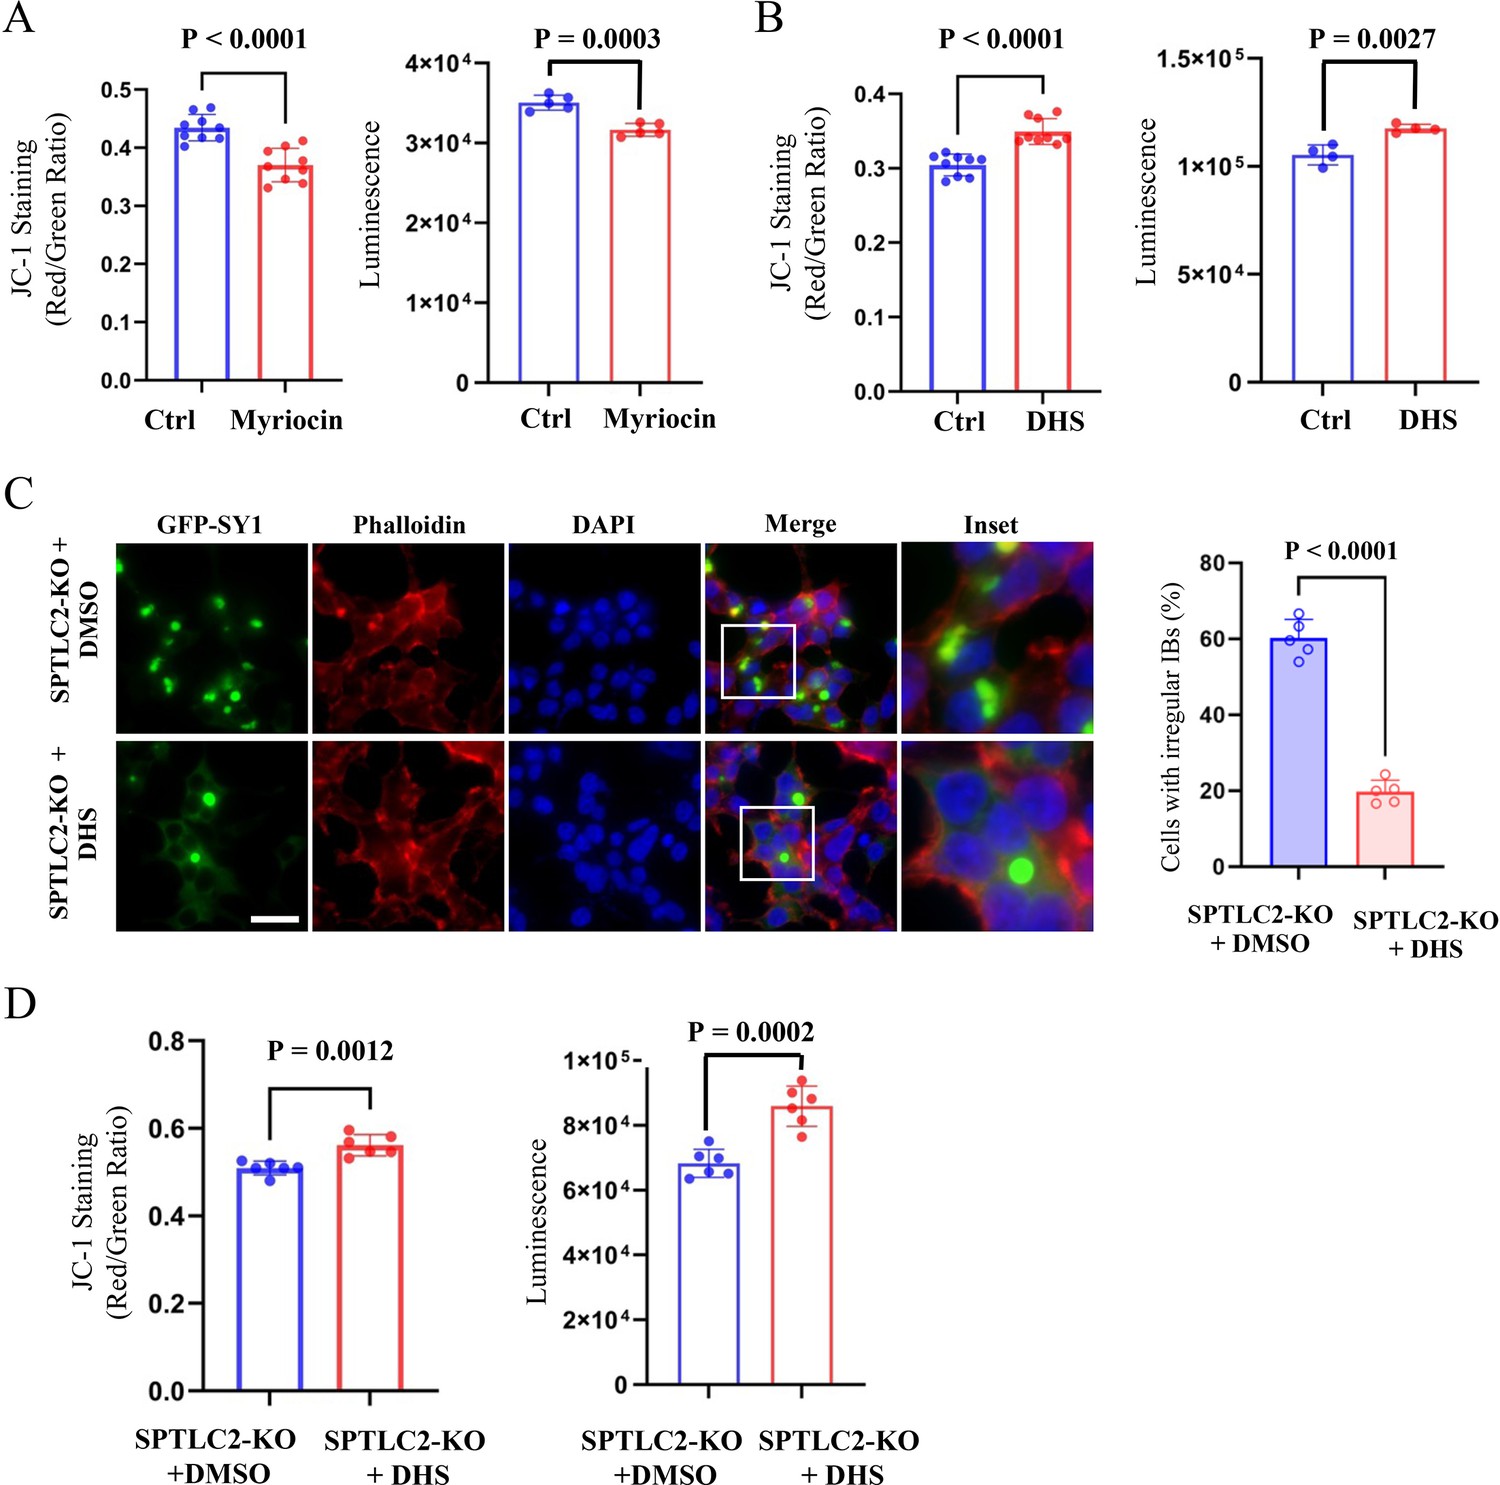
Sphingolipids regulate SY1-induced cytotoxicity and SY1 IB morphology in mammalian cells.
(A) Inhibition of the intracellular sphingolipid synthesis pathway by myriocin enhanced SY1 cytotoxicity based on mitochondrial membrane potential and ATP content assays. Data were analyzed using the Student’s t-test. Error bars indicate the SD, n=5-9 biological replicates. (B) Addition of exogenous DHS rescued the cytotoxicity caused by SY1 expression. Data were analyzed using the Student’s t-test. Error bars indicate the SD, n=4-9 biological replicates. (C) Exogenous addition of DHS to SPTLC2 knockout cells restored the typical spherical SY1 IBs in HEK293t. Statistics of the ratio of cells with dispersed irregular IBs after exogenous addition of DMSO and DHS to HEK293t SPTLC2 knockout cells (See also Figure 7—figure supplement 2). Scale bar = 20 μm. Data were analyzed using the Student’s t-test. Error bars indicate the SD, n=5 biological replicates. (D) DHS ameliorated SY1 cytotoxicity by normalizing mitochondrial membrane potential and cell viability. Data were analyzed using the Student’s t-test. Error bars indicate the SD, n=6 biological replicates.
Figure 7—figure supplement 1
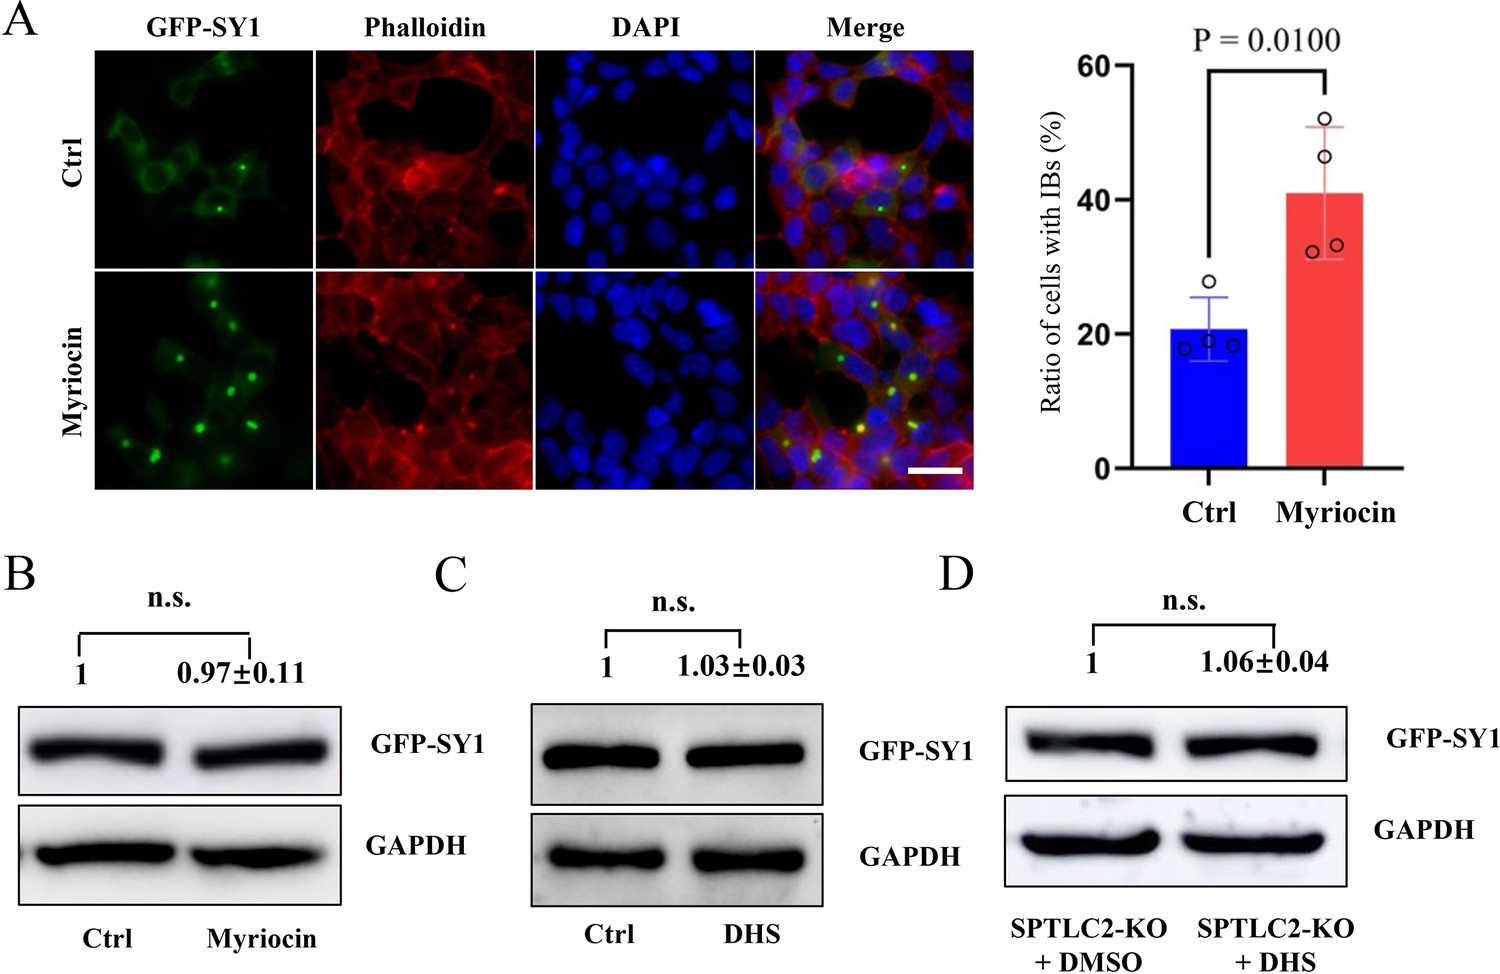
The expression of SY1 protein in HEK293t and SPTLC2 knockout cells.
(A) Myriocin treatment significantly increased the number of SY1 IBs compared to controls. Data were analyzed using the Student’s t-test. Error bars indicate the SD, n=4 biological replicates. (B–C) The effect of myriocin (B) and DHS (C) treatment on SY1 expression in HEK293t cells. n.s., not statistically significant. Data were analyzed using the Student’s t-test, n=3 biological replicates. (D) The effect of DHS treatment on SY1 expression in SPTLC2 knockout cells. n.s., not statistically significant. Data were analyzed using the Student’s t-test, n=3 biological replicates.
-
Figure 7—figure supplement 1—source data 1
PDF file containing original western blot for Figure 7—figure supplement 1B, C and D, indicating the relevant bands.
- https://cdn.elifesciences.org/articles/92180/elife-92180-fig7-figsupp1-data1-v1.pdf
-
Figure 7—figure supplement 1—source data 2
Original files for western blot analysis displayed in Figure 7—figure supplement 1B, C and D.
- https://cdn.elifesciences.org/articles/92180/elife-92180-fig7-figsupp1-data2-v1.zip
Figure 7—figure supplement 2
Statistics of SY1 IB formation.
Statistics of the effect on SY1 IB formation in SPTLC2 knockout cells after exogenous addition of either DMSO or DHS. Data were analyzed using the Student’s t-test. Error bars indicate the SD, n=7 biological replicates.
Tables
Key resources table
| Reagent type (species) or resource | Designation | Source or reference | Identifiers | Additional information |
|---|---|---|---|---|
| Antibody | Anti-Flag, rabbit monoclonal | Cell Signaling | D6W5B; RRID:AB_2572291 | 1:1000 |
| Antibody | Anti-GFP, rabbit polyclonal | Abcam | ab6556; RRID:AB_305564 | 1:1000 |
| Antibody | Anti-SY1, rabbit polyclonal | Affinity Biosciences | DF8619; RRID:AB_2841823 | 1:1000 |
| Antibody | Anti-PGK1, mouse monoclonal | Abcam | ab113687; RRID:AB_10861977 | 1:1000 |
| Antibody | Anti-GAPDH, rabbit polyclonal | Wanleibio | WL01114; RRID:AB_3665066 | 1:1000 |
| Antibody | Anti-rabbit IgG H&L (HRP), goat polyclonal | Abcam | ab6721; RRID:AB_955447 | 1:10000 |
| Antibody | Anti-mouse IgG H&L (HRP), goat polyclonal | Abcam | ab6789; RRID:AB_955439 | 1:10000 |
| Chemical compound, drug | myriocin | MCE | HY-N6798 | |
| Chemical compound, drug | dihydrosphingosine (DHS) | Sigma | D3314 | |
| Chemical compound, drug | sulfo-NHS-LC biotin | Thermo Fisher Scientific | 21335 | |
| Chemical compound, drug | streptavidin-conjugated paramagnetic beads | Thermo Fisher Scientific | 88817 | |
| Chemical compound, drug | MitoTracker Green | Invitrogen | M7514 | |
| Chemical compound, drug | Nonidet P-40 | Beyotime | ST2045 | |
| Chemical compound, drug | anti-GFP beads | chromoTek | GFP-Trap | |
| Chemical compound, drug | Laemmli buffer | Sigma | S3401 | |
| Chemical compound, drug | beta-mercaptoethanol | Thermo Fisher Scientific | 21985023 | |
| Chemical compound, drug | Rhodamine123 | Beyotime | C2007 | |
| Chemical compound, drug | MitoTracker Deep Red FM | Invitrogen | M22426 | |
| Chemical compound, drug | phalloidin-Atto 565 | Sigma | 94072 | |
| Commercial assay or kit | MitoSOX | Invitrogen | M36008 | |
| Commercial assay or kit | JC-1 | Beyotime | C2006 | |
| Commercial assay or kit | X-tremeGENE HP DNA Transfection Reagent | Roche | 6366236001 | |
| Commercial assay or kit | CellTiter-Lumi Luminescent Cell Viability Assay Kit | Beyotime | C0065S | |
| Commercial assay or kit | BCA Protein Quantification Kit | Beyotime | P0012S | |
| Cell line (Homo-sapiens) | HEK293t | NCACC | SCSP-502; RRID:CVCL_0063 | |
| Cell line (Homo-sapiens) | HEK293t SPTLC2 knockout cells | This paper | ||
| Strains, strain background (S. cerevisiae) | yeast single gene knockout collection (SGA-V2) | Charlie Boone Lab | ||
| Strains, strain background (S. cerevisiae) | essential gene temperature sensitive allele collection (ts-V5) | Charlie Boone Lab | ||
| Strain, strain background (S. cerevisiae) | BY4741 (MATa his3Δ1 leu2Δ0 met15Δ0 ura3Δ0) | Dharmacon Inc | YSC1048 | |
| Strain, strain background (S. cerevisiae) | Y7092 (MATα can1Δ::STE2pr-his5 lyp1Δ ura3Δ0 leu2Δ0 his3Δ1 met15Δ0) | Tong and Boone, 2007 | ||
| Strains, strain background (S. cerevisiae) | Yeast GFP Collection | Invitrogen | 95702 | |
| Sequence-based reagent | Guide RNA for SPTLC2 knockout Guide RNA sequences #1: | This paper | Guide RNA | CGAATGGCTGCGTGGCGAAC |
| Sequence-based reagent | Guide RNA for SPTLC2 knockout Guide RNA sequences #2: | This paper | Guide RNA | AAGTACGGAACGGGTACGTG |
| Sequence-based reagent | Forward primer for SPTLC2 exon 1 sequence amplification: | This paper | PCR primers | GCCACCGCCTACAGAGCCTGC |
| Sequence-based reagent | Reverse primer for SPTLC2 exon 1 sequence amplification: | This paper | PCR primers | CCGGGAGTAAGACCTCCAGGCGC |
| Recombinant DNA reagent | pYX212-Dsred -SY1 | Büttner et al., 2008 | ||
| Recombinant DNA reagent | pYX212-Dsred | Büttner et al., 2008 | ||
| Recombinant DNA reagent | pYX212-Dsred -SY1-His | This paper | Materials and methods section | |
| Recombinant DNA reagent | pcDNA3.1-GFP-SY1 | This paper | Materials and methods section | |
| Recombinant DNA reagent | pcDNA3.1-SY1-Flag | This paper | Materials and methods section | |
| Recombinant DNA reagent | px459-SPTLC2-gRNA1 | This paper | Materials and methods section | |
| Recombinant DNA reagent | px459-SPTLC2-gRNA2 | This paper | Materials and methods section | |
| Software, algorithm | ImageJ | NIH | RRID:SCR_003070 | https://imagej.net/imagej-wiki-static/ |
| Software, algorithm | Imaris | Bitplane AG | RRID:SCR_007370 | https://imaris.oxinst.com |
| Software, algorithm | ImageXpress software | Molecular Devices | RRID:SCR_016654 | https://www.moleculardevices.com |
| Software, algorithm | ClueGO (V2.5.9) | Bindea et al., 2009 | RRID:SCR_005748 | https://apps.cytoscape.org/apps/cluego |
| Software, algorithm | Cytoscape (V3.9.1) | Cytoscape | RRID:SCR_003032 | https://cytoscape.org/ |
| Software, algorithm | GraphPad Prism | GraphPad Software | RRID:SCR_002798 | https://www.graphpad.com/ |
Additional files
-
Supplementary file 1
Mutants with manually confirmed increased class 3 synphilin-1 aggregates.
- https://cdn.elifesciences.org/articles/92180/elife-92180-supp1-v1.docx
-
Supplementary file 2
Distribution of GO terms among 84 candidate hits with significantly increased Class 3 aggregates via ClueGO analysis.
- https://cdn.elifesciences.org/articles/92180/elife-92180-supp2-v1.docx
-
Supplementary file 3
Plasmids used in this study.
- https://cdn.elifesciences.org/articles/92180/elife-92180-supp3-v1.docx
-
Supplementary file 4
Strains used in this study.
- https://cdn.elifesciences.org/articles/92180/elife-92180-supp4-v1.docx
-
MDAR checklist
- https://cdn.elifesciences.org/articles/92180/elife-92180-mdarchecklist1-v1.docx
Download links
A two-part list of links to download the article, or parts of the article, in various formats.
Downloads (link to download the article as PDF)
Open citations (links to open the citations from this article in various online reference manager services)
Cite this article (links to download the citations from this article in formats compatible with various reference manager tools)
Maturation and detoxification of synphilin-1 inclusion bodies regulated by sphingolipids
eLife 12:RP92180.
https://doi.org/10.7554/eLife.92180.4


