Protein language model-embedded geometric graphs power inter-protein contact prediction
- School of Physics, Huazhong University of Science and Technology, China
Figures
Figure 1 with 1 supplement
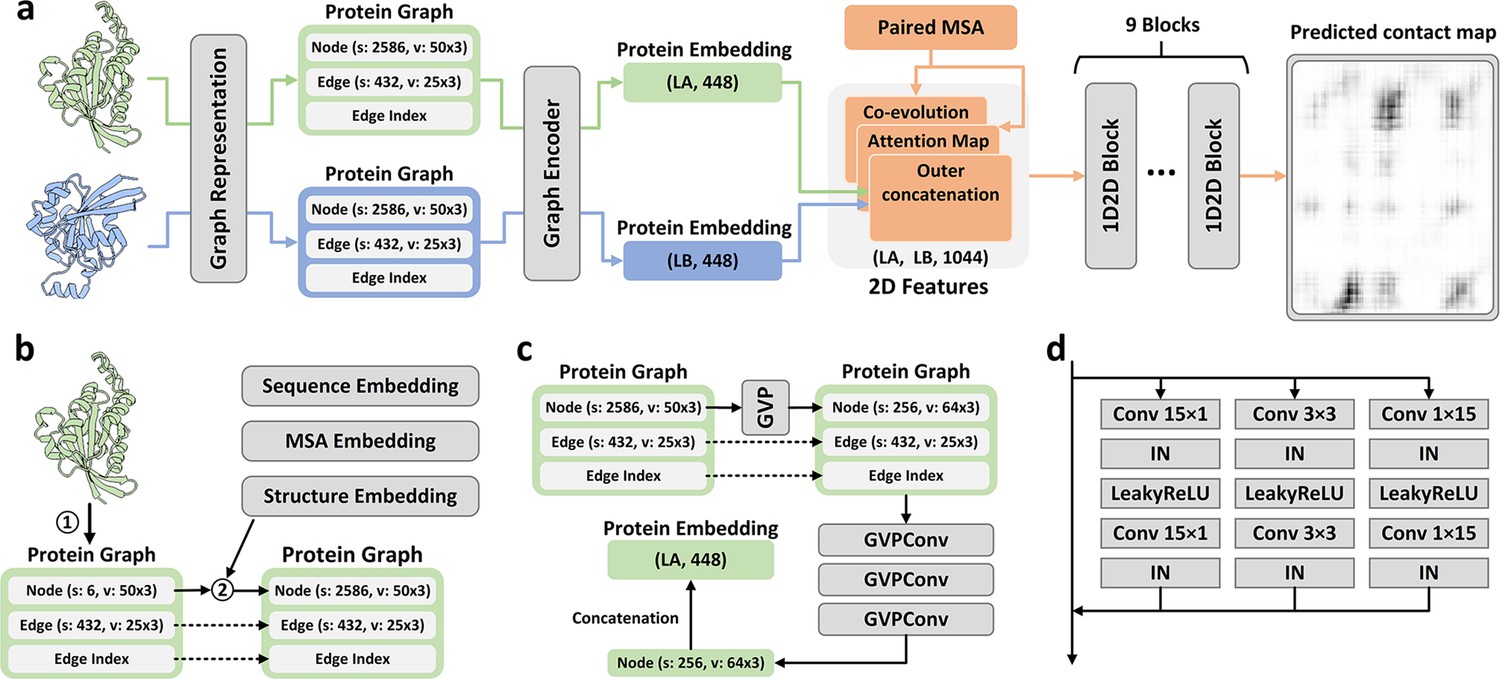
Overview of PLMGraph-Inter.
(a) The network architecture of PLMGraph-Inter. (b) The graph representation module. (c) The graph encoder module, s denotes scalar features, v denotes vector features. (d) The dimensional hybrid residual block (‘IN’ denotes Instance Normalization).
Figure 1—figure supplement 1
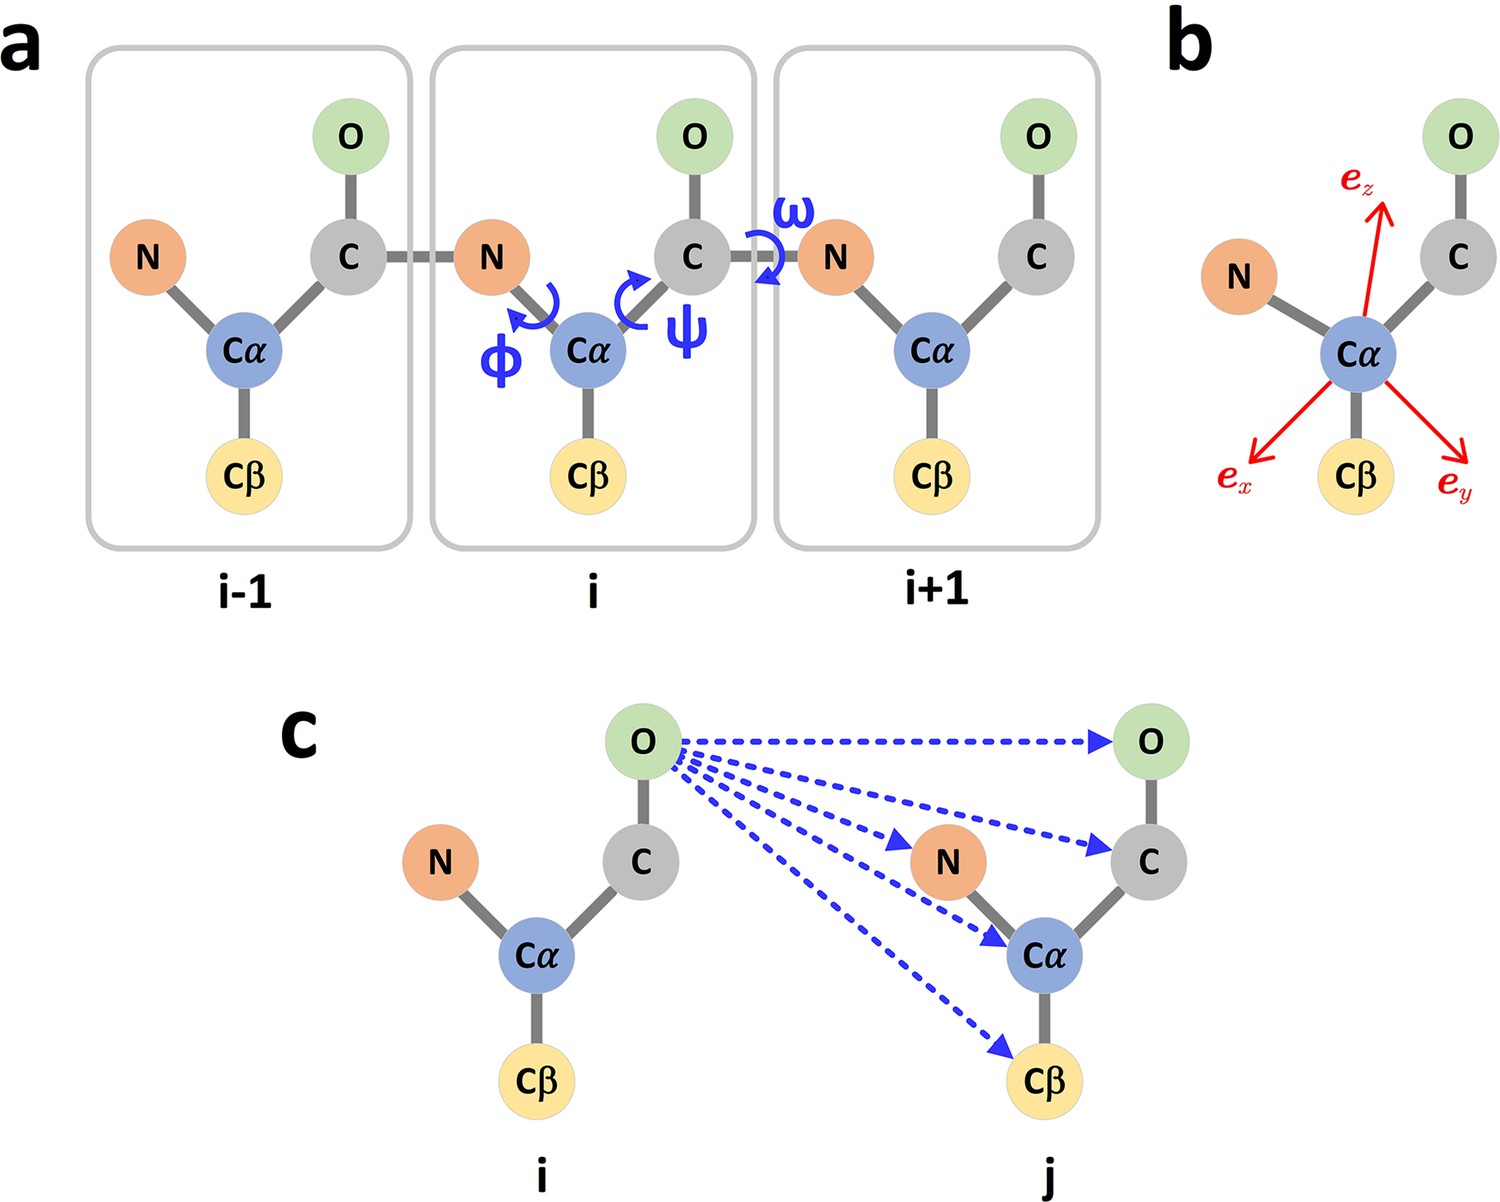
The graph representation of protein structures.
(a) Dihedral angles of the protein backbone. (b) The local coordinate system of each amino acid. (c) The scalar (distances) and vector (directions) of the edge i->j.
Figure 2 with 4 supplements
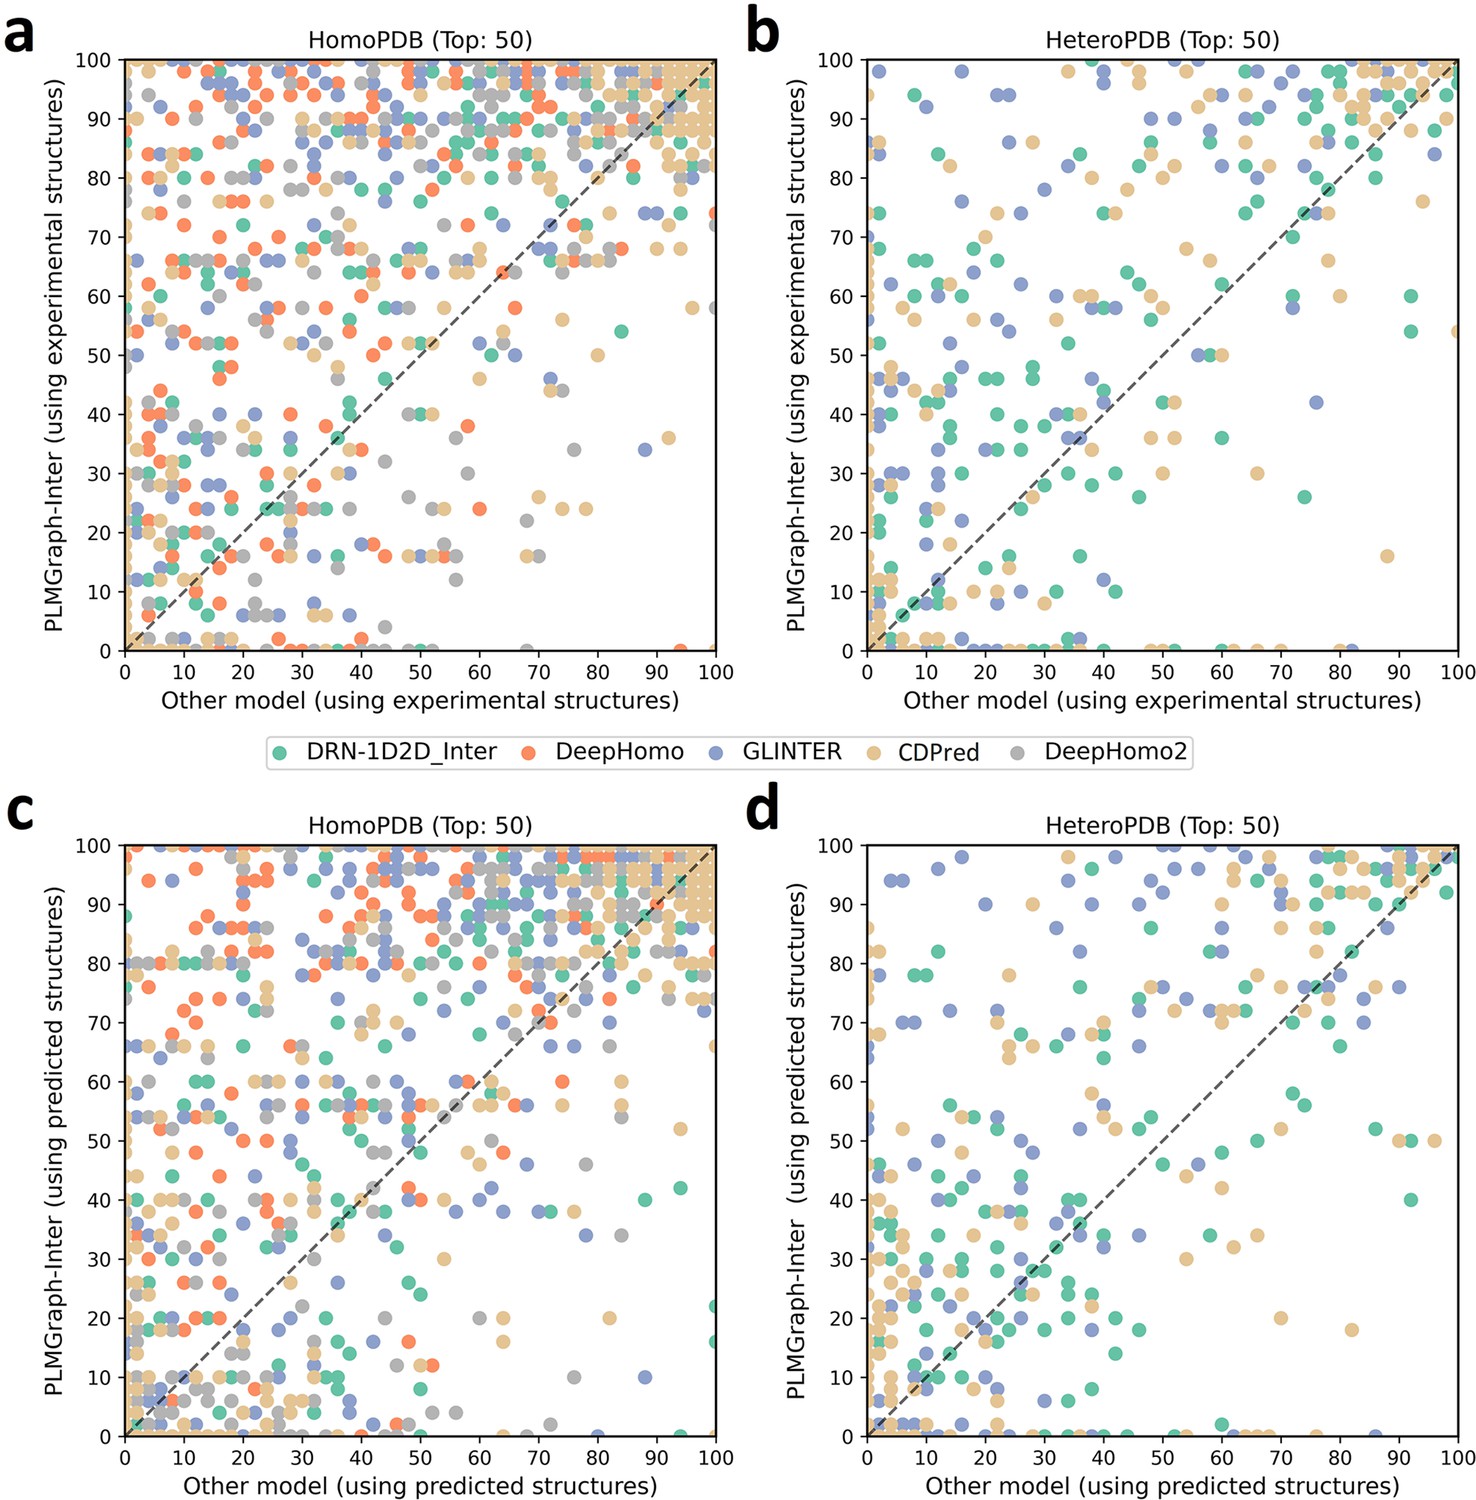
The performances of PLMGraph-Inter and other methods on the HomoPDB and HeteroPDB test sets.
(a, b) The head-to-head comparison of the precisions (%) of the top 50 contacts predicted by PLMGraph-Inter and other methods for each target in (a) HomoPDB and (b) HeteroPDB using experimental structures. (c, d) The head-to-head comparison of the precisions (%) of the top 50 contacts predicted by PLMGraph-Inter and other methods for each target in (c) HomoPDB and (d) HeteroPDB using AlphaFold2 predicted structures.
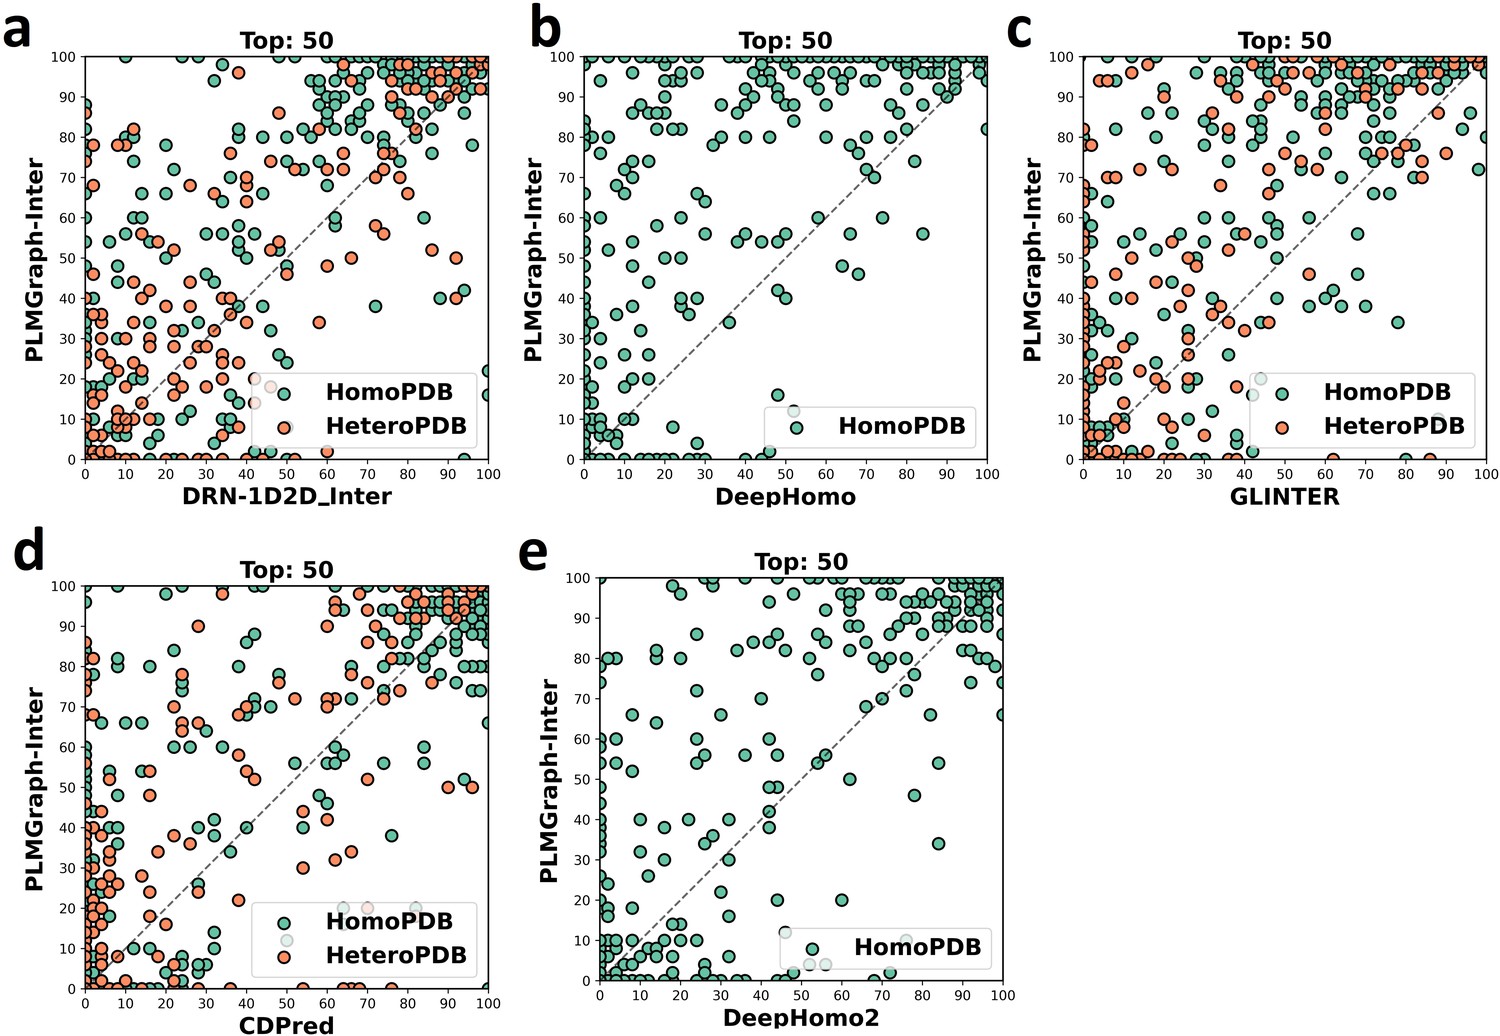
Figure 2—figure supplement 1
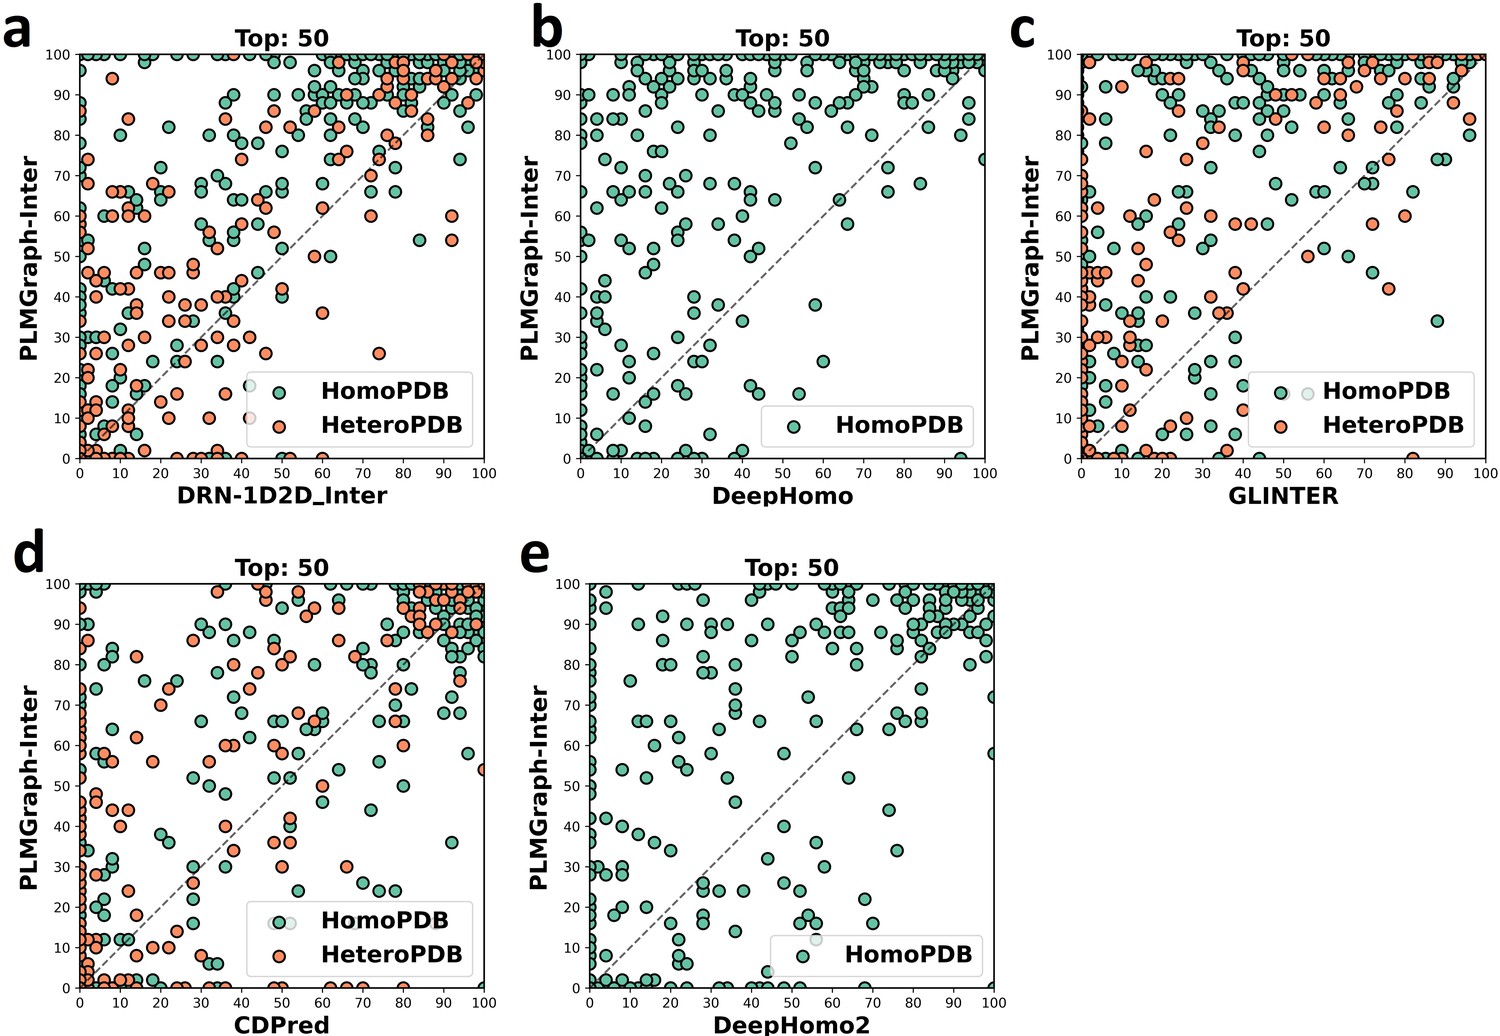
The head-to-head comparison of the precisions (%) of the top 50 contacts predicted by PLMGraph-Inter and other methods (a: DRN-1D2D_Inter; b: DeepHomo; c: GLINTER ; d: CDPred; e: DeepHomo2) for each target in HomoPDB and HeteroPDB using experimental structures.
Figure 2—figure supplement 2
The head-to-head comparison of the precisions (%) of the top 50 contacts predicted by PLMGraph-Inter and other methods (a: DRN-1D2D_Inter; b: DeepHomo; c: GLINTER ; d: CDPred; e: DeepHomo2) for each target in HomoPDB and HeteroPDB using AlphaFold2 predicted structures.
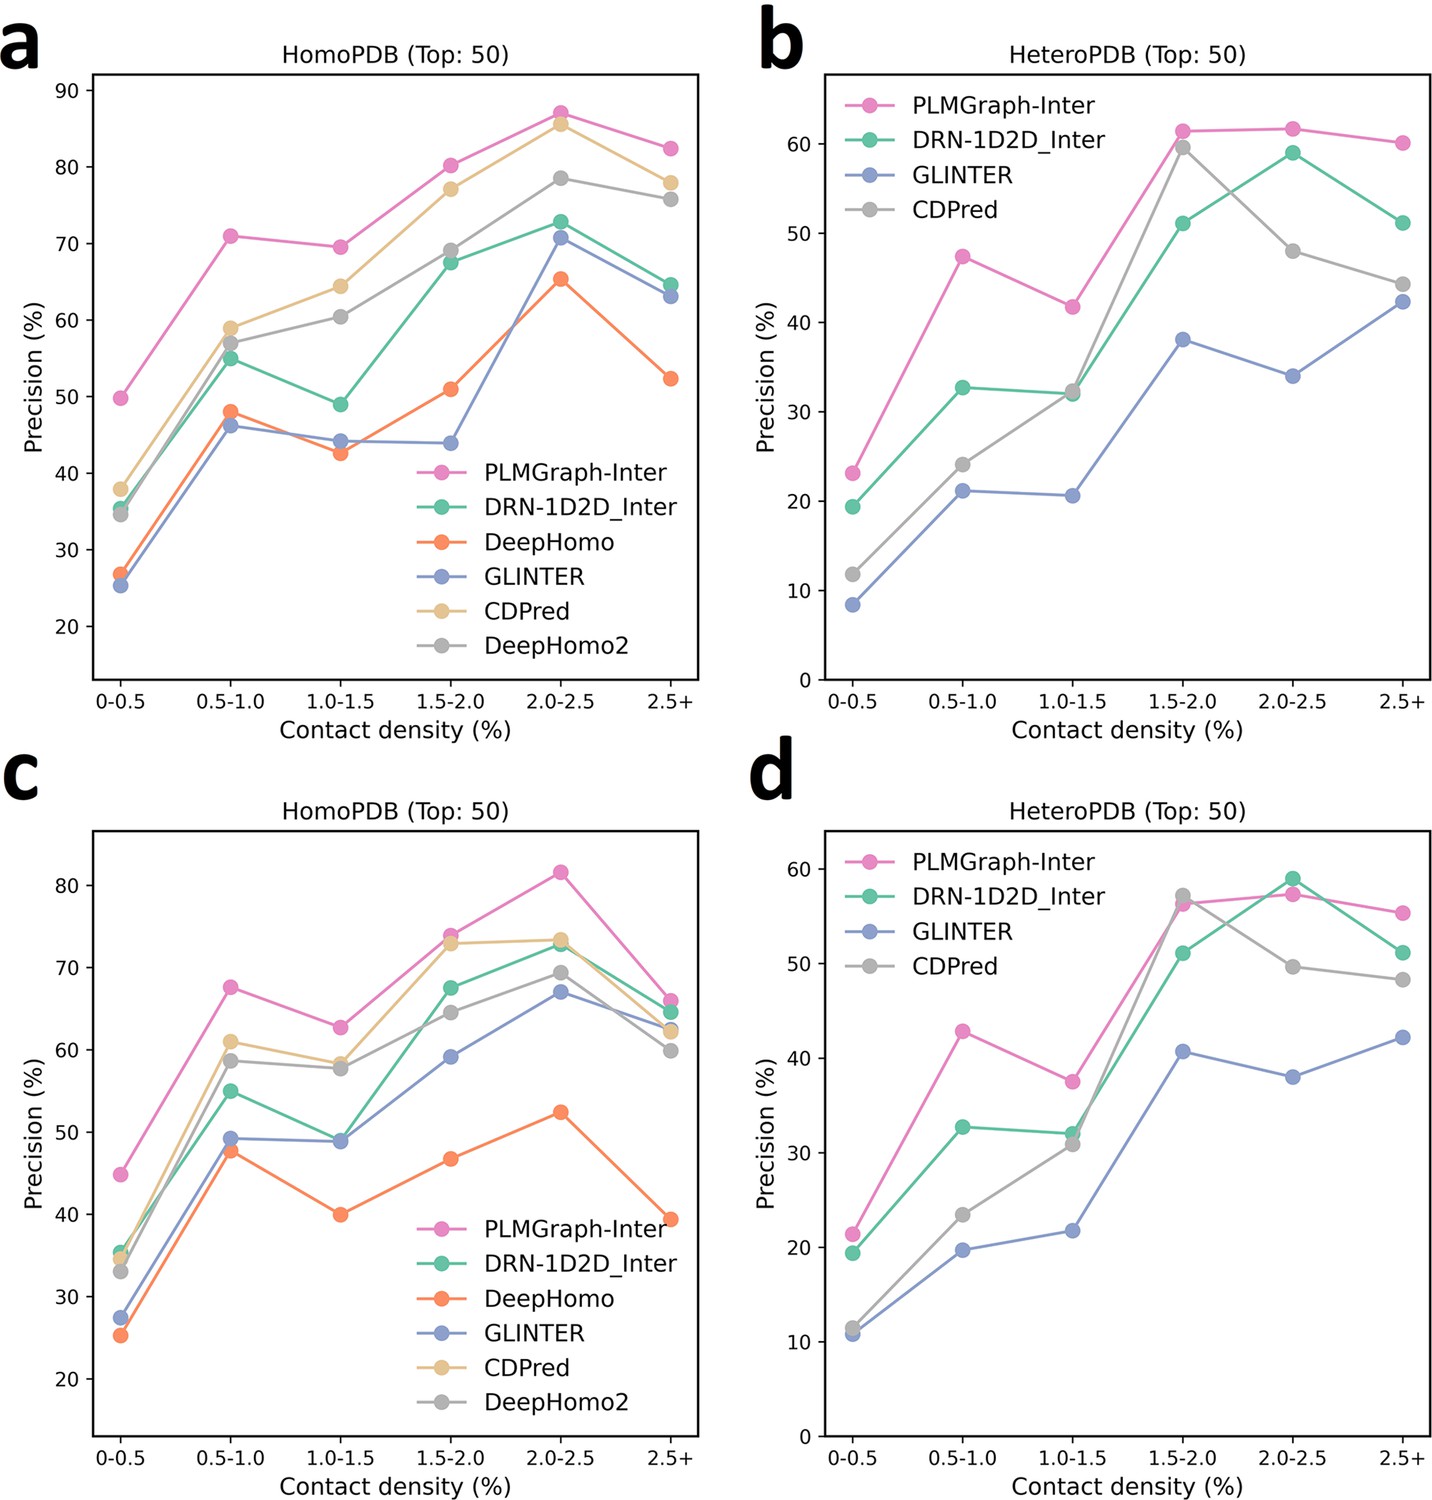
Figure 2—figure supplement 3
The mean precision versus contact density for the top 50 contacts predicted by PLMGraph-Inter, GLINTER, DeepHomo, DeepHomo2, CDPred, and DRN-1D2D_Inter on the HomoPDB test set (a, c) and HeteroPDB test set (b, d) using experimental structures (first row) and AlphaFold2 predicted structures (second row).
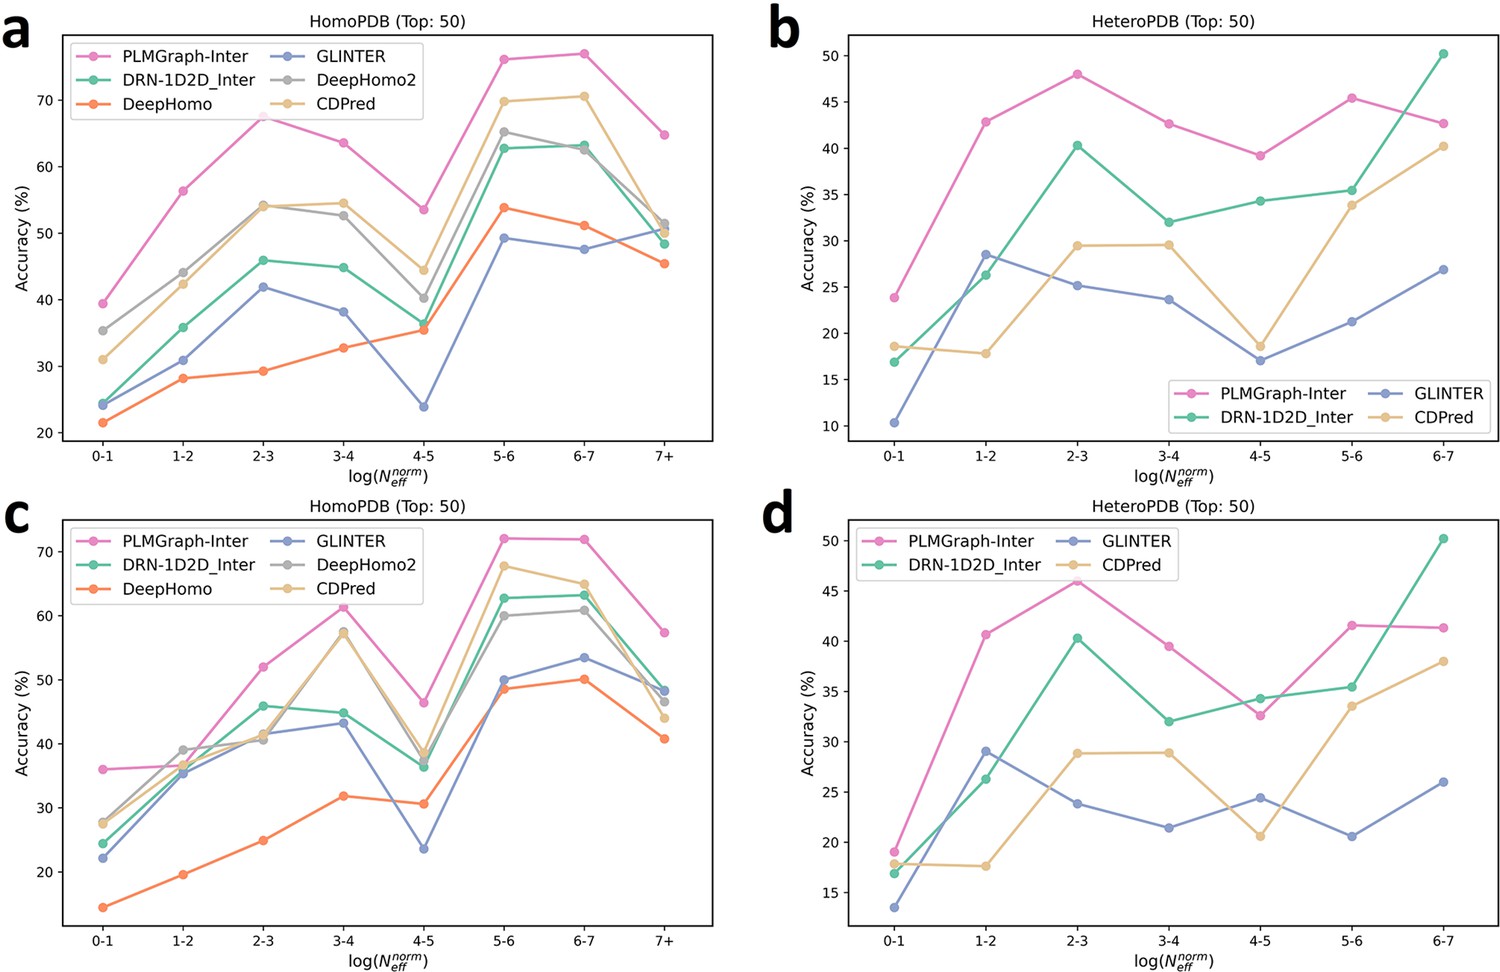
Figure 2—figure supplement 4
The mean precision versus log () for the top 50 contacts predicted by PLMGraph-Inter, GLINTER, DeepHomo, DeepHomo2, and CDPred, DRN-1D2D_Inter on the HomoPDB test set (a, c) and HeteroPDB test set (b, d) using experimental structures (first row) and AlphaFold2 predicted structures (second row).
Figure 3
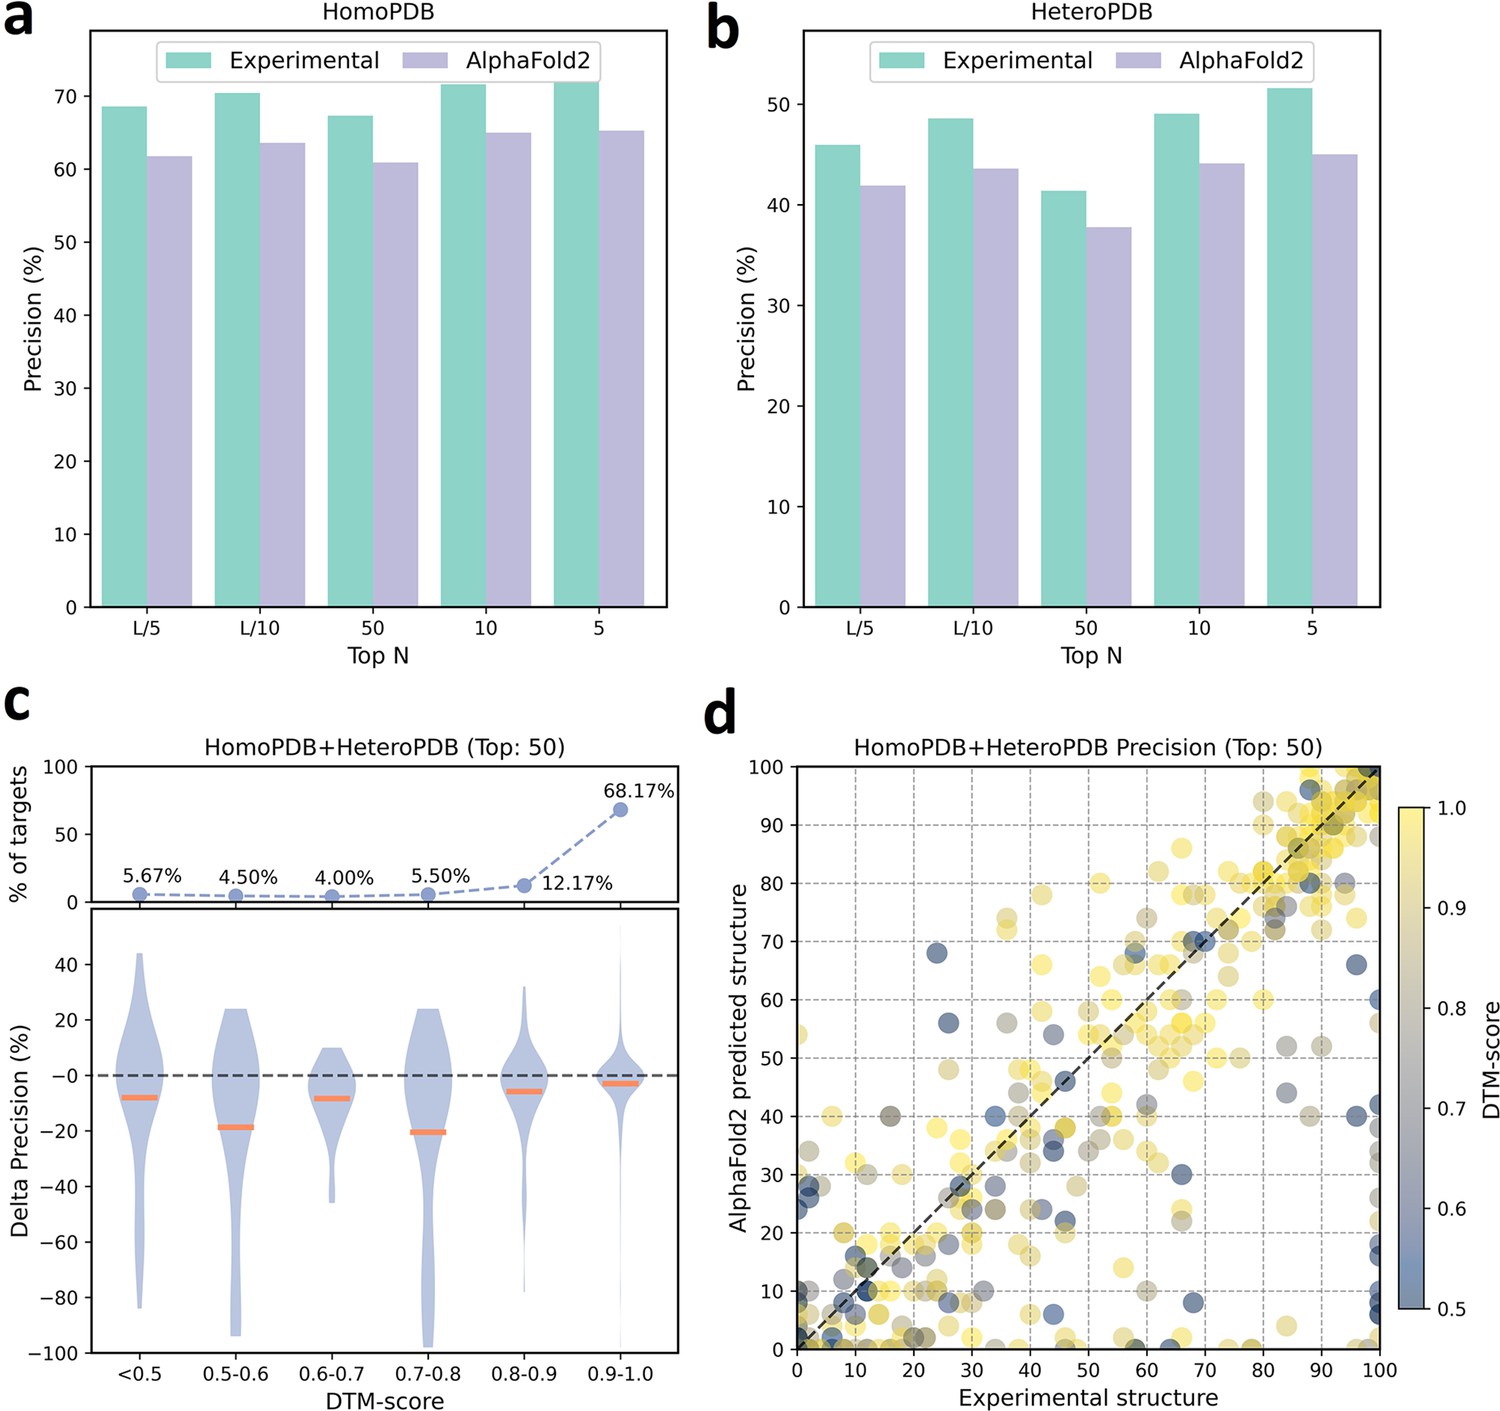
The performances of PLMGraph-Inter when using experimental and AlphaFold2 predicted structures as the input.
(a, b) The performance comparison of PLMGraph-Inter when using experimental structures and AlphaFold2 predicted structures as the input on (a) HomoPDB and (b) HeteroPDB. (c) The performance gaps (measured as the difference of the mean precision of the top 50 predicted contacts) of PLMGraph-Inter with the application of AlphaFold2 predicted structures and experimental structures as the input when the protein–protein interactions (PPIs) are within different intervals of DTM-score. The upper panel shows the percentage of the total number of PPIs in each interval. (d) The comparison of the precision of the top 50 contacts predicted by PLMGraph-Inter for each target when using experimental structures and AlphaFold2 predicted structures as the input.
Figure 4
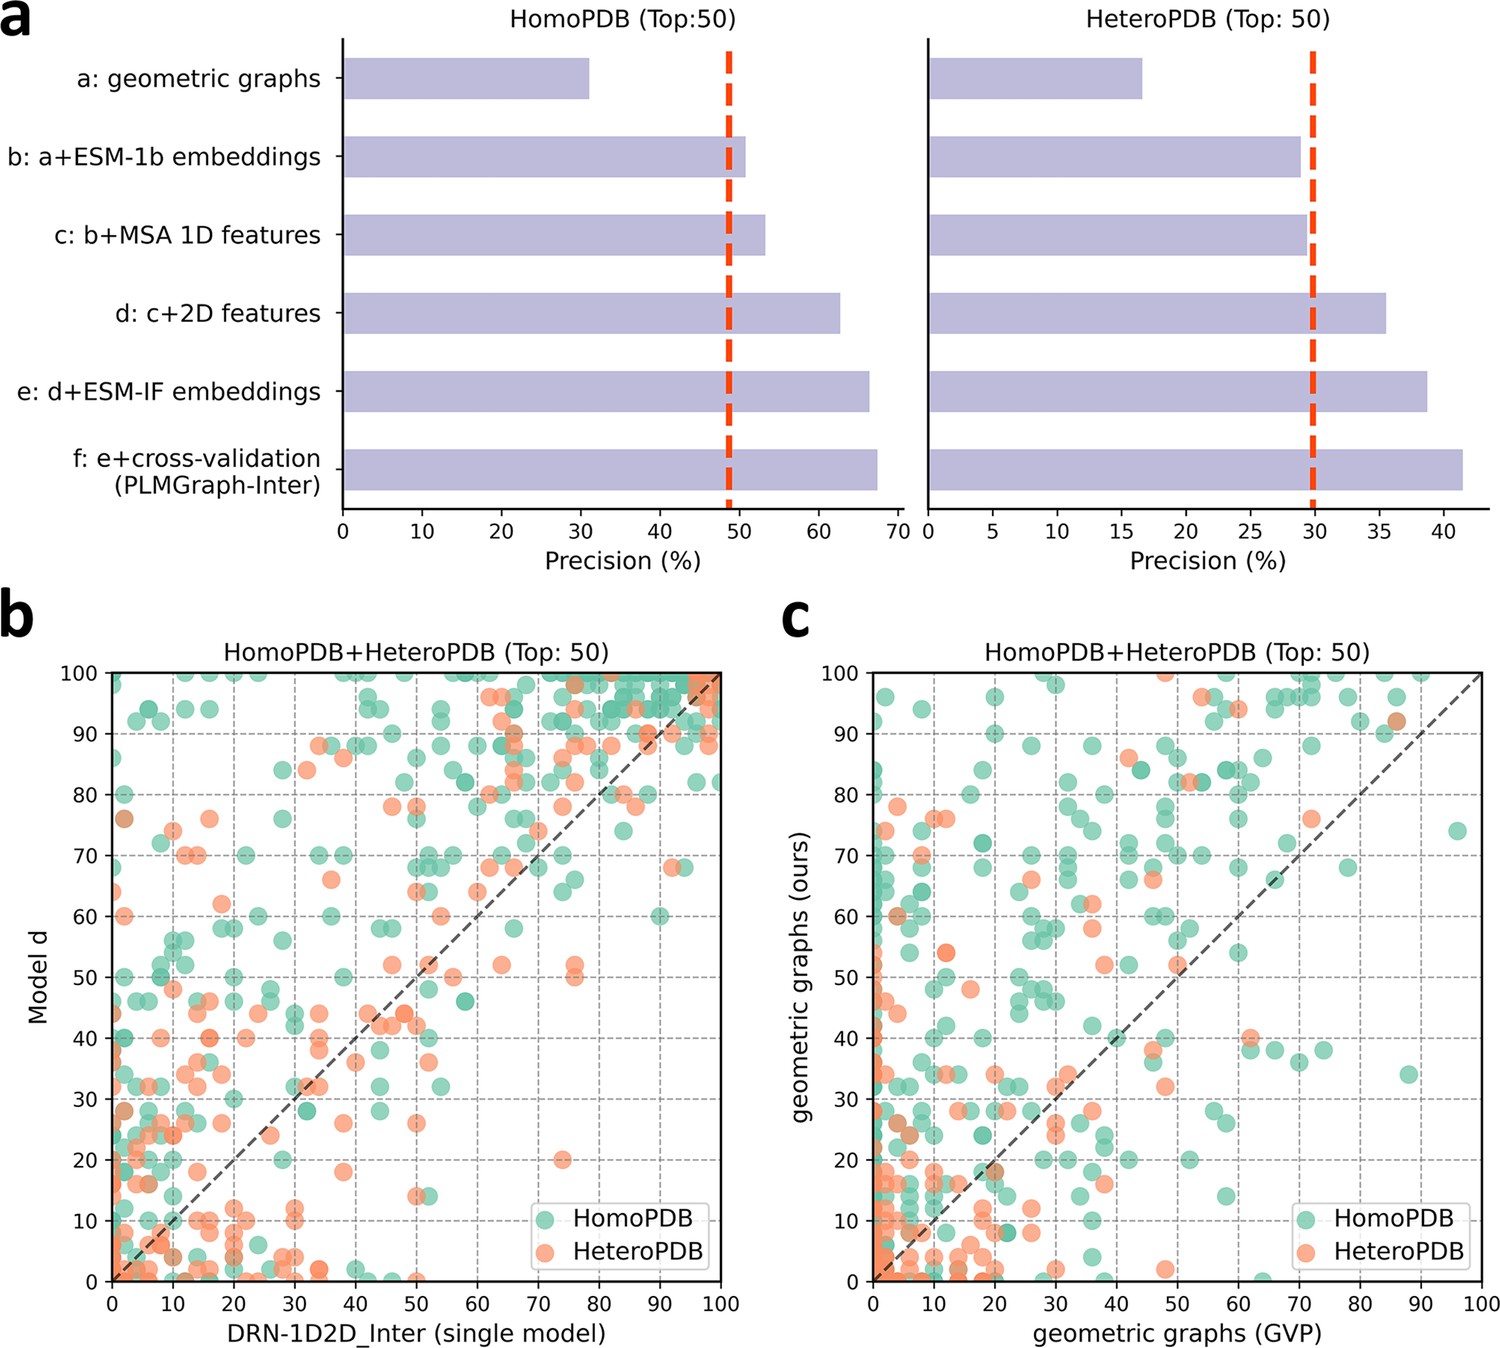
The ablation study of PLMGraph-Inter on the HomoPDB and HeteroPDB test sets.
(a) The mean precisions of the top 50 contacts predicted by different ablation models on the HomoPDB and HeteroPDB test sets. (b) The head-to-head comparisons of mean precisions of the top 50 contacts predicted by model d and DRN-1D2D_Inter (single model) for each target in HomoPDB and HeteroPDB. (c) The head-to-head comparison of mean precisions of the top 50 contacts predicted by the model using our geometric graphs and the geometric vector perceptron (GVP) geometric graphs.
Figure 5
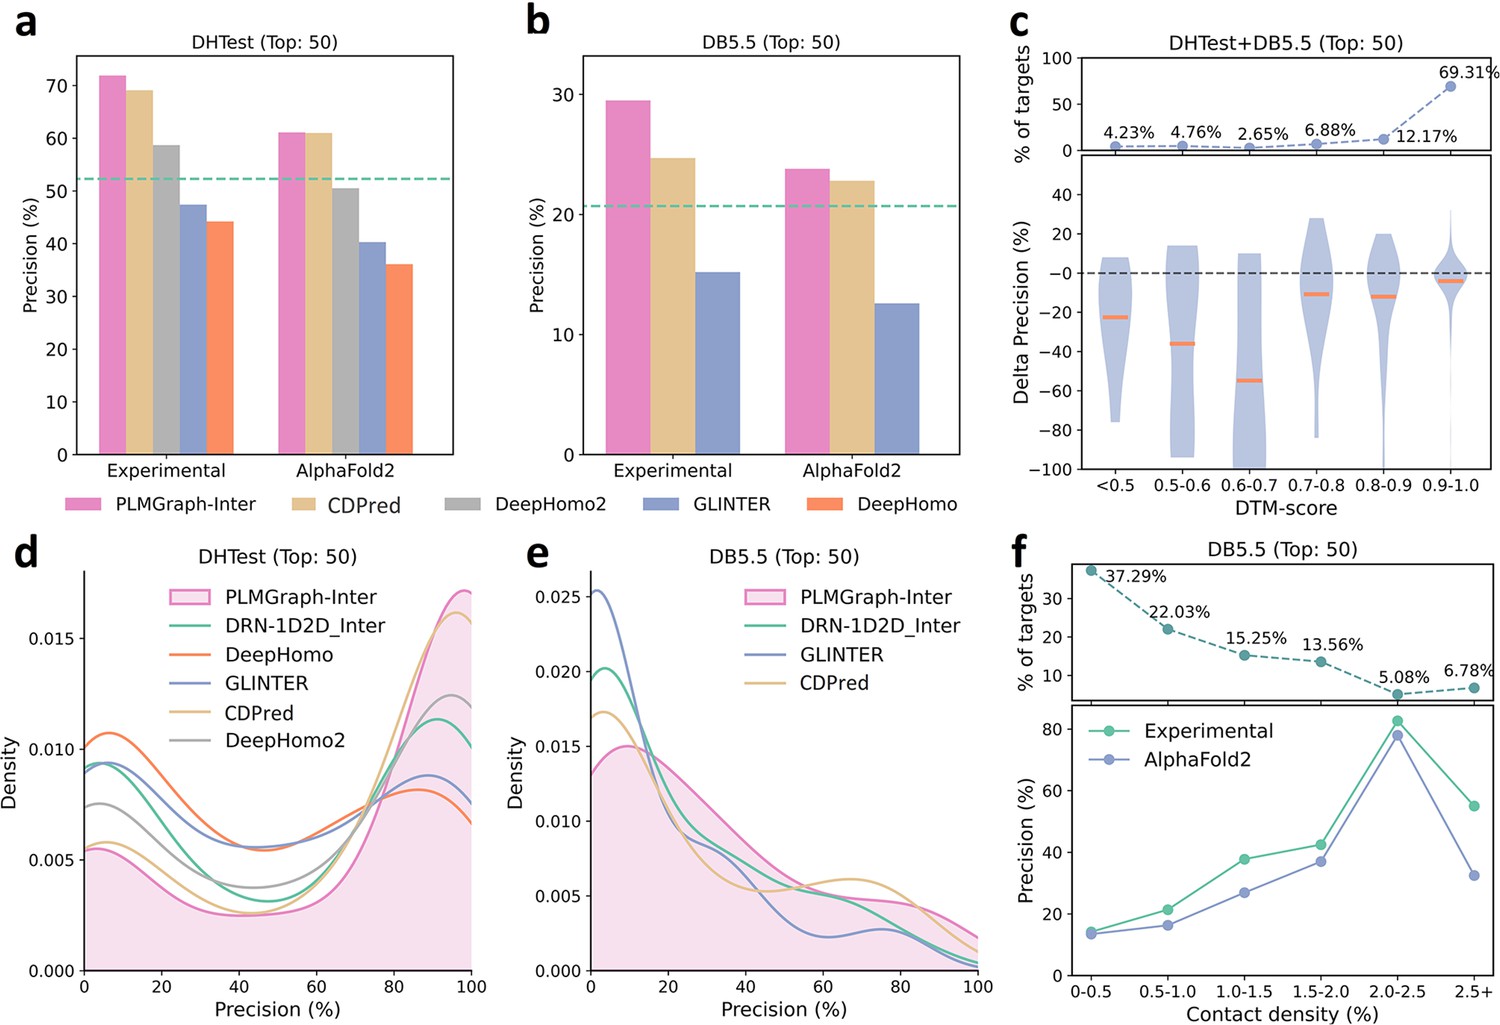
The performances of PLMGraph-Inter and other methods on the DHTest and DB5.5 test sets.
(a, b) The mean precisions of the top 50 contacts predicted by PLMGraph-Inter, GLINTER, DeepHomo2, CDPred, and DeepHomo on (a) DHTest and (b) DB5.5 when using experimental structures and AlphaFold2 predicted structures as the input, where the green lines indicate the performance of DRN-1D2D_Inter. (c) The performance gaps (measured as the difference of the mean precision of the top 50 predicted contacts) of PLMGraph-Inter with the application of AlphaFold2 predicted structures and experimental structures as the input when the protein–protein interactions (PPIs) are within different intervals of DTM-score. The upper panel shows the percentage of the total number of PPI’s in each interval. (d, e) The distributions of precisions of the top 50 contacts predicted by PLMGraph-Inter and other methods for PPIs in (d) DHTest and (e) DB5.5. (f) The mean precisions of the top 50 contacts predicted by PLMGraph-Inter on PPIs within different intervals of contact densities in DB5.5. The upper panel shows the percentage of the total number of PPIs in each interval.
Figure 6 with 1 supplement
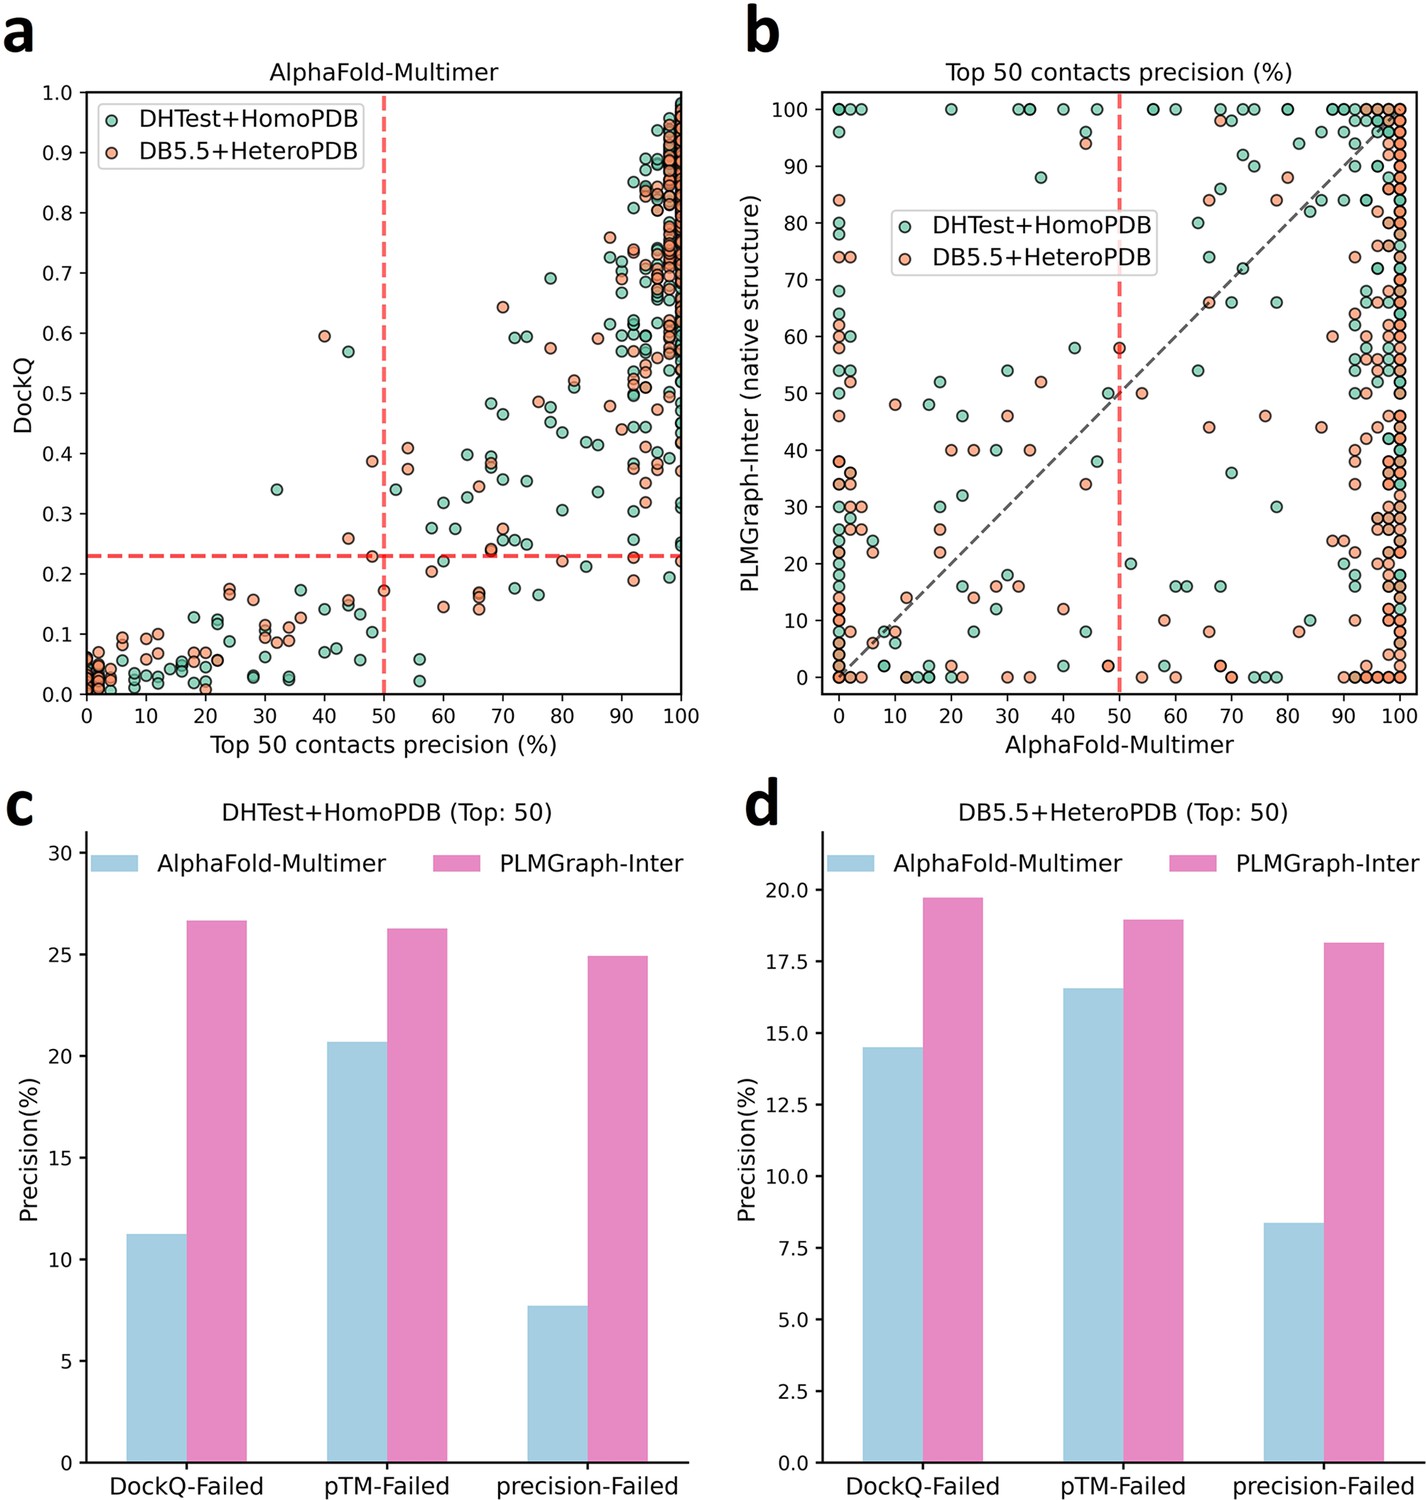
The comparison of PLMGraph-Inter with AlphaFold-Multimer.
(a) The head-to-head comparison between the qualities of the protein complex structures generated by AlphaFold-Multimer (evaluated with DockQ) and the precision of the top 50 inter-protein contacts extracted from the generated protein complex structures. The red horizontal lines represent the threshold (DockQ = 0.23) to determine whether the complex structure prediction is successful or not. (b) The head-to-head comparisons of precisions of the top 50 inter-protein contacts predicted by PLMGraph-Inter and AlphaFold-Multimer for each target in the homomeric protein–protein interaction (PPI) and heteromeric PPI datasets. (c, d) The mean precisions of top 50 inter-protein contacts predicted by PLMGraph-Inter and AlphaFold-Multimer on the PPI subsets from (c) ‘DHTest + HomoPDB’ and (d) 'DB5.5 + HeteroPDB’ in which the precision of the top 50 inter-protein contacts predicted by AlphaFold-Multimer is lower than 50% or the DockQ of the complex structure predicted by AlphaFold-Multimer is lower than 0.23 or the ‘iptm + ptm’ of the complex structure predicted by AlphaFold-Multimer is lower than 0.5.
Figure 6—figure supplement 1
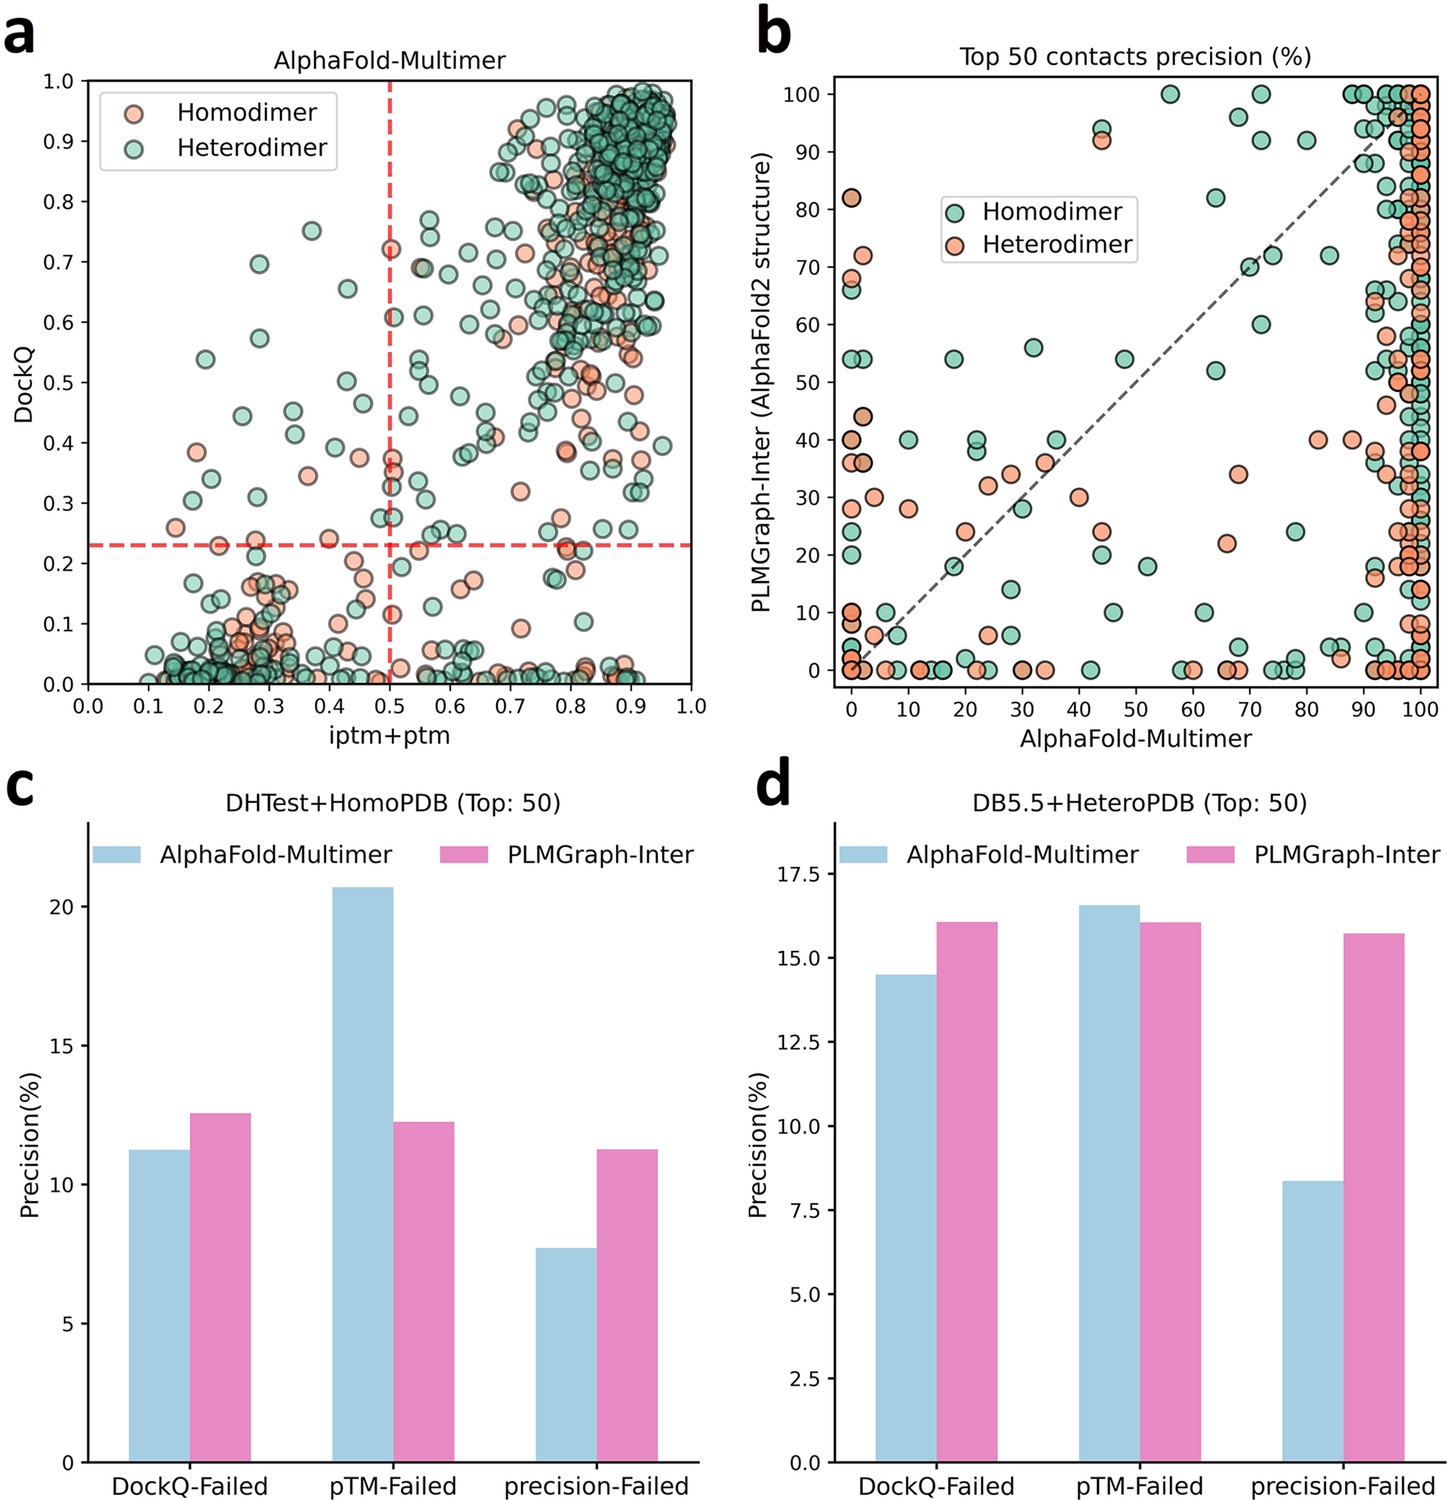
The comparison of PLMGraph-Inter with AlphaFold-Multimer.
(b) The head-to-head comparisons of precisions of the top 50 inter-protein contacts predicted by PLMGraph-Inter (using AlphaFold2 predicted structures) and AlphaFold-Multimer for each target in the homomeric protein–protein interaction (PPI) and heteromeric PPI datasets. (c, d) The mean precisions of top 50 inter-protein contacts predicted by PLMGraph-Inter(using AlphaFold2 predicted structures as input) and AlphaFold-Multimer on the PPI subsets from (c) ‘DHTest + HomoPDB’ and (d) ‘DB5.5 + HeteroPDB’ in which the precision of the top 50 inter-protein contacts predicted by AlphaFold-Multimer is lower than 50% or the DockQ of the complex structure predicted by AlphaFold-Multimer is lower than 0.23 or the ‘iptm + ptm’ of the complex structure predicted by AlphaFold-Multimer is lower than 0.5.
Figure 7 with 2 supplements
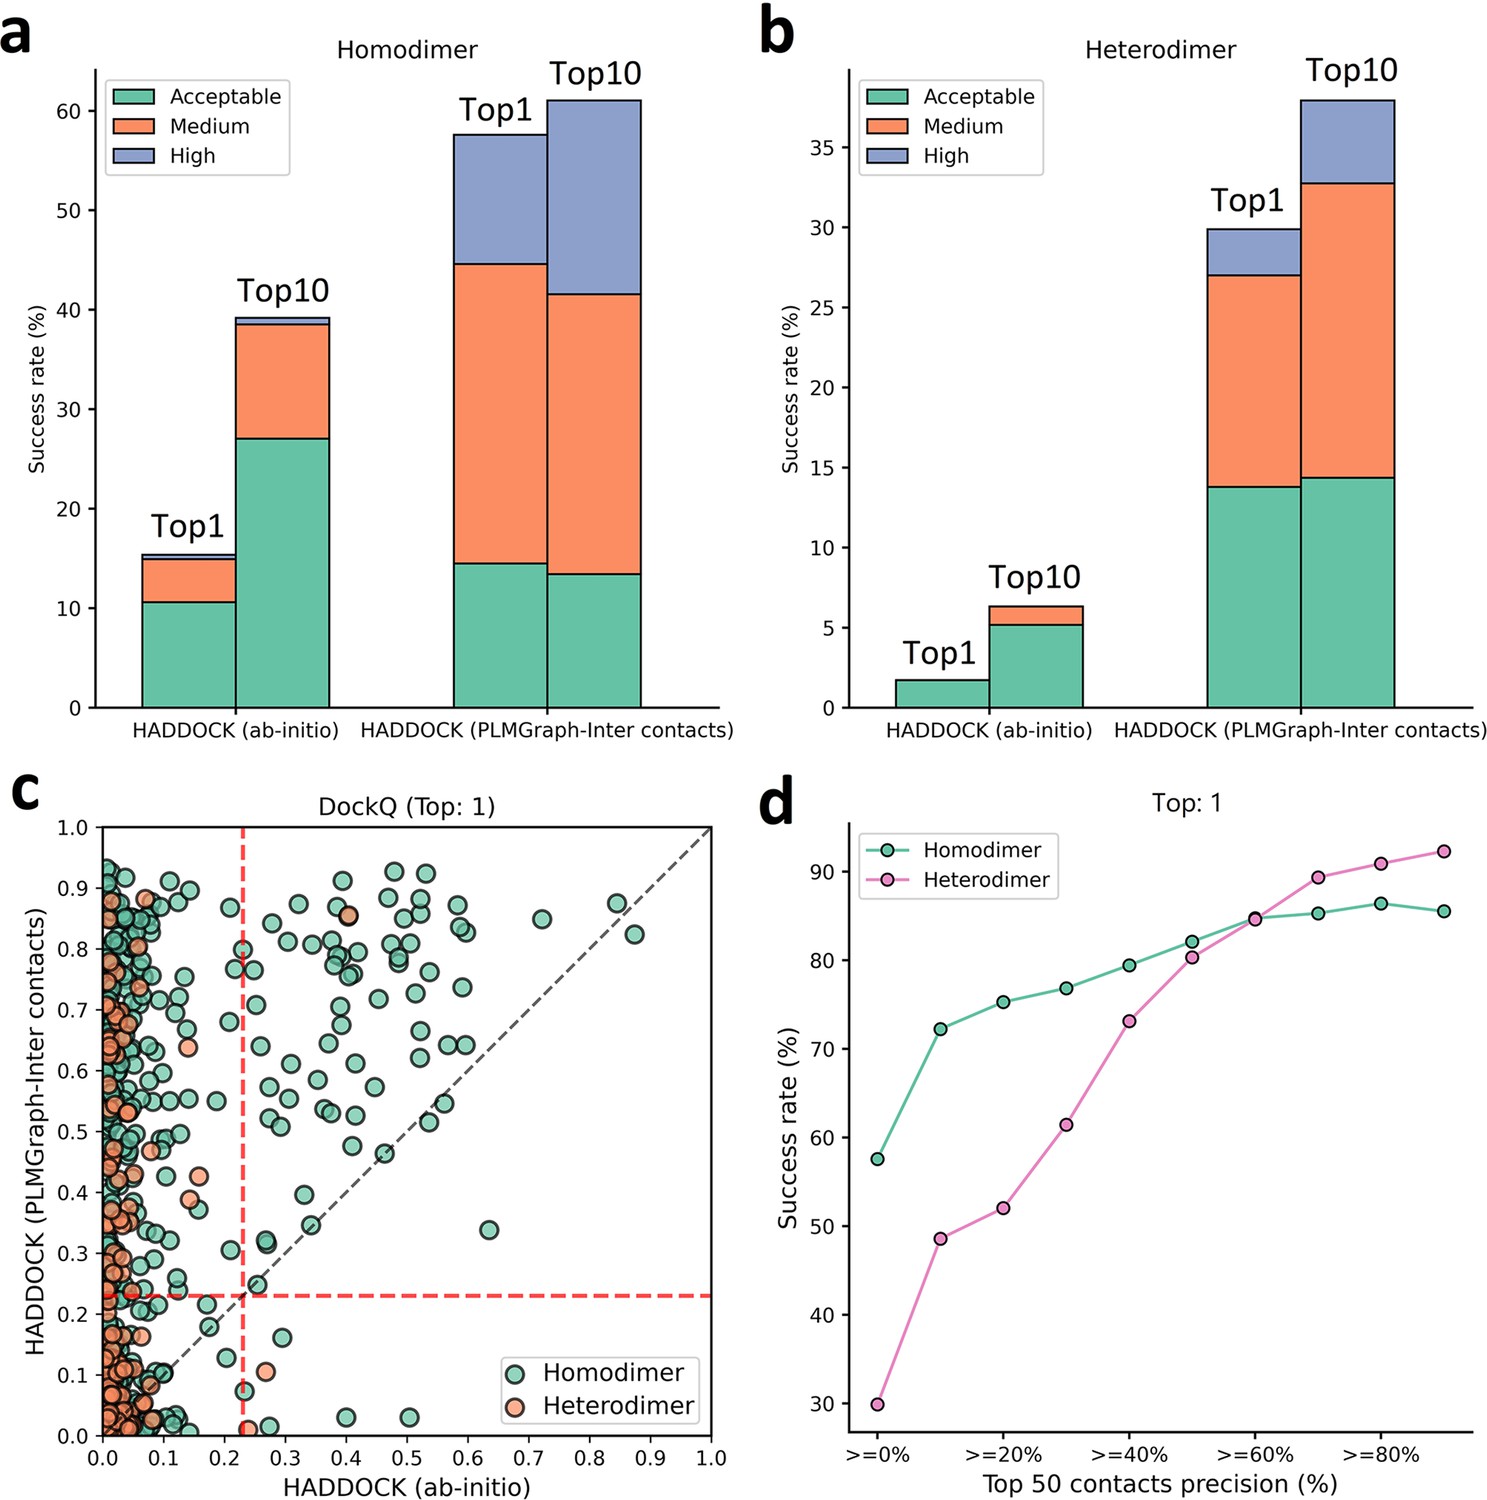
Protein–protein docking performances on the homodimer and heterodimer test sets.
(a, b) The protein–protein docking performance comparison between HADDOCK with and without (ab initio) using PLMGraph-Inter predicted contacts as restraints on (a) homodimer and (b) heterodimer. The left side of each column shows the performance when the top 1 predicted model for each protein–protein interaction (PPI) is considered, and the right side shows the performance when the top 10 predicted models for each PPI are considered. (c) The head-to-head comparison of qualities of the top 1 model predicted by HADDOCK with and without using PLMGraph-Inter predicted contacts as restraints for each target PPI. The red lines represent the threshold (DockQ = 0.23) to determine whether the complex structure prediction is successful or not. (d) The success rates (the top 1 model) for protein complex structure prediction when only including targets for which precisions of the predicted contacts are higher than certain thresholds.
Figure 7—figure supplement 1
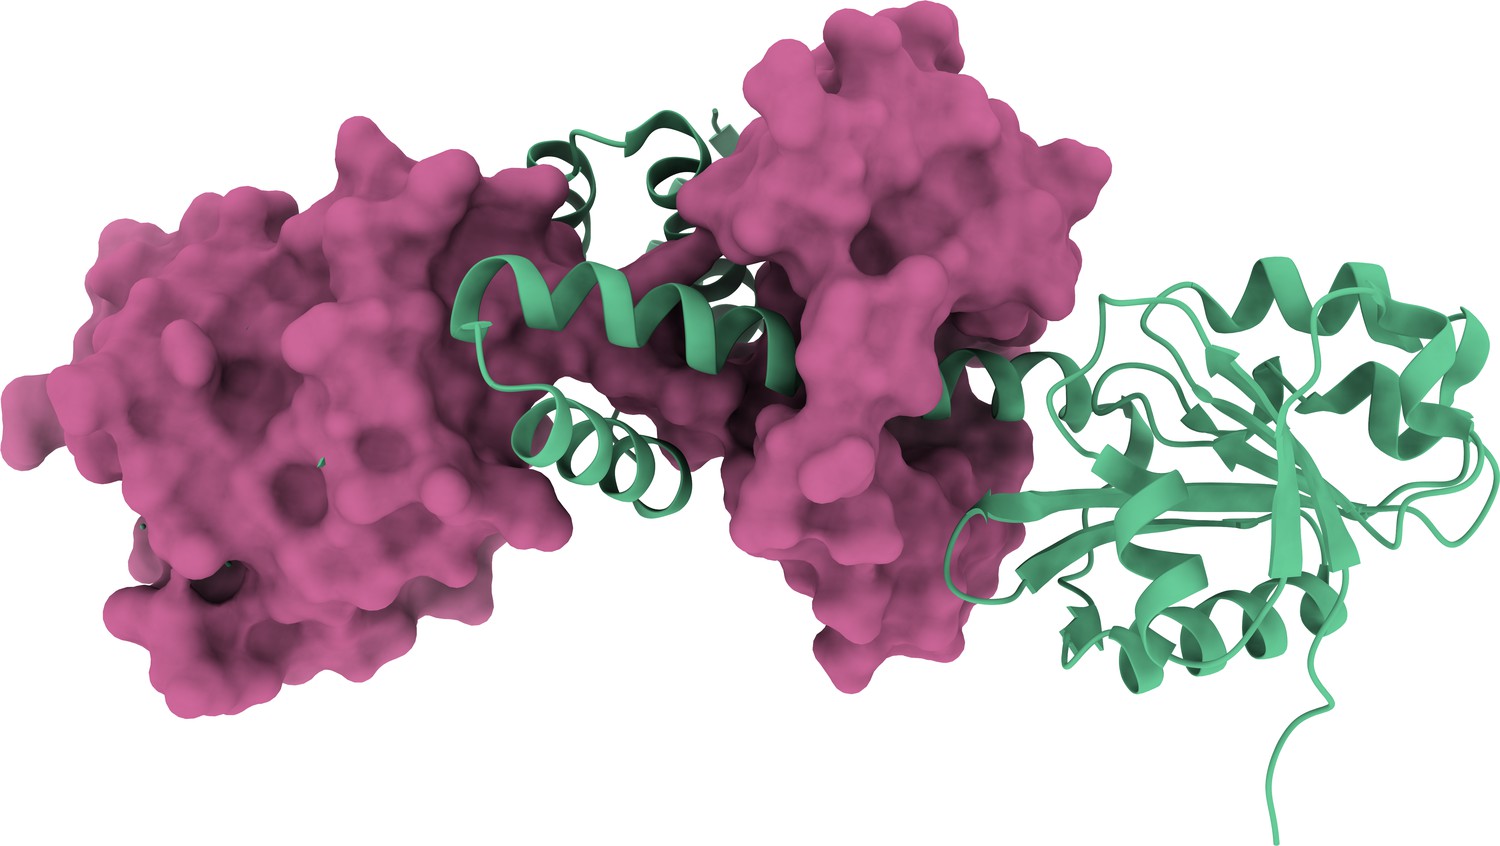
3D structure of the homodimer (PDB: 3DFU).
Figure 7—figure supplement 2
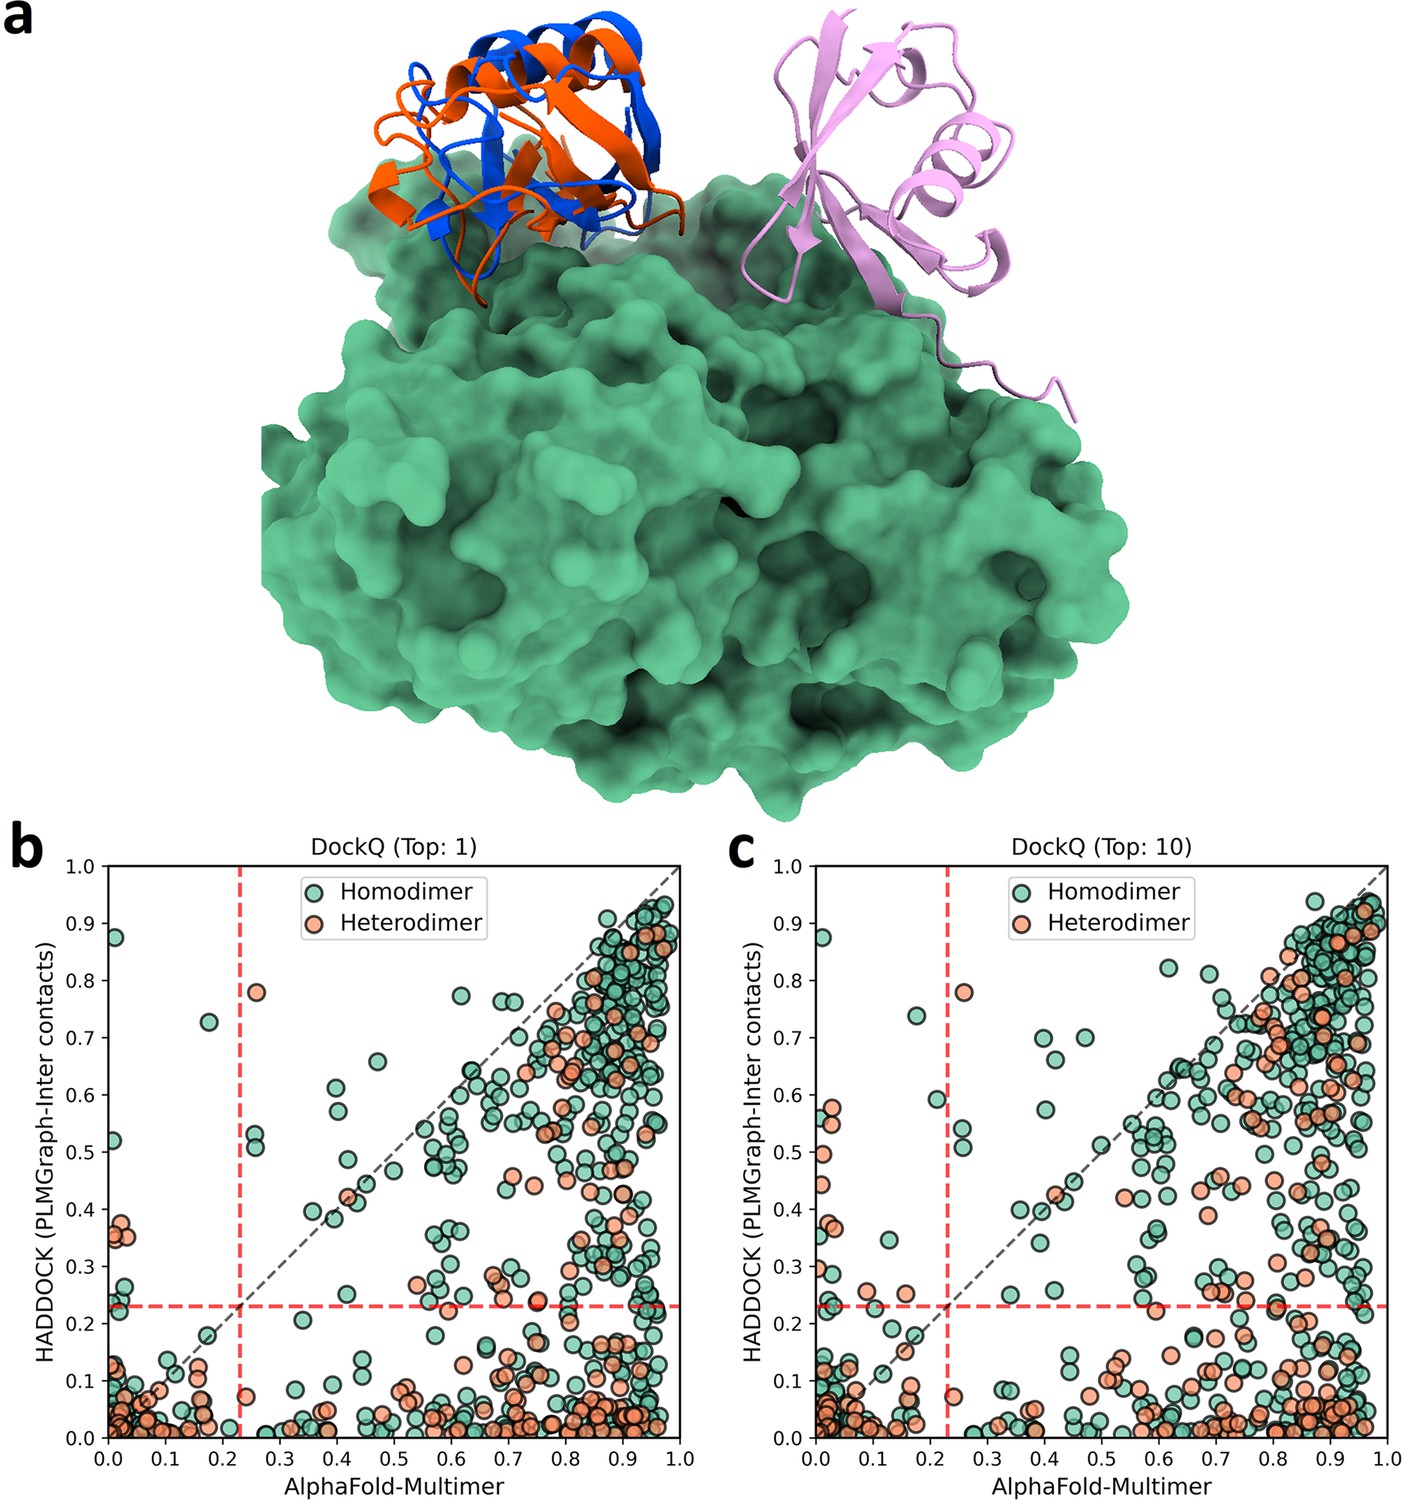
The comparison of HADDOCK (with PLMGraph-Inter contact constraints) with AlphaFold-Multimer in protein complex structure prediction.
(a) The binding configurations predicted by HADDOCK (orange, DockQ: 0.375), predicted by AlphaFold-Multimer (pink, DockQ: 0) and the native binding configuration (blue) for chain B of the protein complex structure in PDB 5HPS. Chain A is shown in the protein surface mode (green). (b, c) The head-to-head comparison of qualities of the (a) top 1 or (b) top 10 model predicted by HADDOCK with using PLMGraph-Inter predicted contacts as restraints and AlphaFold-Multimer for each target protein–protein interaction (PPI).
Author response image 1

The head-to-head comparison of qualities of complex predicted by AlphaFold-Multimer (2.2.0) and AlphaFold-Multimer (2.3.2) for each target PPI.
Tables
Table 1
The performances of DeepHomo, GLINTER, DRN-1D2D_Inter, DeepHomo2, CDPred, and PLMGraph-Inter on the HomoPDB and HeteroPDB test sets using experimental structures (AlphaFold2 predicted structures).
| Methods | HomoPDB (precision %) | HeteroPDB (precision %) | ||||||||
|---|---|---|---|---|---|---|---|---|---|---|
| L/5 | L/10 | 50 | 10 | 5 | L/5 | L/10 | 50 | 10 | 5 | |
| DeepHomo | 43.2 (39.3) | 46.7 (42.7) | 42.4 (38.8) | 48.5 (44.8) | 49.9 (46.2) | |||||
| GLINTER | 42.9 (47.3) | 45.0 (50.1) | 42.2 (52.1) | 46.4 (51.9) | 48.5 (53.6) | 23.9 (25.1) | 24.7 (27.0) | 20.9 (21.9) | 25.5 (25.8) | 26.7 (26.2) |
| DRN-1D2D_Inter | 52.5 | 55.2 | 51.3 | 56.6 | 57.6 | 34.9 | 37.1 | 32.6 | 38.1 | 38.5 |
| DeepHomo2 | 55.6 (52.4) | 58.1 (53.9) | 55.0 (51.7) | 59.4 (55.7) | 61.3 (56.7) | |||||
| CDPred | 59.4 (54.7) | 61.3 (56.2) | 58.4 (54.1) | 62.4 (57.1) | 62.9 (57.7) | 30.0 (30.2) | 31.0 (31.7) | 27.6 (27.3) | 32.0 (32.2) | 32.1 (32.7) |
| PLMGraph-Inter | 68.6 (61.8) | 70.4 (63.6) | 67.3 (60.9) | 71.6 (65.0) | 72.1 (65.25) | 45.9 (41.9) | 48.6 (43.6) | 41.4 (37.8) | 49.1 (44.1) | 51.6 (45.0) |
-
The highest mean precision (%) in each column is highlighted in bold.
Table 2
The performance of PLMGraph-Inter when using different sequence identity and fold similarity thresholds to further remove potential redundancies in HomoPDB and HeteroPDB.
| HomoPDB | HeteroPDB | ||||
|---|---|---|---|---|---|
| Count | Precision (Top 50 [%]) | Count | Precision (Top 50 [%]) | ||
| Sequence identity (MMSeqs2) | Original | 400 | 67.3 (60.9) | 200 | 41.4 (37.8) |
| 40% | 341 | 68.7 (62.5) | 160 | 38.6 (35.6) | |
| 30% | 257 | 64.7 (58.7) | 144 | 38.1 (35.1) | |
| 20% | 211 | 63.2 (56.3) | 138 | 38.5 (35.3) | |
| 10% | 211 | 63.2 (56.3) | 138 | 38.5 (35.3) | |
| Fold similarity (TM-align) | 0.9 | 370 | 65.2 (58.3) | 185 | 39.7 (35.7) |
| 0.8 | 281 | 61.8 (53.4) | 153 | 38.1 (34.1) | |
| 0.7 | 179 | 56.5 (45.8) | 126 | 38.8 (34.6) | |
| 0.6 | 124 | 50.4 (39.9) | 102 | 37.4 (34.1) | |
| 0.5 | 70 | 49.6 (41.3) | 83 | 36.5 (34.5) | |
-
The results using experimental structures are shown outside the parentheses, and the results using the AlphaFold2 predicted structures are shown inside the parentheses.
Additional files
-
Supplementary file 1
The performances of DeepHomo, GLINTER, DRN-1D2D_Inter, DeepHomo2, CDPred, and PLMGraph-Inter on HomoPDB and HeteroPDB after the removal of targets which GLINTER failed to make the prediction using experimental structures (AlphaFold2 predicted structures).
- https://cdn.elifesciences.org/articles/92184/elife-92184-supp1-v2.docx
-
Supplementary file 2
The performances of different ablation study models on the HomoPDB and HeteroPDB test sets.
- https://cdn.elifesciences.org/articles/92184/elife-92184-supp2-v2.docx
-
Supplementary file 3
The performances of DeepHomo, GLINTER, DRN-1D2D_Inter, DeepHomo2, CDPred, and PLMGraph-Inter on the DHTest and DB5.5 test sets using experimental structures (AlphaFold2 predicted structures).
- https://cdn.elifesciences.org/articles/92184/elife-92184-supp3-v2.docx
-
Supplementary file 4
The performances of DeepHomo, GLINTER, DRN-1D2D_Inter, DeepHomo2, CDPred, and PLMGraph-Inter on DHTest and DB5.5 after the removal of targets which GLINTER failed to make the prediction using experimental structures (AlphaFold2 predicted structures).
- https://cdn.elifesciences.org/articles/92184/elife-92184-supp4-v2.docx
-
Supplementary file 5
The performances of AlphaFold-Multimer and PLMGraph-Inter on the homodimer and heterodimer test sets.
- https://cdn.elifesciences.org/articles/92184/elife-92184-supp5-v2.docx
-
MDAR checklist
- https://cdn.elifesciences.org/articles/92184/elife-92184-mdarchecklist1-v2.pdf
Download links
A two-part list of links to download the article, or parts of the article, in various formats.
Downloads (link to download the article as PDF)
Open citations (links to open the citations from this article in various online reference manager services)
Cite this article (links to download the citations from this article in formats compatible with various reference manager tools)
Protein language model-embedded geometric graphs power inter-protein contact prediction
eLife 12:RP92184.
https://doi.org/10.7554/eLife.92184.3


