Syntaxin 17 recruitment to mature autophagosomes is temporally regulated by PI4P accumulation
- Department of Biochemistry and Molecular Biology, Graduated School of Medicine, The University of Tokyo, Japan
- Department of Biosystems Science, Institute for Life and Medical Sciences, Kyoto University, Japan
- Department of Molecular Oncology, Institute for Advanced Medical Sciences, Nippon Medical School, Japan
Figures
Figure 1 with 1 supplement
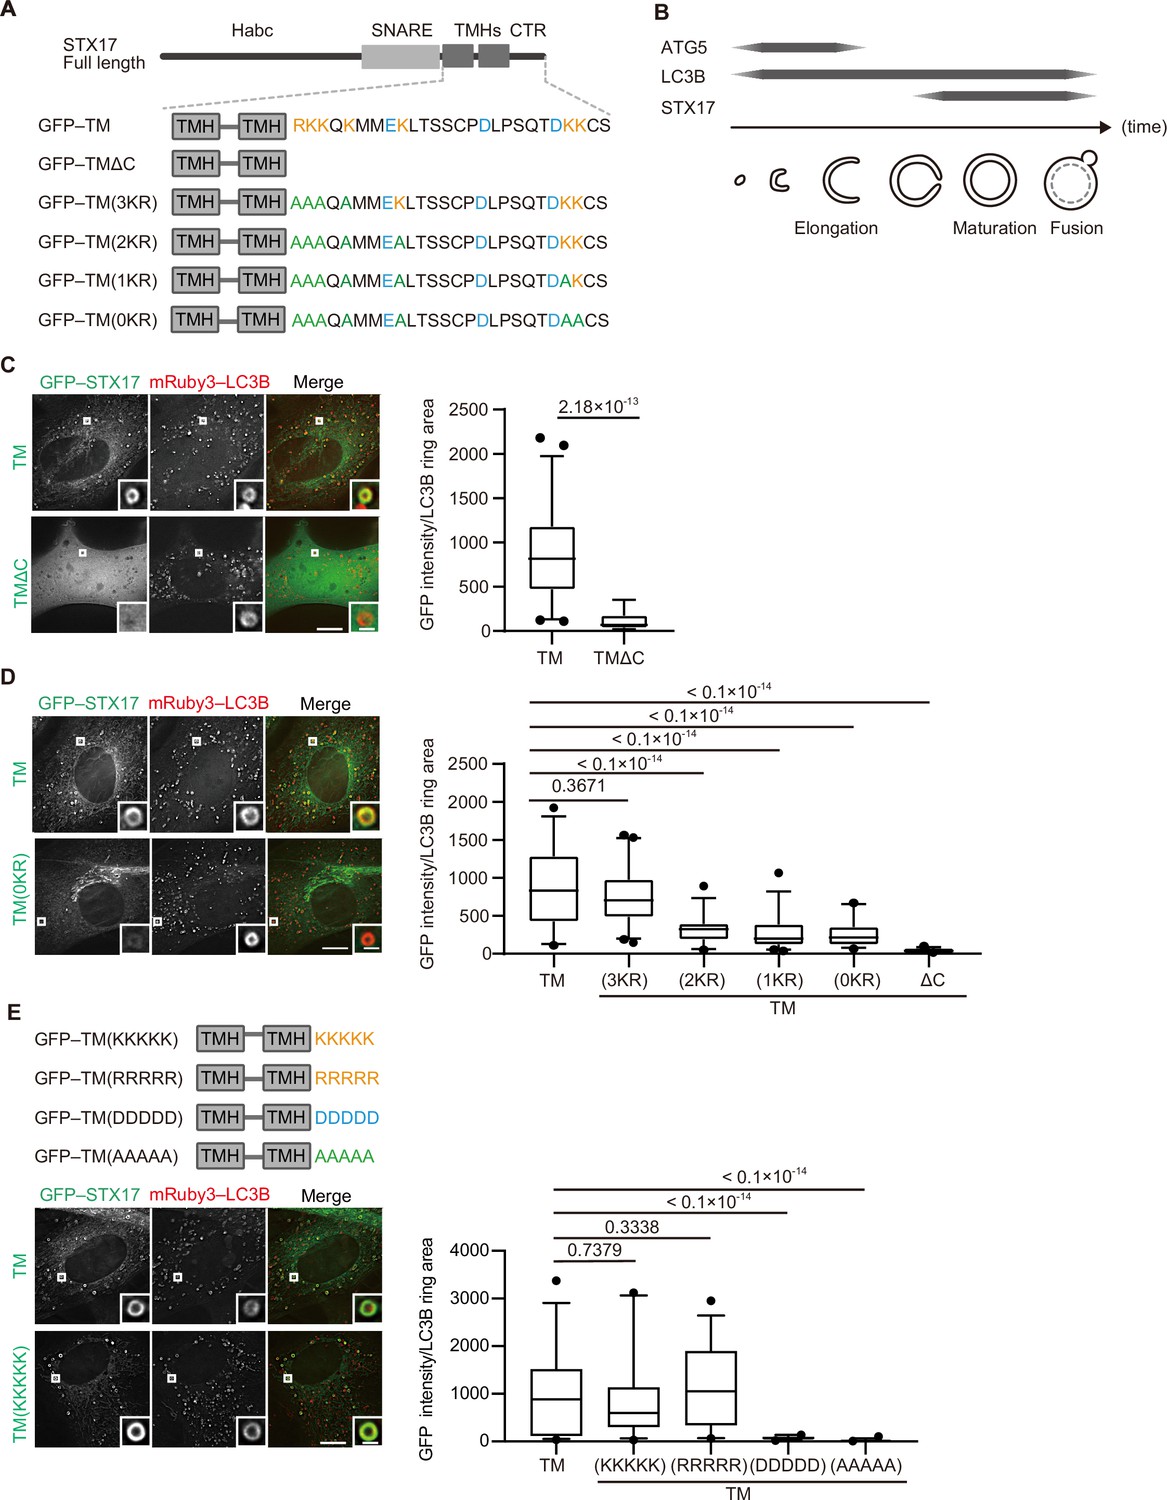
The recruitment of STX17 to autophagosomes is dependent on its positively charged C-terminal region.
(A) Schematic representation of the structures of STX17 and its C-terminal variants. The positively (orange) and negatively (blue) charged residues are shown. Alanine substitutions are shown in green. TMH, transmembrane helix; CTR, C-terminal region. (B) Schematic representation of the localization of ATG5, LC3B, and STX17 during autophagosome formation and maturation. (C–E) Mouse embryonic fibroblasts (MEFs) stably expressing mRuby3-LC3B and GFP–STX17TM (containing the two transmembrane helices and the C-terminal region) or its mutants were cultured in starvation medium for 1 hr. Quantification of GFP–STX17TM intensity of mRuby3–LC3B-positive ring-like structures (n>30) are shown in the graphs. In box plots, solid horizontal lines indicate medians, boxes indicate the interquartile ranges (25th to 75th percentiles), whiskers indicate the 5th to 95th percentiles, and dots represent outliers. Differences were statistically analyzed by Welch’s t-test (C) or one-way ANOVA followed by Dunnett’s multiple comparison test (D and E). Experiments were performed three times independently. Scale bars, 10 μm (main), 1 μm (inset) (C, D, and E).
-
Figure 1—source data 1
Data used for graphs presented in Figure 1C, D and E and Figure 1—figure supplement 1B.
- https://cdn.elifesciences.org/articles/92189/elife-92189-fig1-data1-v1.xlsx
Figure 1—figure supplement 1
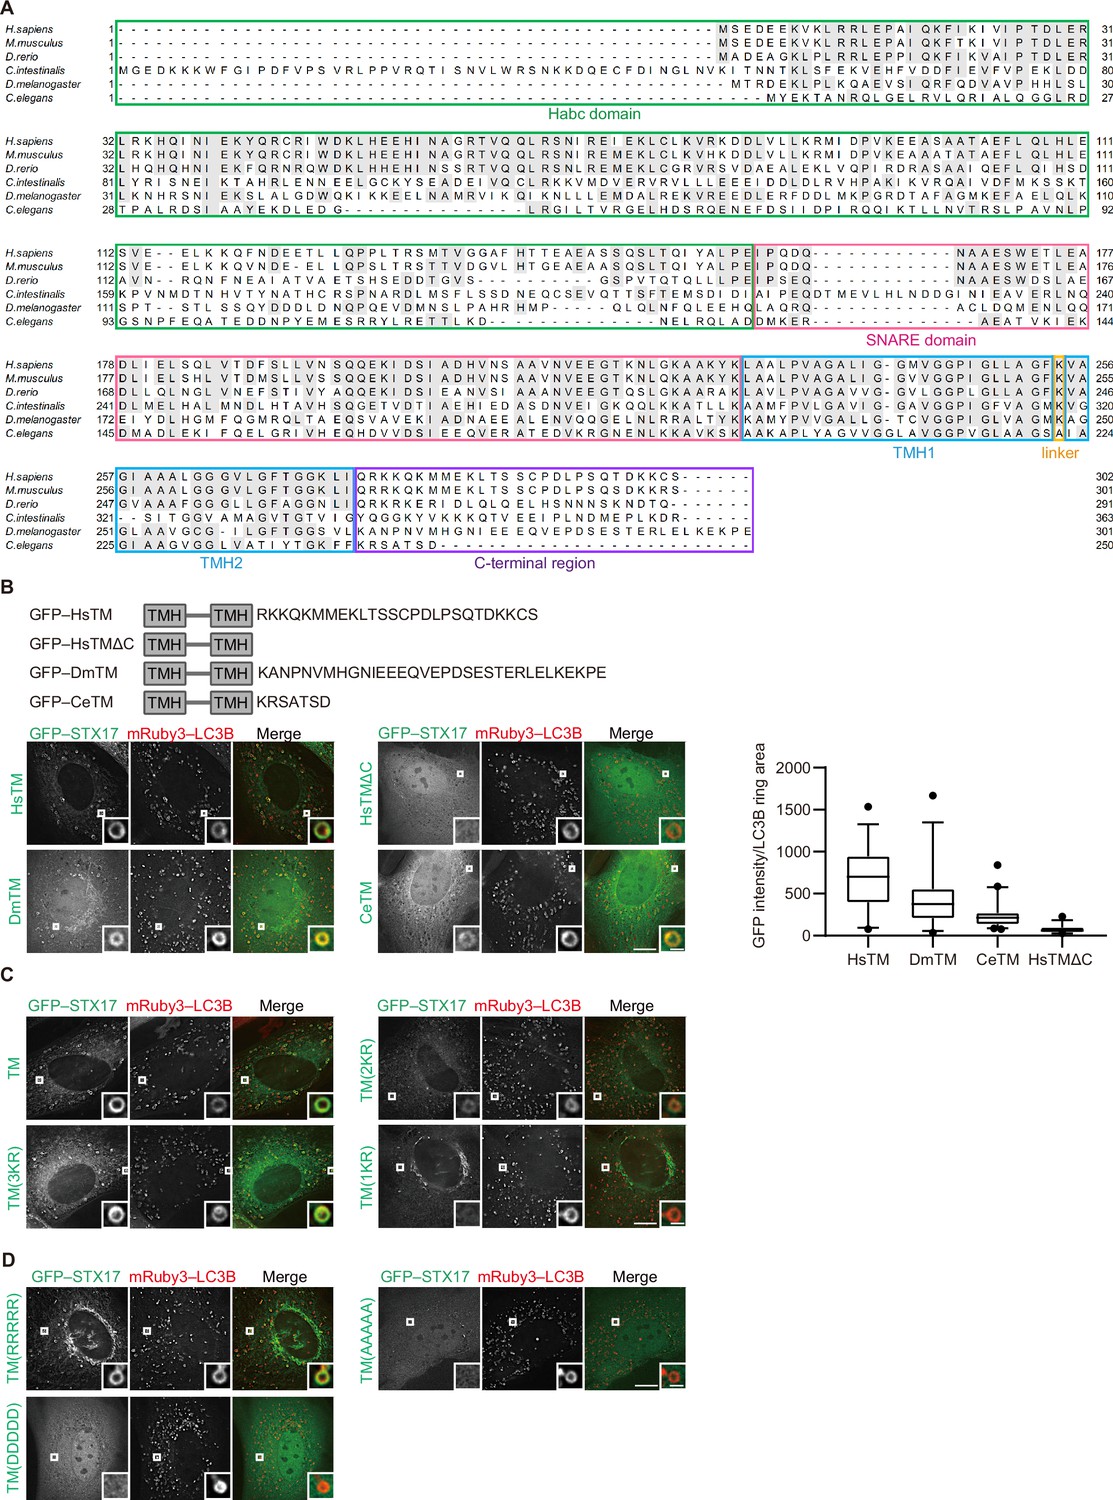
Recruitment of STX17 depends on the abundance of cationic amino acids in the C-terminal region but not on its specific amino acid sequence.
(A) Multiple sequence alignment of STX17 proteins from Homo sapiens (Hs), Mus musculus, Danio rerio, Ciona intestinalis, Drosophila melanogaster (Dm), and Caenorhabditis elegans (Ce). Identical residues between more than two species are indicated with gray boxes. Domains of STX17 are indicated with different colors: green, the Habc domain; magenta, the SNARE domain; blue, transmembrane helix (TMH); orange, a linker between the TMDs; and purple, the C-terminal region. (B) Mouse embryonic fibroblasts (MEFs) stably expressing mRuby3–LC3B and either GFP-tagged HsSTX17TM, DsSTX17TM, or CeSTX17TM were cultured in starvation medium for 1 hr. GFP–STX17TM intensities of mRuby3–LC3B-positive ring-like structures were quantified (n>30). In box plots, solid horizontal lines indicate medians, boxes indicate the interquartile ranges (25th to 75th percentiles), whiskers indicate the 5th to 95th percentiles, and dots represent outliers. (C) MEFs stably expressing one of the GFP-tagged alanine replacement mutants (shown in Figure 1A) and mRuby3–LC3B were cultured in starvation medium for 1 hr. Quantification results are shown in Figure 1D. (D) MEFs stably expressing one of the GFP-tagged charge replacement mutants (shown in Figure 1E) and mRuby3–LC3B were cultured in starvation medium for 1 hr. Quantification results are shown in Figure 1E. Experiments were performed three times independently. Scale bars, 10 μm (main), 1 μm (inset) (B, C, and D).
Figure 2 with 1 supplement
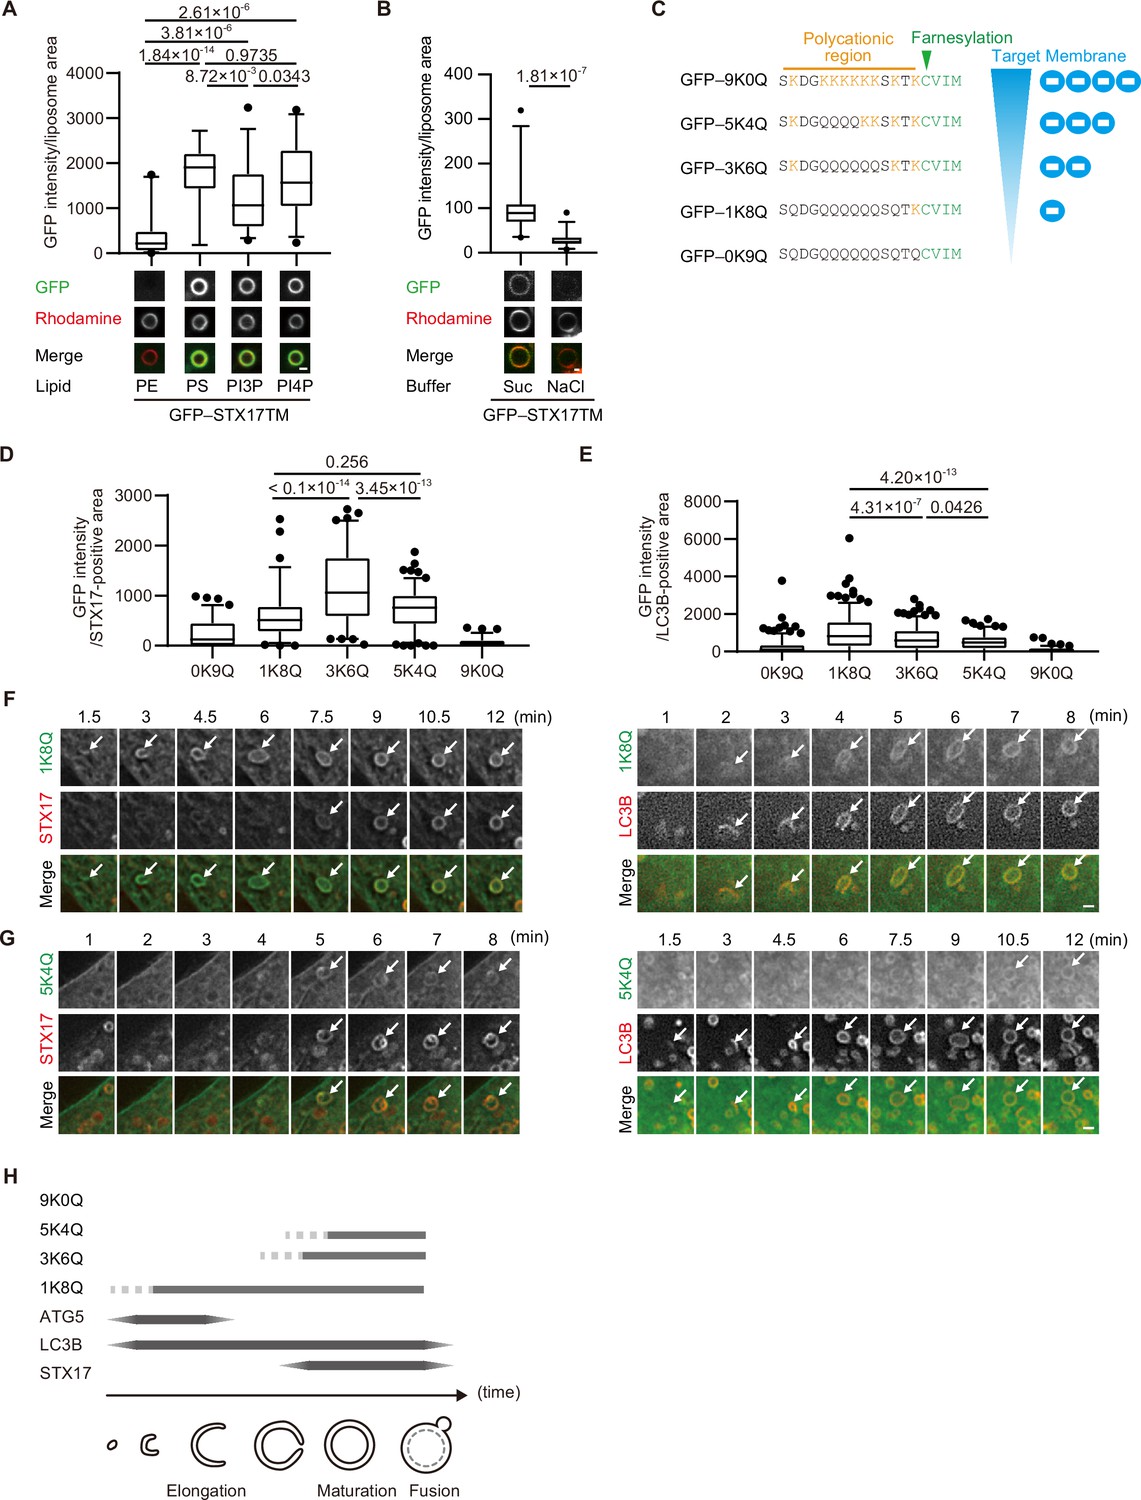
The membrane of autophagosomes becomes negatively charged during maturation.
(A) GFP–STX17TM translated in vitro was incubated with rhodamine-labeled liposomes containing the indicated concentrations of phospholipids: 70% phosphatidylcholine (PC), 20% phosphatidylethanolamine (PE), and 10% of either PE, phosphatidylserine (PS), phosphatidylinositol 3-phosphate (PI3P), or phosphatidylinositol 4-phosphate (PI4P). GFP intensities of liposomes are quantified and shown as in Figure 1C (n>30). (B) GFP–STX17TM translated in vitro was incubated with rhodamine-labeled liposomes containing 70% PC, 20% PE and 10% PI4P in the presence of 1 M NaCl or 1.2 M sucrose. GFP intensities of liposomes were quantified and shown as in Figure 1C (n>30). (C) Amino acid sequences of GFP-tagged membrane surface charge probes. The positively charged residues are shown in orange. The farnesylation motif is indicated in green. (D and E) Mouse embryonic fibroblasts (MEFs) stably expressing one of the GFP-tagged charge probes and mRuby3-STX17TM (C) or mRuby3–LC3B (D) were cultured in starvation medium for 1 hr. GFP intensities of mRuby3–STX17TM-positive (C) or mRuby3–LC3B-positive (D) ring-like structures were quantified (n>70). (F and G) Time-lapse analysis of MEFs stably expressing the GFP-tagged 1K8Q (E) or 5K4Q (F) charge probes and mRuby3–STX17TM or mRuby3–LC3B cultured in starvation medium. Autophagosomes are indicated by arrows. (H) Summary of electrostatic dynamics of autophagosome formation. In box plots, solid horizontal lines indicate medians, boxes indicate the interquartile ranges (25th to 75th percentiles), whiskers indicate the 5th to 95th percentiles, and dots represent outliers. Differences were statistically analyzed by Welch’s t-test (B) or one-way ANOVA followed by Sidak’s multiple comparison test (A, C, and D). Experiments were performed three times independently. Scale bars, 1 μm (A, B, F, and G).
-
Figure 2—source data 1
Data used for graphs presented in Figure 2A, B, D and E.
- https://cdn.elifesciences.org/articles/92189/elife-92189-fig2-data1-v1.xlsx
Figure 2—figure supplement 1
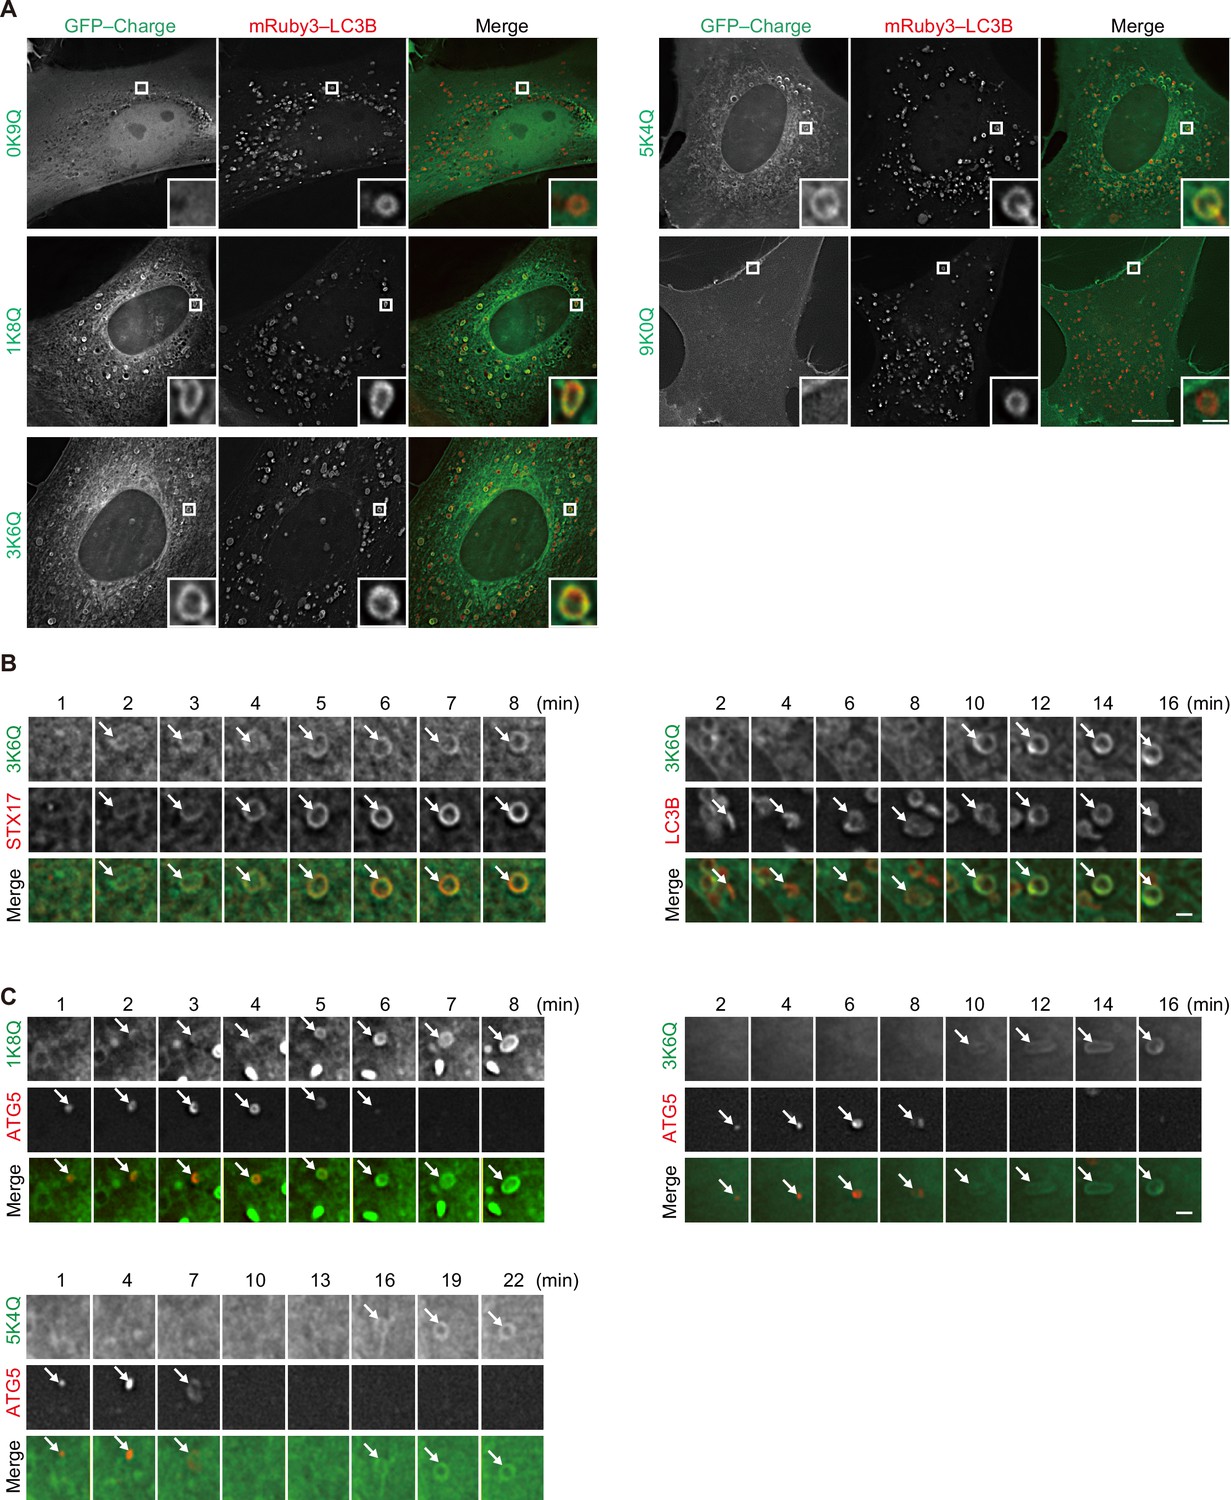
The membrane of autophagosomes becomes negatively charged during maturation.
(A) Mouse embryonic fibroblasts stably expressing one of the GFP-tagged charge probes and mRuby3–LC3B were cultured in starvation medium for 1 hr. (B) Time-lapse analysis of MEFs stably expressing GFP–3K6Q and mRuby3–STX17TM or mRuby3–LC3B cultured in starvation medium. Autophagosomes are indicated by arrows. (C) Time-lapse analysis of MEFs stably expressing one of the GFP-tagged charge probes and mRuby3–ATG5 cultured in starvation medium. Autophagosomes are indicated by arrows. Experiments were performed three times independently. Scale bars, 10 μm (A [main]), 1 μm (A [inset], B and C).
Figure 3 with 2 supplements
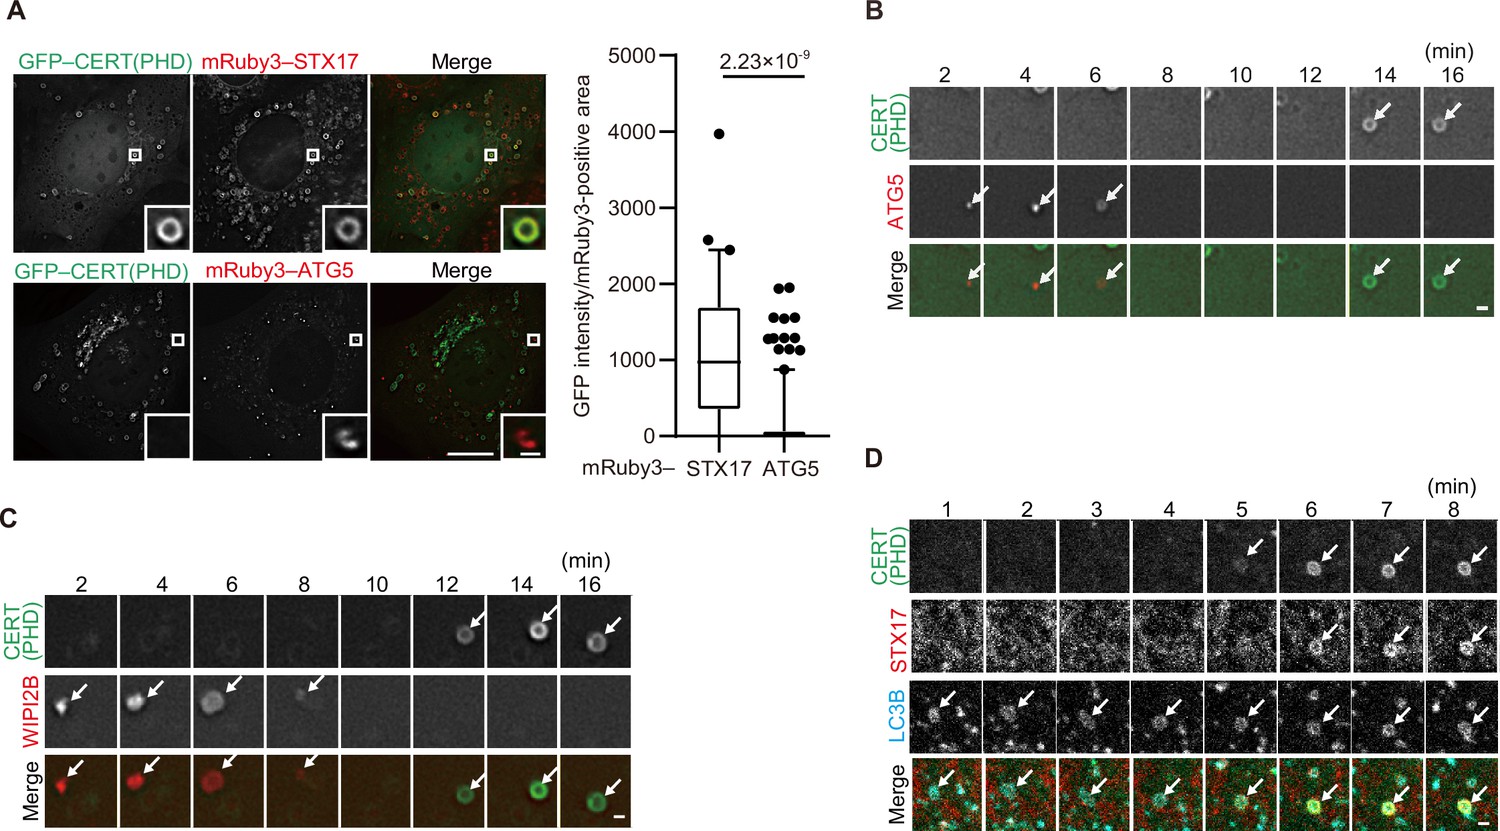
Phosphatidylinositol 4-phosphate (PI4P) is enriched in the autophagosomal membrane during maturation.
(A) Mouse embryonic fibroblasts (MEFs) stably expressing GFP–CERT(PHD) and mRuby3–STX17TM or mRuby3–ATG5 were cultured in starvation medium for 1 hr. GFP intensities of mRuby3-positive structures (n>60) were quantified. In box plots, solid horizontal lines indicate medians, boxes indicate the interquartile ranges (25th to 75th percentiles), whiskers indicate the 5th to 95th percentiles, and dots represent outliers. Differences were statistically analyzed by Welch’s t-test. (B–D) Time-lapse analysis of MEFs stably expressing GFP–CERT(PHD) and mRuby3–ATG5 (B), WIPI2B–mRuby3 (C), or mRuby3–STX17TM and HaloTag–LC3B (visualized with SaraFluor 650T HaloTag ligand) (D) cultured in starvation medium. Autophagosomes are indicated by arrows. Experiments were performed three times independently. Scale bars, 10 μm (A [main]), 1 μm (A [inset], B–D).
-
Figure 3—source data 1
Data used for graphs presented in Figure 3A and Figure 3—figure supplement 2C.
- https://cdn.elifesciences.org/articles/92189/elife-92189-fig3-data1-v1.xlsx
Figure 3—figure supplement 1
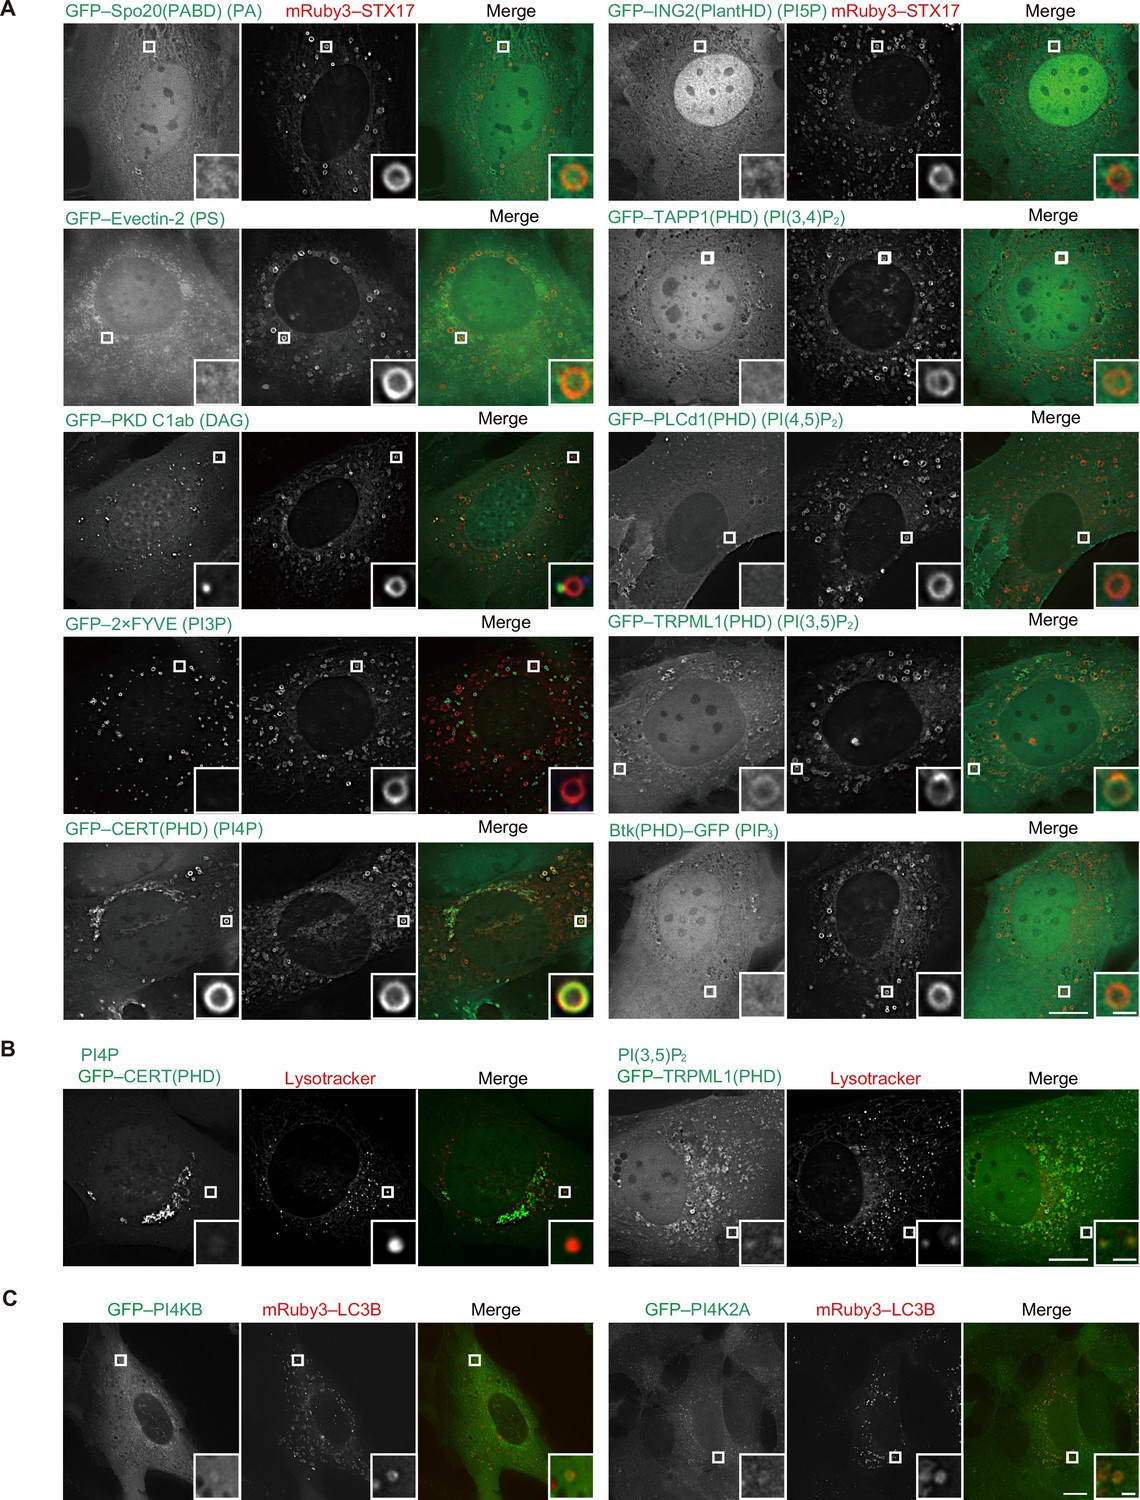
Localization of phospholipids in mature autophagosomes.
(A) Mouse embryonic fibroblasts (MEFs) stably expressing the indicated GFP-tagged phospholipid probe and mRuby3–STX17TM were cultured in starvation medium for 1 hr. The following phospholipid probes were used: phosphatidic acid (PA), Spo20(PABD); PS, Evectin-2; diacylglycerol (DAG), PKD C1ab; PI3P, 2×FYVE; PI4P, CERT(PHD); PI5P, ING2(PlantHD); PI(3,4)P2, TAPP1(PHD); PI(4,5)P2, PLCd1(PHD); PI(3,5)P2, TRPML1(PHD); and PIP3, Btk(PHD). (B) MEFs stably expressing GFP–CERT(PHD) or TRPML1(PHD) were cultured in starvation medium containing LysoTracker Deep Red for 1 hr. (C) MEFs stably expressing GFP–PI4KB or GFP–PI4K2A and mRuby3–LC3B were cultured in starvation medium for 1 hr. Experiments were performed three times independently. Scale bars, 10 μm (main), 1 μm (inset).
Figure 3—figure supplement 2
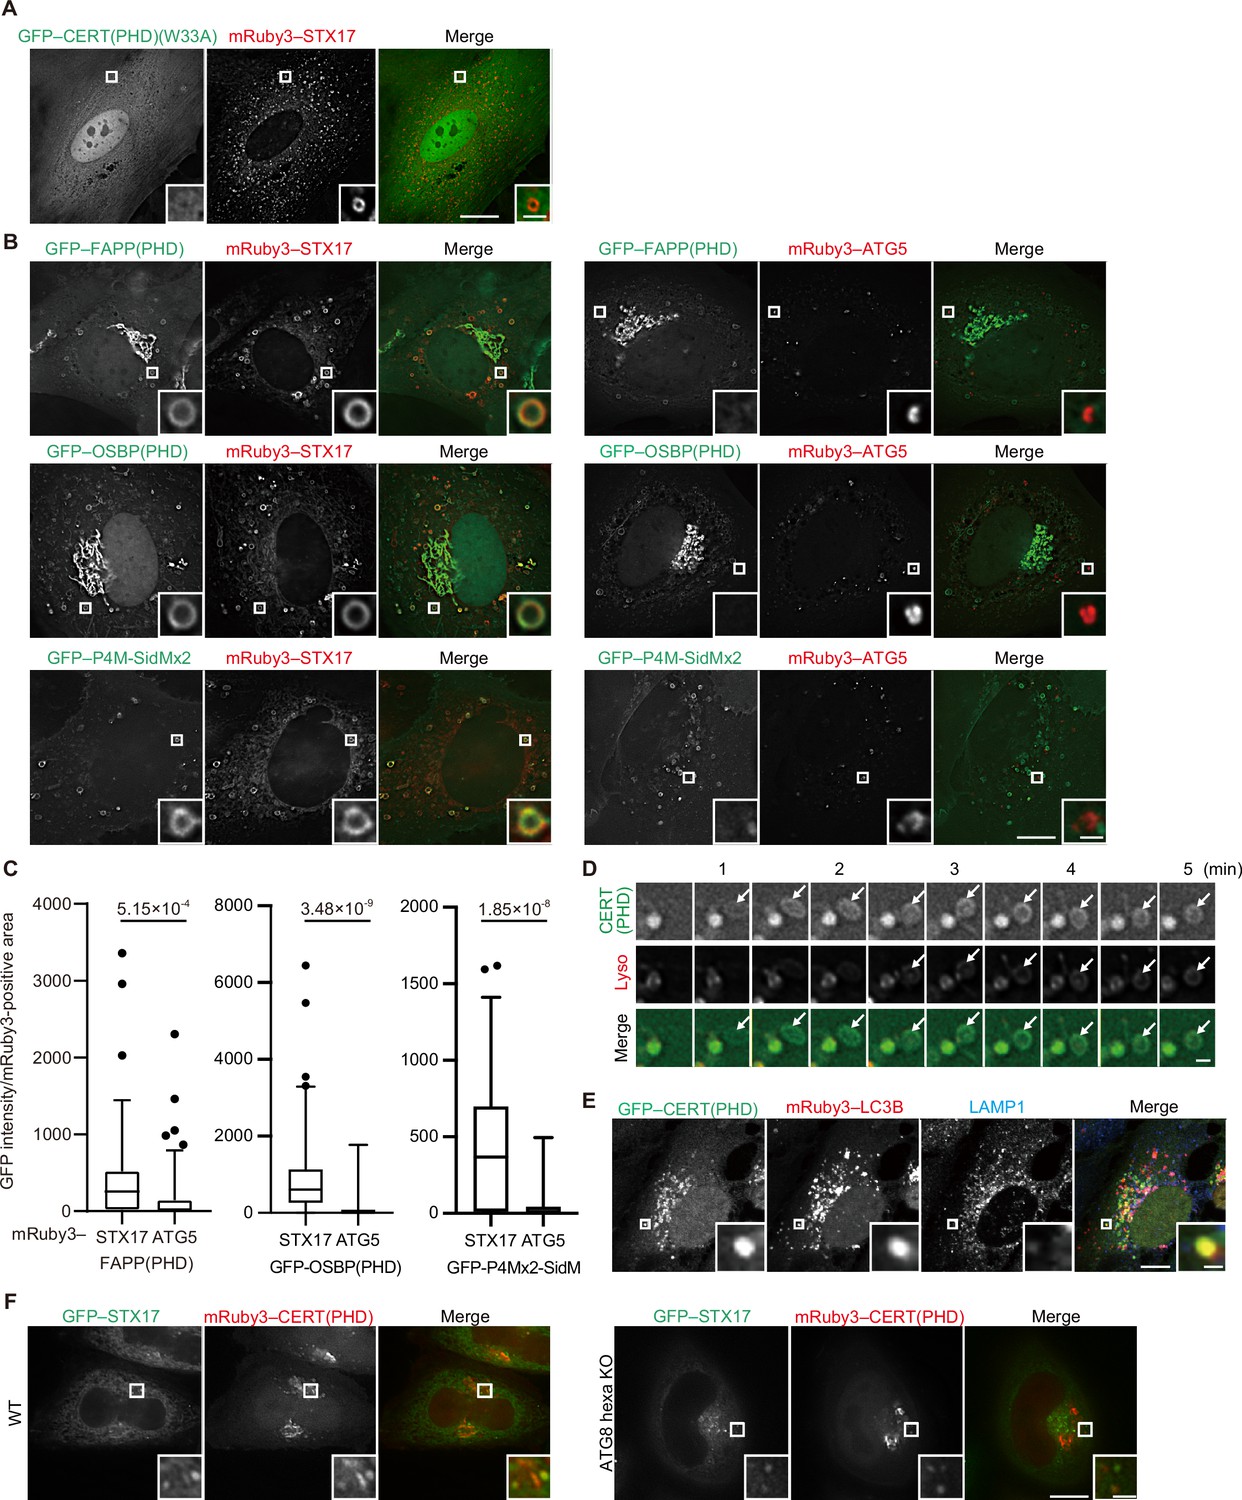
Phosphatidylinositol 4-phosphate (PI4P) is enriched in mature autophagosomes before fusion with lysosomes.
(A and B) Mouse embryonic fibroblasts (MEFs) stably expressing the indicated GFP-tagged PI4P probe, CERT(PHD)(W33A), FAPP(PHD), OSBP(PHD) or P4M-SidMx2, and mRuby3–STX17TM or mRuby3–ATG5 were cultured in starvation medium for 1 hr. (C) GFP intensities of mRuby3-positive structures (n>50) in (B) were quantified. In box plots, solid horizontal lines indicate medians, boxes indicate the interquartile ranges (25th to 75th percentiles), whiskers indicate the 5th to 95th percentiles, and dots represent outliers. Differences were statistically analyzed by Welch’s t-test. (D) Time-lapse analysis of MEFs stably expressing GFP–CERT(PHD) cultured in starvation medium containing LysoTracker Deep Red. (E) U2OS cells stably expressing GFP–CERT(PHD) and mRuby3–LC3B were transfected with siSTX17 and siYKT6. After 3 days, cells were cultured in starvation medium for 1 hr, and immunostained with anti-LAMP1 antibodies. (F) WT and ATG8 hexa KO HeLa cells stably expressing GFP–STX17TM and transiently expressing mRuby3–CERT(PHD) were cultured in starvation medium for 1 hr. Experiments were performed three times independently. Scale bars, 10 μm (A, B, and E [main]), 1 μm (A, B, E [inset], and D).
Figure 4 with 1 supplement
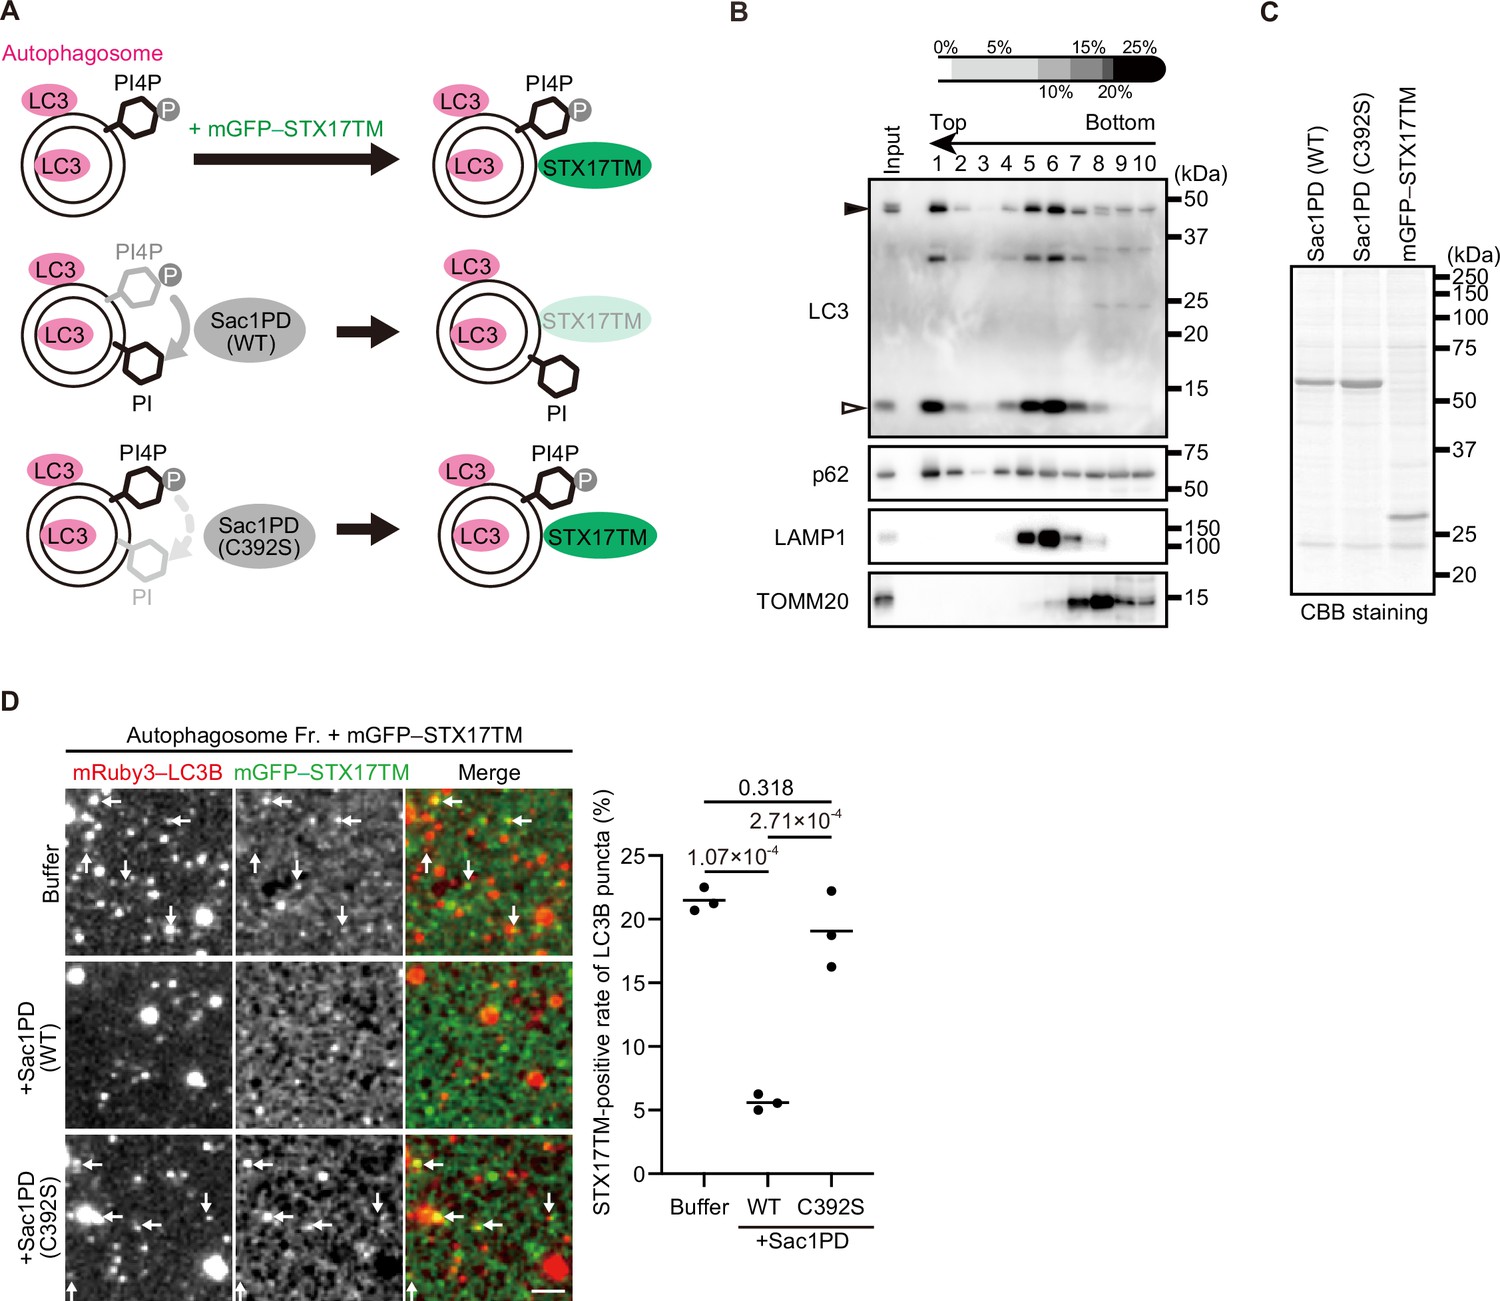
STX17 recruitment to autophagosomes depends on phosphatidylinositol 4-phosphate (PI4P) in vitro.
(A) Schematic representation of the in vitro autophagosome recruitment assay. Isolated autophagosomes were mixed with mGFP–STX17TM and either recombinant Sac1-phosphatase domain (Sac1PD) or its phosphatase-dead mutant (C392S). (B) Isolation of mature autophagosomes prior to their fusion with lysosomes. Homogenates of STX17 knockout HeLa cells stably expressing mRuby3–LC3B cultured in starvation medium at 1 hr were separated by the OptiPrep membrane flotation method. The autophagosome-containing fraction (#1: LC3-positive and LAMP1-negative) was collected. The positions of mRuby3–LC3B (black arrowhead) and endogenous LC3B (white arrowhead) are indicated. (C) Purification of recombinant yeast Sac1 (phosphatase domain, PD) and its phosphatase-dead (C392S) mutant and mGFP–STX17TM from High Five cells. (D) In vitro autophagosome association assay. Isolated autophagosomes were mixed with recombinant Sac1 (WT or C392S) for 30 min and then with mGFP–STX17TM for another 30 min. Representative images are shown. STX17-positivity rates were determined across three independent experiments (two of the three experiments were performed in a blind manner, and 80 autophagosomes were counted in each experiment). Solid horizontal lines indicate means. Differences were statistically analyzed by one-way ANOVA followed by Tukey’s test. The scale bar, 2.5 μm.
-
Figure 4—source data 1
Data used for graphs presented in Figure 4D, Figure 4—figure supplement 1A, B.
- https://cdn.elifesciences.org/articles/92189/elife-92189-fig4-data1-v1.xlsx
-
Figure 4—source data 2
Uncropped blot images of Figure 4B and C.
- https://cdn.elifesciences.org/articles/92189/elife-92189-fig4-data2-v1.zip
Figure 4—figure supplement 1
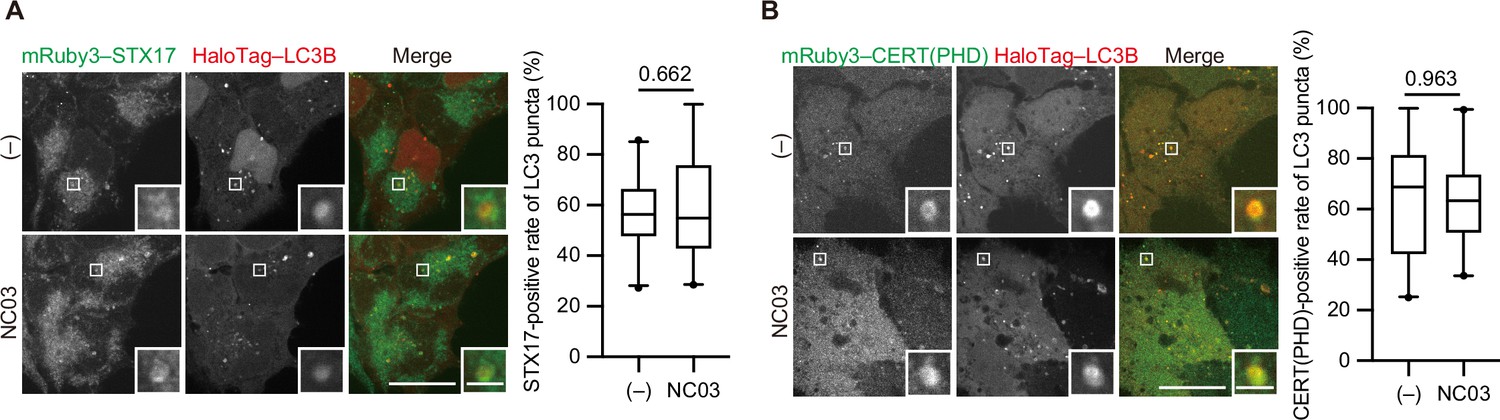
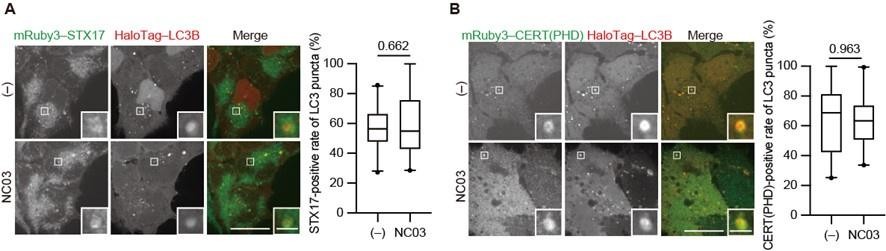
The PI 4-kinase inhibitor NC03 failed to suppress autophagosomal PI4P accumulation and STX17 recruitment.
HEK293T cells stably expressing mRuby3–STX17TM (A) or mRuby3–CERT(PHD) (B) and HaloTag-LC3B were cultured in starvation medium for 1 hr and then treated with and without 10 μM NC03 for 10 min. Representative confocal images are shown. STX17TM- or CERT(PHD)-positive rates of LC3B structures per cell (n>20 cells) are shown in the graphs. Solid horizontal lines indicate medians, boxes indicate the interquartile ranges (25th to 75th percentiles), whiskers indicate the 5th to 95th percentiles, and dots represent outliers. Differences were statistically analyzed by Welch’s t-test. Scale bars, 10 μm (main), 1 μm (inset).
Figure 5 with 3 supplements
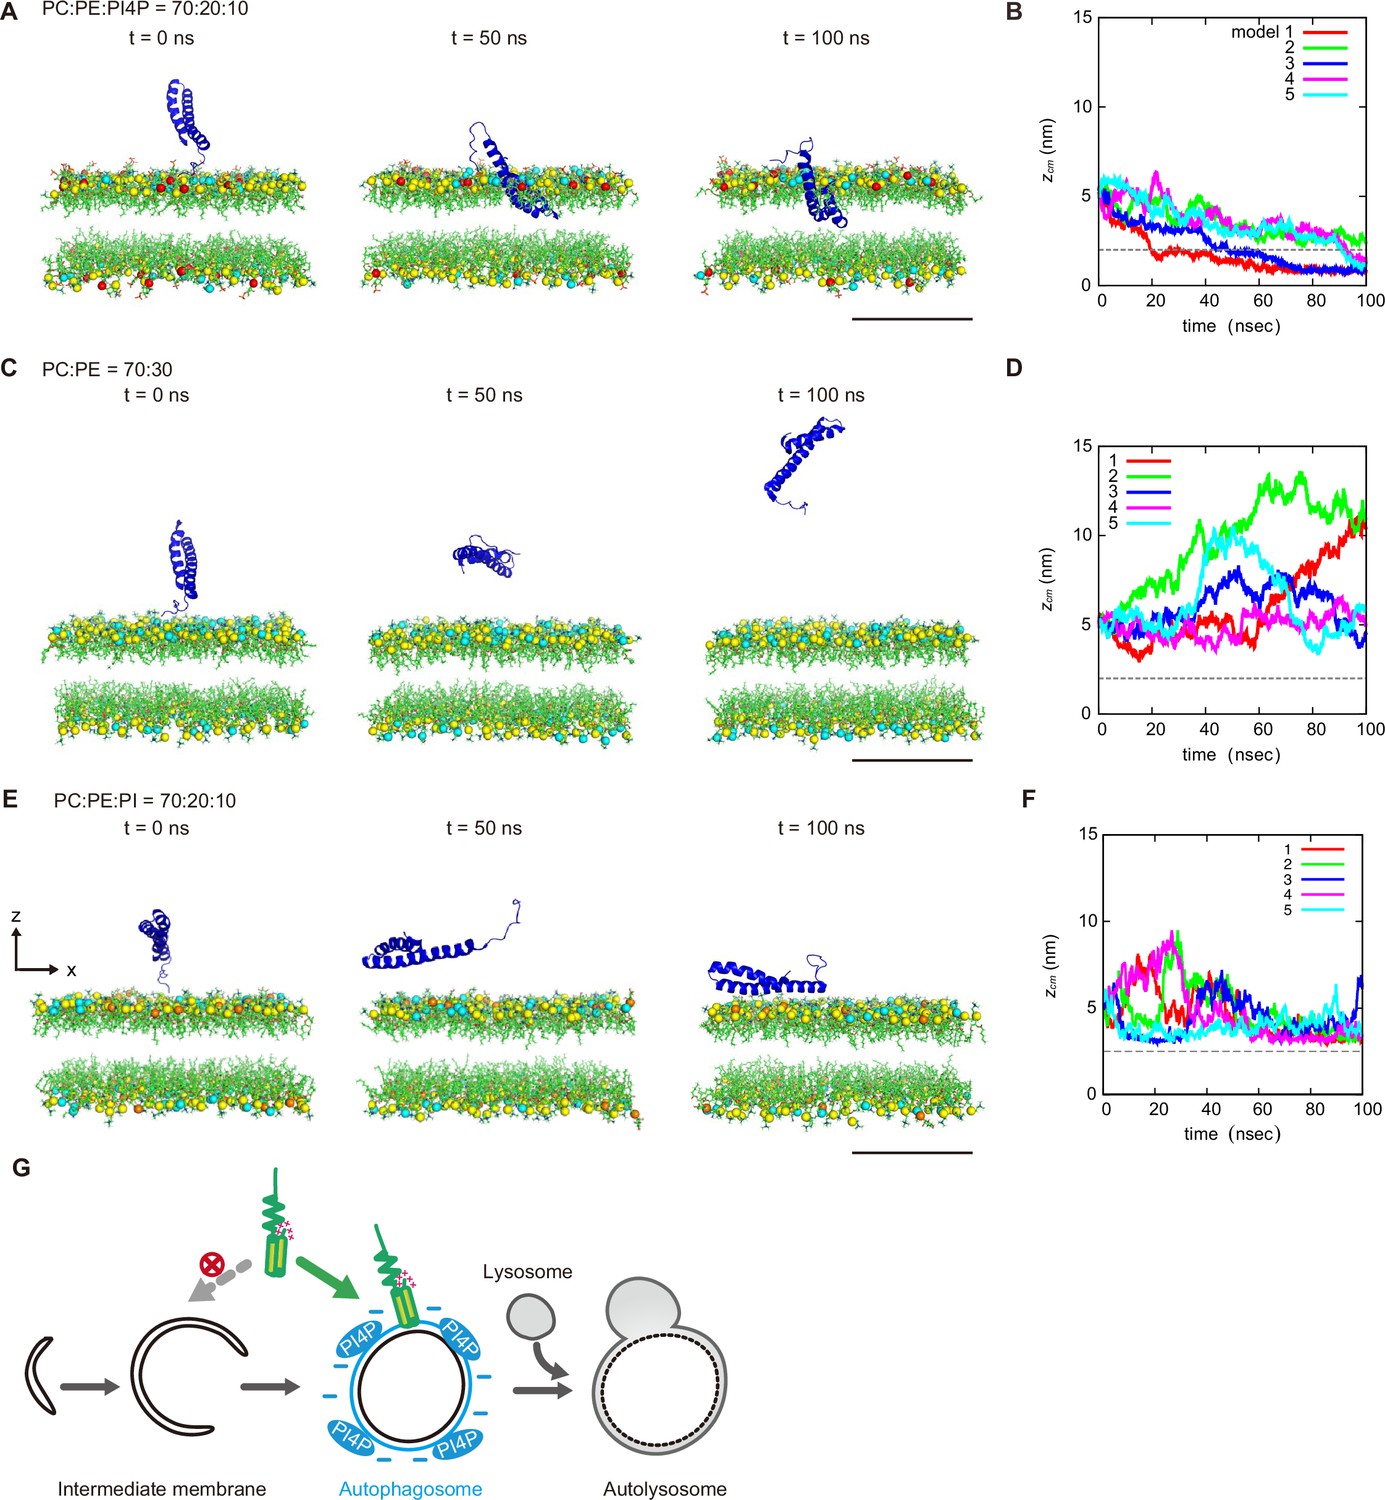
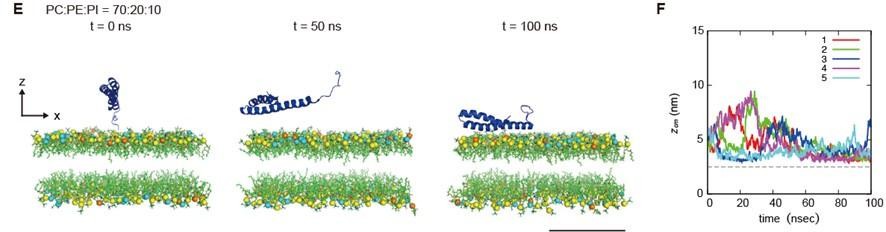
Molecular dynamics simulations of phosphatidylinositol 4-phosphate (PI4P)-dependent STX17TM insertion into membranes.
(A, C and E) An example of a time series of simulated results of STX17TM insertion into a membrane consisting of 70% phosphatidylcholine (PC), 20% phosphatidylethanolamine (PE), and 10% PI4P (POPI14) (A), 70% PC and 30% PE (C) or 70% PC, 20% PE and 10% phosphatidylinositol (PI) (E). STX17TM is shown in blue. Phosphorus in PC, PE, PI4P, and PI are indicated by yellow, cyan, red, and orange, respectively. Short-tailed lipids are represented as green sticks. The time evolution series of (A), (C and E) are shown in Figure 5—videos 1–3. (B, D and F) Time evolution of the z-coordinate of the center of mass () of the transmembrane helices of STX17TM in the case of membranes with PI4P (B) or PI (F) and without PI4P or PI (D). Five independent simulation results are represented by solid lines of different colors. The gray dashed lines indicate the locations of the lipid heads. Scale bars, 5 nm (A, C, and E). (G) Model of the PI4P-driven electrostatic maturation of the autophagosome and STX17 recruitment.
-
Figure 5—source data 1
Data used for graphs presented in Figure 5B, D and F.
- https://cdn.elifesciences.org/articles/92189/elife-92189-fig5-data1-v1.xlsx
Figure 5—video 1
Molecular dynamics simulations of STX17TM insertion into a phosphatidylinositol 4-phosphate (PI4P)-containing membrane.
STX17TM is shown in blue. Phosphorus in POPC (70%), POPE (20%), and PI4P (10%) are indicated by yellow, cyan, and red spheres, respectively. Short-tailed lipids are represented by green sticks. This video corresponds to Figure 5A.
Figure 5—video 2
Molecular dynamics simulations of STX17TM insertion into a membrane without phosphatidylinositol 4-phosphate (PI4P).
STX17TM is shown in blue. Phosphorus in POPC (70%) and POPE (30%) are indicated in yellow and cyan, respectively. Short-tailed lipids are represented by green sticks. This video corresponds to Figure 5C.
Figure 5—video 3
Molecular dynamics simulations of STX17TM insertion into a phosphatidylinositol (PI)-containing membrane.
STX17TM is shown in blue. Phosphorus in POPC (70%), POPE (20%), and PI (10%) are indicated by yellow, cyan, and orange spheres, respectively. Short-tailed lipids are represented by green sticks. This video corresponds to Figure 5E.
Author response image 1
The PI 4-kinase inhibitor NC03 failed to suppress autophagosomal PI4P accumulation and STX17 recruitment.
HEK293T cells stably expressing mRuby3–STX17TM (A) or mRuby3–CERT(PHD) (B) and Halotag-LC3 were cultured in starvation medium for 1 h and then treated with and without 10 μM NC03 for 10 min. Representative confocal images are shown. STX17TM- or CERT(PHD)-positive rates of LC3 structures per cell (n > 30 cells) are shown in the graphs. Solid horizontal lines indicate medians, boxes indicate the interquartile ranges (25th to 75th percentiles), and whiskers indicate the 5th to 95th percentiles. Differences were statistically analyzed by Welch’s t-test. Scale bars, 10 μm (main), 1 μm (inset).
Author response image 2
Molecular dynamics simulations showing that phosphatidylinositol is not sufficient for STX17TM insertion into membranes.
(E) An example of a time series of simulated results of STX17TM insertion into a membrane consisting of 70% phosphatidylcholine (PC), 20% phosphatidylethanolamine (PE), and 10% phosphatidylinositol (PI). STX17TM is shown in blue. Phosphorus in PC, PE and PI are indicated by yellow, cyan, and orange, respectively. Short-tailed lipids are represented as green sticks. The time evolution series are shown in Video 3. (F) Time evolution of the z-coordinate of the center of mass (z_cm) of the transmembrane helices of STX17TM in the case of membranes with PI. Five independent simulation results are represented by solid lines of different colors. The gray dashed lines indicate the locations of the lipid heads. A scale bar indicates 5 nm.
Author response image 3

GFP–STX17TM translated in vitro was incubated with rhodamine-labeled liposomes containing 70% PC, 20% PE and 10% PI4P in the presence of 1 M NaCl or 1.
2 M sucrose. GFP intensities of liposomes were quantified and shown as in Figure 1C (n > 30).
Author response image 4

Mouse embryonic fibroblasts (MEFs) stably expressing GFP–CERT(PHD)(W33A) and mRuby3–STX17TM were cultured in starvation medium for 1 h.
Bars indicate 10 μm (main images) and 1 μm (insets).
Author response image 5

WT and ATG8 hexa KO HeLa cells stably expressing GFP–STX17TM and transiently expressing mRuby3–CERT(PHD) were cultured in starvation medium.
Bars indicate 10 μm (main images) and 1 μm (insets).
Tables
Key resources table
| Reagent type (species) or resource | Designation | Source or reference | Identifiers | Additional information |
|---|---|---|---|---|
| Gene (H. sapiens) | STX17 | https://doi.org/10.1016/j.cell.2012.11.001 | ||
| Gene (D. melanpgaster) | STX17 | NCBI Reference Sequence | NM_079202 | |
| Gene (C. elegans) | STX17 | NCBI Reference Sequence | NM_059941 | |
| Gene (R. norvegicus) | LC3B | https://doi.org/10.1083/jcb.200712064 | ||
| Gene (M. musculus) | ATG5 | NCBI Reference Sequence | NM_053069 | |
| Gene (H. sapiens) | 2×Spo20(PABD) | https://doi.org/10.1074/jbc.M116.742346 | NM_005633; amino acids 422–551 | For GFP tagged phospholipid probes |
| Gene (H. sapiens) | CERT(PHD) | https://doi.org/10.1007/s11010-005-9044-z | NM_001130105; amino acids 1–116 | For GFP tagged phospholipid probes |
| Gene (H. sapiens) | FAPP | https://doi.org/10.1091/mbc.e04-07-0578 | NM_001807; amino acids 1–101 | For GFP tagged phospholipid probes |
| Gene (H. sapiens) | OSBP | https://doi.org/10.1016/s0960-9822(98)70296-9 | NM_002556; amino acids 87–185 | For GFP tagged phospholipid probes |
| Gene (H. sapiens) | 2×ING2(PlantHD) | https://doi.org/10.1016/s0092-8674(03)00,480x | NM_001564; amino acids 190–280 | For GFP tagged phospholipid probes |
| Gene (H. sapiens) | 2×TAPP1(PHD) | https://doi.org/10.1042/bj3510019 | NM_001001974; amino acids 184–304 | For GFP tagged phospholipid probes |
| Gene (H. sapiens) | 2×TRPML1(PHD) | https://doi.org/10.1038/ncomms1037 | NM_020533; amino acids 1–69 | For GFP tagged phospholipid probes |
| Gene (H. sapiens) | Btk | https://doi.org/10.1016/s0969-2126(99)80057-4 | NM_000061; amino acids 1–177 | For GFP tagged phospholipid probes |
| Gene (H. sapiens) | PLCd1 | https://doi.org/10.1083/jcb.143.2.501 | NM_017035; amino acids 1–175 | For GFP tagged phospholipid probes |
| Gene (S. cerevisiae) | Sac1 | NCBI Reference Sequence | NM_001179777 | |
| Antibody | Mouse monoclonal anti-TOMM20 | Santa Cruz Biotechnology, Inc. | sc-11415 | 1:10,000 for WB |
| Antibody | Rabbit polyclonal anti-LAMP1 | Abcam | ab24170 | 1:10,000 for WB, 1:1000 for IF |
| Antibody | Rabbit polyclonal anti-p62 | MBL | PM045 | 1:10,000 for WB |
| Antibody | Rabbit polyclonal anti-LC3 | https://doi.org/10.1093/emboj/19.21.5720 | 1:10,000 for WB | |
| Antibody | HRP-conjugated anti-mouse IgG | Jackson ImmunoResearch Laboratories | 111-035-003 | 1:10,000 for WB |
| Antibody | HRP-conjugated anti-Rabbit IgG | Jackson ImmunoResearch Laboratories | 111-035-144 | 1:10,000 for WB |
| Antibody | Alexa Fluor 660-anti-rabbit IgG | Molecular Probes | A-21074 | 1:1000 for IF |
| Cell line (H. sapiens) | HeLa | RIKEN | RCB0007 | |
| Cell line (H. sapiens) | HEK293T | RIKEN | RCB2202 | |
| Cell line (M. musculus) | MEF | https://doi.org/10.1016/j.cell.2012.11.001 | Established from C57BL/6 mice | |
| Cell line (H. sapiens) | STX17 KO HeLa | https://doi.org/10.1083/jcb.201712058 | ||
| Cell line (H. sapiens) | ATG8 hexa KO HeLa | https://doi.org/10.1083/jcb.201607039 | Kindly provided by Michael Lazarou | |
| Chemical compound, drug | Lipofectamine 2000 | Thermo Fisher Scientific | 11668019 | |
| Chemical compound, drug | FuGENE HD | Promega | VPE2311 | |
| Chemical compound, drug | Lysotracker Red DND99 | Thermo Fisher Scientific | L7528 | 50 nM |
| Chemical compound, drug | LysoTracker Deep Red | Thermo Fisher Scientific | L12492 | 50 nM |
| Chemical compound, drug | SaraFluor 650T HaloTag ligand | GoryoChemical | A308-02 | |
| Chemical compound, drug | Cellfectin II | Thermo Fisher Scientific | 10362100 | |
| Chemical compound, drug | Glutathione Sepharose 4B | GE Healthcare | 17075601 | |
| Chemical compound, drug | HRV3C protease | Fujifilm Wako Pure Chemical Corp. | 206–18151 | |
| Chemical compound, drug | CBB Stain One Super | Nacalai Tesque | 11642–31 | |
| Chemical compound, drug | DOPC | Avanti Polar Lipids | 850375 C | |
| Chemical compound, drug | DOPE | Avanti Polar Lipids | 850725 C | |
| Chemical compound, drug | DOPS | Avanti Polar Lipids | 840035 P | |
| Chemical compound, drug | 18:1 PI | Avanti Polar Lipids | 850149 P | |
| Chemical compound, drug | 18:1 PI3P | Avanti Polar Lipids | 850150 P | |
| Chemical compound, drug | 18:1 PI4P | Avanti Polar Lipids | 850151 P | |
| Chemical compound, drug | DSPE-PEG(2000) Biotin | Avanti Polar Lipids | 880129 C | |
| Chemical compound, drug | 18:1 Liss Phod PE | Avanti Polar Lipids | 810150 C | |
| Chemical compound, drug | OptiPrep | Cosmo Bio | 1893 | |
| Chemical compound, drug | NeutrAvidin Protein | Thermo Fisher Scientific | 31000 | |
| Chemical compound, drug | Lipofectamine RNAiMAX | Thermo Fisher Scientific | 13778150 | |
| Chemical compound, drug | digitonin | Sigma-Aldrich | D141 | |
| Chemical compound, drug | polybrane | Sigma-Aldrich | H9268 | |
| Chemical compound, drug | puromycin | Sigma-Aldrich | P8833 | |
| Chemical compound, drug | blasticidin | Fujifilm Wako Pure Chemical Corp. | 2218713 | |
| Chemical compound, drug | geneticin | Thermo Fisher Scientific | 10131 | |
| Chemical compound, drug | zeocin | Thermo Fisher Scientific | R25005 | |
| Commercial assay or kit | mMACHINE SP6 Transcription Kit | Thermo Fisher Scientific | AM1340 | |
| Commercial assay or kit | Rabbit reticulocyte lysates | Promega | L4960 | |
| Strain (E. coli) | DH10Bac | Thermo Fisher Scientific | 10361012 | |
| Cell line (T. ni) | High Five | Thermo Fisher Scientific | BTI-TN-5B1-4; B85502 | |
| Recombinant DNA reagent | D. melanogaster cDNA | Kindly provided by Masayuki Miura | ||
| Recombinant DNA reagent | C. elegans cDNA | Kindly provided by Hiroyuki Arai | ||
| Recombinant DNA reagent (plasmid) | pFastBac Dual Expression vector | Thermo Fisher Scientific | 10712024 | |
| Recombinant DNA reagent (plasmid) | GFP–Evectin-2 | Kindly provided by Hiroyuki Arai | For GFP-tagged phospholipid probes | |
| Recombinant DNA reagent (plasmid) | GFP–PKD C1ab | Kindly provided by Tamas Balla | For GFP-tagged phospholipid probes | |
| Recombinant DNA reagent (plasmid) | mRFP–2×FYVE | Kindly provided by Harald Stenmark | For GFP-tagged phospholipid probes | |
| Recombinant DNA reagent (plasmid) | GFP–P4M-SidMx2 | Addgene | 51472 | For GFP-tagged phospholipid probes |
| Recombinant DNA reagent (plasmid) | pCG-gag-pol | Kindly provided by Teruhiko Yasui | For GFP-tagged phospholipid probes | |
| Recombinant DNA reagent (plasmid) | pCG-VSV-G | Kindly provided by Teruhiko Yasui | For GFP-tagged phospholipid probes | |
| Recombinant DNA reagent (plasmid) | pMRXIP-GFP-STX17TM(DDDDD) | This paper | SN104 | Figure 1 |
| Recombinant DNA reagent (plasmid) | pMRXIP-GFP-STX17TMΔC | This paper | SN106 | Figure 1, Figure 1—figure supplement 1 |
| Recombinant DNA reagent (plasmid) | pMRXIP-GFP-STX17TM(RRRRR) | This paper | SN118 | Figure 1, Figure 1—figure supplement 1 |
| Recombinant DNA reagent (plasmid) | pMRXIP-GFP-STX17TM(KKKKK) | This paper | SN84 | Figure 1, Figure 1—figure supplement 1 |
| Recombinant DNA reagent (plasmid) | pMRXIP-GFP-STX17TM(AAAAA) | This paper | SN85 | Figure 1, Figure 1—figure supplement 1 |
| Recombinant DNA reagent (plasmid) | pMRXIP-GFP-STX17TM(0KR) | This paper | SN178 | Figure 1, Figure 1—figure supplement 1 |
| Recombinant DNA reagent (plasmid) | pMRXIP-GFP-STX17TM(1KR) | This paper | SN177 | Figure 1, Figure 1—figure supplement 1 |
| Recombinant DNA reagent (plasmid) | pMRXIP-GFP-STX17TM(2KR) | This paper | SN168 | Figure 1, Figure 1—figure supplement 1 |
| Recombinant DNA reagent (plasmid) | pMRXIP-GFP-STX17TM(3KR) | This paper | SN159 | Figure 1, Figure 1—figure supplement 1 |
| Recombinant DNA reagent (plasmid) | pMRXIP-GFP-STX17TM | https://doi.org/10.1016/j.cell.2012.11.001 | Addgene; 45910 | Figure 1, Figure 1—figure supplement 1, Figure 3—figure supplement 2 |
| Recombinant DNA reagent (plasmid) | pMRXIB-mRuby3-LC3 | This paper | SN219 | Figure 1, Figure 1—figure supplement 1, Figure 2, Figure 2—figure supplement 1, Figure 3—figure supplement 1, Figure 3—figure supplement 2, Figure 4 |
| Recombinant DNA reagent (plasmid) | pMRXIP-GFP-Dmela STX17TM | This paper | SN162 | Figure 1—figure supplement 1 |
| Recombinant DNA reagent (plasmid) | pMRXIP-GFP-Celegans Syx17TM | This paper | SN163 | Figure 1—figure supplement 1 |
| Recombinant DNA reagent (plasmid) | pMRXIP-GFP-9K0Q | This paper | SN267 | Figure 2, Figure 2—figure supplement 1 |
| Recombinant DNA reagent (plasmid) | pMRXIP-GFP-5K4Q | This paper | SN268 | Figure 2, Figure 2—figure supplement 1 |
| Recombinant DNA reagent (plasmid) | pMRXIP-GFP-3K6Q | This paper | SN269 | Figure 2, Figure 2—figure supplement 1 |
| Recombinant DNA reagent (plasmid) | pMRXIP-GFP-1K8Q | This paper | SN270 | Figure 2, Figure 2—figure supplement 1 |
| Recombinant DNA reagent (plasmid) | pMRXIP-GFP-0K9Q | This paper | SN277 | Figure 2, Figure 2—figure supplement 1 |
| Recombinant DNA reagent (plasmid) | pMRXIB-mRuby3-STX17TM | This paper | SN236 | Figure 2, Figure 2—figure supplement 1, Figure 3, Figure 3—figure supplement 1, Figure 3—figure supplement 2, Figure 4—figure supplement 1 |
| Recombinant DNA reagent (plasmid) | pMRXIP-GFP-OSBP(PHD) | This paper | SN128 | Figure 3, Figure 3—figure supplement 1 |
| Recombinant DNA reagent (plasmid) | pMRXIP-GFP-CERT(PHD) | This paper | SN232 | Figure 3, Figure 3—figure supplements 1 and 2 |
| Recombinant DNA reagent (plasmid) | pMRXIP-P4M-SidMx2 | This paper | SN247 | Figure 3, Figure 3—figure supplement 2 |
| Recombinant DNA reagent (plasmid) | pMRXIP-GFP-FAPP(PHD) | This paper | SN231 | Figure 3, Figure 3—figure supplement 2 |
| Recombinant DNA reagent (plasmid) | pMRXIP-HaloTag7-LC3 | https://doi.org/10.7554/eLife.78923 | Addgene; 184899 | Figure 3, Figure 4—figure supplement 1 |
| Recombinant DNA reagent (plasmid) | pMRXIB-WIPI2b-mRuby3 | This paper | SN214 | Figure 3C |
| Recombinant DNA reagent (plasmid) | pMRXIP-GFP-2xFYVE | This paper | SN262 | Figure 3—figure supplement 1 |
| Recombinant DNA reagent (plasmid) | pMRXIP-GFP-ING2(PHD) | This paper | SN129 | Figure 3—figure supplement 1 |
| Recombinant DNA reagent (plasmid) | pMRXIP-GFP-TRPML1(PHD) | This paper | SN132 | Figure 3—figure supplement 1 |
| Recombinant DNA reagent (plasmid) | pMRXIP-GFP-PLCd1(PHD) | This paper | SN131 | Figure 3—figure supplement 1 |
| Recombinant DNA reagent (plasmid) | pMRXIP-GFP-Evectin-2 | This paper | SN115 | Figure 3—figure supplement 1 |
| Recombinant DNA reagent (plasmid) | pMRXIP-GFP-PKD C1ab | This paper | SN125 | Figure 3—figure supplement 1 |
| Recombinant DNA reagent (plasmid) | pMRXIP-Btk1(PHD)-GFP | This paper | SN133 | Figure 3—figure supplement 1A |
| Recombinant DNA reagent (plasmid) | pMRXIP-GFP-TAPP1(PHD) | This paper | SN130 | Figure 3—figure supplement 1A |
| Recombinant DNA reagent (plasmid) | pMRXIP-GFP-Spo20(PABD) | This paper | SN124 | Figure 3—figure supplement 1A |
| Recombinant DNA reagent (plasmid) | pMRXIP-GFP-PI4KB | This paper | SN199 | Figure 3—figure supplement 1C |
| Recombinant DNA reagent (plasmid) | pMRXIP-GFP-PI4K2A | This paper | SN190 | Figure 3—figure supplement 1C |
| Recombinant DNA reagent (plasmid) | pMRXIP-GFP-CERT(PHD)(W33A) | This paper | pmSS123 | Figure 3—figure supplement 2 |
| Recombinant DNA reagent (plasmid) | pMRXIB-mRuby3-CERT(PHD) | This paper | SN313 | Figure 3—figure supplement 2, Figure 4—figure supplement 1 |
| Recombinant DNA reagent (plasmid) | pFastBacDual-GST-PreSci-ScSac1PD (WT) | This paper | HY580 | Figure 4 |
| Recombinant DNA reagent (plasmid) | pFastBacDual-GST-PreSci-ScSac1PD (C392S) | This paper | HY581 | Figure 4 |
| Recombinant DNA reagent (plasmid) | pFastBacDual-GST-PreSci-TEV-mGFP-STX17TM | This paper | HY1370 | Figure 4 |
| Sequence-based reagent | human YKT6 siRNA antisense | https://doi.org/10.1083/jcb.201712058 | GGTGTGGTCATTGCTGACAATGAAT | |
| Sequence-based reagent | human YKT6 siRNA antisense sense | https://doi.org/10.1083/jcb.201712058 | ATTCATTGTCAGCAATGACCACACC | |
| Sequence-based reagent | human STX17 siRNA antisense | https://doi.org/10.1016/j.cell.2012.11.001 | AATTAAGTCCGCTTCTAAGGTTTCC | |
| Sequence-based reagent | human STX17 siRNA antisense sense | https://doi.org/10.1016/j.cell.2012.11.001 | GGAAACCTTAGAAGCGGACTTAATT | |
| Software, algorithm | FIJI-Image J | https://imagej.net/Fiji/Downloads | Image analysis were done using Fiji-Image J and plugins | |
| Software, algorithm | Illustrator | Adobe | Images were mounted using these softwares | |
| Software, algorithm | GraphPad prism | GraphPad Prism | Graphs and statistical tests were done using GraphPad Prism |
Additional files
Download links
A two-part list of links to download the article, or parts of the article, in various formats.
Downloads (link to download the article as PDF)
Open citations (links to open the citations from this article in various online reference manager services)
Cite this article (links to download the citations from this article in formats compatible with various reference manager tools)
Syntaxin 17 recruitment to mature autophagosomes is temporally regulated by PI4P accumulation
eLife 12:RP92189.
https://doi.org/10.7554/eLife.92189.3


