Articular cartilage corefucosylation regulates tissue resilience in osteoarthritis
- Department of Orthopaedic Surgery, Faculty of Medicine and Graduate School of Medicine, Hokkaido University, Japan
- Institute for Glyco‑core Research (iGCORE), Nagoya University, Japan
- Center for Sports Medicine, Hokkaido University Hospital, Japan
Figures
Figure 1 with 1 supplement
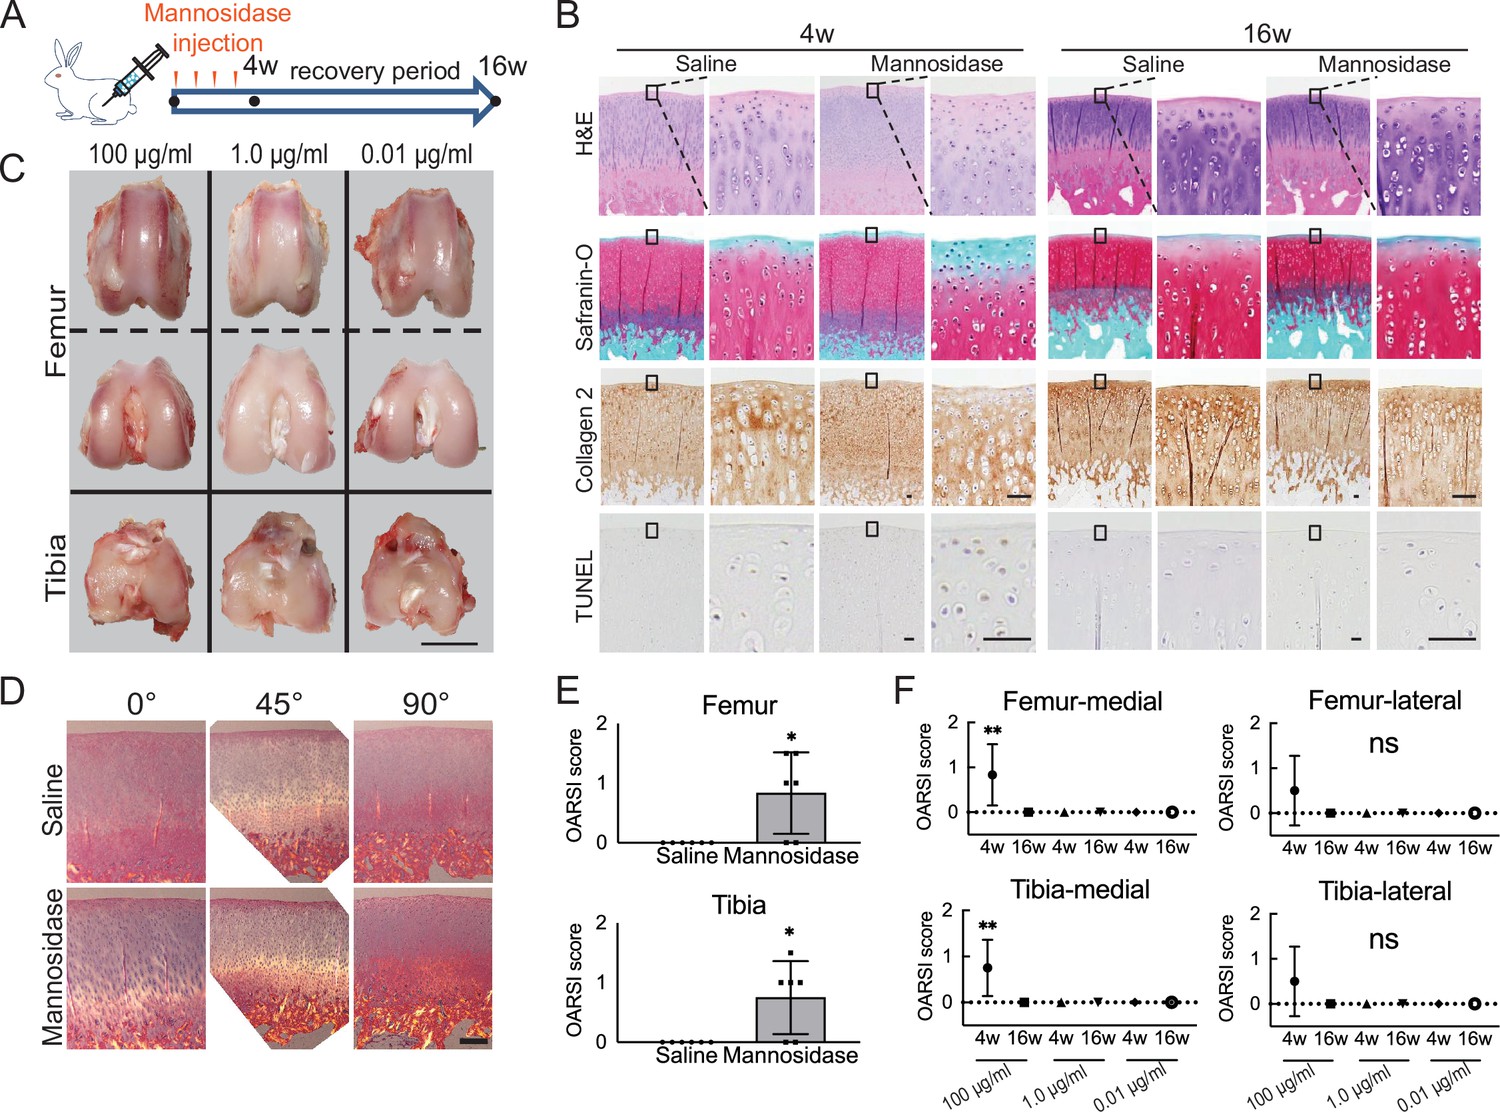
Effects of α-mannosidase injection in the knee joint in vivo.
(A) Time course of intra-articular α-mannosidase injection and unloading. Red arrows indicate the one-shot, intra-articular injection that was performed once a week. (B) Histological evaluation of knee articular cartilage 4 weeks after intermittent α-mannosidase infusion and 16 weeks after load removal. Scale bars, 50 μm. (C) Representative macroscopic assessment of the articular cartilage using mannosidase concentration. Scale bar, 1 cm. (D) Evaluation of the collagen orientation of reparative tissues at 4 weeks postoperatively. Sections stained with HE was viewed under a polarized light microscope at multiple angles (0°, 45°, and 90°). Scale bar, 200 μm. (E) OARSI scores at 4 weeks postoperatively on sections from the knee joint (n=6). (F) Tissue degeneration scores at each time point are based on mannosidase concentration. Data are shown as mean ± standard deviation. *p<0.05, **p<0.01 versus the saline group in (E), and versus 4 weeks in (F). In (E), the Welch t-test was used for statistical analysis. In (F), n=6 rabbits per group. One-way analysis of variance with Tukey’s multiple comparison test was used to perform statistical analysis. HE, hematoxylin and eosin; OARSI, Osteoarthritis Research Society International; TUNEL, terminal deoxynucleotidyl transferase dUTP nick end labeling.
Figure 1—figure supplement 1

Enzymatic activity under physiologic pH conditions in joint injection and cartilage culture systems.
The activity of mannosidase under saline (A) and DMEM (B) conditions at 37 °C (n=4). Data are shown as mean ± standard deviation. **p<0.01. the Welch t-test was used for statistical analysis.
Figure 2 with 2 supplements
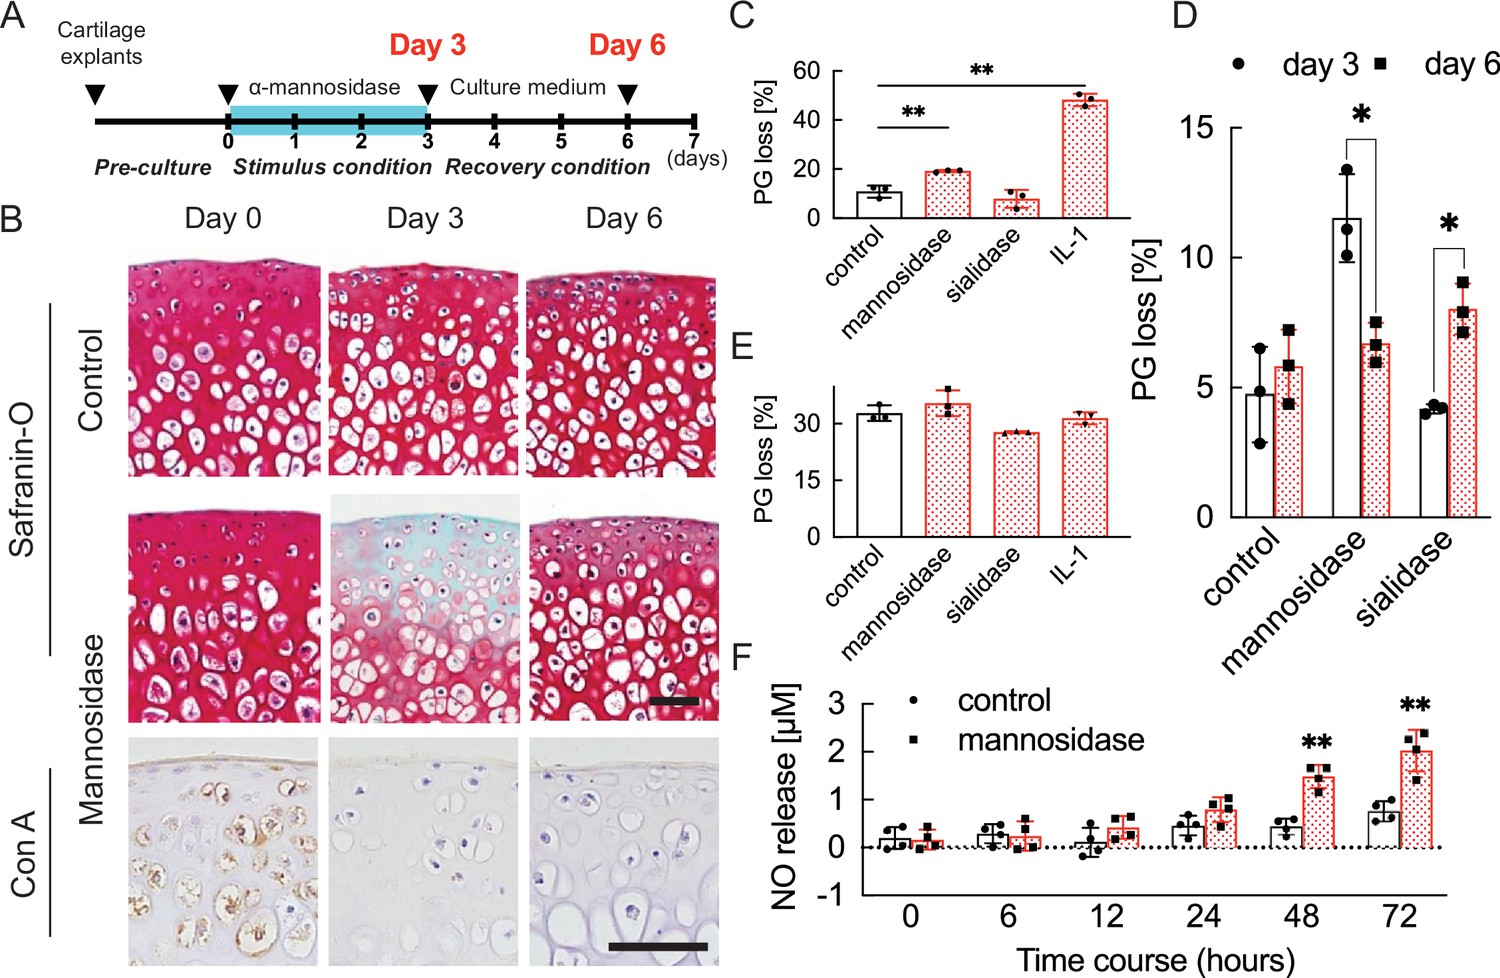
Cartilage degradation induced by mannosidase stimulation.
(A) Schematic diagram of the procedures used to establish the early OA model before irreversible and progressive destruction of articular cartilage. (B) Mannosidase-treated cartilage stained with Safranin O and Con A. The distribution of high-mannose type N-glycans is decreased in mannosidase-induced degraded mouse cartilage. Scale bars, 50 μm. (C), (D) PG release after exposure to mannosidase (C) and recovery after its removal from cultured cartilage grafts (D). (E) To investigate the non-chondrocyte-mediated release of fragments, PG loss was measured in cartilage explants that had undergone freeze-thaw cycles. (F) Sequential NO released into media measured as concentrations of nitrite for cartilage explants stimulated with mannosidase. Data are shown as mean ± standard deviation (s.d.). *p<0.05, **p<0.01 versus the control group in (C), (E), and (F), and versus day 3 in (D). In (C) and (E), n=3 samples (six mice) per group. One-way ANOVA with the Tukey multiple comparison test was used to perform statistical analysis. In (D), n=12 mice in each group and n=3 samples (six mice) at each time point. In (F), n=16 mice at each time point and n=4 samples (eight mice) per group. In (D) and (F), two-way ANOVA with the Sidak multiple-comparisons test was used to perform statistical analysis. Con A, concanavalin A; NO, nitric oxide; ANOVA, analysis of variance; PG, proteoglycan.
Figure 2—figure supplement 1
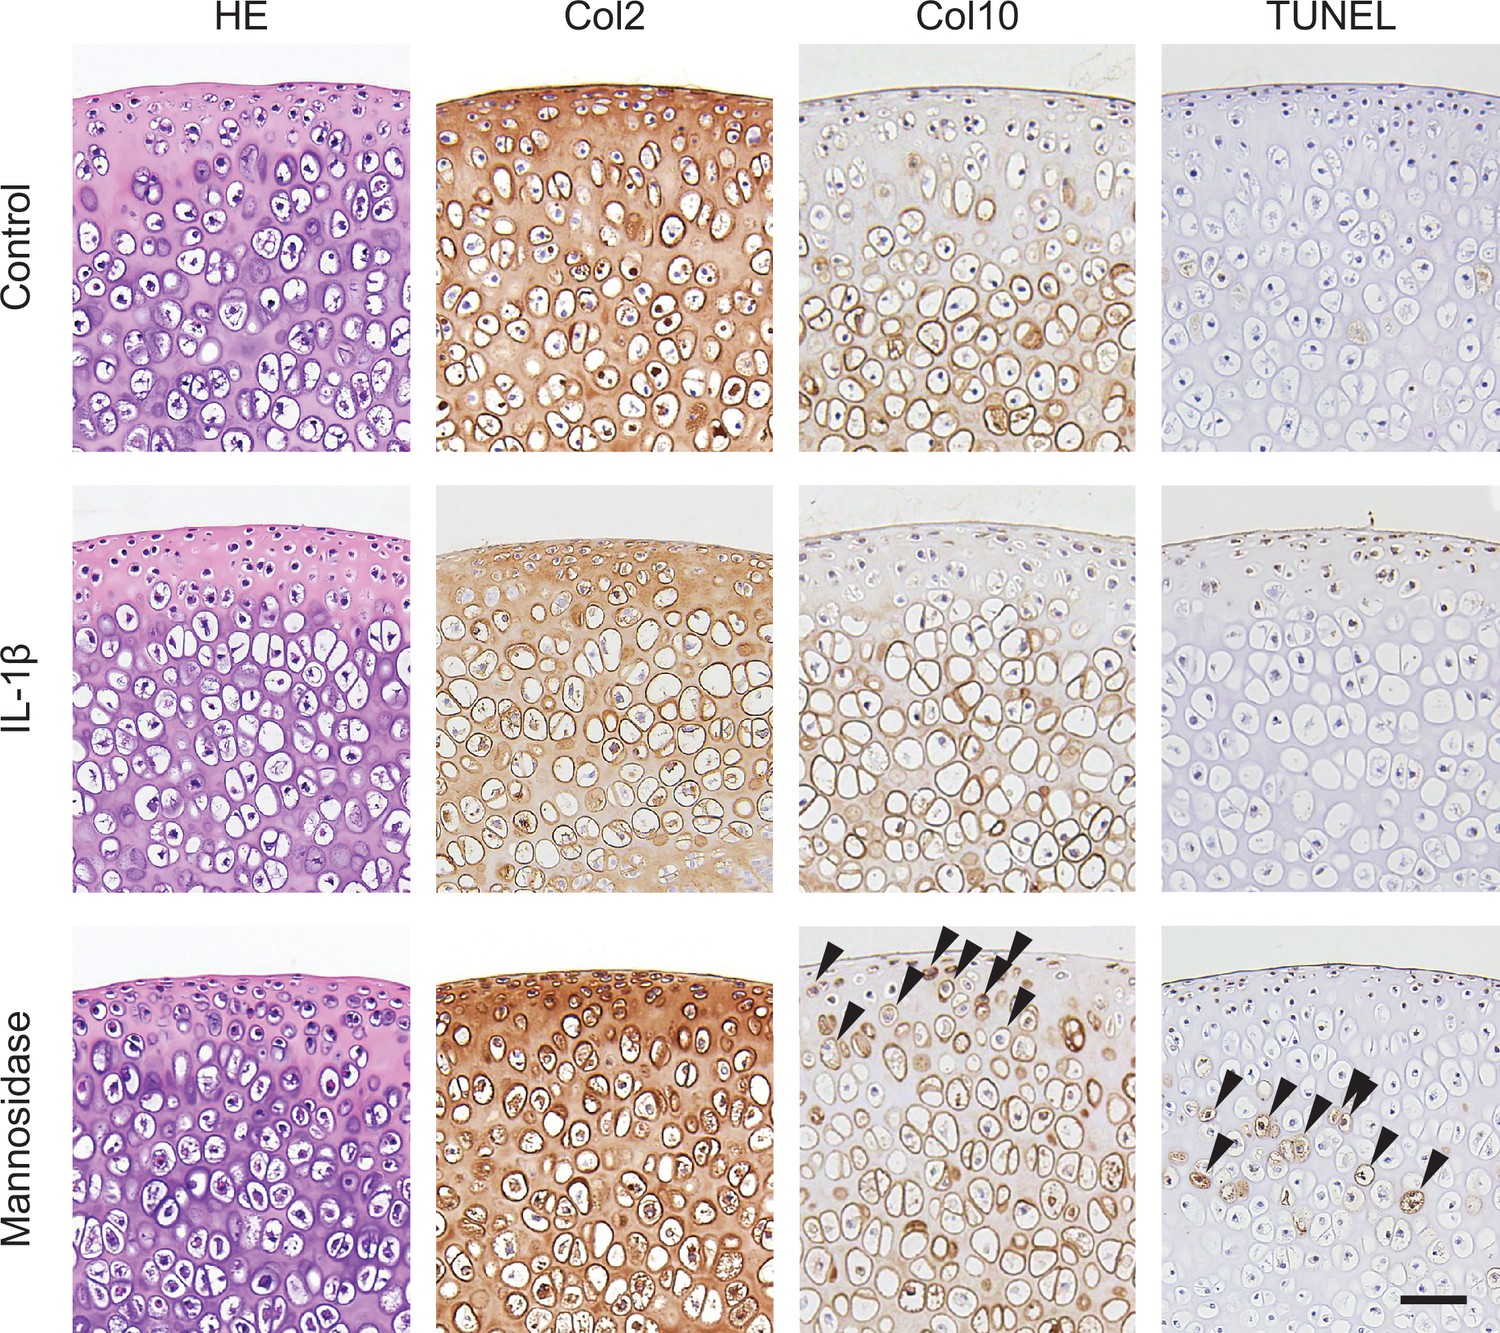
Histological effects of mannosidase on cartilage culture systems.
Mannosidase-treated cartilage was stained with HE, and immunohistochemical staining for Col2, Col10, and TUNEL. Overall, Col2 staining decreased in the IL-1β-treated cartilage. The superficial layer of cartilage affected by mannosidase contained Col10-positive cells, whereas the intermediate layer contained TUNEL-positive cells (black arrow). Scale bars, 50 μm. HE, hematoxylin and eosin; Col2, type II collagen; Col10, type X collagen; TUNEL, Terminal deoxynucleotidyl transferase dUTP nick end labeling; IL, interleukin.
Figure 2—figure supplement 2

Impact of other glycoside hydrolases on NO production from cartilage.
NO release in articular cartilage explants. Explants were cultured under normal culture conditions (control) and under the effect of mannosidase (1.9 U/mL) and sialidase (1.9 U/mL). NO release was photometrically measured using Griess reagent in the culture supernatant. **p<0.01 versus the control group. n=4 samples (8 mice per group). One-way ANOVA with the Dunnett multiple-comparison test was used to perform statistical analysis. NO, nitric oxide; ANOVA, analysis of variance.
Figure 3 with 1 supplement
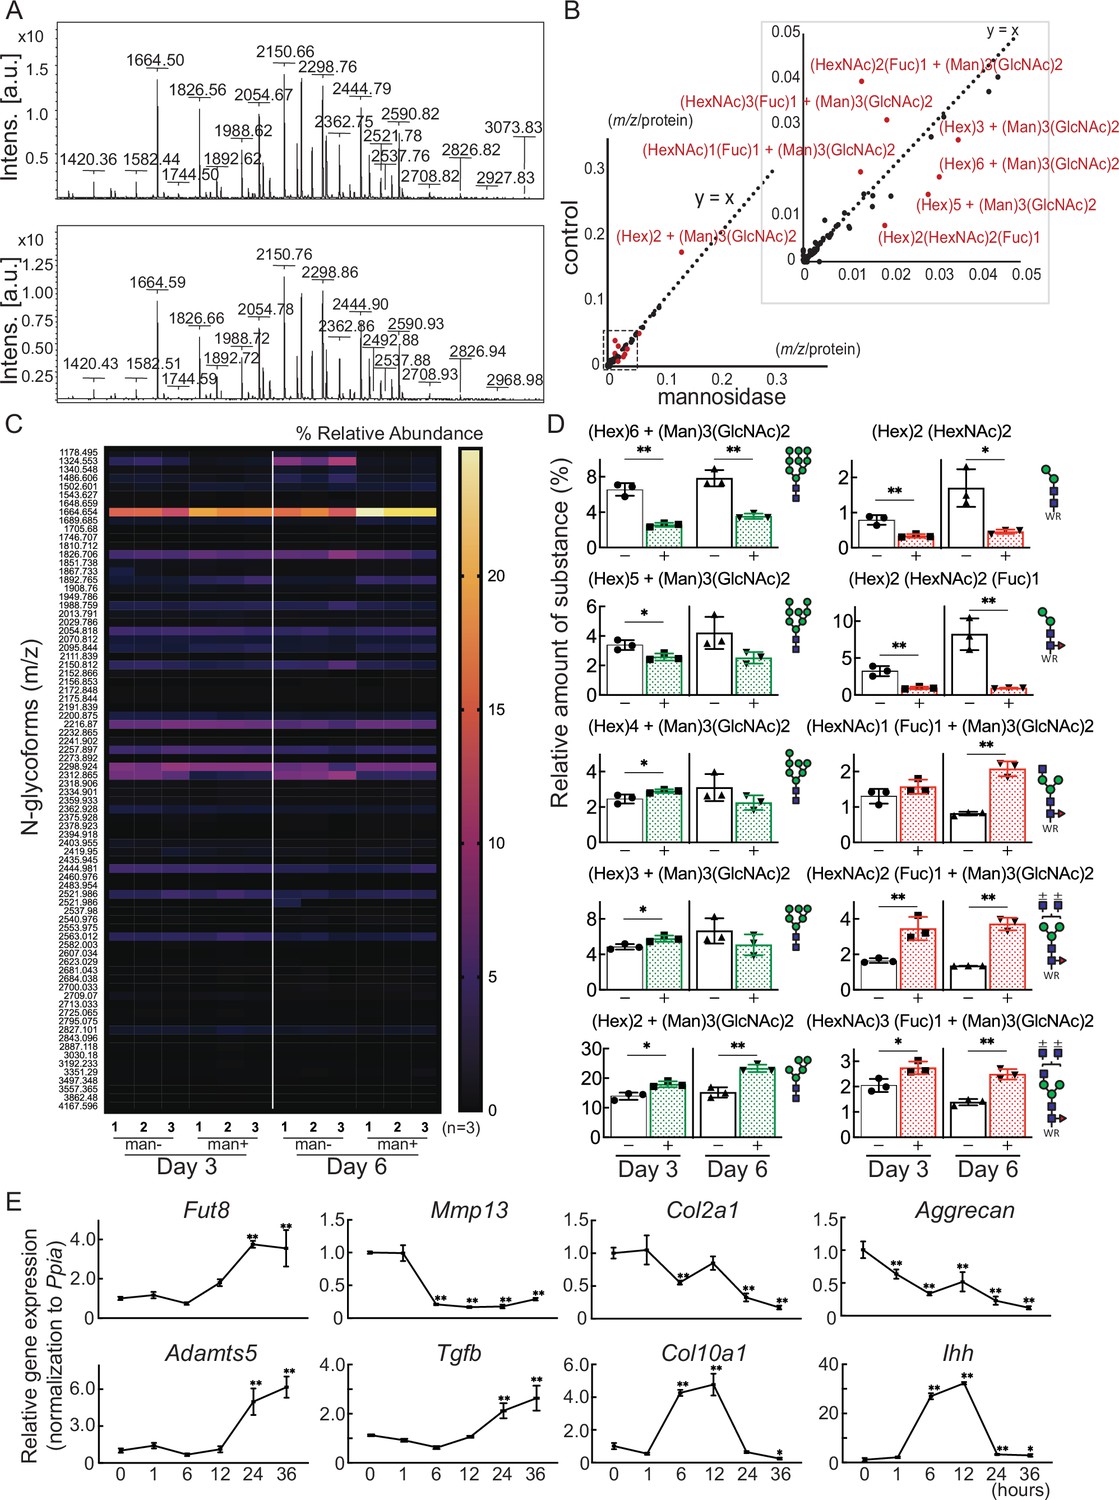
Cartilage N-glycomes.
(A) MALDI-TOF MS spectra showing the quantitative N-glycan profiles of cartilage before (upper) and after (lower) mannosidase treatment. (B) Scatter plot of the changes in m/z per protein abundance in the mannosidase (x-axis) and control (y-axis) N-glycan structures. The red dots indicate the top 10 N-glycan structures based on the deviation from the y=x line. (C) Heatmap of N-glycome showing differential N-glycan expression in the mannosidase (man+) group versus the control (man-) group. (D) N-glycans altered by mannosidase were corefucosylated glycans and high-mannose type N-glycans. (E) RT-PCR expression analysis of marker genes in organ culture of cartilage with mannosidase. Data are shown as mean ± standard deviation. *p<0.05, **p<0.01 versus the control group in (D), and versus 0 hours in (E). In (D) and (E), n=3 samples (six mice) per group. In (D), unpaired t-tests were used to perform statistical analyses. In (E), one-way ANOVA with the Dunnett multiple comparison test was used to perform statistical analysis. MALDI-TOF MS, matrix-assisted laser desorption/ionization-time of flight mass spectrometry; ANOVA, analysis of variance; RT-PCR, real-time polymerase chain reaction.
Figure 3—figure supplement 1
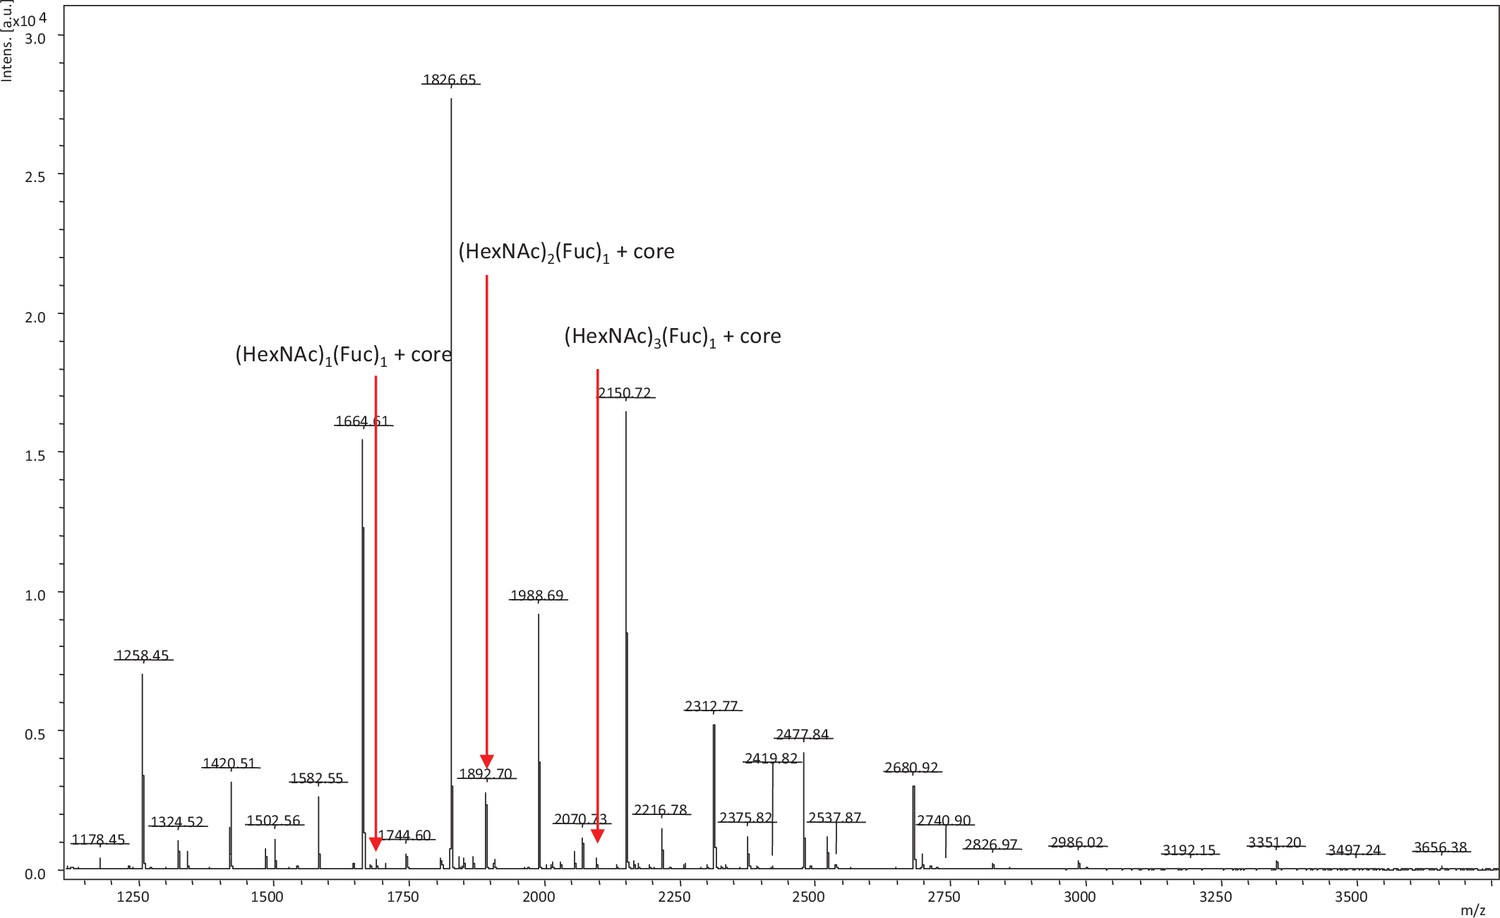
Glycoform present in the N-glycans of chondrocytes: core fucose.
N-glycan profiling of chondrocytes isolated from mouse knee cartilage. The released N-glycans using PNGase F are captured and labeled with aoWR using BlotGlyco beads (Sumitomo Bakelite). MALDI-TOF MS analyses of aoWR-labeled glycans were performed using an Autoflex Speed (Bruker Daltonics) operated in positive-ion reflector mode. MALDI-TOF MS, matrix-assisted laser desorption/ionization-time of flight mass spectrometry; aoWR, aminooxy-functionalized tryptophanyl arginine methyl ester.
Figure 4 with 1 supplement
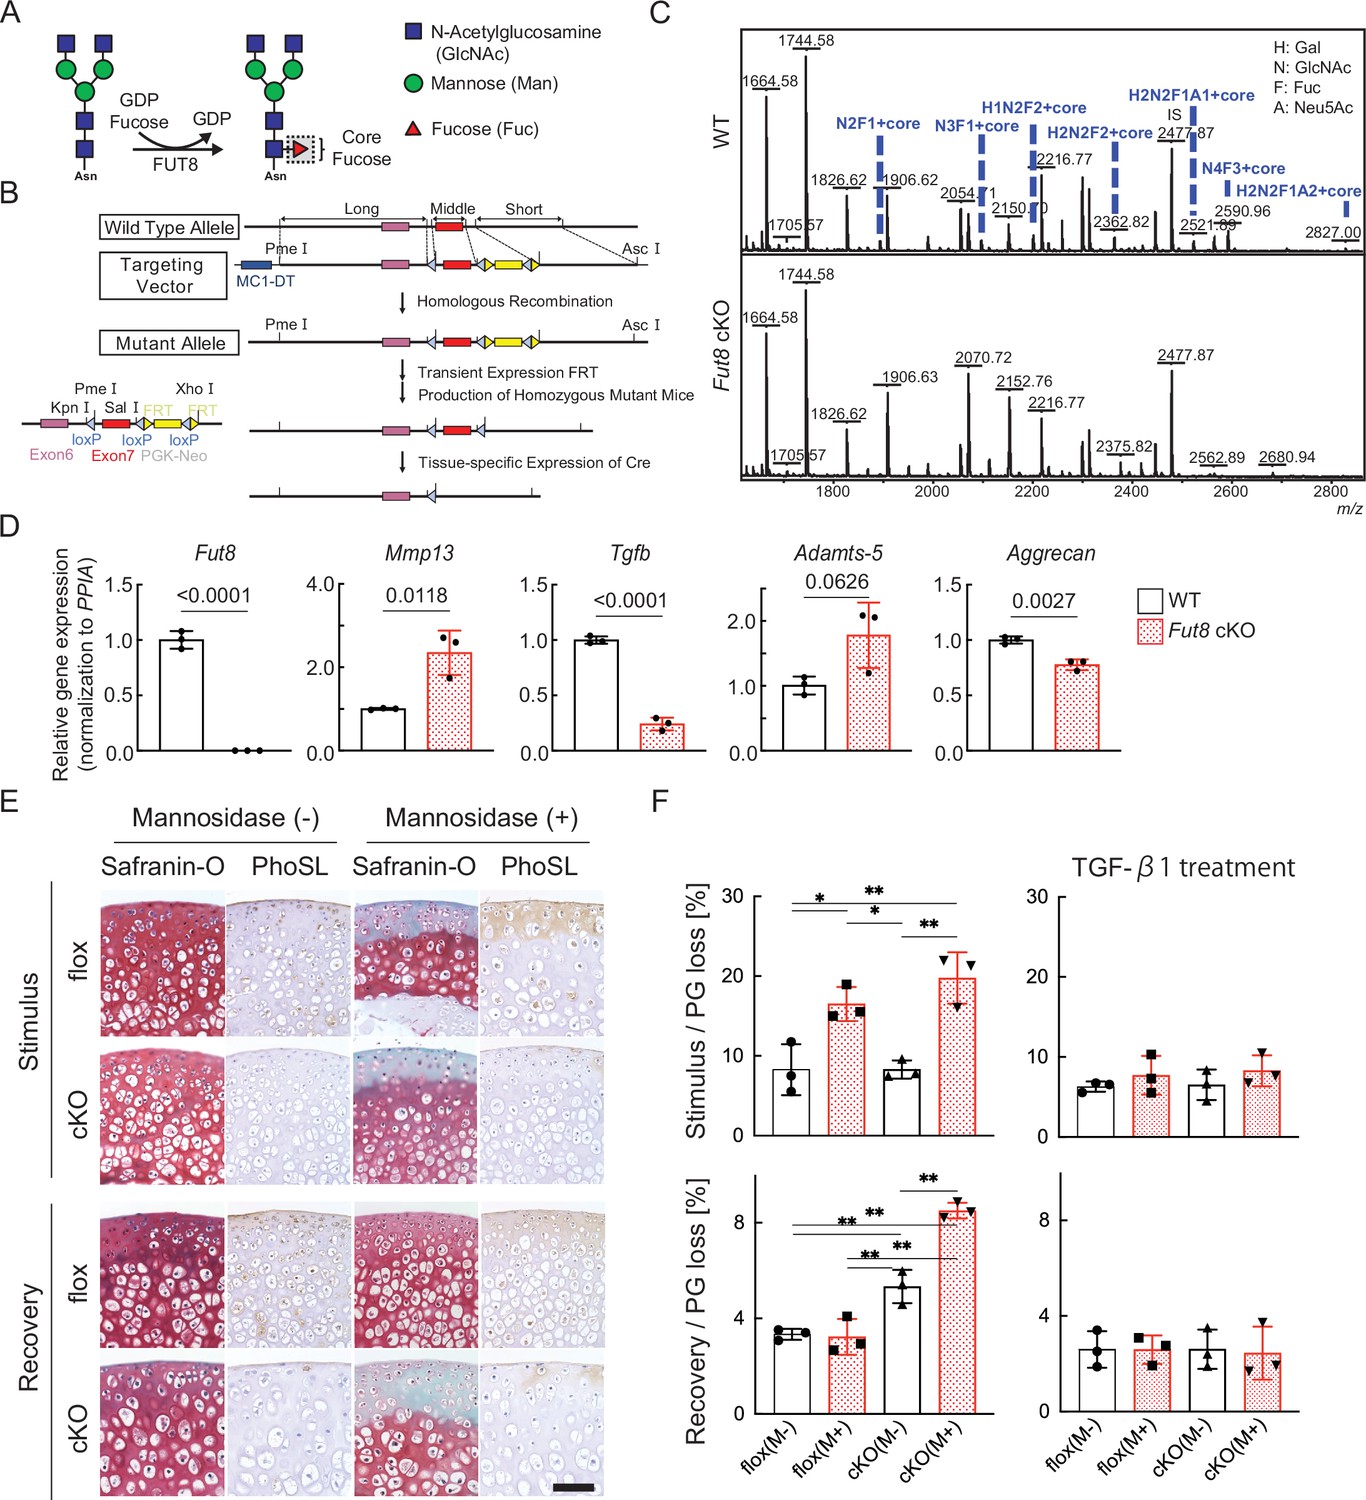
Loss of resilience due to FUT8 deficiency in cartilage.
(A) Biological reaction of FUT8. FUT8 transfers fucose to the innermost GlcNAc residue of complex N-glycans via α1,6-linkage (corefucosylation). (B) Targeted disruption of Fut8 locus. The Fut8 gene (WT allele; top), targeting vector (middle), and disrupted Fut8 locus (mutant allele; bottom). Schematic representation of the Fut8-targeting strategy and Cre-mediated recombination of the Fut8loxP allele. (C) MALDI-TOF MS mass spectra of N-glycans from WT and Fut8 cKO mice. The corefucosylation levels in cartilage were decreased and undetectable in Fut8 cKO mice. (D) Gene profile in chondrocytes isolated from Fut8 cKO mice. The expression levels of these genes in WT cells were set to 1. PPIA, peptidylprolyl isomerase A. (E) Histological findings in cartilage explants from Fut8 cKO mice and their floxed littermates cultured with mannosidase and subjected to Safranin O staining and PhoSL lectin staining. Scale bar, 50 μm. (F) PG release in cultured cartilage explants from Fut8 cKO mice and their floxed littermates. M-, Mannosidase (-); M+, Mannosidase (+). Data are shown as mean ± standard deviation. In (F), n=3 samples (six mice) per group. *p<0.05, **p<0.01. One-way ANOVA, with the Tukey multiple comparison test, was used to perform statistical analysis. MALDI-TOF MS, matrix-assisted laser desorption/ionization-time of flight mass spectrometry; WT, wild-type; cKO, conditional knockout; PG, proteoglycan; ANOVA, analysis of variance.
Figure 4—figure supplement 1
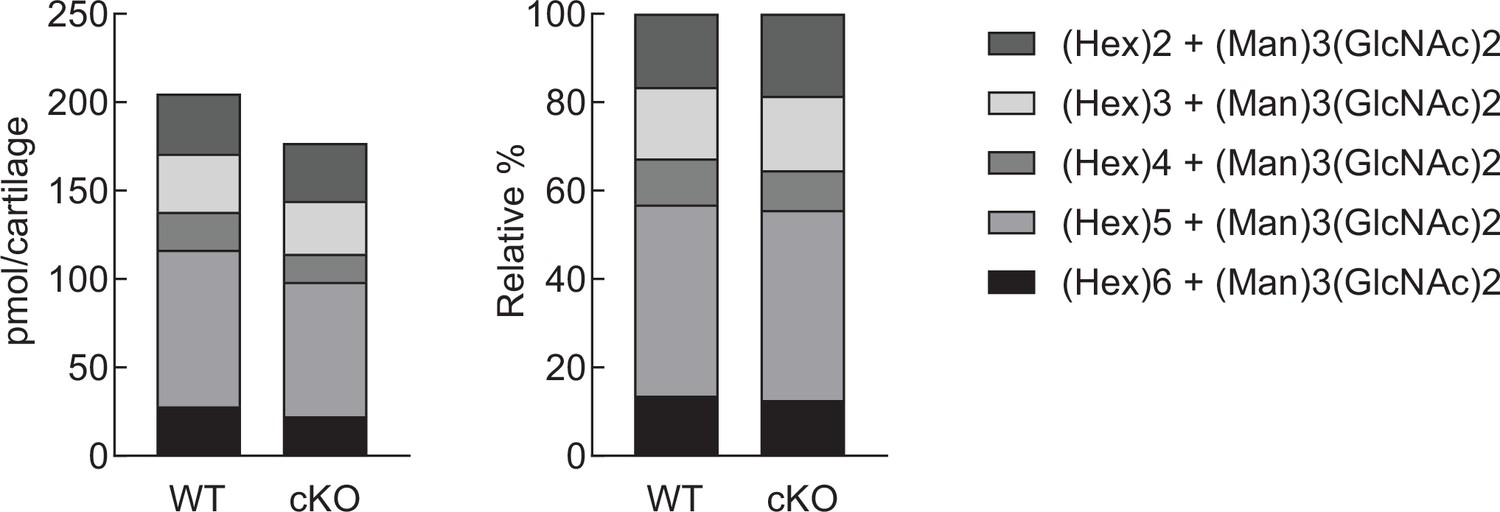
The proportion of high-mannose type N-glycans in the cartilage of Fut8 cKO mice.
Quantified high-mannose type N-glycans (pmol/cartilage) are stratified into HM5 [(Hex)2 + (Man)3(GlcNAc)2], HM6 [(Hex)3 + (Man)3(GlcNAc)2], HM7 [(Hex)4 + (Man)3(GlcNAc)2], HM8 [(Hex)5 + (Man)3(GlcNAc)2], and HM9 [(Hex)6 + (Man)3(GlcNAc)2], according to the glycan structure (left). Comparison of the relative abundance of high-mannose type N-glycans in WT and Fut8 cKO mouse cartilages (right). WT, wild-type; cKO, conditional knockout.
Figure 5 with 1 supplement
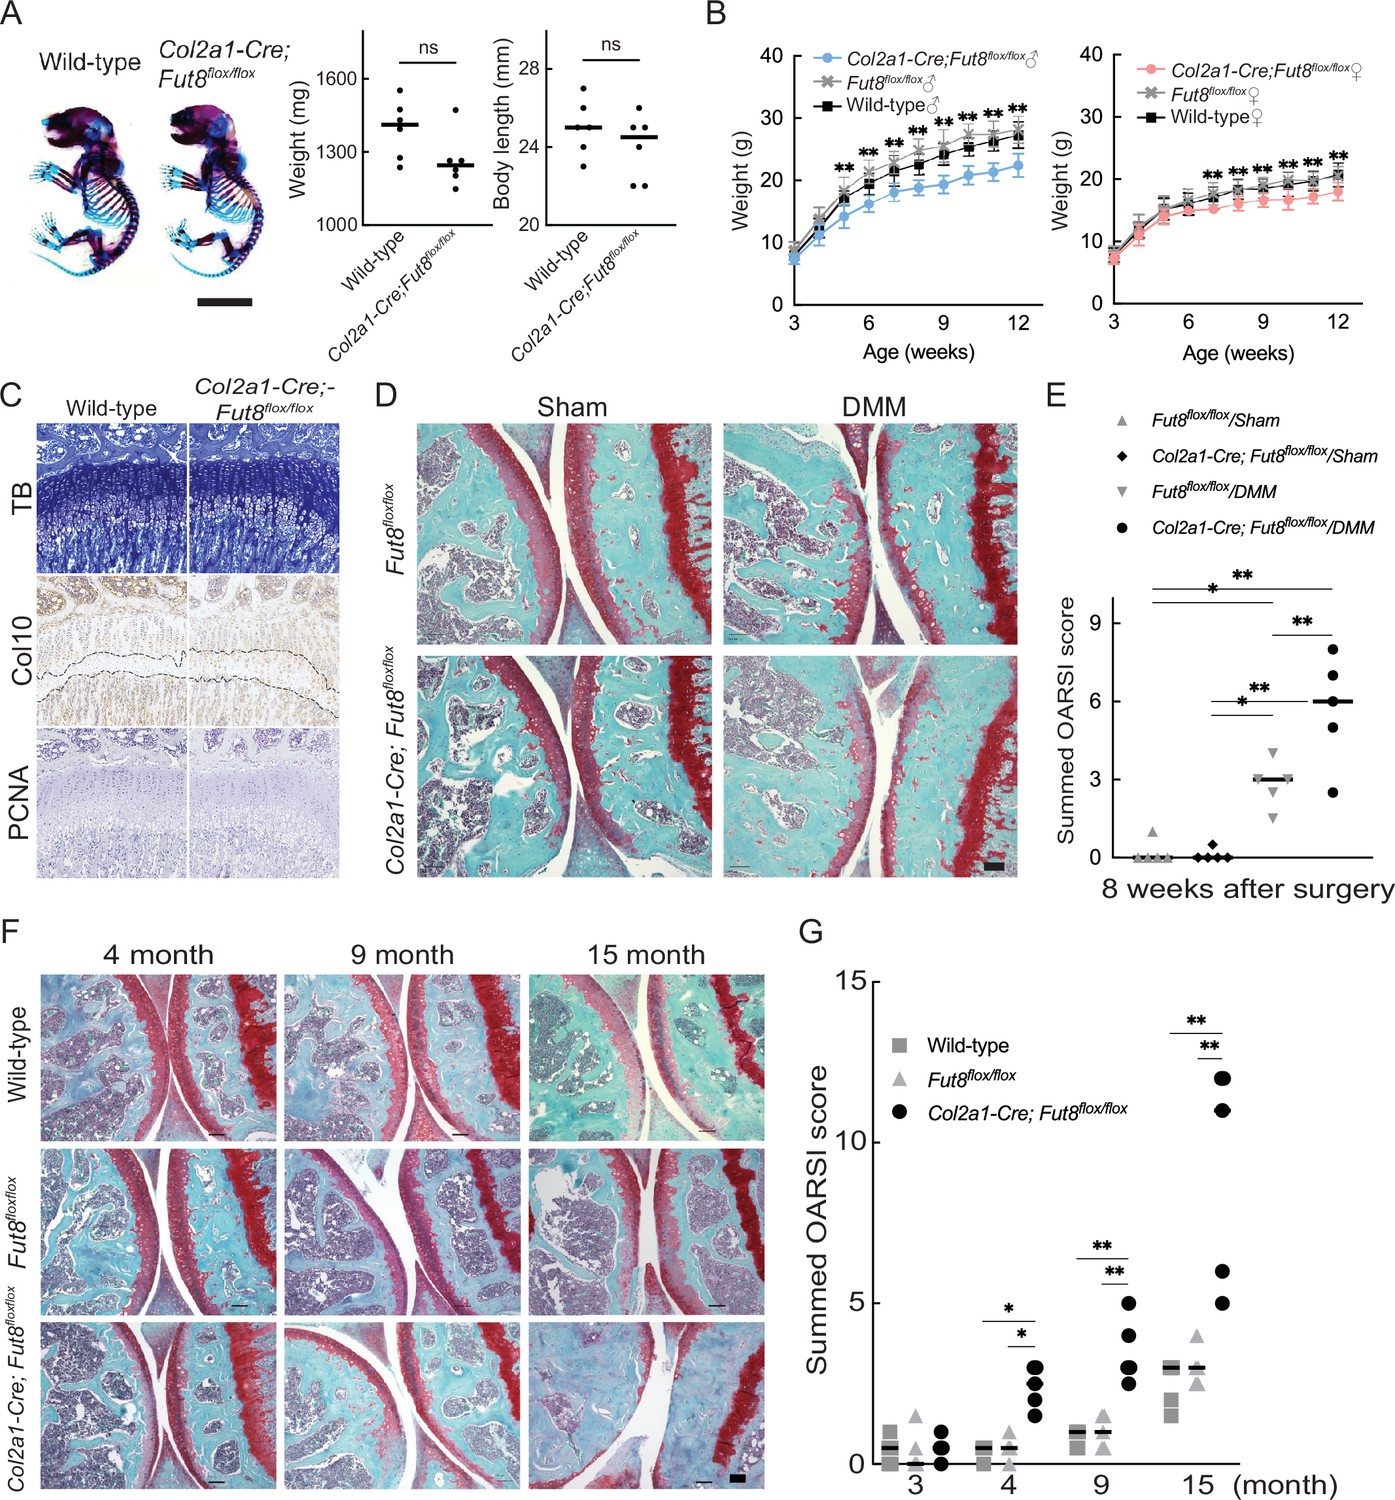
OA acceleration in Fut8 cKO mice.
(A) Double staining with alizarin red and alcian blue of the whole skeleton of wild-type and Col2a1-Cre;Fut8flox/flox cKO littermate embryos (newborn). Scale bars, 1 cm (left). Weight and body length of wild-type and cKO littermate embryos (right). (B) Growth curves were determined by body weight in male (left) and female (right) wild-type mice and their cKO littermates. (C) Histologic findings in knee joints from 4-week-old mice. Toluidine blue (TB) staining and immunostaining for type X collagen (Col10) and proliferating cell nuclear antigen (PCNA) in growth plates of the tibia were performed in each mouse genotype. The dashed line indicates the hypertrophic zone. Scale bar, 100 μm. (D), (E) Features of instability-induced OA in Fut8flox/flox (flox) mice and their cKO littermates 8 weeks after surgery. Safranin O staining is shown for each mouse genotype. Scale bar, 100 μm (D). Summed histological scores for OA severity in the knee cartilage from flox and cKO mice, as determined using the OARSI scoring system, are shown (E). (F), (G) Features of age-associated osteoarthritis in wild-type mice and their flox and cKO littermates. Safranin O staining of the knee joint is shown for each mouse genotype at 3, 4, 9, and 15 months of age. Scale bar, 100 μm (F). The summed OARSI scores are shown (G). Data are shown as mean ± standard deviation. In (A), the Welch t-test was used to perform statistical analyses (n=6 mice per group). In (B), n=15 mice per group at each time point. In (E) and (G), n=5 mice per group at each time point. *p<0.05, **p<0.01 versus the wild-type group in (B) and (G), and versus flox mice in (E). One-way ANOVA with the Tukey multiple comparisons test (B), and two-way ANOVA with the Tukey multiple comparisons test (E and G) were used to perform statistical analysis. OA, osteoarthritis; cKO, conditional knockout; OARSI, Osteoarthritis Research Society International. ANOVA, analysis of variance; ns, not significant.
Figure 5—figure supplement 1

Expanded zone of hypertrophic chondrocytes in Fut8 cKO mice.
Quantification of hypertrophic zones of tibia from 4-week-old wild-type (100.1±23.4 μm, n=10) and Col2a1-Cre; Fut8flox/flox (146.1±17.9 μm, n=10) mice. The length of the hypertrophic zone at the epiphyseal line was measured at three locations (medial, central, and lateral) from stained images of type 10 collagen, and the average of these measurements was representative of the individual. Data are shown as mean ± standard deviation. ****p<0.0001. The unpaired t-test was used for statistical analysis.
Figure 6
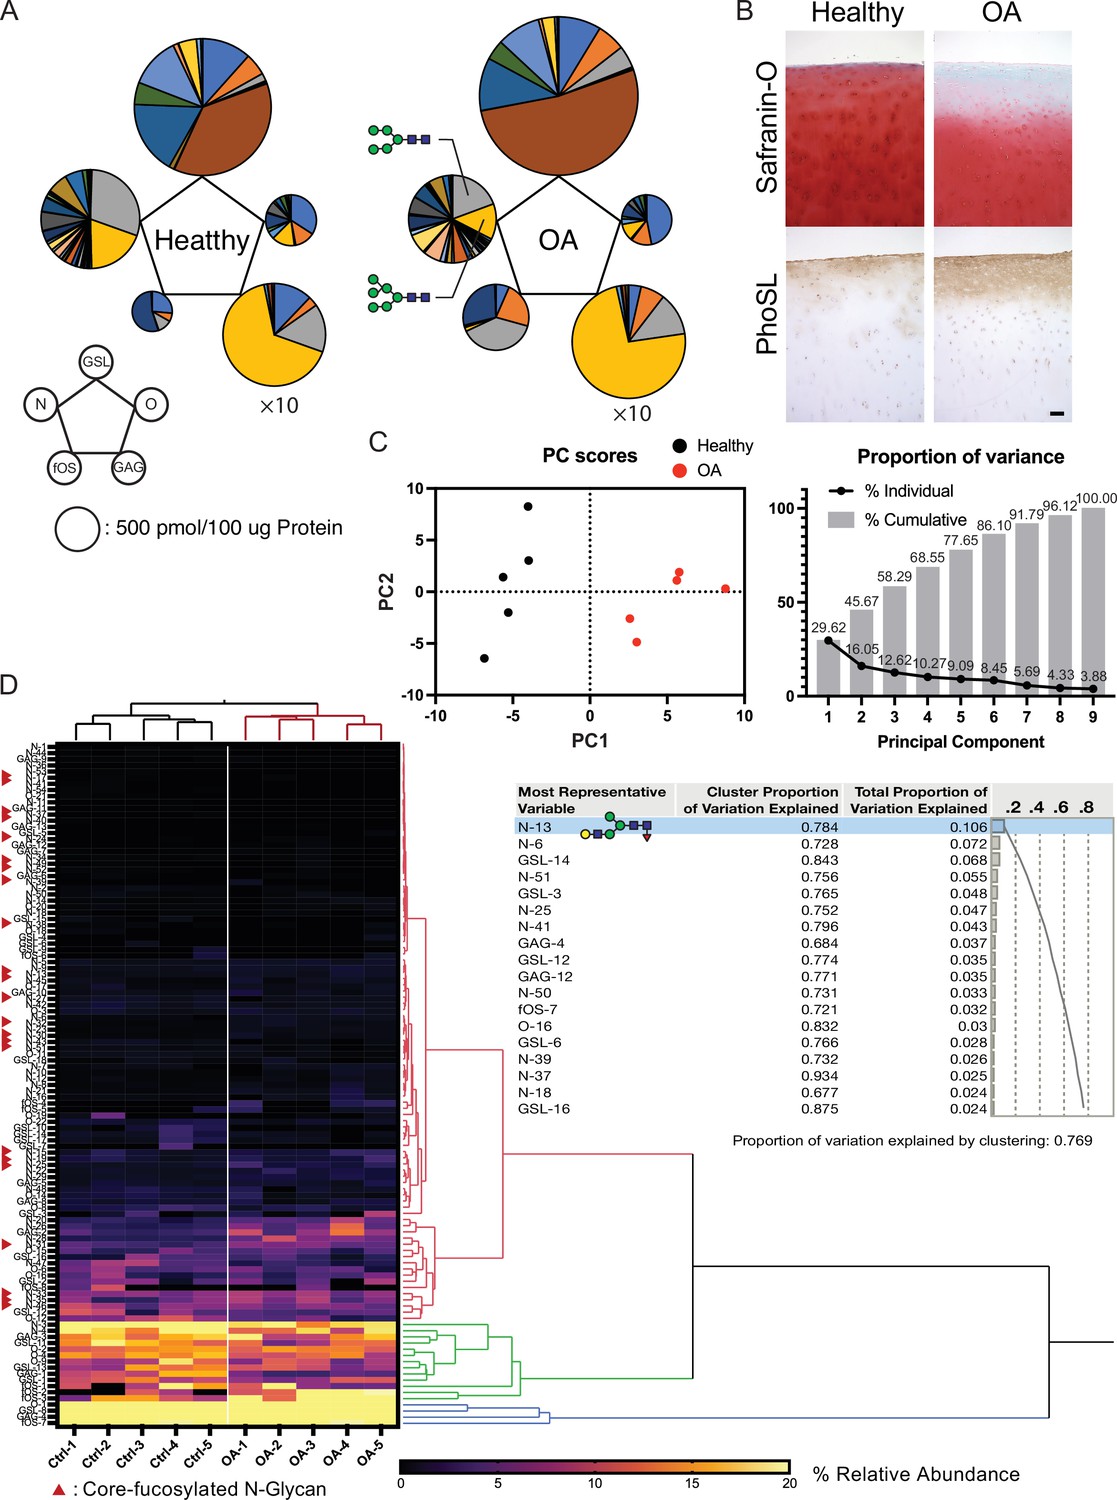
Altered glycosylation of human Osteoarthritis (OA) cartilage based on comprehensive glycan analysis.
(A) Total glycome profiling of human OA cartilage. Pie charts at the vertices of the pentagon correspond to the glycan expression profiles of N-glycans, O-glycans, GSL-glycans, free oligosaccharides (fOS), and glycosaminoglycan (GAG). The size of each circle and its constituent colors reflect the absolute quantity of glycans (pmol/100 μg protein) and the glycan substructures, respectively. The sizes of the circles representing the GAG contents are decreased by 1/10-fold. Each color indicates the estimated glycan structure and corresponds to the respective glycan number in the Figure 6—source data 1. (B) Expression of core fucose in healthy and OA cartilage. Scale bar, 100 μm. (C) Principal component analysis (PCA) of a glycan expression data set. Data points represent individual samples. The first principal component (PC1) distinguishes healthy and OA samples. (D) Hierarchical cluster analysis results showing cluster image display for total glycans with color gradient for relative glycan expression and dendrogram for each glycan structure. Cluster summary of PCA on the glycome are shown on the right. The most representative variable is (Hex)1 (HexNAc)1 (Fuc)1 + (Man)3(GlcNAc)2 which means the largest squared correlation with its cluster component.
-
Figure 6—source data 1
List of glycans quantified in healthy and osteoarthritic human cartilage.
- https://cdn.elifesciences.org/articles/92275/elife-92275-fig6-data1-v1.zip
Figure 7
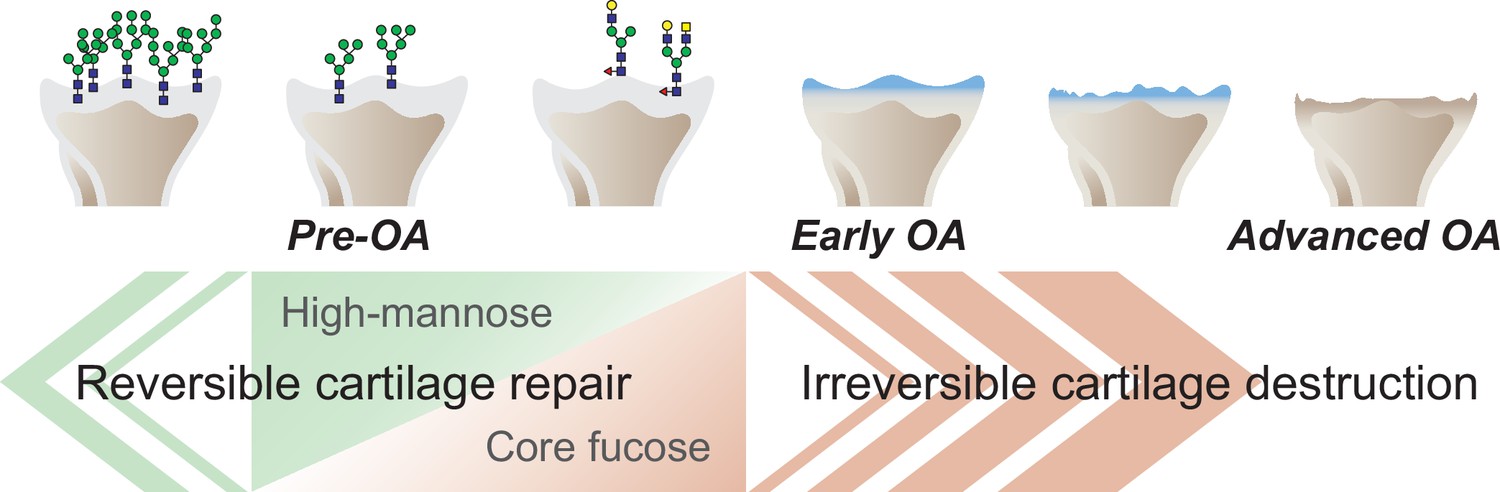
Graphical abstract.
The corefucosylation of N-glycans is associated with the reduction of high-mannose type N-glycans in articular cartilage functions to maintain the formed vitreous cartilage as cartilage. Failure of the complementary relationship leads to irreversible cartilage degeneration and destruction of cartilage integrity.
Tables
Table 1
N-glycans affected by α-mannosidase.
Nineteen of 78 glycans underwent significant changes on either day 3 or 6.
| Average | SD | |||||||||
|---|---|---|---|---|---|---|---|---|---|---|
| day 3 | day 6 | day 3 | day 6 | p-value | ||||||
| man- | man+ | man- | man+ | man- | man+ | man- | man+ | day 3 | day 6 | |
| (Hex)2 (HexNAc)2 | 0.792357 | 0.338717 | 1.698703 | 0.456702 | 0.13679 | 0.050814 | 0.535795 | 0.06191 | 0.005751 | 0.016286 |
| (Hex)2 (HexNAc)2 (Fuc)1 | 3.234707 | 0.961793 | 8.220451 | 0.924848 | 0.674962 | 0.171418 | 2.152247 | 0.065893 | 0.004824 | 0.00421 |
| (Hex)3 (HexNAc)2 (Fuc)1 | 1.490549 | 0.803672 | 2.709981 | 1.15013 | 0.296407 | 0.119276 | 0.737097 | 0.183631 | 0.020411 | 0.023657 |
| (Hex)4 (HexNAc)2 | 0.835177 | 1.59262 | 1.387137 | 1.927679 | 0.149341 | 0.226128 | 0.39749 | 0.261157 | 0.008393 | 0.120372 |
| (Hex)4 (HexNAc)2 (Fuc)1 | 0.376984 | 0.283877 | 0.54256 | 0.352081 | 0.044946 | 0.018371 | 0.106303 | 0.060982 | 0.029345 | 0.054541 |
| (Hex)2 + (Man)3(GlcNAc)2 | 13.90417 | 17.95947 | 15.15816 | 23.33117 | 1.234223 | 1.006214 | 1.724106 | 1.244995 | 0.011592 | 0.002645 |
| (HexNAc)1 (Fuc)1 + (Man)3(GlcNAc)2 | 1.301597 | 1.570904 | 0.815818 | 2.076143 | 0.207081 | 0.202172 | 0.050657 | 0.208993 | 0.182306 | 0.00053 |
| (Hex)2 (Fuc)1 + (Man)3(GlcNAc)2 | 0.322479 | 0.213651 | 0.423122 | 0.268242 | 0.046893 | 0.010074 | 0.112891 | 0.049903 | 0.017103 | 0.095448 |
| (Hex)3 + (Man)3(GlcNAc)2 | 4.861187 | 5.775936 | 6.654761 | 5.079474 | 0.305603 | 0.3547 | 1.417819 | 1.179548 | 0.027682 | 0.213128 |
| (Hex)1 (HexNAc)1 (Fuc)1 + (Man)3(GlcNAc)2 | 0.750266 | 0.722315 | 0.514881 | 0.608877 | 0.102088 | 0.016991 | 0.017088 | 0.036114 | 0.664285 | 0.015161 |
| (HexNAc)2 (Fuc)1 + (Man)3(GlcNAc)2 | 1.652909 | 3.456976 | 1.353847 | 3.715004 | 0.132951 | 0.654484 | 0.010019 | 0.352926 | 0.009456 | 0.000317 |
| (Hex)1 (HexNAc)2 + (Man)3(GlcNAc)2 | 0.876123 | 0.772922 | 0.646969 | 0.817259 | 0.129494 | 0.084843 | 0.088617 | 0.055944 | 0.312527 | 0.048099 |
| (Hex)4 + (Man)3(GlcNAc)2 | 2.450873 | 2.895117 | 3.097092 | 2.245556 | 0.253136 | 0.10024 | 0.766259 | 0.409485 | 0.04753 | 0.164815 |
| (Hex)2 (HexNAc)1 (Fuc)1 + (Man)3(GlcNAc)2 | 0.819582 | 0.867903 | 0.64262 | 0.728035 | 0.073132 | 0.069334 | 0.04725 | 0.006566 | 0.452941 | 0.036177 |
| (HexNAc)3 (Fuc)1 + (Man)3(GlcNAc)2 | 2.046827 | 2.744773 | 1.385735 | 2.486179 | 0.256854 | 0.248038 | 0.122548 | 0.205141 | 0.027643 | 0.001339 |
| (Hex)5 + (Man)3(GlcNAc)2 | 3.384827 | 2.579308 | 4.207472 | 2.518858 | 0.330947 | 0.236353 | 1.087182 | 0.392432 | 0.026518 | 0.064636 |
| (HexNAc)4 + (Man)3(GlcNAc)2 | 0.498715 | 0.340168 | 0.283597 | 0.26723 | 0.062833 | 0.027843 | 0.245731 | 0.233142 | 0.016187 | 0.937326 |
| (Hex)6 + (Man)3(GlcNAc)2 | 6.567266 | 2.574261 | 7.830155 | 3.542284 | 0.705065 | 0.227602 | 0.927784 | 0.289577 | 0.000733 | 0.001576 |
| (Hex)2 (HexNAc)1 (Fuc)1 (NeuAc)1 + (Man)3(GlcNAc)2 | 0.635073 | 0.537187 | 0.515992 | 0.507301 | 0.037168 | 0.044506 | 0.061995 | 0.051956 | 0.043073 | 0.861418 |
-
(m/z protein).
-
SD; standard deviation, man-; control, man+; cartilage stimulated by α-mannosidase.
Table 2
List of the top 10 deviations from the y=x line.
The values are expressed as relative values of the amount of substance (pmol) calculated based on internal standards to the total amount of N-glycan.
| Glycan structure | Control | Mannosidase | Dissociation |
|---|---|---|---|
| (Hex)2 + (Man)3(GlcNAc)2 | 0.13433877 | 0.17518289 | 0.04084413 |
| (HexNAc)2 (Fuc)1 + (Man)3(GlcNAc)2 | 0.01345174 | 0.03953942 | 0.02608767 |
| (Hex)5 + (Man)3(GlcNAc)2 | 0.02873745 | 0.01473236 | 0.01400509 |
| (Hex)6 + (Man)3(GlcNAc)2 | 0.03127904 | 0.01857732 | 0.01270172 |
| (HexNAc)3 (Fuc)1 + (Man)3(GlcNAc)2 | 0.01922672 | 0.03108068 | 0.01185396 |
| (Hex)2 (HexNAc)2 (Fuc)1 | 0.01876579 | 0.00792915 | 0.01083663 |
| (Hex)3 + (Man)3(GlcNAc)2 | 0.03565567 | 0.02670789 | 0.00894778 |
| (HexNAc)1 (Fuc)1 + (Man)3(GlcNAc)2 | 0.01320084 | 0.01968082 | 0.00647997 |
| (HexNAc)4 (Fuc)2 + (Man)3(GlcNAc)2 | 0.05688225 | 0.05042987 | 0.00645238 |
-
p mol relative (%).
Additional files
-
Supplementary file 1
A primer list of qRT-PCR.
- https://cdn.elifesciences.org/articles/92275/elife-92275-supp1-v1.xlsx
-
MDAR checklist
- https://cdn.elifesciences.org/articles/92275/elife-92275-mdarchecklist1-v1.docx
-
Source data 1
Raw data for all figures.
- https://cdn.elifesciences.org/articles/92275/elife-92275-data1-v1.xlsx
Download links
A two-part list of links to download the article, or parts of the article, in various formats.
Downloads (link to download the article as PDF)
Open citations (links to open the citations from this article in various online reference manager services)
Cite this article (links to download the citations from this article in formats compatible with various reference manager tools)
Articular cartilage corefucosylation regulates tissue resilience in osteoarthritis
eLife 12:RP92275.
https://doi.org/10.7554/eLife.92275.3


