The delayed kinetics of Myddosome formation explains why amyloid-beta aggregates trigger Toll-like receptor 4 less efficiently than lipopolysaccharide
- Department of Chemistry, University of Cambridge, United Kingdom
- Cambridge Dementia Research Centre, Clifford Allbutt Building, Cambridge Biomedical Campus, United Kingdom
- Department of Medicine, Addenbrooke’s Hospital, Cambridge Biomedical Campus, United Kingdom
Figures
Figure 1 with 2 supplements
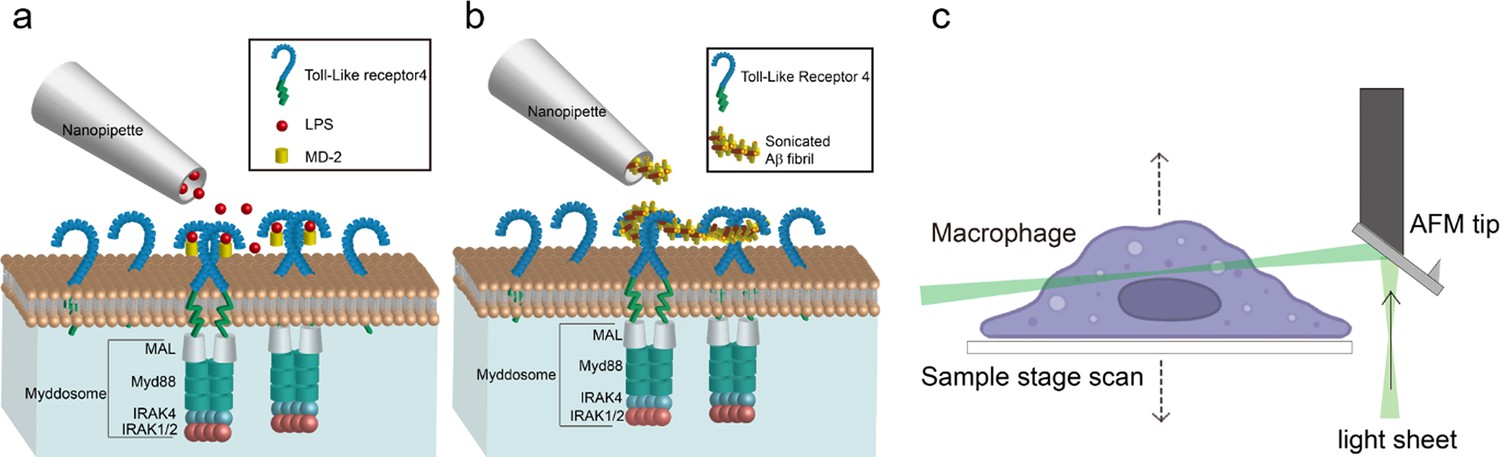
Schematic of local-delivery selective plane illuminatiion microscopy.
(a, b) Schematic of nanopipette delivered triggering of Toll-like receptor 4 (TLR4) and Myddosome formation with lipopolysaccharide (LPS) or amyloid-beta (Aβ) aggregates. The LPS is delivered by nanopipette to the macrophage surface. When LPS binds to TLR4, it will trigger the dimerisation of TLR4, which activates the recruitment of Mal, MyD88, and IRAK4&2 to form the Myddosome. Unstimulated TLR4 remains monomeric on the cell surface. (c) Schematic of Atomic Force Microscope (AFM) cantilever light sheet 3D scan. The light sheet is reflected by an AFM cantilever to the target cell. Control by a piezo, the sample stage is moving up and down to achieve cell scanning.
Figure 1—figure supplement 1

Transmission Electron Microscopy images of amyloid-β 42 following sonication of incubated fibrils.
Scale bar: 100 nm. Sonicated sample showed large population of sub-100 nm oligomers in background of image (as well as some larger fibrils).
Figure 1—figure supplement 2

Nanopipette delivery of sonicated amyloid beta fibrils.
(a) Nanopipette approaches the cell where the tip is 3 µm away from the membrane with an angle to delivery sonicated amyloid-beta (Aβ) fibrils. Scale bar is 8.5 µm. (b) Projected view of tagged sonicated Aβ fibrils (red) after delivery to the cell membrane (green). Scale bar is 5 µm.
Figure 2 with 1 supplement
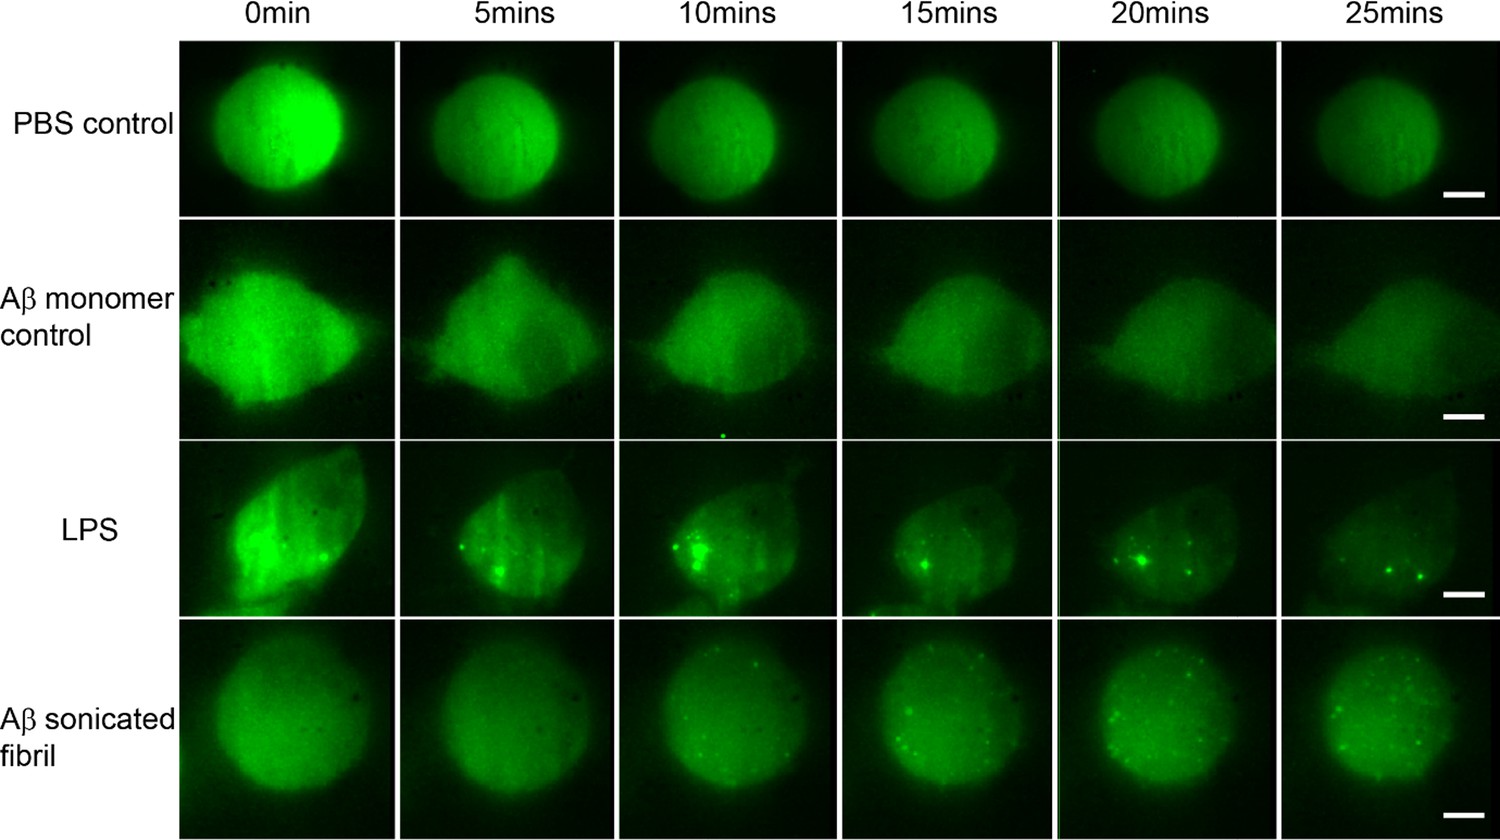
Montage showing the time series of Myddosome assembly (small bright puncta) for different stimulations.
(a) PBS (phosphate-buffered saline) control: no Myddosomes formed when PBS buffer is delivered. (b) Amyloid-beta (Aβ) monomer control also showing no Myddosomes formed. (c) Myddosome formation triggered by lipopolysaccharide (LPS). (d) Myddosome formation triggered by sonicated Aβ fibrils. The scale bar is 5 μm.
Figure 2—figure supplement 1
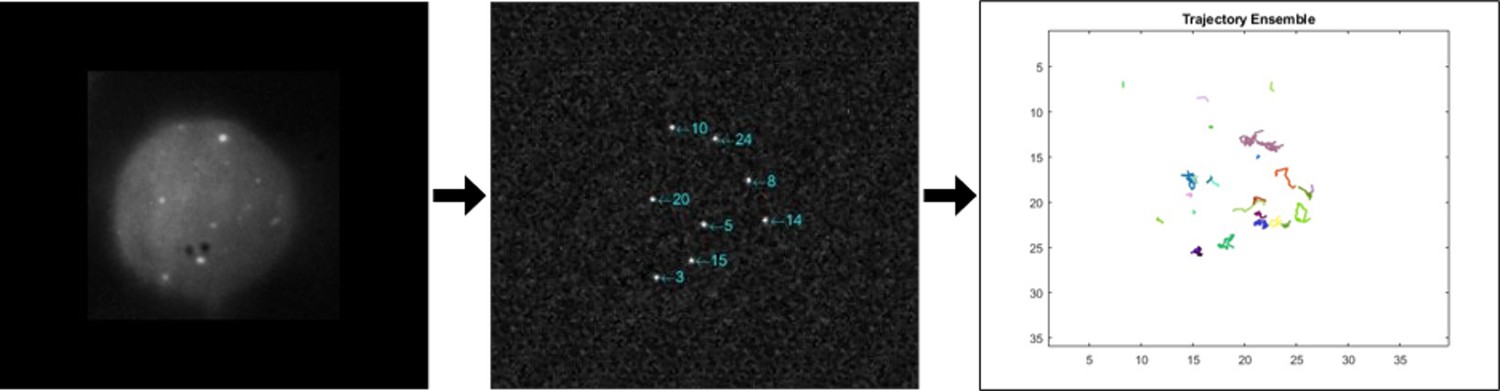
Overview of 2D tracking analysis.
From left to right: z-stacks for each time frame were projected into one frame. ImageJ’s find maxima plugin was used to identify MyD88 puncta which were subsequently tracked using a custom MATLAB code. Analysis was then carried out on identified trajectories.
Figure 3
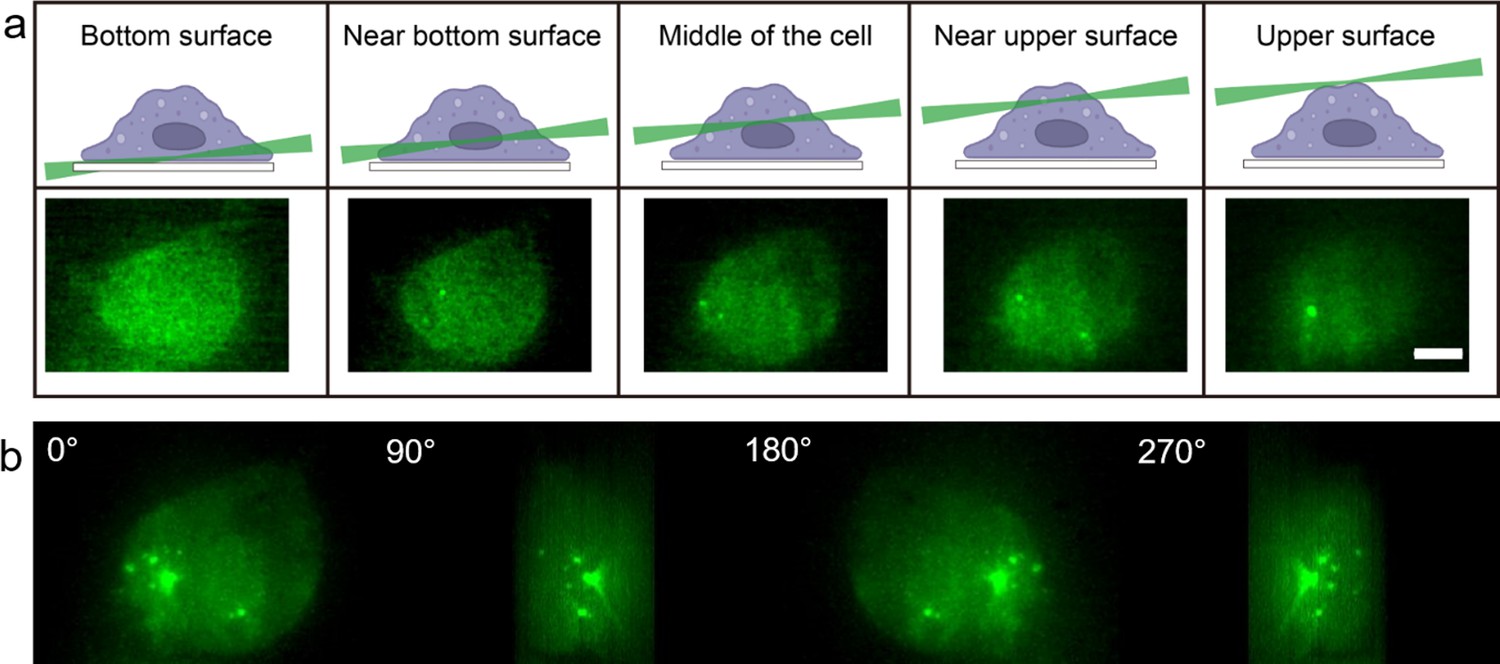
Myddosome visualisation throughout full cell volume enabled by light sheet microsope.
(a) 3D light sheet scanning of a live macrophage forming Myddosomes upon activation. The sheet scanning starts from the bottom surface of the cell and ends at the top surface. Z-stacks were acquired for each cell, consisting of 100 z-slices with 200 nm spacing. (b) Images were rendered by 3D projection (brightest point method). Myddosomes could be visualised in the whole-cell volume by rotating the 3D rendered imaged around the y-axis.
Figure 4
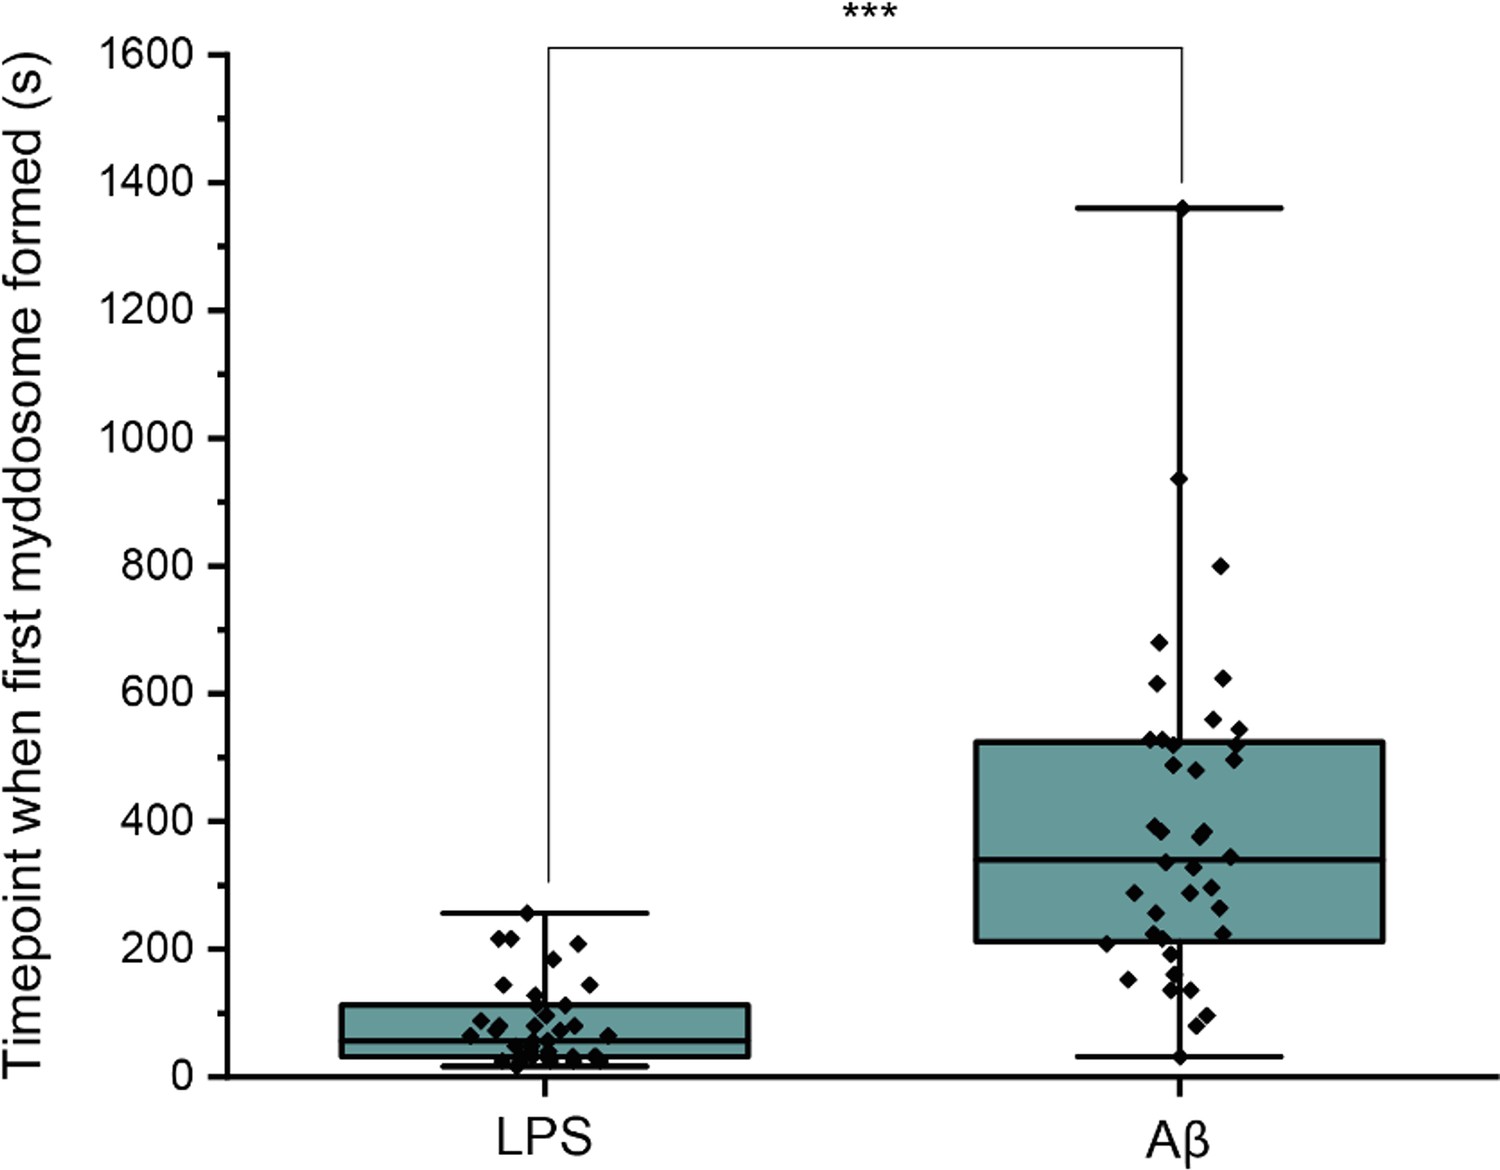
Differences in Myddosome initial formation following LPS/Aβ stimulation.
(a) MyD88-YFP transduced iBMDMs were stimulated with 1 μg/ml lipopolysaccharide (LPS) or 4 µM total monomer of sonicated amyloid-beta (Aβ) fibrils delivered from a nanopipette for 30 min.
The time point when the first Myddosome formed was marked (n = 77) across five biological replicates for each stimulation. The p-values are based on unpaired two-sided Student’s t-test.
-
Figure 4—source data 1
Timepoints following stimulation at which Myddosome formation starts.
- https://cdn.elifesciences.org/articles/92350/elife-92350-fig4-data1-v1.xlsx
Figure 5 with 1 supplement
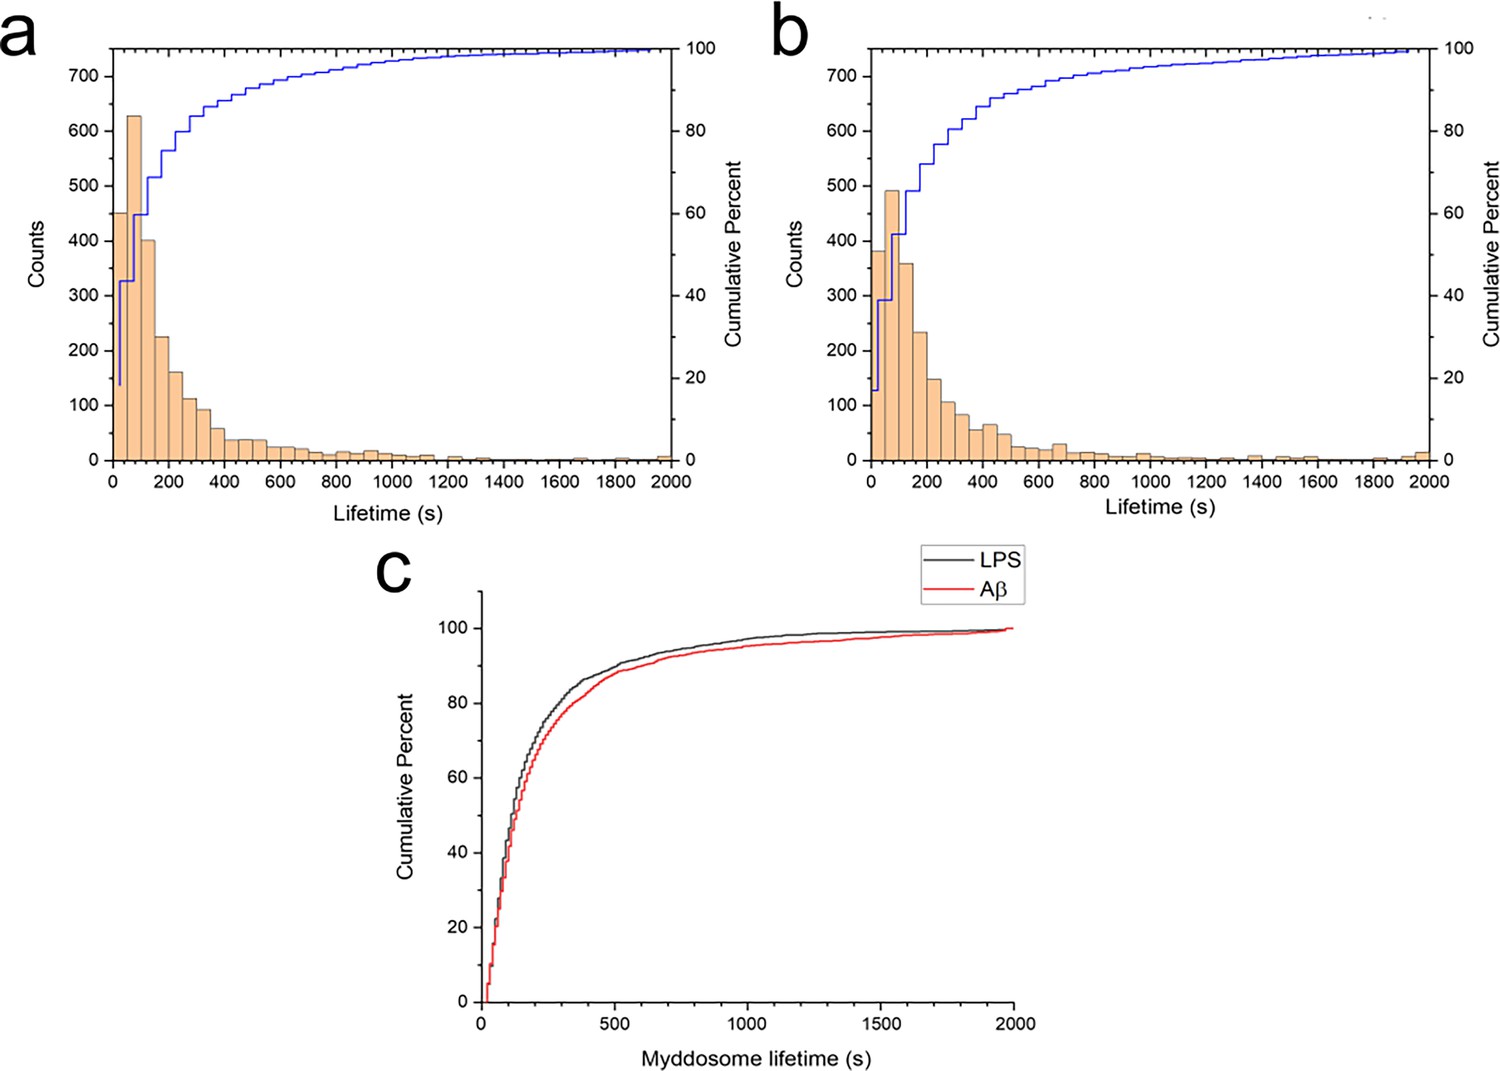
Myddosome puncta lifetimes following stimulation.
Histogram and cumulative distribution of MyD88 puncta lifetimes following nanopipette delivery of (a) lipopolysaccharide (LPS) (1 μg/ml) or (b) sonicated amyloid-beta (Aβ) fibrils (4 µM total monomer). (c) Cumulative lifetime distributions after LPS and Aβ stimulation overlaid. The difference between the two lifetime distributions was significant (Kolmogorov–Smirnov test, p < 0.0001).
-
Figure 5—source data 1
Myddosome puncta lifetimes following stimulation.
- https://cdn.elifesciences.org/articles/92350/elife-92350-fig5-data1-v1.xlsx
Figure 5—figure supplement 1
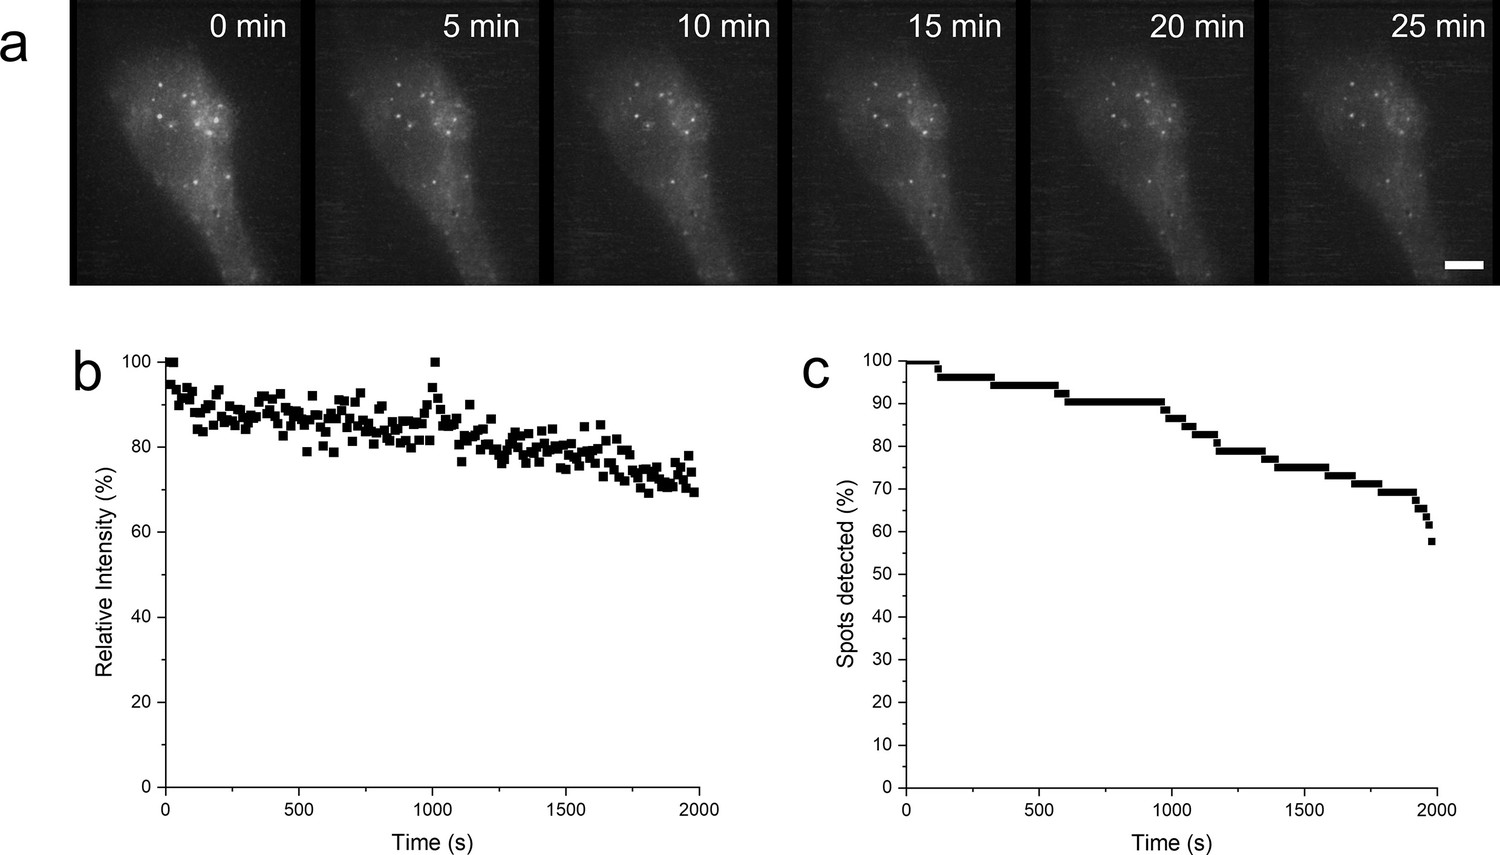
Cells were fixed following lipopolysaccharide (LPS) triggering, and then imaging using the same parameters and microscope as previously described (Materials and methods: Live cell scanning and 3D reconstruction).
(a) Time lapse of fixed cell following LPS stimulation. (b) Representative intensity trace of one puncta out of 14 in one cell with less than 40% of the puncta intensity lost over 30 min. (c) Loss in spot detection due to photobleaching in fixed cells. Within the first 500 s, there is a 6% loss of detected puncta; in comparison to the live cell stimulation (Figure 5), there was an approximate 90% drop in the detected puncta for newly assembled puncta within the same time period, suggesting that signal loss during live cell imaging was mostly due to MyD88 puncta degradation rather than photobleaching.
Figure 6 with 1 supplement
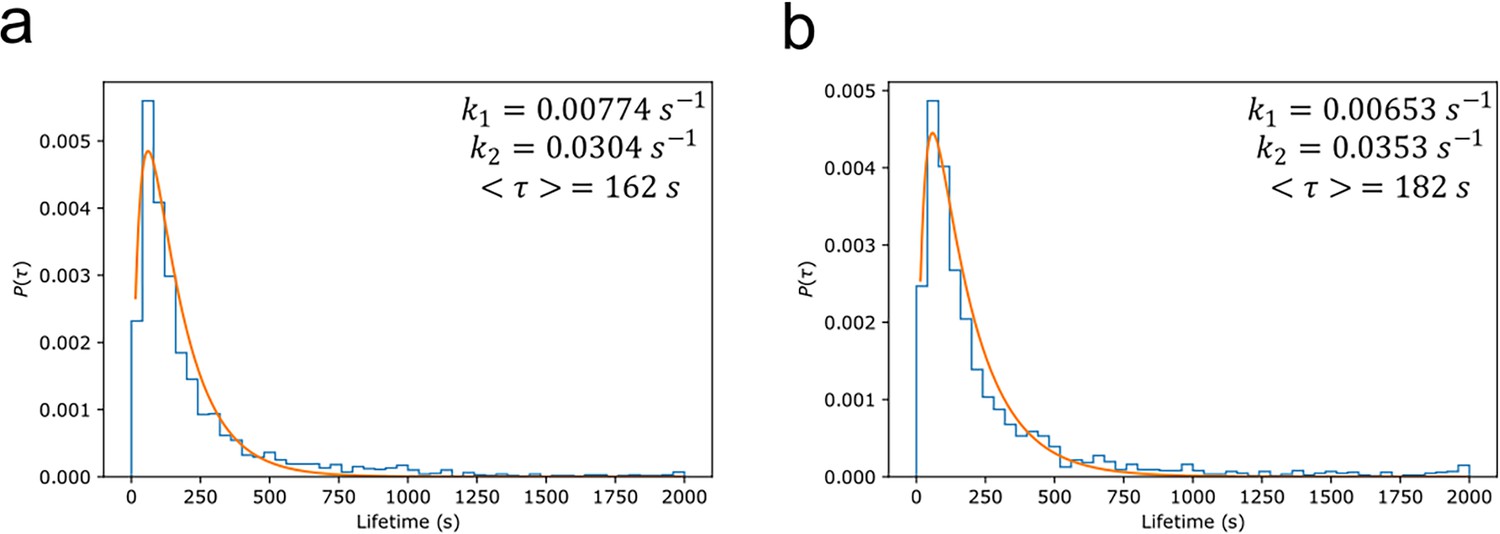
Myddosome degradation kinetics from lifetime distribution.
Normalised probability distributions plotted for (a) lipopolysaccharide (LPS) and (b) amyloid-beta (Aβ) stimulated Myddosomes. The histograms were fit assuming a two-step degradation, with the rate constants and , and mean lifetime calculated for each condition.
Figure 6—figure supplement 1
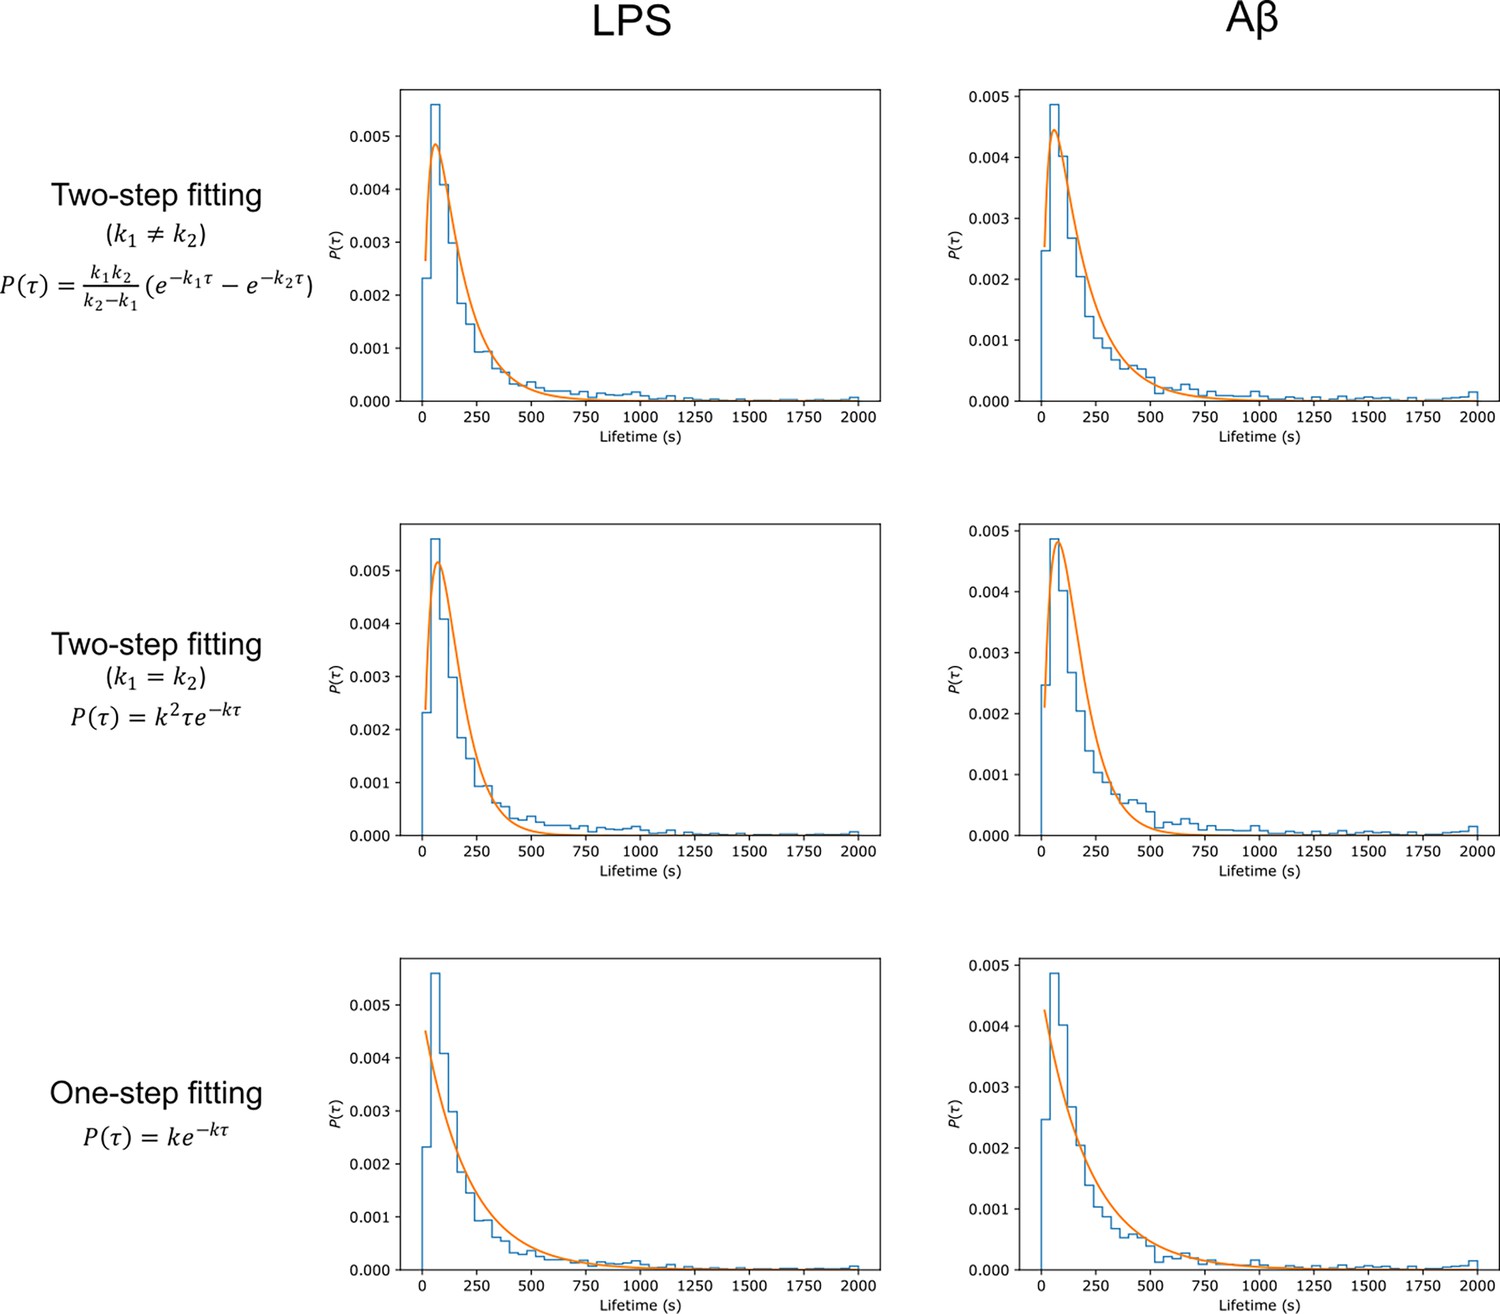
Comparison of fitting different degradation kinetics to lifetime distributions after stimulation.
Optimal fits at both long and short lifetimes (for both lipopolysaccharide [LPS] and amyloid-beta [Aβ]) stimulation were observed assuming that the degradation of Myddosomes was a two-step process, with different rate constants for each step (top row) – less optimal fits were obtained for a two-step process assuming the same rate constants for each step, and a one-step degradation.
Figure 7
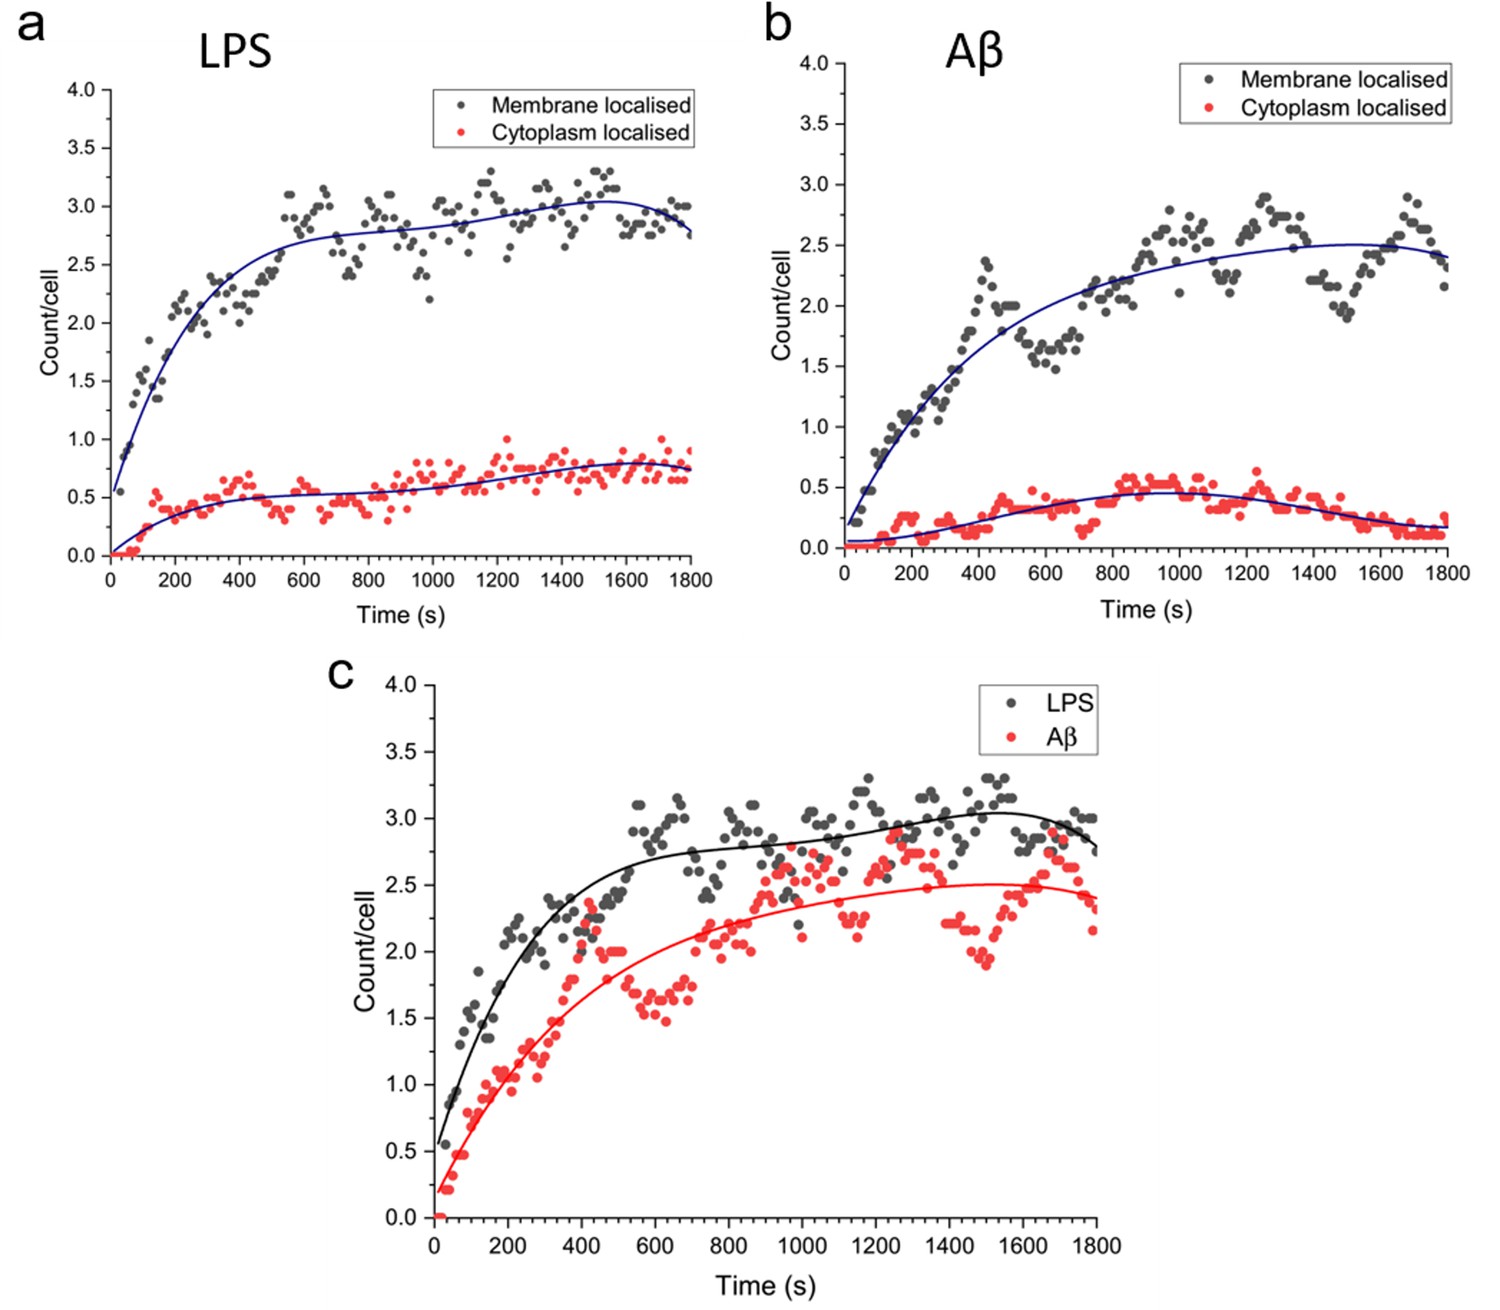
Total number of MyD88 puncta localised to the plasma membrane or cytoplasm, for Myddosomes which formed at the plasma membrane.
Plots are normalised by cell number. (a) Lipopolysaccharide (LPS) stimulation, (b) amyloid-beta (Aβ) stimulation. (c) Overlay of total number of plasma membrane localised puncta, from membrane initialised trajectories after LPS and Aβ stimulation.
-
Figure 7—source data 1
Myddosome localisation (membrane/cytoplasmic) following stimulation.
- https://cdn.elifesciences.org/articles/92350/elife-92350-fig7-data1-v1.xlsx
Figure 8
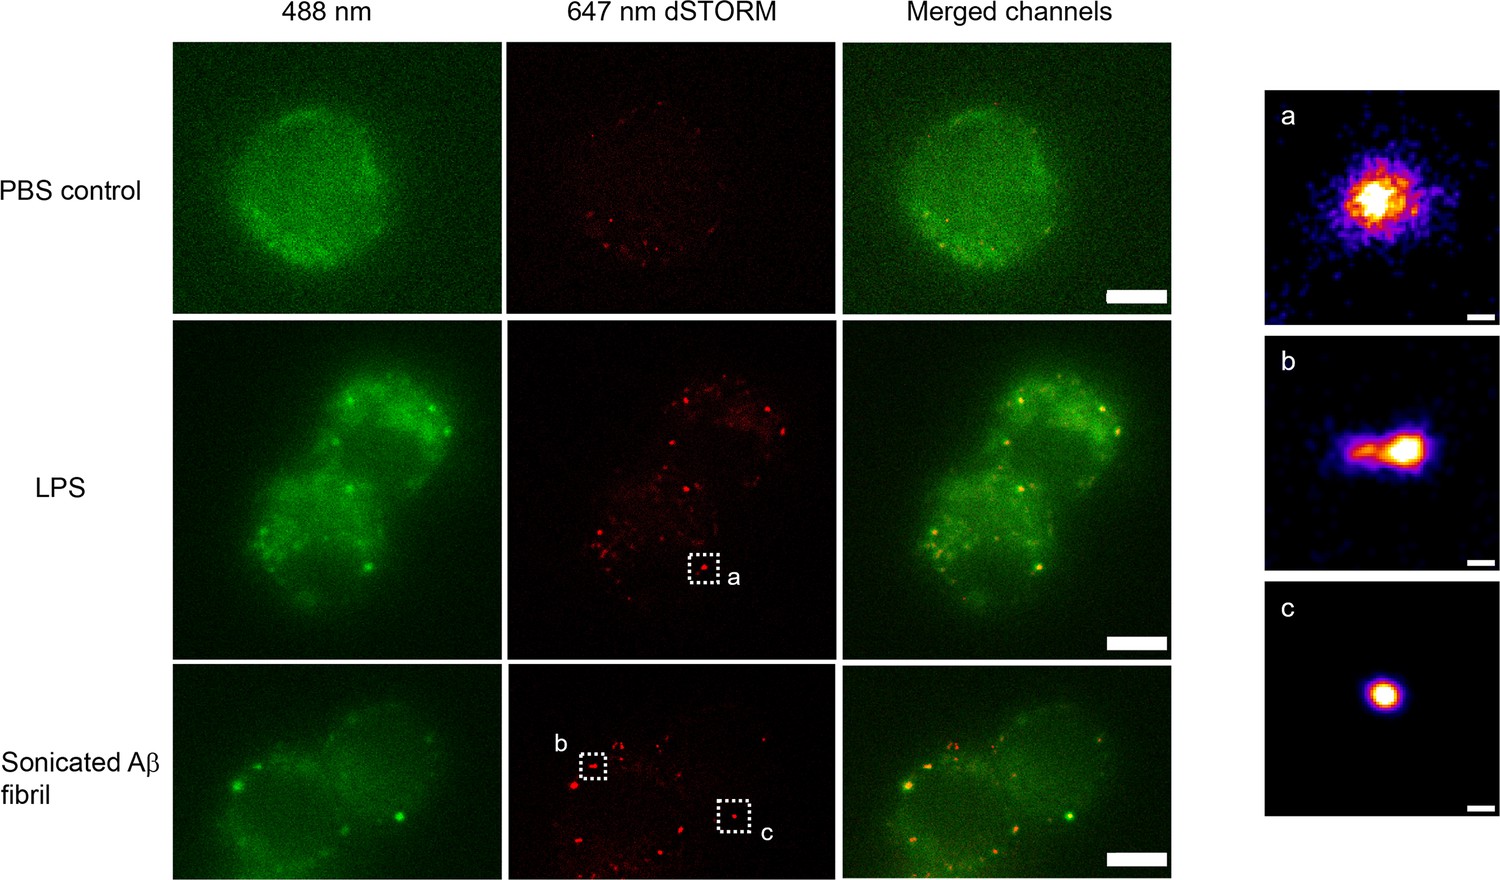
Example super-resolution images.
Fixed macrophages stimulated by PBS (control), 100 ng/ml lipopolysaccharide (LPS) and 200 nM sonicated amyloid-beta (Aβ) fibrils. 488 nm channel shows the MyD88-YFP signal. 641 nm channel shows the reconstructed super-resolved image of Alexa-647-conjugated anti-GFP antibody to represent the size of Myddosome. The merged channel shows signal overlap between the Myddosomes and Alexa-647-conjugated anti-GFP antibody. Only co-localised puncta (in yellow) correspond to real Myddosome signal. The scale bars are 5 μm (left figure) and 200 nm (right).
Figure 9
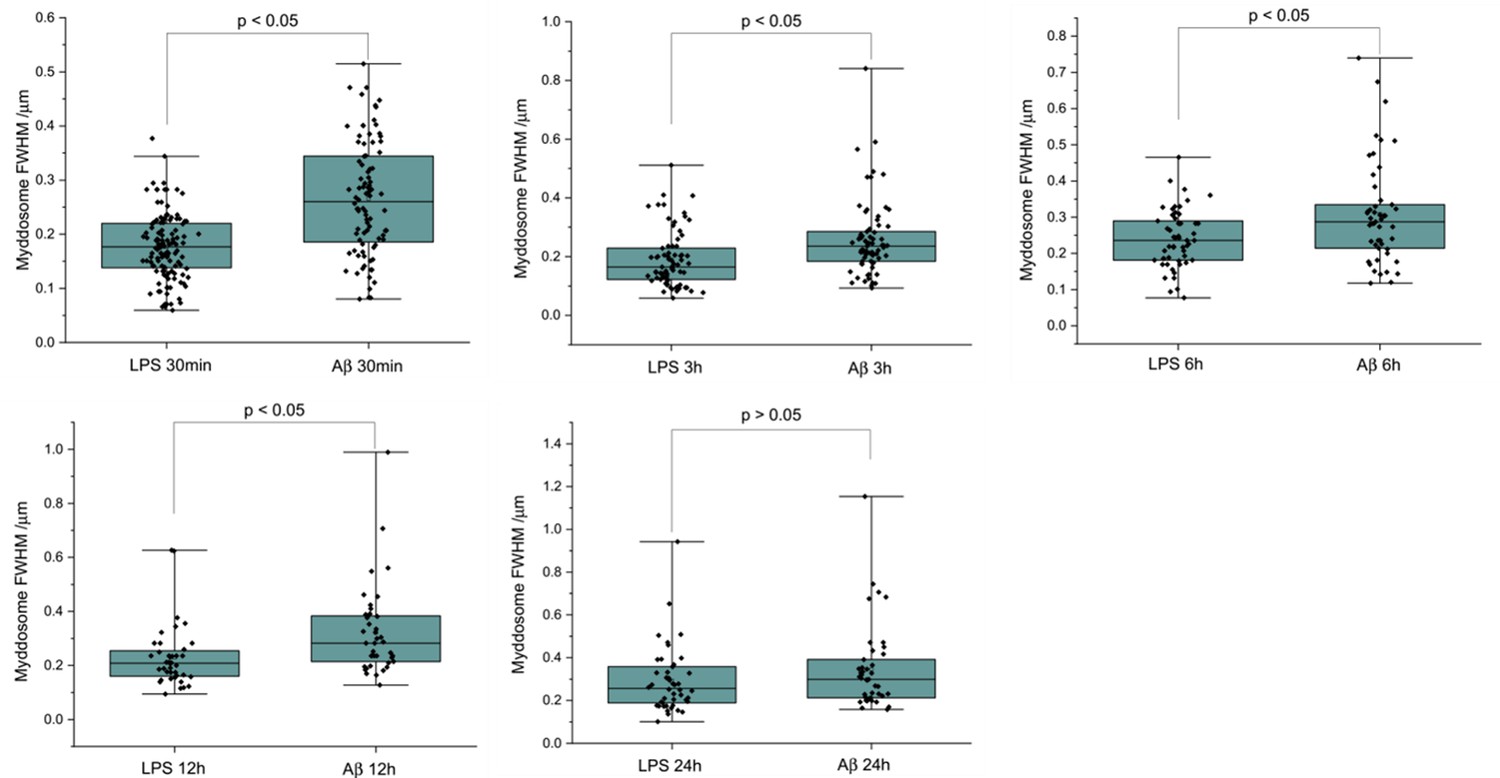
The size of Myddosomes triggered by lipopolysaccharide (LPS) and sonicated amyloid-beta (Aβ) fibrils at different times post triggering.
MyD88-YFP transduced iBMDMs were stimulated with LPS (100 ng/ml) or sonicated Aβ fibrils (200 nM) followed by fixation and antibody labelling. Full width at half maximum (FWHM) of puncta was measured by 1D Gaussian fitting. (From 30 min to 24 hr: n = 212, 140, 99, 77, 85 across three biological replicates for each stimulation. The p-values are based on unpaired two-sided Student’s t-test.)
-
Figure 9—source data 1
Myddosome size (full width half maxima) at different timepoints following stimulation.
- https://cdn.elifesciences.org/articles/92350/elife-92350-fig9-data1-v1.xlsx
Figure 10
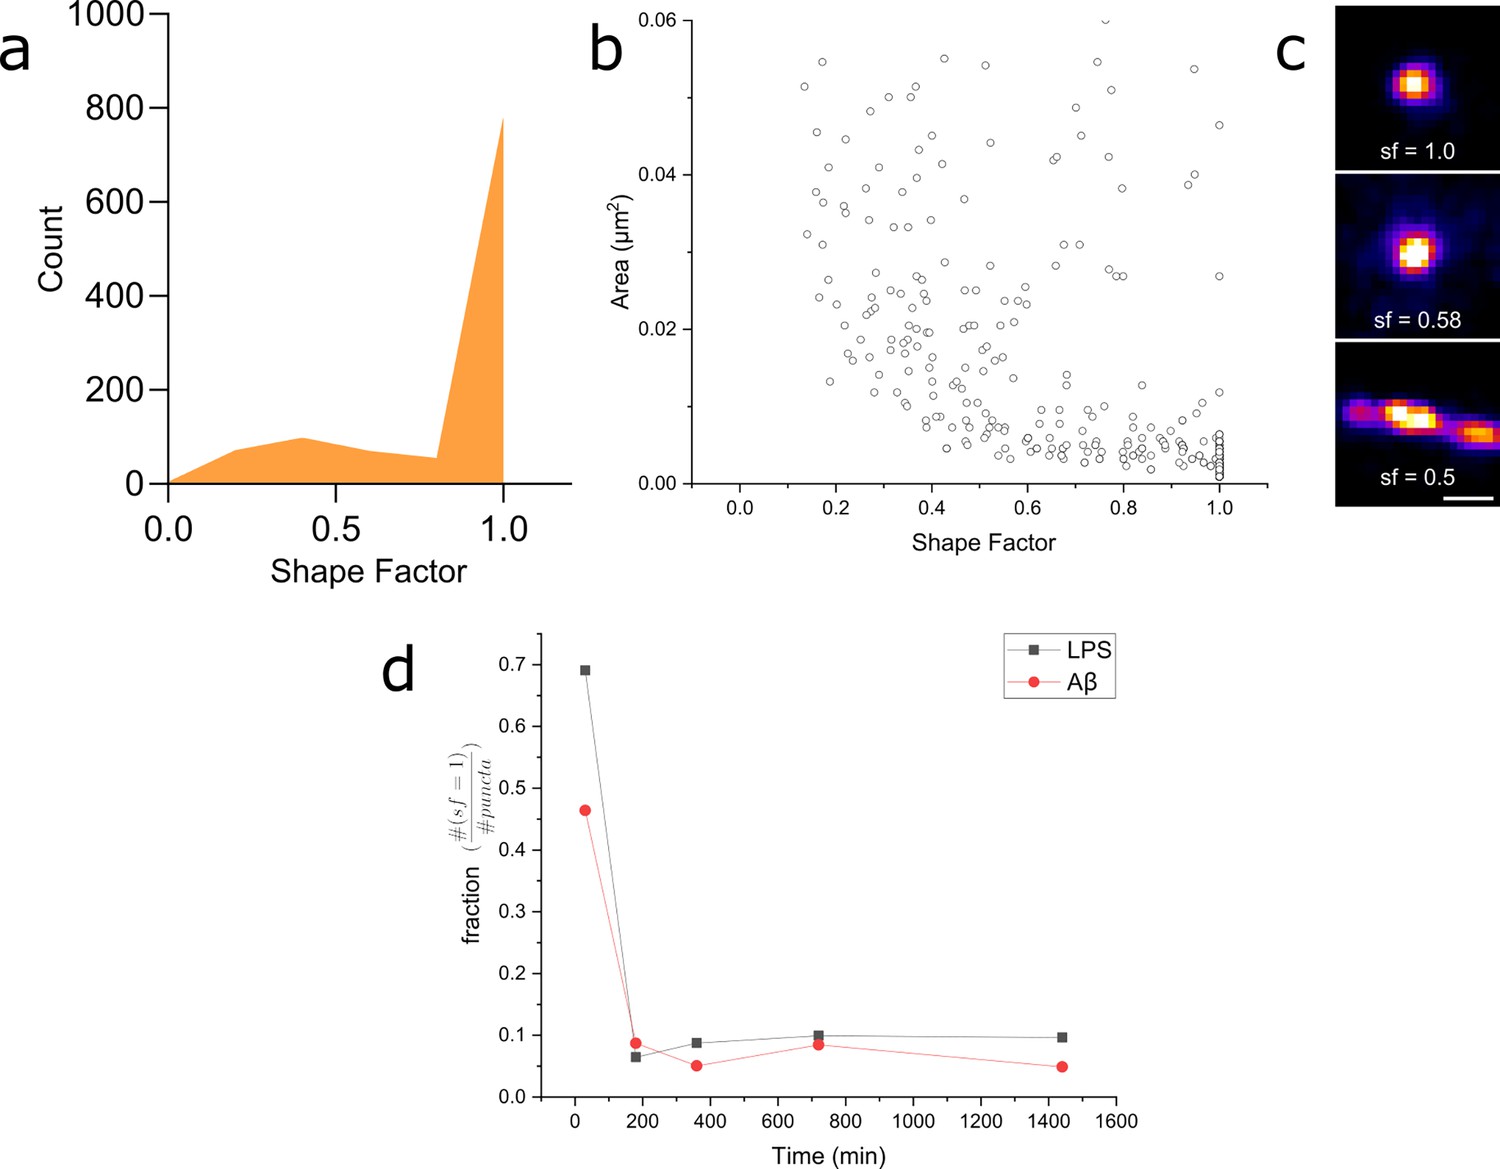
Myddosome shape factor analysis.
(a) Distribution of super-resolved MyD88 puncta shape factors after 30 min lipopolysaccharide (LPS) stimulation ( , where and are area and perimeter, respectively), n = 1086 across three independent experiments. Similar distribution is also observed for 30 min amyloid-beta (Aβ) stimulation. (b) Plot of super-resolved cluster area vs cluster shape factor for 30 min LPS stimulations suggests that this corresponds to a populations of very small, spherical MyD88 clusters. Similar relationship was also observed for 30 min Aβ stimulation. n = 1086 across three independent experiments. (c) Magnified examples of three super-resolved MyD88 clusters with a range of different shape factors. Scale bar is 150 nm. (d) Plotting fractions of spherical clusters (shape factor = 1) compared to total puncta suggest a drop in the population of small, spherical MyD88 clusters after 30 min for both LPS and Aβ stimulation. There is a smaller fraction of these small spherical clusters following Aβ stimulation compared to LPS.
-
Figure 10—source data 1
Raw data for Myddosome shape factor analysis.
- https://cdn.elifesciences.org/articles/92350/elife-92350-fig10-data1-v1.xlsx
Additional files
Download links
A two-part list of links to download the article, or parts of the article, in various formats.
Downloads (link to download the article as PDF)
Open citations (links to open the citations from this article in various online reference manager services)
Cite this article (links to download the citations from this article in formats compatible with various reference manager tools)
The delayed kinetics of Myddosome formation explains why amyloid-beta aggregates trigger Toll-like receptor 4 less efficiently than lipopolysaccharide
eLife 13:RP92350.
https://doi.org/10.7554/eLife.92350.3


