The population genetics of convergent adaptation in maize and teosinte is not locally restricted
- Department of Evolution and Ecology, University of California, Davis, United States
- Institute of Ecology and Evolution, University of Oregon, United States
- Center for Population Biology, University of California, Davis, United States
- Department of Plant Sciences, University of California, Davis, United States
- Department of Integrative Genetics and Genomics, University of California, Davis, United States
- United States Department of Agriculture– Agriculture Research Service, United States
- Department of Crop and Soil Sciences, North Carolina State University, United States
- Centro Universitario de Ciencias Biológicas y Agropecuarias, Universidad de Guadalajara, Mexico
- Department of Ecology, Evolution, and Organismal Biology; Genome Informatics Facility, Iowa State University, United States
- Génétique Quantitative et Evolution - Le Moulon, Université Paris-Saclay, INRAE, CNRS, AgroParisTech, France
- Genome Center, University of California, Davis, United States
Figures
Figure 1
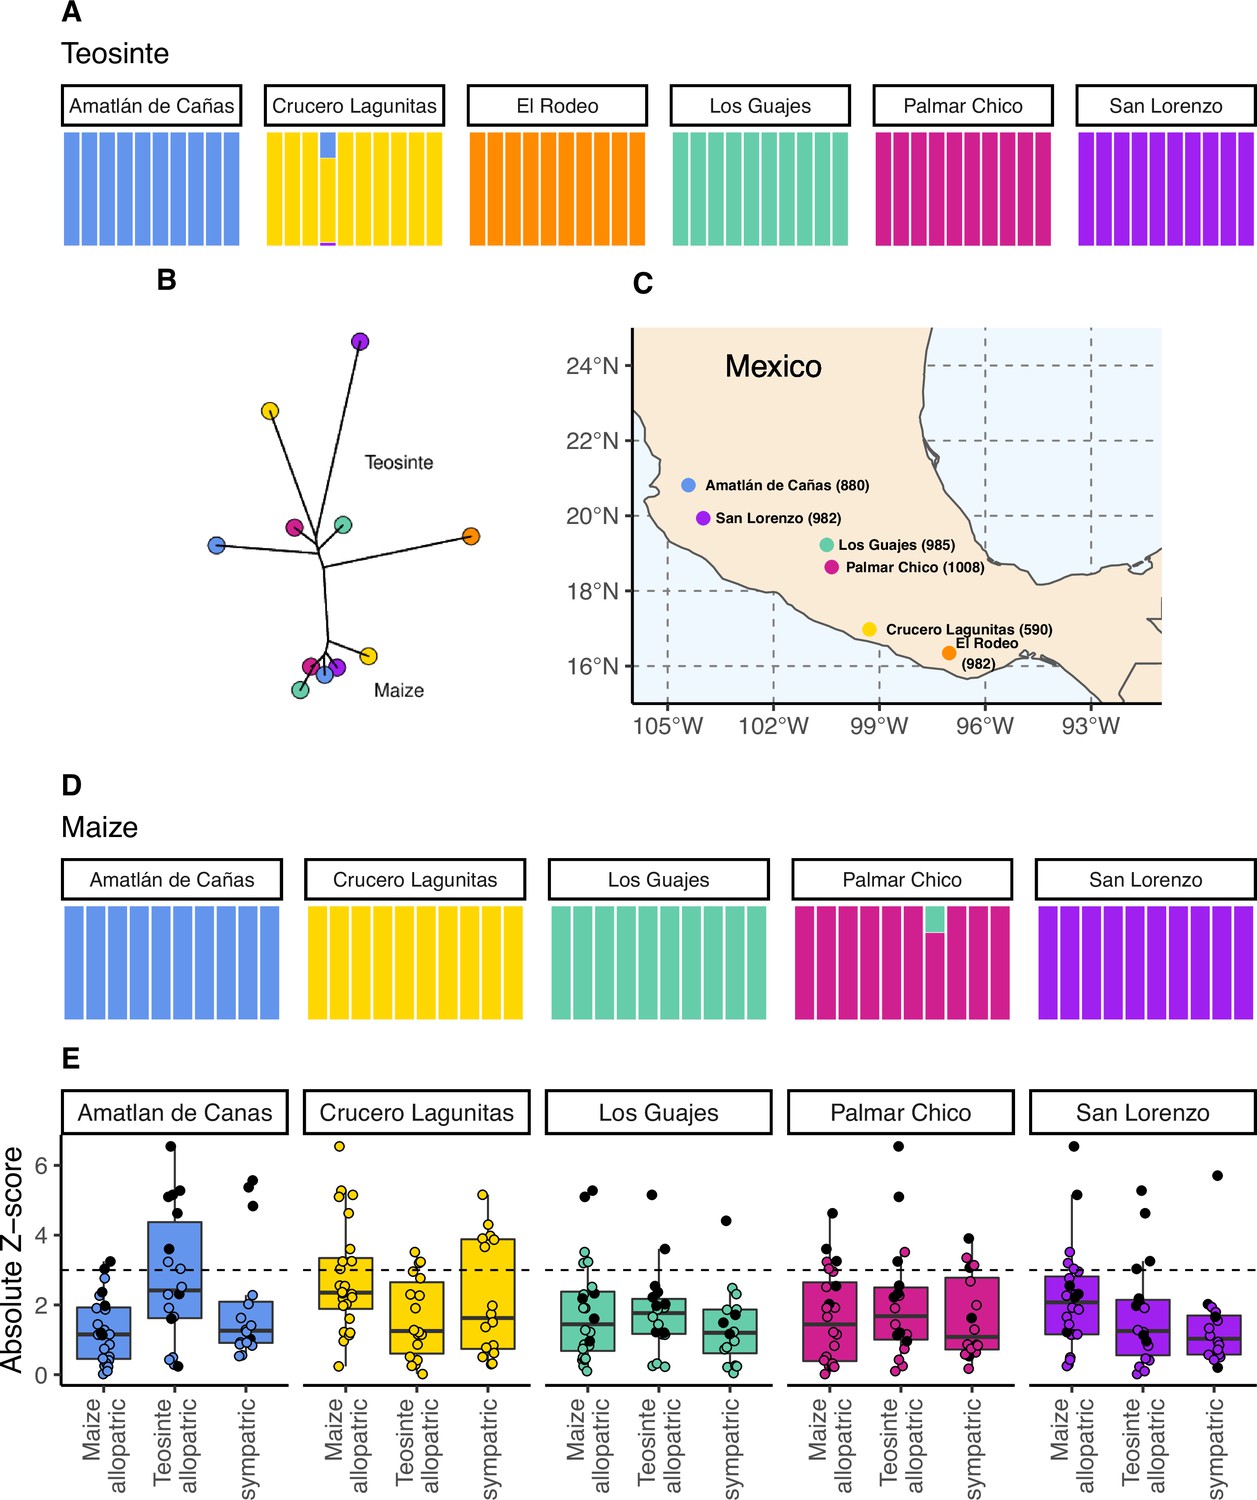
The geographic distribution, population structure, and gene flow of maize and teosinte populations.
(A and D) Admixture proportions among populations within subspecies. The dominant cluster in each population is colored by sampling location. (B) The unrooted tree of maize and teosinte populations. (C) Geographic sampling locations for the studied maize and teosinte populations. (E) tests to quantify evidence of gene flow between the subspecies for allopatric and sympatric population pairs. Each point in (E) reports the absolute Z-score for an test, where a given focal population was partnered with another population of the same subspecies as a sister node, and two other populations from the other subspecies as a sister clade (see Materials and methods for further details). Black points show tests that included maize from Crucero Lagunitas, otherwise points are colored by focal population. The dotted line corresponds to our chosen significance threshold ().
Figure 2
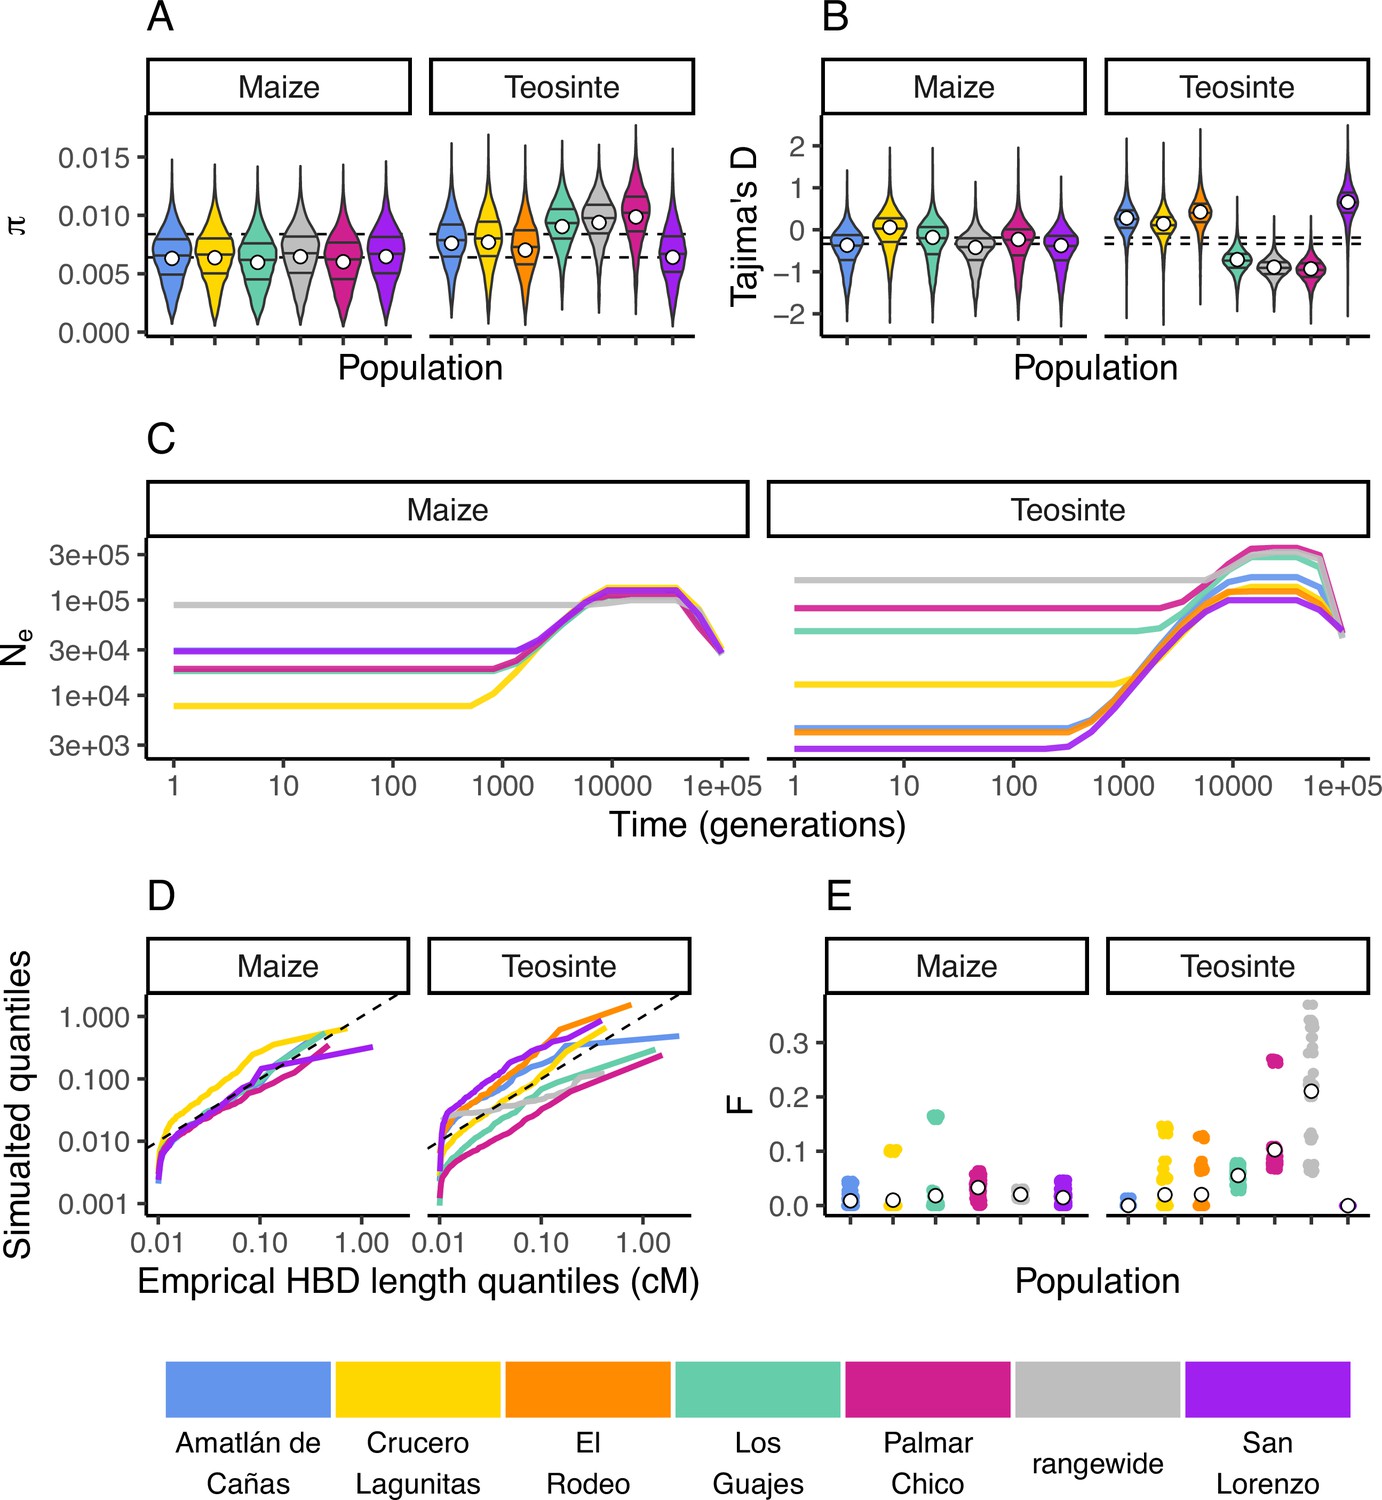
Inbreeding, diversity, and demography.
The distribution of (A) and Tajima’s D (B) calculated in 100 kb windows for maize and teosinte populations. Dashed lines show the median values for the two subspecies. Filled white points show the median values generated from coalescent simulations under the demographic history inferred for each population. Colors for each population are as in Figure 1 and are shown at the bottom of the figure. (C) The inferred demography for each population. (D) The quantile of observed homozygosity by descent (HBD) lengths (cM) versus those simulated under each population demography. Dashed lines shows the 1:1 correspondence between the axes. (E) The distribution of inbreeding coefficients in each population. Filled white points are the average values for each population.
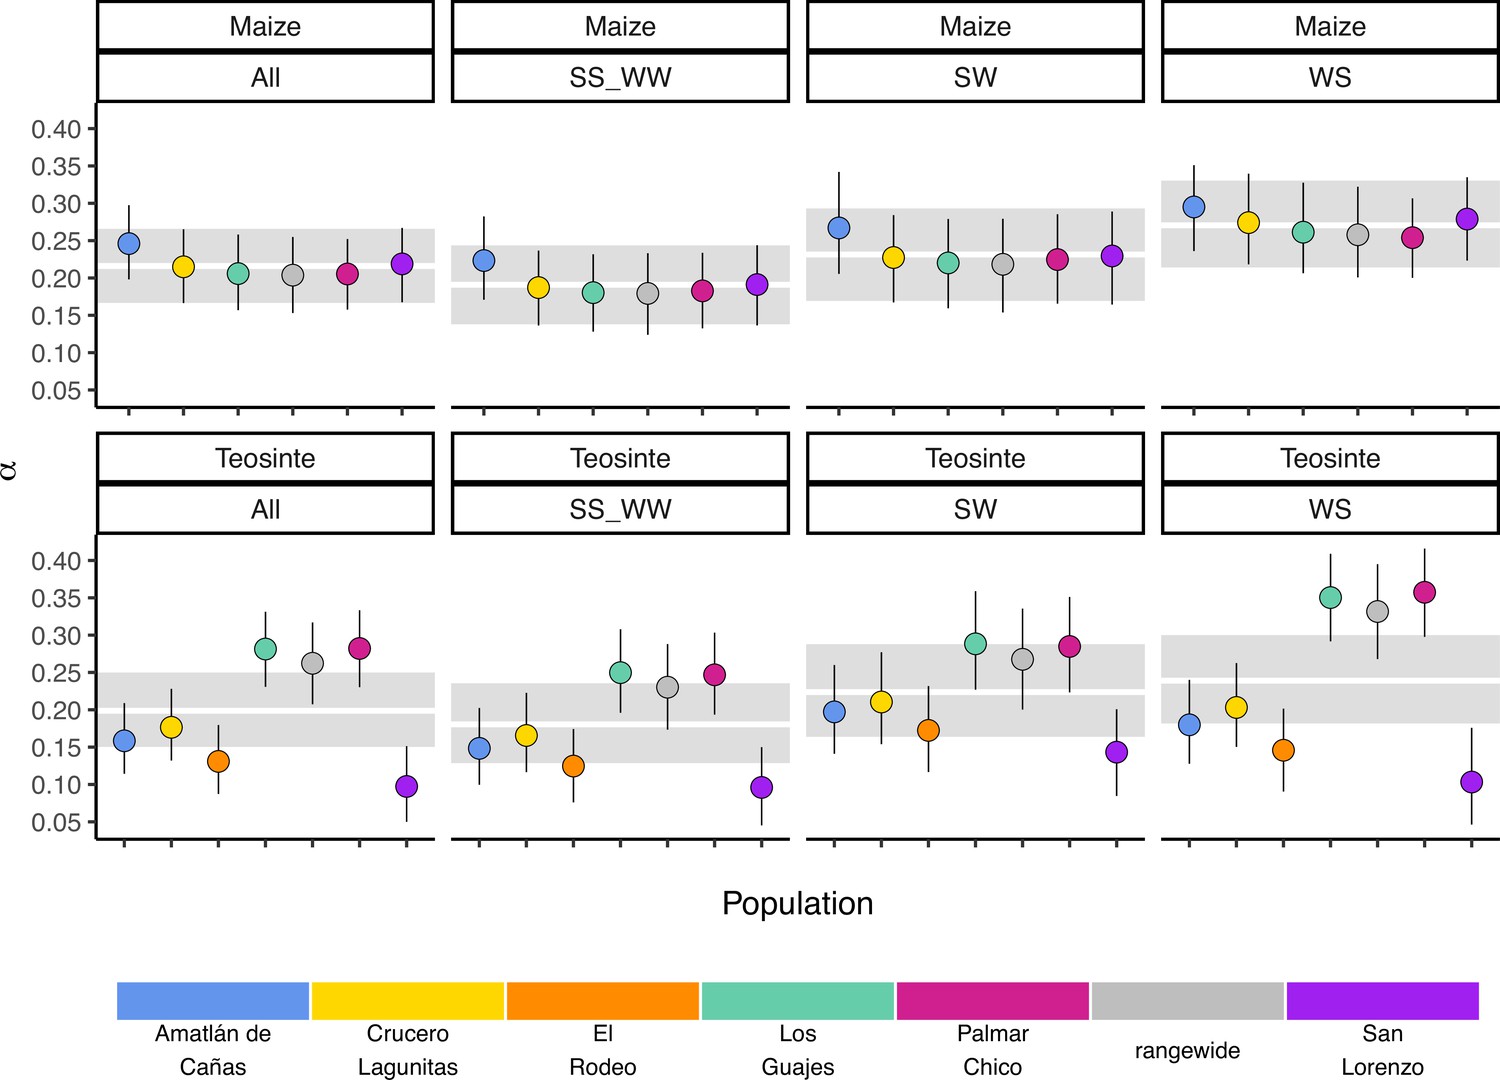
Figure 3
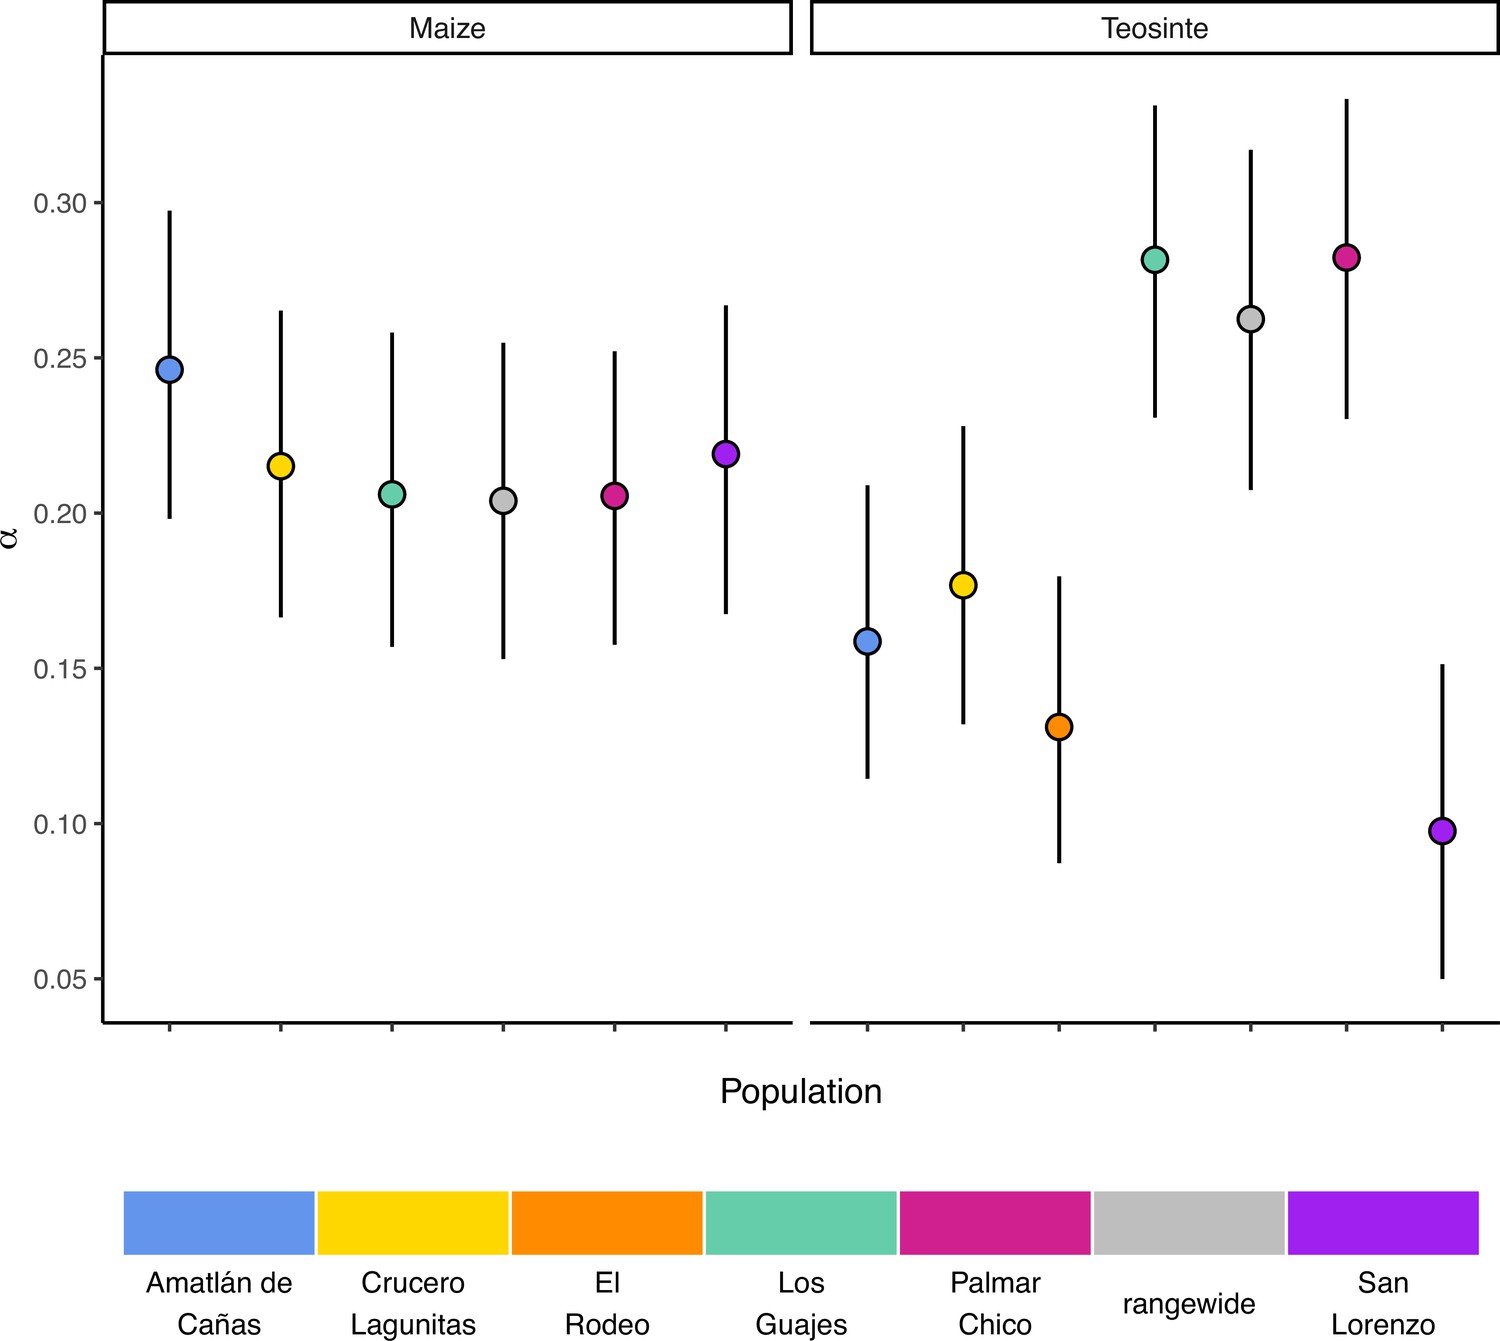
The proportion of mutations fixed by natural selection.
Estimated values of the proportion of mutations fixed by natural selection (α) by population. Vertical lines show the 95% credible interval.
Figure 4
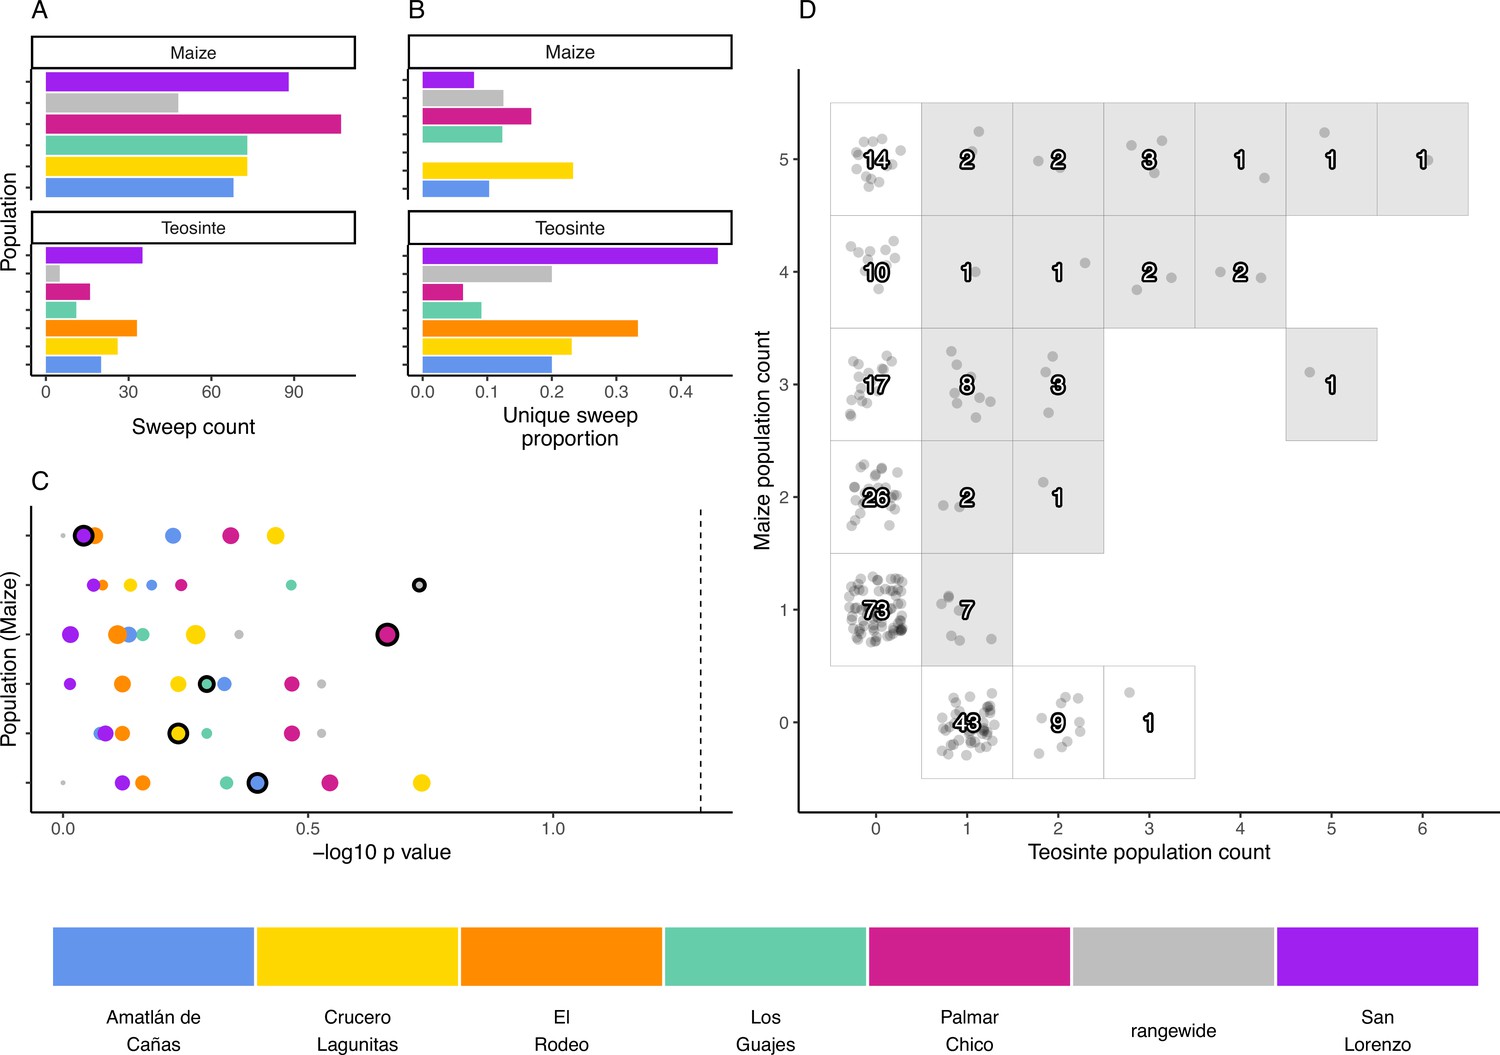
The distribution of shared and private selective sweeps.
(A) The total number of sweeps inferred in each population. (B) The proportion of sweeps that are unique to each population. (C) Negative p-values for hypergeometric tests to identify maize-teosinte population pairs that shared more sweeps than expected by chance (see Materials and methods). p-Values were adjusted for multiple tests using the Benjamini and Yekutieli method. Populations along the y axis are maize (order matches the legend below, with Amatlán de Cañas at the bottom), while the point color designates the teosinte population each maize population was paired with. Points with black outline highlight the sympatric population comparisons. Point size is scaled by the number of shared sweeps identified in each pair. The dotted line indicates our chosen significance level (). (D) Counts of shared and unique sweeps broken down by how many maize and teosinte populations they occurred in. Gray boxes show sweeps shared across the two subspecies.
Figure 5
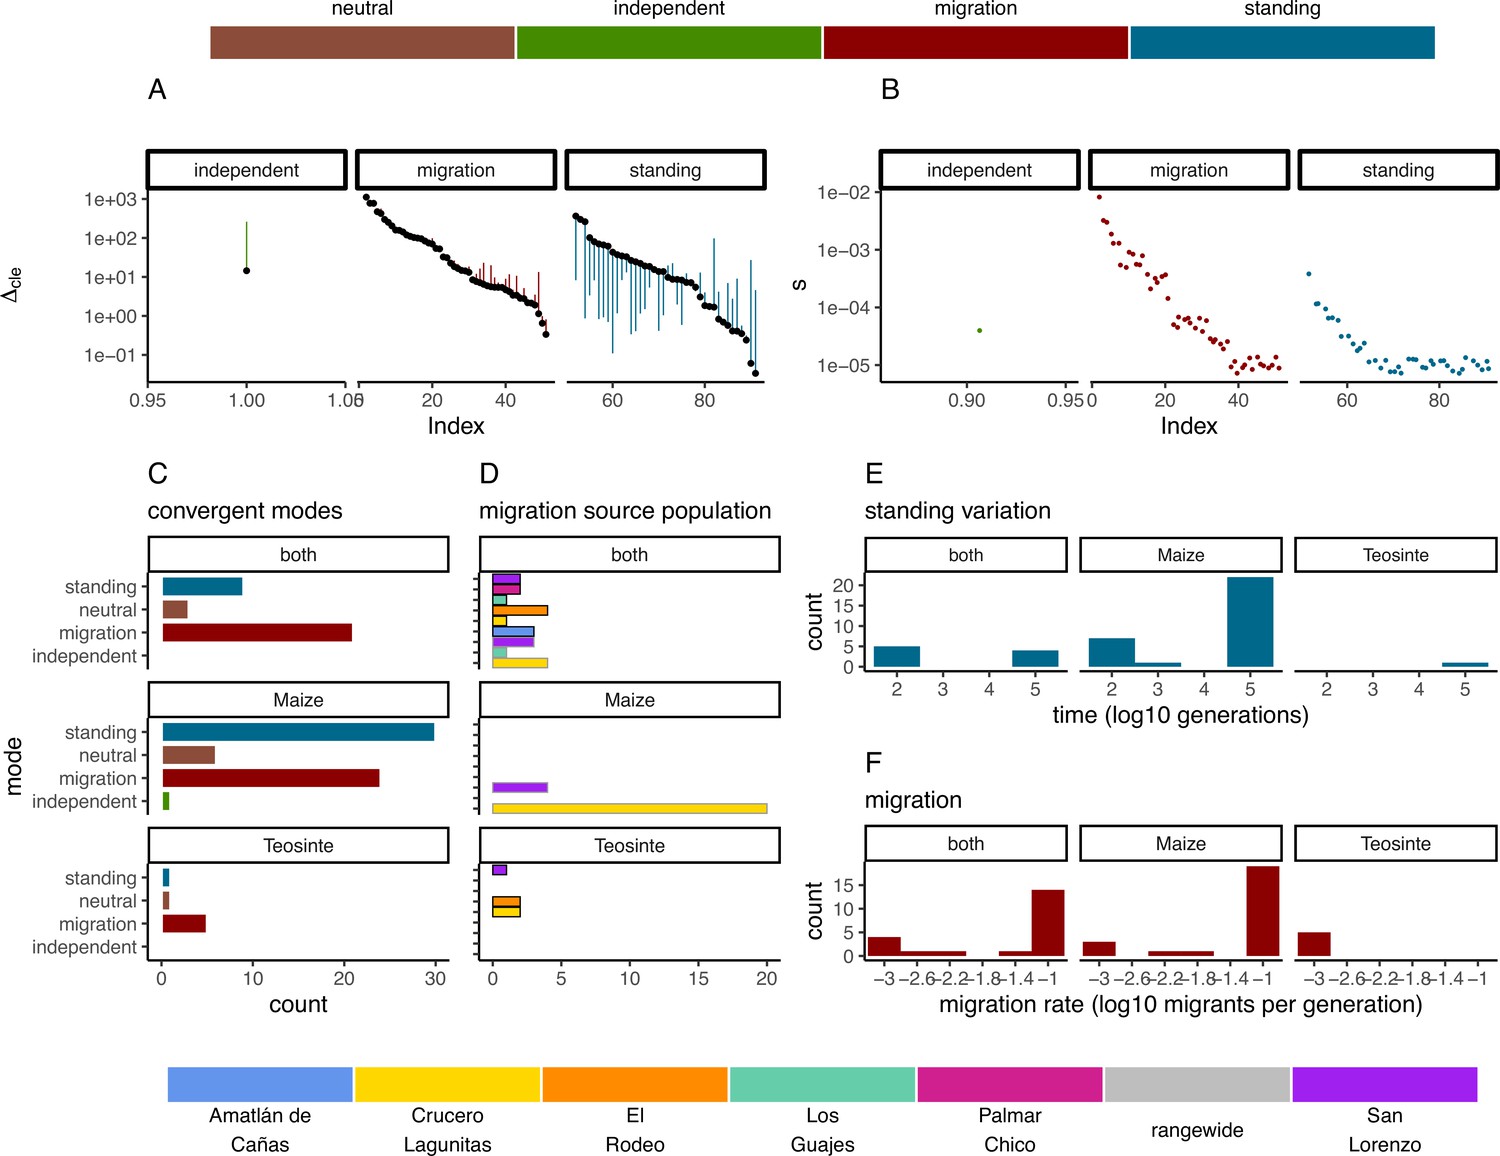
Modes of convergent adaptation and affiliated parameters for shared selective sweeps.
(A) The difference in composite likelihood scores for the best supported mode of convergent adaptation (colors in top legend) compared to next best mode (black points), and best mode compared to the neutral model (other end of each line segment above or below black point). (B) Selection coefficients colored by the most likely mode of convergent adaptation. (C) Number of shared sweeps for both subspecies that were inferred to be from each convergent adaptation mode. (D) The most likely source population for shared sweeps that converged via migration. Bars are colored by population (bottom legend) and are outlined in black for teosinte and gray for maize. (E) Observed frequency of the inferred time in generations that each selected allele persisted prior to selection for models of convergent adaptation via standing variation. (F) Observed frequency of each inferred migration rate value for models of convergent adaptation via migration. (C, D, E, and F) are partitioned by which subspecies shared the sweep.
Appendix 2—figure 1
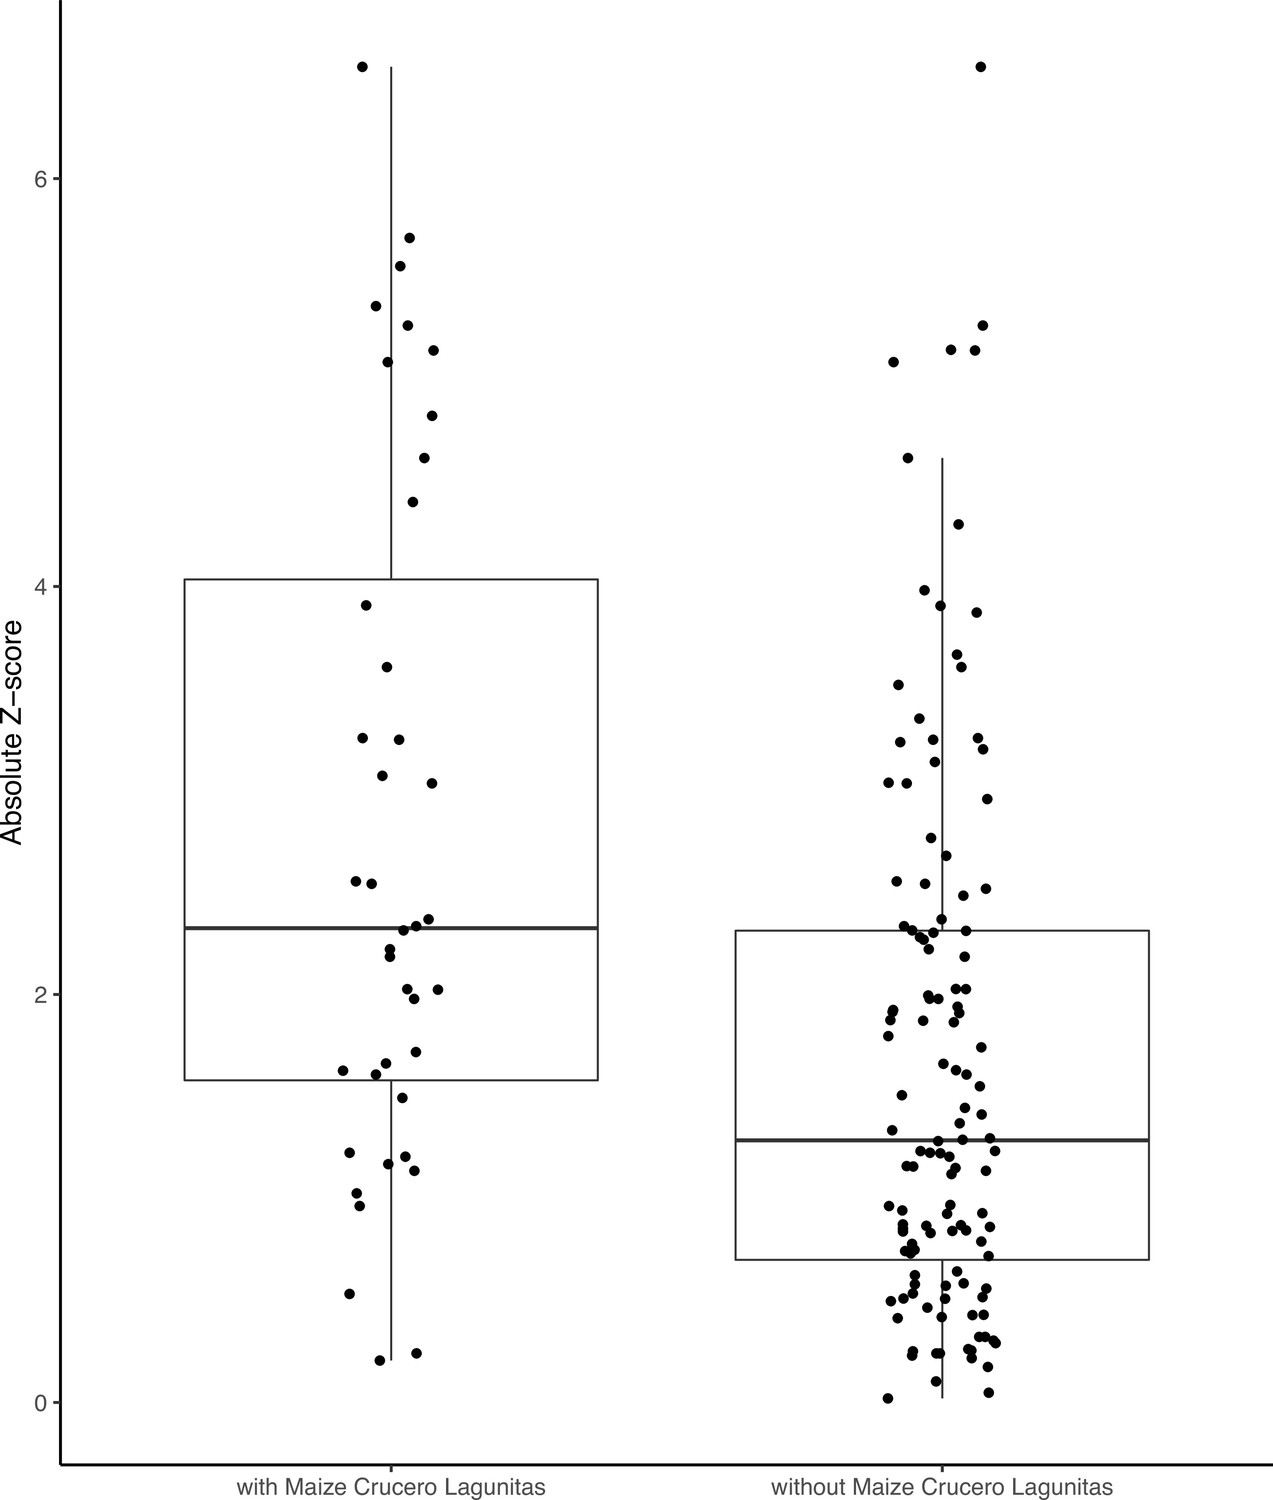
F4 tests including the maize Crucero Lagunitas population are significantly elevated compared to those without.
Appendix 3—figure 1
Predicted values of α across mutation types.
Gray bands for each mutation type show the 95% credible intervals averaged over each population.
Appendix 4—figure 1

Treemix phylogeny including both subsamples of Palmar Chico.
Appendix 4—figure 2
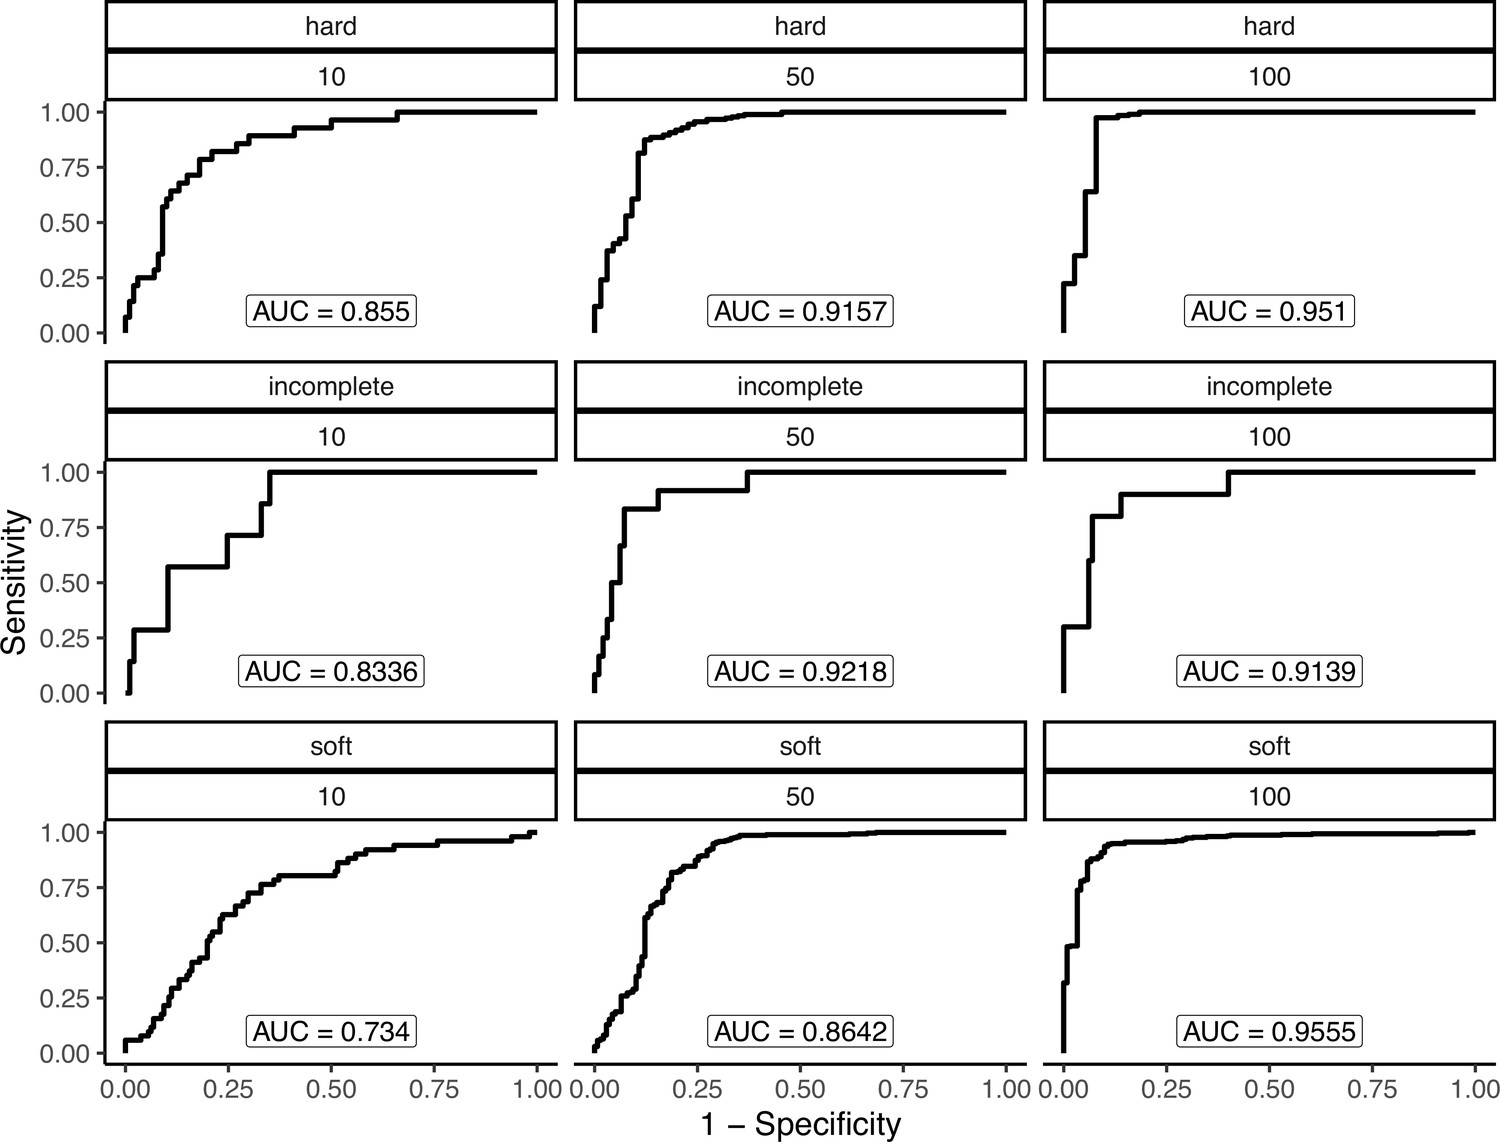
Performance to detect simulated hard, soft, and incomplete sweeps under varying strengths of selection under the maize Palmar Chico population demography.
Each panel shows a combinations of sweep type (hard, soft, or incomplete) and strength of selection (α=4Nes=10, 50, or 100).
Appendix 4—figure 3
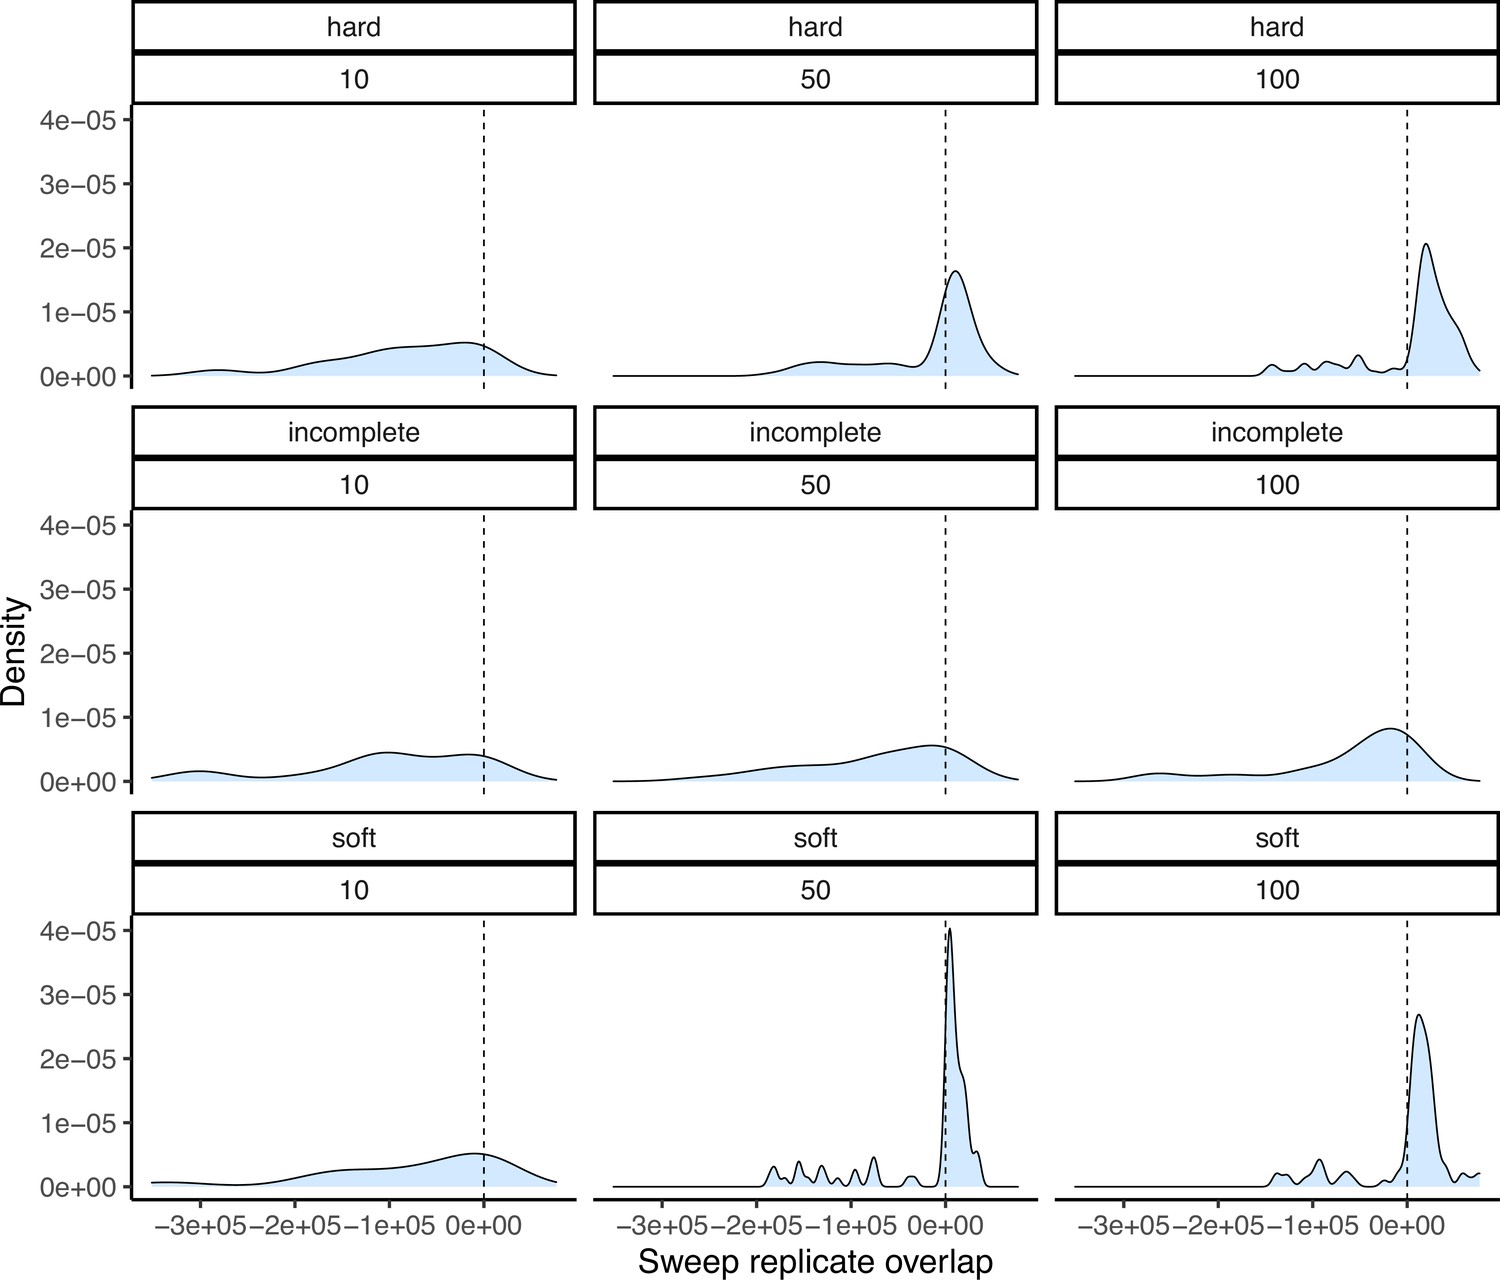
Degree of overlap between simulated sweep regions taken from two down-sampled replicates under the maize Palmar Chico population demography.
Positive values show the amount of overlap in base pairs between sweep regions, while negative values represent the space between them. Panel structure follows that of Appendix 4—figure 2.
Appendix 4—figure 4

Frequency of each population as the mutation source for sweeps shared via migration.
The order of populations along the x axis matches that of the source populations labeled for each strip along the top.
Appendix 4—figure 5
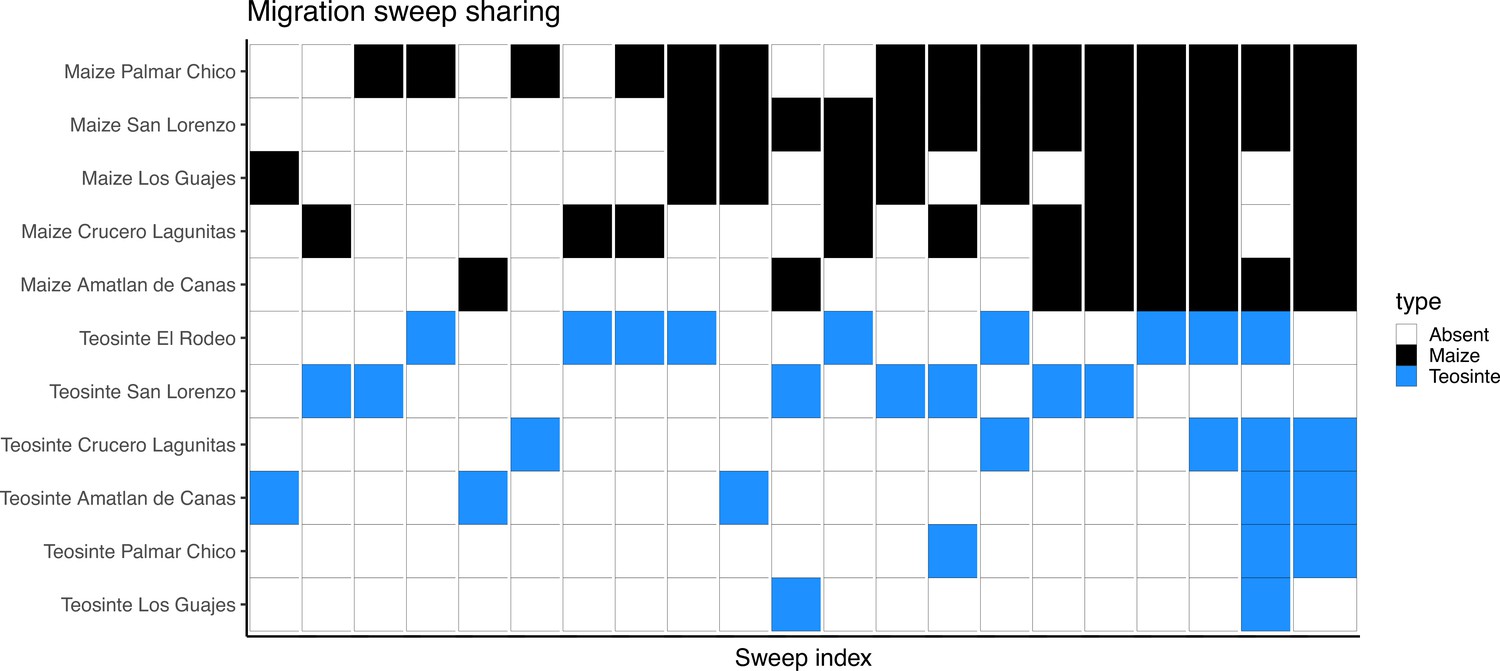
Inferred sweeps shared between subspecies via migration.
The x axis is sorted by the number of populations each sweep was found in. Populations are sorted along the y axis first by subspecies then by their number of sweeps.
Appendix 4—figure 6
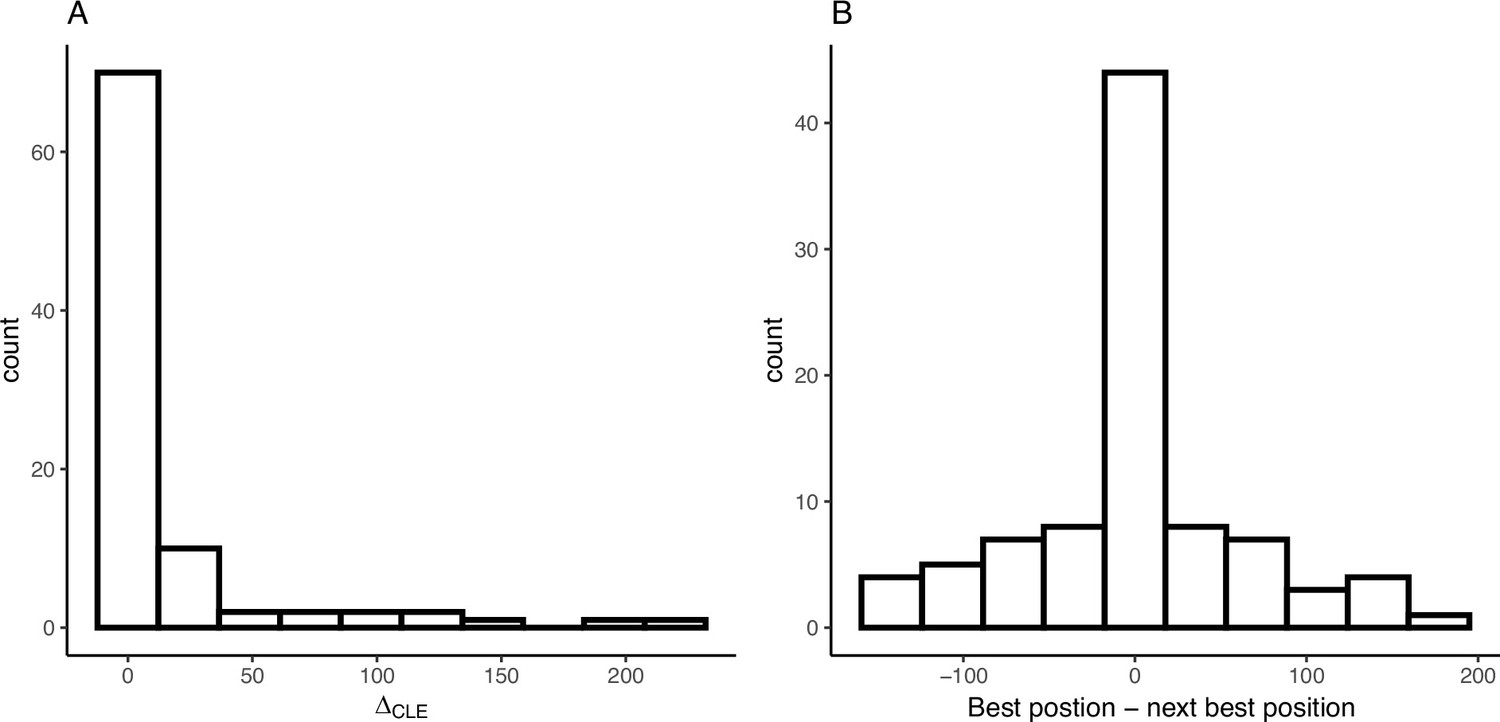
Variation in composite likelihoods within sweep regions.
(A) Distribution of differences between highest and next highest composite likelihoods within each sweep region. (B) Distribution of differences between highest and next highest composite likelihoods candidate beneficial mutation positions within each sweep region.
Author response image 1

Tables
Appendix 1—table 1
Population sampling location information.
| Population | Subspecies | Sample size | Latitude | Longitude | Elevation (m) | Accession ID |
|---|---|---|---|---|---|---|
| Crucero Lagunitas | Maize | 10 | 16.98 | –99.28 | 201 | 2373-GRO-294 |
| Amatlán de Cañas | Maize | 10 | 20.82 | –104.41 | 760 | 5054-NAY-310 |
| Los Guajes | Maize | 10 | 19.23 | –100.49 | 985 | TC-300 |
| San Lorenzo | Maize | 10 | 19.94 | –103.99 | 982 | RMM-15 |
| Palmar Chico | Maize | 55 | 18.64 | –100.35 | 1008 | JSG-RMM-LCL-529 |
| Crucero Lagunitas | Teosinte | 10 | 16.85 | –99.06 | 590 | JSG-RMM-LCL-487 |
| Amatlán de Cañas | Teosinte | 10 | 20.82 | –104.41 | 880 | JSG-JRP-ERG-543 |
| El Rodeo | Teosinte | 10 | 16.35 | –97.02 | 982 | JSG-RMM-LCL-486 |
| Los Guajes | Teosinte | 10 | 19.23 | –100.49 | 851 | JSG Y RMM-454 |
| San Lorenzo | Teosinte | 10 | 19.94 | –103.99 | 982 | RMM-13 |
| Palmar Chico | Teosinte | 50 | 18.64 | –100.35 | 983 | JSG-RMM-LCL-528 |
Appendix 2—table 1
Significant F4 tests.
Each row of the table reports the number of significant F4 tests that occurred with a given focal and secondary population, where the two other tip positions were filled with each of the remaining populations for each subspecies.Rows that are left blank in the secondary column are used to report the total number of significant trees for a given focal population.
| Focal population | Secondary population | Count |
|---|---|---|
| Maize Amatlan de Canas | 5 | |
| Maize Amatlan de Canas | Maize Crucero Lagunitas | 5 |
| Maize Amatlan de Canas | Teosinte Amatlan de Canas | 3 |
| Maize Amatlan de Canas | Teosinte El Rodeo | 2 |
| Maize Amatlan de Canas | Teosinte Palmar Chico | 2 |
| Maize Amatlan de Canas | Teosinte San Lorenzo | 2 |
| Maize Amatlan de Canas | Teosinte Los Guajes | 1 |
| Maize Crucero Lagunitas | 15 | |
| Maize Crucero Lagunitas | Teosinte Amatlan de Canas | 9 |
| Maize Crucero Lagunitas | Teosinte Crucero Lagunitas | 6 |
| Maize Crucero Lagunitas | Teosinte El Rodeo | 6 |
| Maize Crucero Lagunitas | Maize Palmar Chico | 5 |
| Maize Crucero Lagunitas | Maize Los Guajes | 4 |
| Maize Crucero Lagunitas | Teosinte San Lorenzo | 4 |
| Maize Crucero Lagunitas | Maize Amatlan de Canas | 3 |
| Maize Crucero Lagunitas | Maize San Lorenzo | 3 |
| Maize Crucero Lagunitas | Teosinte Palmar Chico | 3 |
| Maize Crucero Lagunitas | Teosinte Los Guajes | 2 |
| Maize Los Guajes | 6 | |
| Maize Los Guajes | Teosinte Amatlan de Canas | 4 |
| Maize Los Guajes | Maize Crucero Lagunitas | 3 |
| Maize Los Guajes | Teosinte Crucero Lagunitas | 3 |
| Maize Los Guajes | Maize San Lorenzo | 2 |
| Maize Los Guajes | Teosinte Palmar Chico | 2 |
| Maize Los Guajes | Maize Palmar Chico | 1 |
| Maize Los Guajes | Teosinte El Rodeo | 1 |
| Maize Los Guajes | Teosinte Los Guajes | 1 |
| Maize Los Guajes | Teosinte San Lorenzo | 1 |
| Maize Palmar Chico | 9 | |
| Maize Palmar Chico | Teosinte Amatlan de Canas | 7 |
| Maize Palmar Chico | Maize Crucero Lagunitas | 5 |
| Maize Palmar Chico | Teosinte Palmar Chico | 4 |
| Maize Palmar Chico | Teosinte El Rodeo | 3 |
| Maize Palmar Chico | Maize Los Guajes | 2 |
| Maize Palmar Chico | Maize San Lorenzo | 2 |
| Maize Palmar Chico | Teosinte San Lorenzo | 2 |
| Maize Palmar Chico | Teosinte Crucero Lagunitas | 1 |
| Maize Palmar Chico | Teosinte Los Guajes | 1 |
| Maize San Lorenzo | 6 | |
| Maize San Lorenzo | Teosinte Amatlan de Canas | 4 |
| Maize San Lorenzo | Maize Crucero Lagunitas | 3 |
| Maize San Lorenzo | Maize Los Guajes | 2 |
| Maize San Lorenzo | Teosinte Crucero Lagunitas | 2 |
| Maize San Lorenzo | Teosinte El Rodeo | 2 |
| Maize San Lorenzo | Teosinte Palmar Chico | 2 |
| Maize San Lorenzo | Maize Palmar Chico | 1 |
| Maize San Lorenzo | Teosinte Los Guajes | 1 |
| Maize San Lorenzo | Teosinte San Lorenzo | 1 |
| Teosinte Amatlan de Canas | 11 | |
| Teosinte Amatlan de Canas | Maize Crucero Lagunitas | 9 |
| Teosinte Amatlan de Canas | Maize Palmar Chico | 4 |
| Teosinte Amatlan de Canas | Maize Amatlan de Canas | 3 |
| Teosinte Amatlan de Canas | Maize Los Guajes | 3 |
| Teosinte Amatlan de Canas | Maize San Lorenzo | 3 |
| Teosinte Amatlan de Canas | Teosinte Los Guajes | 3 |
| Teosinte Amatlan de Canas | Teosinte Palmar Chico | 3 |
| Teosinte Amatlan de Canas | Teosinte San Lorenzo | 3 |
| Teosinte Amatlan de Canas | Teosinte Crucero Lagunitas | 1 |
| Teosinte Amatlan de Canas | Teosinte El Rodeo | 1 |
| Teosinte Crucero Lagunitas | 9 | |
| Teosinte Crucero Lagunitas | Maize Crucero Lagunitas | 6 |
| Teosinte Crucero Lagunitas | Maize Los Guajes | 5 |
| Teosinte Crucero Lagunitas | Teosinte Amatlan de Canas | 4 |
| Teosinte Crucero Lagunitas | Teosinte El Rodeo | 4 |
| Teosinte Crucero Lagunitas | Maize Palmar Chico | 3 |
| Teosinte Crucero Lagunitas | Maize San Lorenzo | 3 |
| Teosinte Crucero Lagunitas | Maize Amatlan de Canas | 1 |
| Teosinte Crucero Lagunitas | Teosinte Palmar Chico | 1 |
| Teosinte Los Guajes | Maize Crucero Lagunitas | 3 |
| Teosinte Los Guajes | Teosinte Amatlan de Canas | 3 |
| Teosinte Los Guajes | 3 | |
| Teosinte Los Guajes | Maize Los Guajes | 1 |
| Teosinte Los Guajes | Maize Palmar Chico | 1 |
| Teosinte Los Guajes | Maize San Lorenzo | 1 |
| Teosinte Palmar Chico | 8 | |
| Teosinte Palmar Chico | Maize Crucero Lagunitas | 5 |
| Teosinte Palmar Chico | Teosinte Amatlan de Canas | 5 |
| Teosinte Palmar Chico | Maize Palmar Chico | 4 |
| Teosinte Palmar Chico | Maize Los Guajes | 3 |
| Teosinte Palmar Chico | Maize San Lorenzo | 3 |
| Teosinte Palmar Chico | Teosinte El Rodeo | 2 |
| Teosinte Palmar Chico | Maize Amatlan de Canas | 1 |
| Teosinte Palmar Chico | Teosinte Crucero Lagunitas | 1 |
| Teosinte San Lorenzo | Maize Crucero Lagunitas | 5 |
| Teosinte San Lorenzo | 5 | |
| Teosinte San Lorenzo | Teosinte Amatlan de Canas | 3 |
| Teosinte San Lorenzo | Maize Palmar Chico | 2 |
| Teosinte San Lorenzo | Teosinte El Rodeo | 2 |
| Teosinte San Lorenzo | Maize Amatlan de Canas | 1 |
| Teosinte San Lorenzo | Maize Los Guajes | 1 |
| Teosinte San Lorenzo | Maize San Lorenzo | 1 |
Appendix 3—table 1
Proportion and count of fixed differences at 0-fold sites across teosinte populations.
| Population | Proportion | Total |
|---|---|---|
| Amatlan de Canas | 0.12238 | 1195 |
| Crucero Lagunitas | 0.15619 | 1880 |
| El Rodeo | 0.23233 | 2983 |
| Los Guajes | 0.03025 | 170 |
| San Lorenzo | 0.33796 | 6050 |
| Palmar Chico | 0.03580 | 184 |
Appendix 4—table 1
Performance to detect simulated hard, soft, and incomplete sweeps under varying strengths of selection under the maize Palmar Chico population demography.
TPR, TNR, FNR, and FPR stand for true positive, true negative, false negative, and false positive rates, respectively.
| Simulation type | TPR | TNR | FNR | FPR | |
|---|---|---|---|---|---|
| 10 | Hard | 0.14 | 0.67 | 0.86 | 0.33 |
| 50 | Hard | 0.92 | 0.75 | 0.08 | 0.25 |
| 100 | Hard | 0.99 | 0.84 | 0.01 | 0.16 |
| 10 | Incomplete | 0.04 | 0.67 | 0.96 | 0.33 |
| 50 | Incomplete | 0.06 | 0.67 | 0.94 | 0.33 |
| 100 | Incomplete | 0.05 | 0.63 | 0.95 | 0.37 |
| 10 | Soft | 0.13 | 0.71 | 0.87 | 0.29 |
| 50 | Soft | 0.75 | 0.74 | 0.25 | 0.26 |
| 100 | Soft | 0.81 | 0.76 | 0.19 | 0.24 |
Additional files
Download links
A two-part list of links to download the article, or parts of the article, in various formats.
Downloads (link to download the article as PDF)
Open citations (links to open the citations from this article in various online reference manager services)
Cite this article (links to download the citations from this article in formats compatible with various reference manager tools)
The population genetics of convergent adaptation in maize and teosinte is not locally restricted
eLife 12:RP92405.
https://doi.org/10.7554/eLife.92405.3


