Itaconate stabilizes CPT1a to enhance lipid utilization during inflammation
- Department of Pathology, Section on Comparative Medicine, Wake Forest School of Medicine, United States
- Department of Internal Medicine, Section on Molecular Medicine, Wake Forest School of Medicine, United States
Figures
Figure 1 with 1 supplement
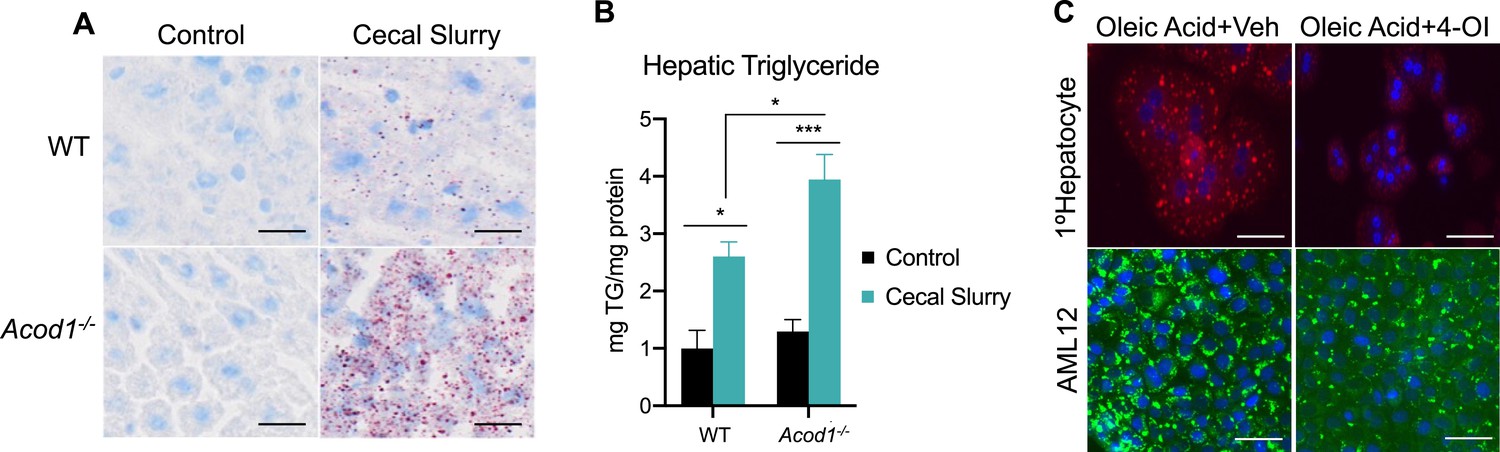
Aconitase decarboxylase 1 (Acod1) deficiency exacerbates hepatic lipid accumulation during sepsis.
(A) Oil red O staining of liver sections of wild-type (WT) and Acod1 KO control and cecal slurry (CS) injected mice (5 μl/kg). Images are representative of five independent experiments. (B) Hepatic triglyceride content. n=7 mice per group. (C) Oleate-loaded primary hepatocytes (top panel) and AML12 cells (bottom panel) were treated with vehicle (DMSO) or 4-octyl itaconate (4-OI) (250 µM) and stained with Nile Red (top panel) or BODIPY (bottom panel). Images arerepresentative of four independent experiments. Data are represented as mean ± SEM. *p<0.05, ***p<0.001. Scale bars are 50 μm.
Figure 1—figure supplement 1

BODIPY staining of frozen liver section of wild-type (WT) and Acod1-/- KO livers stained 24 hr post-LPS injection. Scale bars are 50 μm.
Figure 2
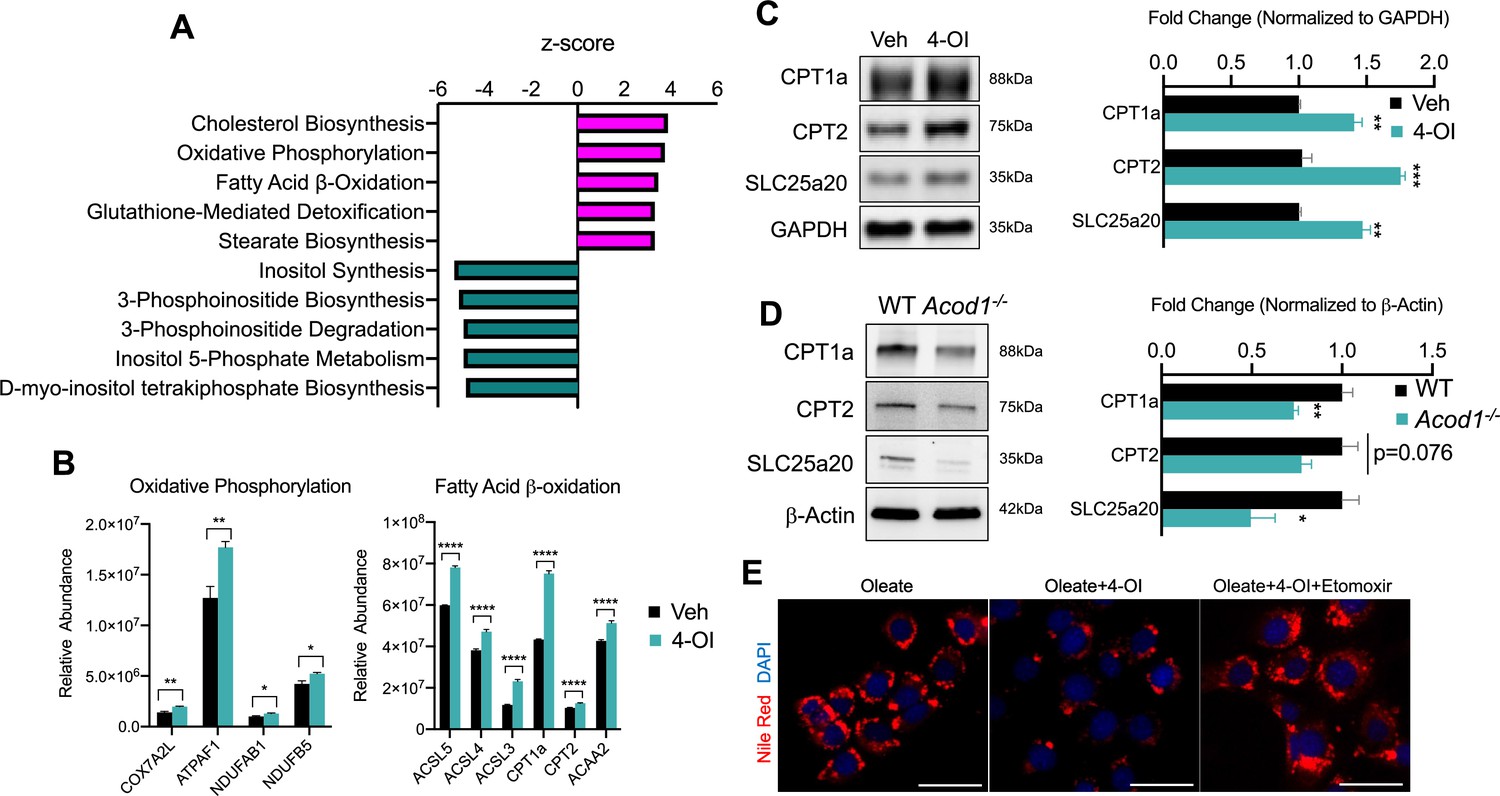
4-octyl itaconate (4-OI) promotes mitochondrial fatty acid uptake and clearance.
(A) Pathway analysis of significantly altered proteins from global proteomics of AML12 cells stimulated with 4-OI for 24 hr. n=5 biological replicates per group. (B) Quantification of CPT1a/CPT2 in proteomics analysis. (C) Western blot of CPT1a, CPT2, and SLC25a20 in AML12 stimulated with 4-OI for 24 hr. Quantification on the right. n=4 independent experiments. (D) Western blot of liver lysates of female LPS injected wild-type (WT) and aconitase decarboxylase 1 (Acod1) KO mice. Quantification on the right. n=5 mice per group. (E) Nile Red images of lipid-loaded hepatocytes treated with 4-OI (250 µM) ± etomoxir (4 µM). n=3 independent experiments. *p<0.05, **p<0.01, ***p<0.001. Scale bars are 50 μm.
-
Figure 2—source data 1
Source file for Western blot 2c.
- https://cdn.elifesciences.org/articles/92420/elife-92420-fig2-data1-v1.pdf
-
Figure 2—source data 2
Source file for Western blot 2d.
- https://cdn.elifesciences.org/articles/92420/elife-92420-fig2-data2-v1.pdf
Figure 3
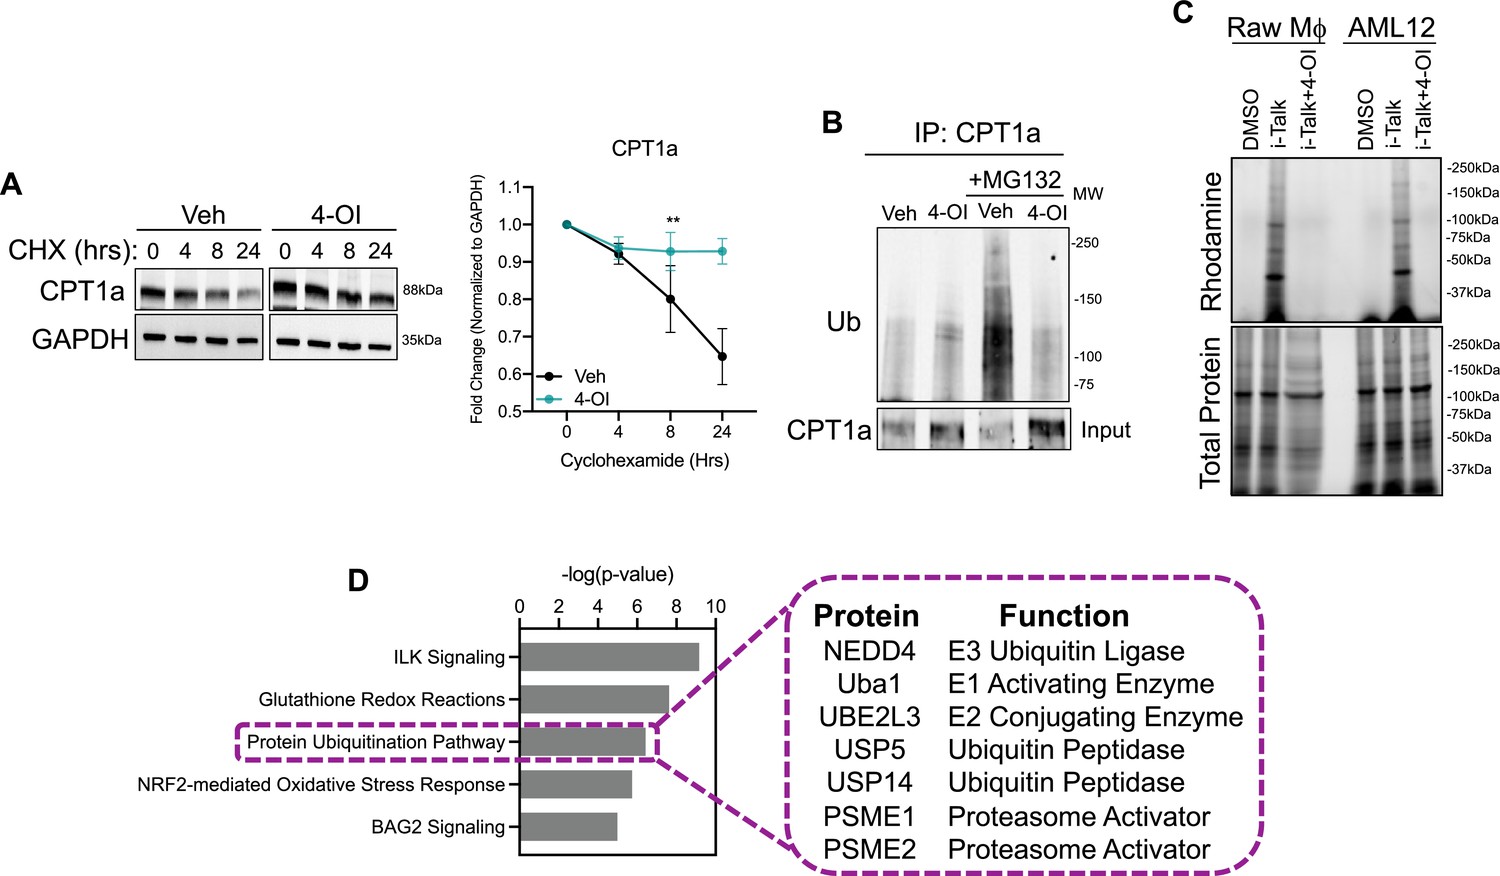
4-octyl itaconate (4-OI) stabilizes CPT1a protein expression.
(A) Western blot and quantification of CPT1a in AML12 cells that were pretreated with vehicle or 4-OI for 24 hr, then stimulated with cycloheximide (CHX). Quantification on the right. n=3 independent experiments. (B) Immunoprecipitation (IP) of CPT1a in AML12 cells pretreated with 4-OI for 24 hr followed by stimulation with MG132 for 6 hr. Equal amounts of proteins were IP’d with anti-CPT1a and subjected to Western blot analysis with ubiquitin antibody. 5% input below. n=3 independent experiments. (C) In-gel fluorescence of rhodamine in iTalk labeled Raw macrophages and AML12 hepatocytes. (D) Pathway analysis of global proteomics of iTalk-enriched proteins in AML12 cells stimulated with ITalk for 4 hr. **p<0.01.
-
Figure 3—source data 1
Source file for Western blot 3a.
- https://cdn.elifesciences.org/articles/92420/elife-92420-fig3-data1-v1.pdf
-
Figure 3—source data 2
Source file for Western blot 3b.
- https://cdn.elifesciences.org/articles/92420/elife-92420-fig3-data2-v1.pdf
Figure 4
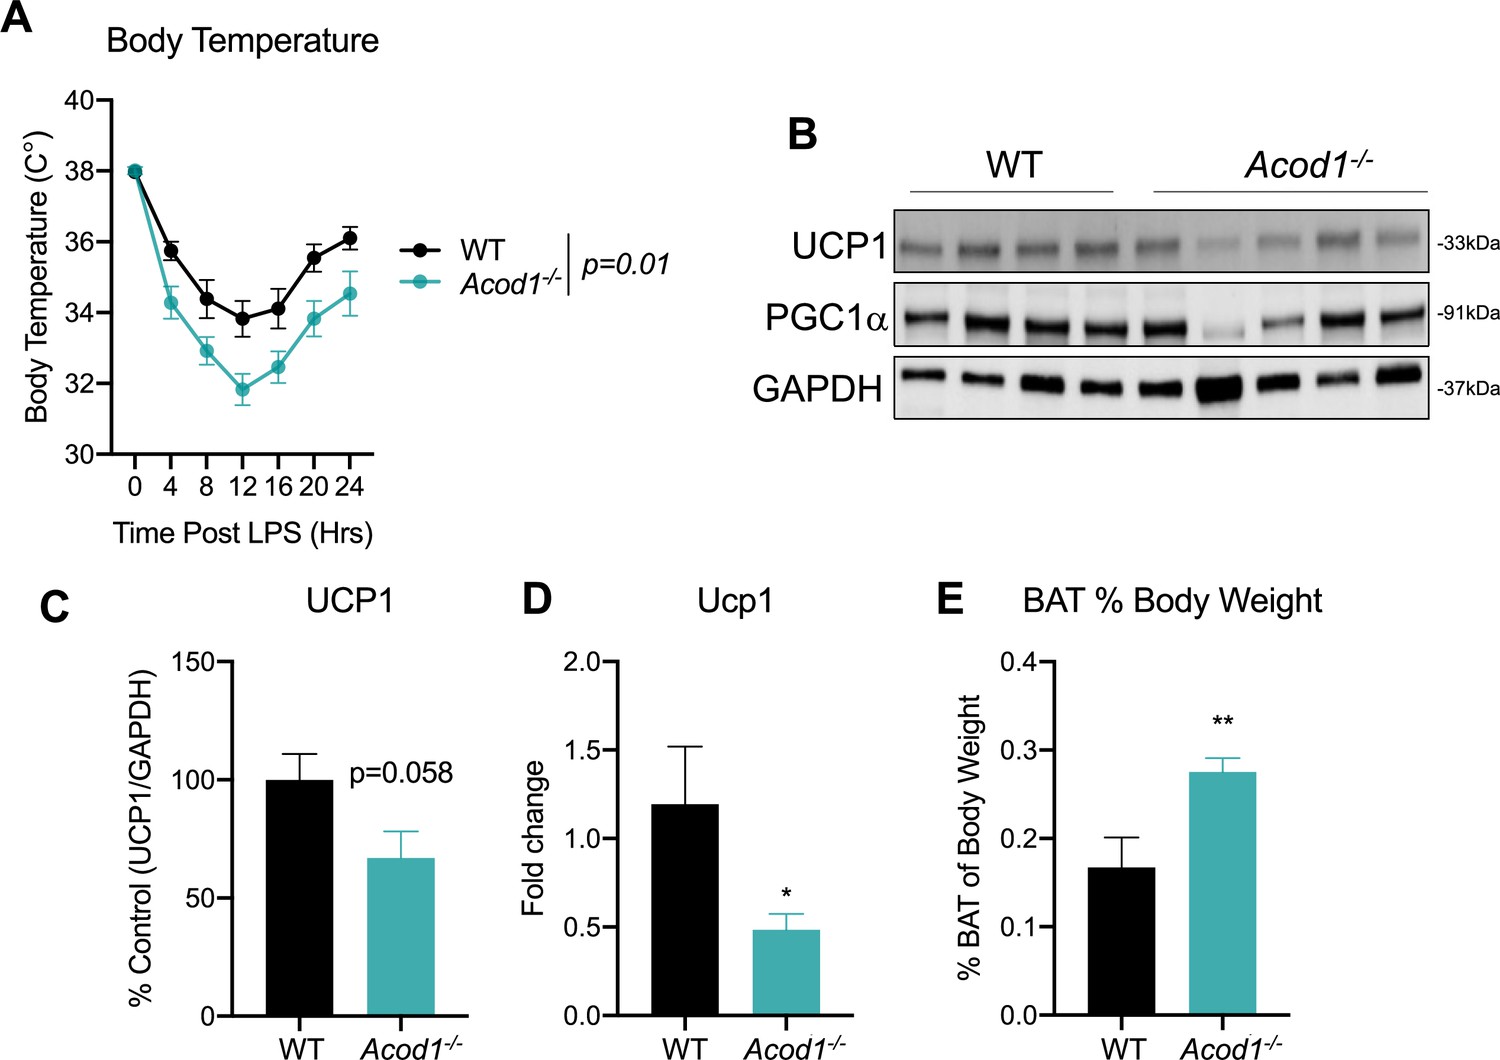
Aconitase decarboxylase 1 (Acod1) deficiency promotes hypothermia and brown adipose tissue (BAT) dysfunction during endotoxin challenge.
(A) Core body temperature in female wild-type (WT) and Acod1 KO mice following LPS injection (5 mg/kg). n=5–8 mice per group. (B) Western blot of UCP1, PGC-1α, and GAPDH in BAT of LPS injected WT and Acod1 KO mice. (C) Quantification of UCP1 protein normalized to GAPDH. n=5–8 mice per group. (D) qPCR of UCP1 in BAT of LPS injected WT and Acod1 KO mice. n=5–8 mice per group. (E) BAT weight 24 hr post-LPS injection in WT and Acod1 KO mice. n=5–8 mice per group. *p<0.05, **p<0.01.
-
Figure 4—source data 1
Source file for Western blot 4b.
- https://cdn.elifesciences.org/articles/92420/elife-92420-fig4-data1-v1.pdf
Figure 5
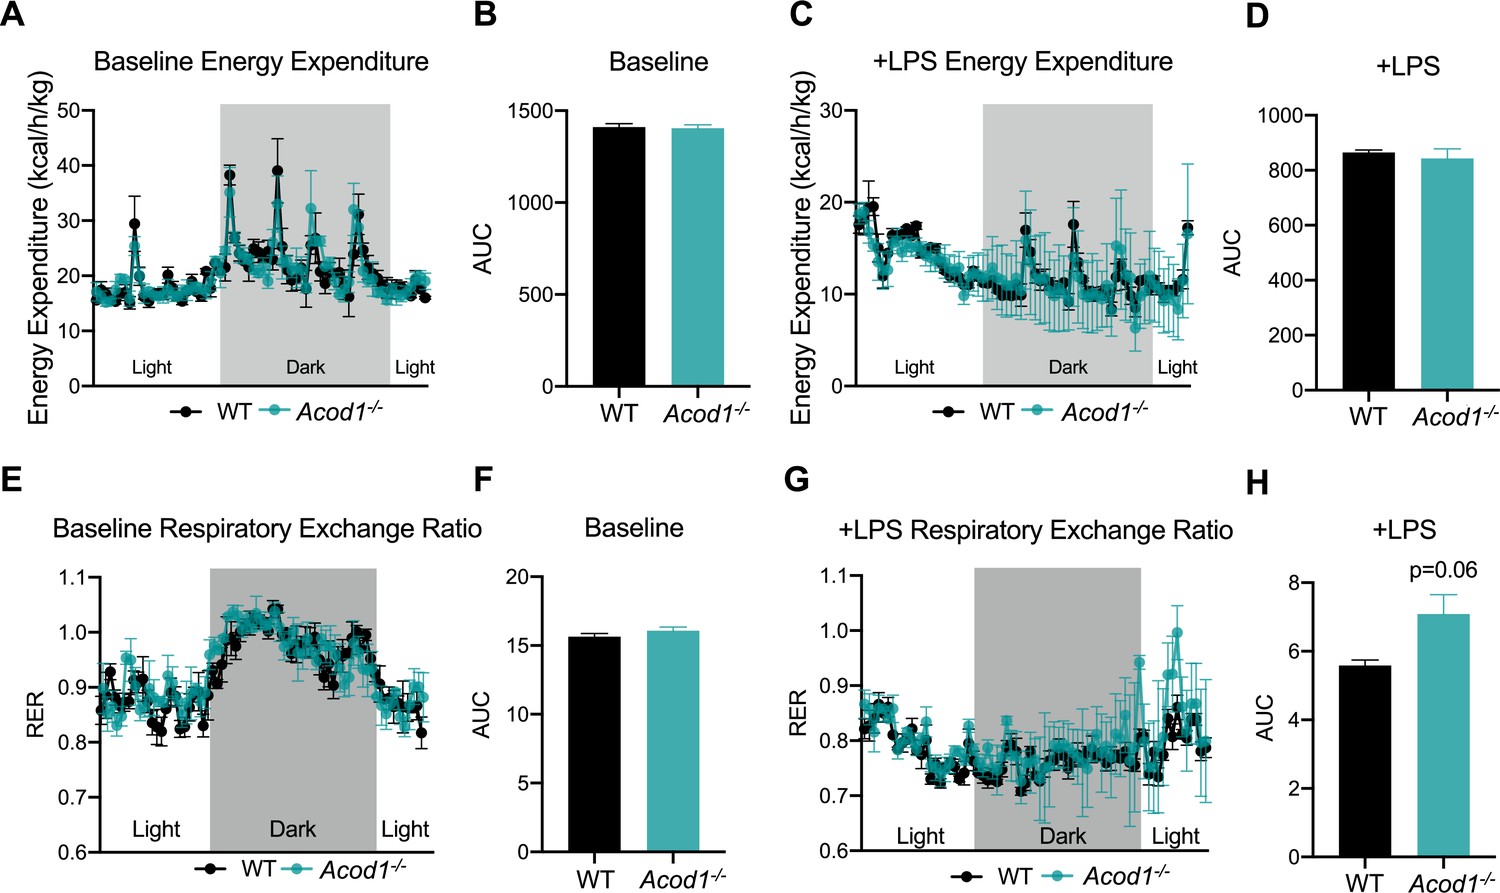
Aconitase decarboxylase 1 (Acod1) deficiency impairs systemic substrate utilization during sepsis.
(A) Energy Expenditure (kcal/hr/kg) during baseline and (C) post-LPS injection in female Acod1 KO and wild-type (WT) controls. Plots represent 24 hr cycle. n=3 mice per group. (B, D) Area under the curve for energy expenditure values over 24 hr cycle from panel B and D. (E) Respiratory exchange ratio (RER) during baseline and (G) post-LPS injection in female Acod1 KO and WT littermate controls. Plots represent 24 hr cycle. n=3 mice per group. (F, H) Area under the curve for RER values over 24 hr cycle from panel F and H. Statistical significance was calculated using an unpaired two-tailed Student’s t-test.
Additional files
Download links
A two-part list of links to download the article, or parts of the article, in various formats.
Downloads (link to download the article as PDF)
Open citations (links to open the citations from this article in various online reference manager services)
Cite this article (links to download the citations from this article in formats compatible with various reference manager tools)
Itaconate stabilizes CPT1a to enhance lipid utilization during inflammation
eLife 12:RP92420.
https://doi.org/10.7554/eLife.92420.2


