Single-cell RNA sequencing unveils the hidden powers of zebrafish kidney for generating both hematopoiesis and adaptive antiviral immunity
- College of Life Sciences, Key Laboratory for Cell and Gene Engineering of Zhejiang Province, Zhejiang University, China
- Bone Marrow Transplantation Center, the First Affiliated Hospital, Zhejiang University School of Medicine, China
- Department of Genetic and Metabolic Disease, The Children's Hospital, Zhejiang University School of Medicine, National Clinical Research Center for Child Health, China
- Laboratory for Marine Biology and Biotechnology, Qingdao National Laboratory for Marine Science and Technology, China
Figures
Figure 1 with 2 supplements
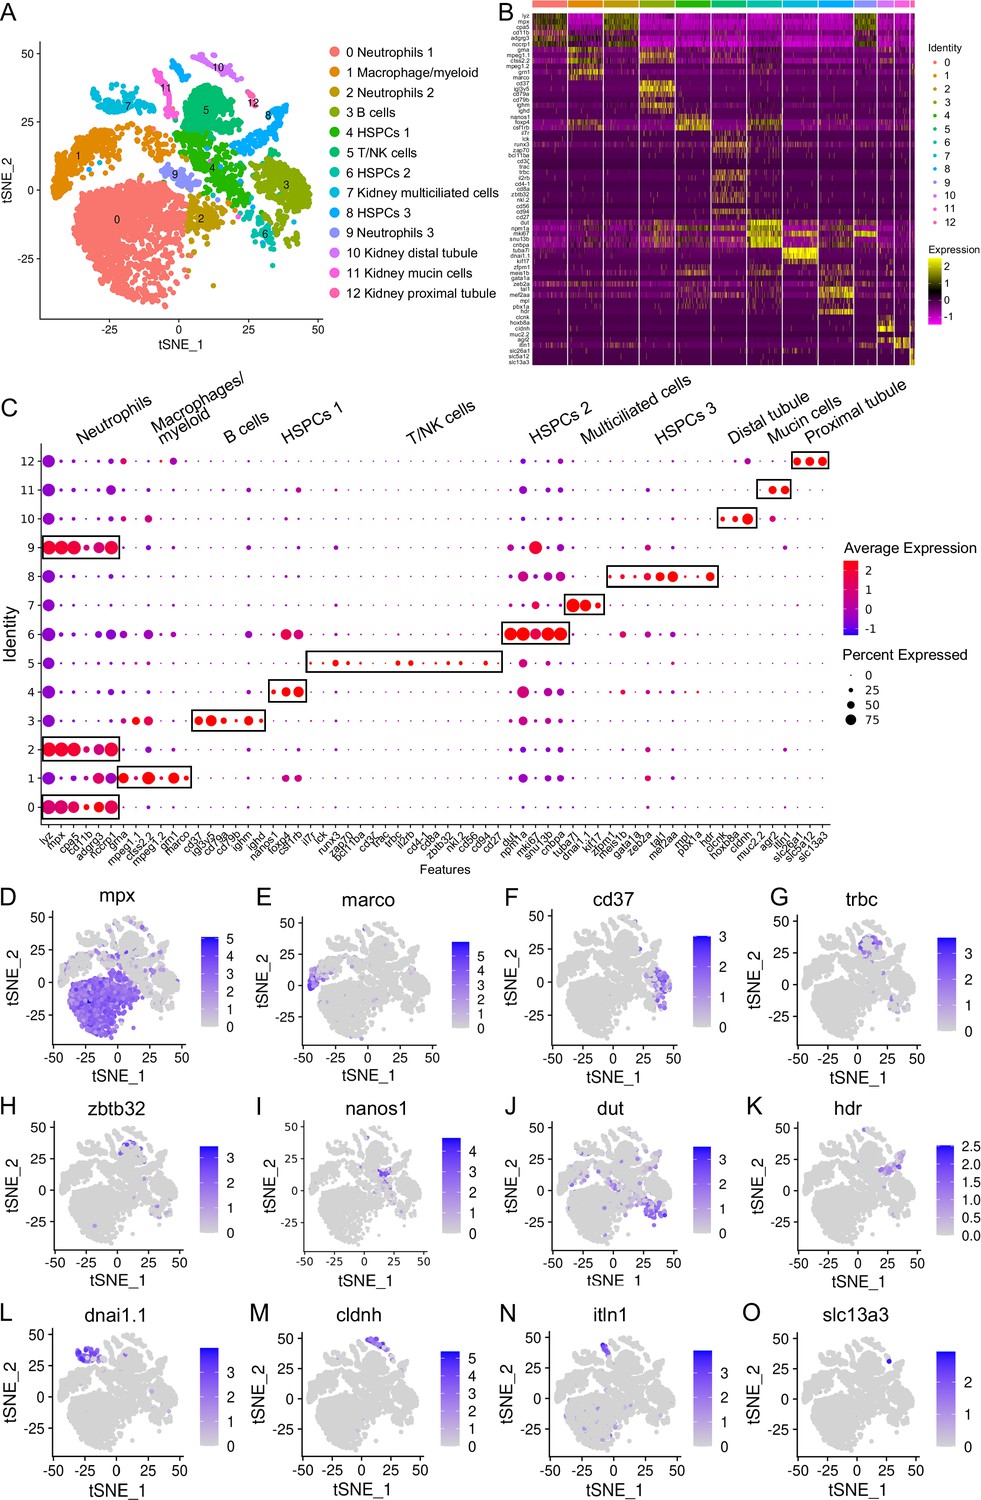
Categorization of the hematopoietic stem/progenitor cells (HSPCs) and immune cell types in zebrafish kidney.
(A) Nonlinear t-SNE clustering visually categorized populations of zebrafish kidney leukocytes. Principal component analysis (PCA) was performed following expression data normalization, with subsequent PCA dimension reduction to streamline variables. The cell clustering algorithm based on graph theory was then employed. (B) Heatmap displaying marker genes specific to each cluster. Columns depict distinct cell subtypes, while rows correspond to genes. Expression levels are color-coded, with intense yellow indicating high expression and deep purple representing low expression. (C) Dot plots illustrating marker gene expression levels and the respective percentages of cluster-expressing cells. (D–O) t-SNE results depicting molecular marker distribution for immune and kidney cell types. Each dot signifies a cell, with dark dots indicating elevated expression of the marker gene in a given cell. Notably, Neutrophil marker gene in (D), Macrophage/myeloid cells marker gene in (E), B-cells marker gene in (F), T-cells marker gene in (G), NK-cells marker gene in (H), HSPCs 1 marker gene in (I), HSPCs 2 marker gene in (J), HSPCs 3 marker gene in (K), kidney multiciliated cells marker gene in (L), kidney distal tubule cells marker gene in (M), kidney mucin cells marker gene in (N), and kidney proximal tubule cells marker genes in (O).
Figure 1—figure supplement 1
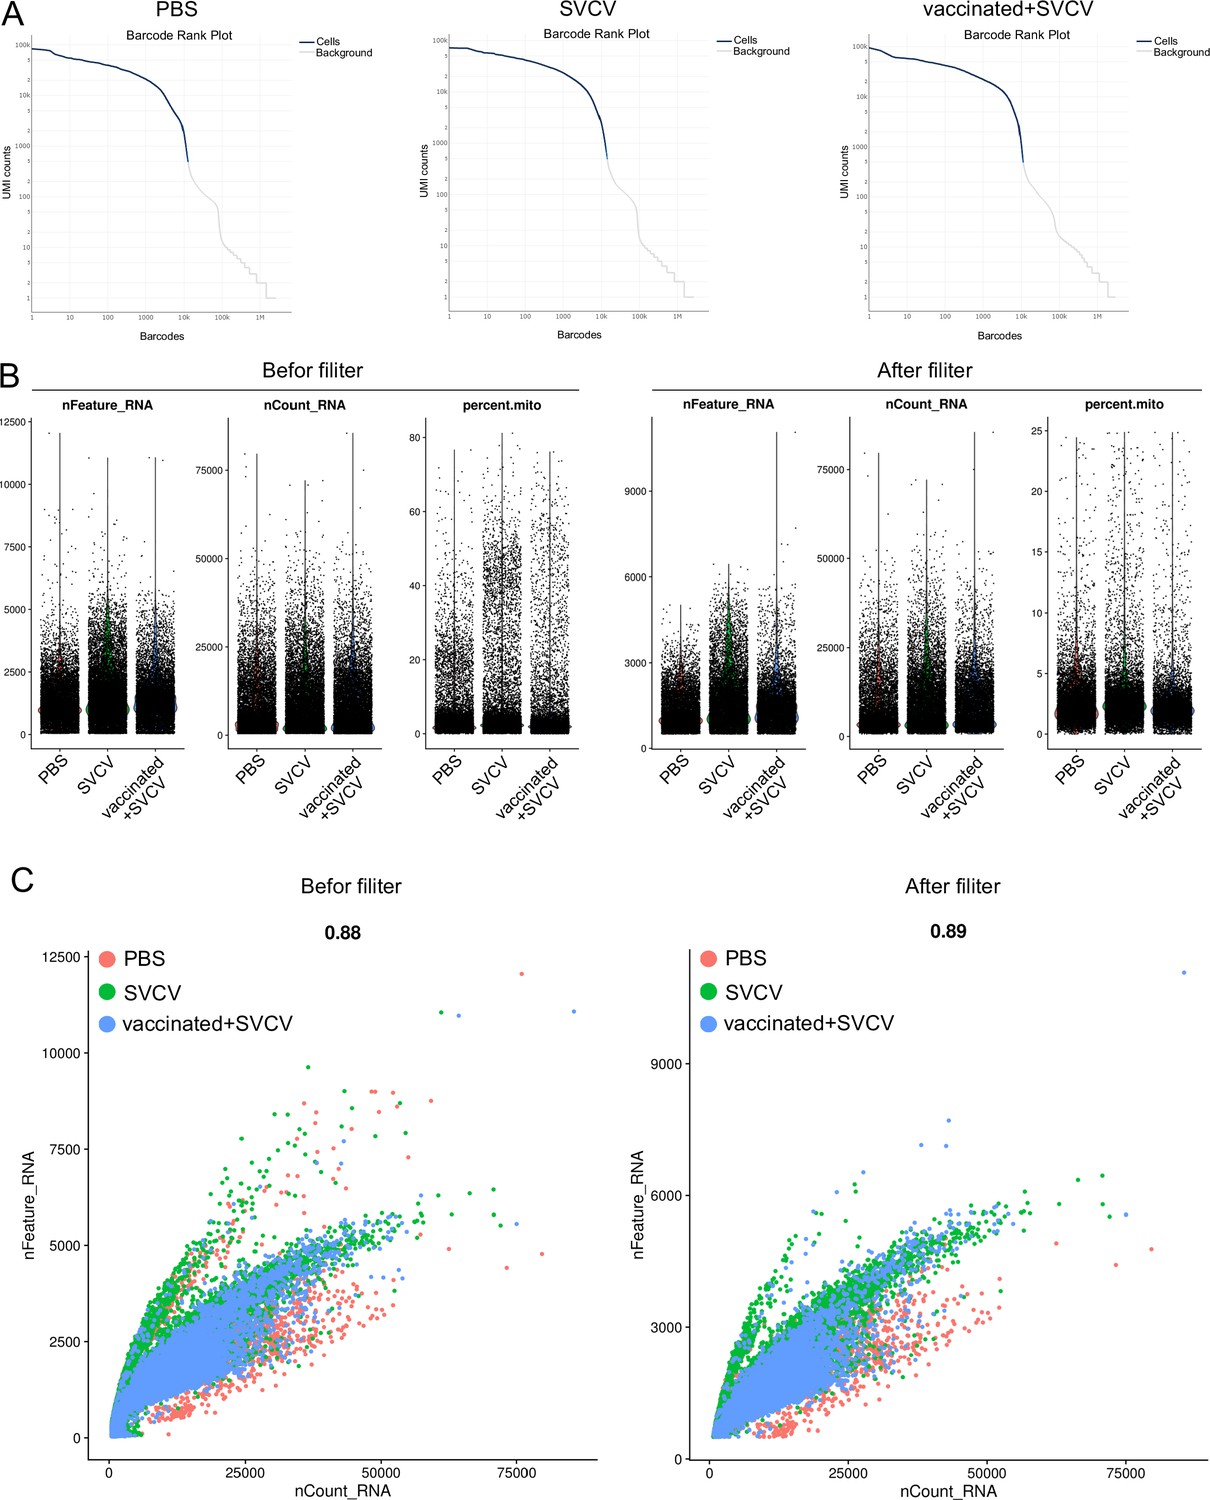
Single-cell sequencing quality control.
(A) Identification of the effective cell number of the sample. The x-axis is the number of barcodes, and the y-axis is the UMI counts. Blue line is the effective cells corresponding to barcodes, and the gray line is the background noise. (B) The basic information of sample cell before and after filtering, including the total number of genes (nFeature_RNA), the total number of UMIs (nCount_RNA), and the percentage of reads mapping mitochondrial genes (Percent.mito). (C) The scatter plot of sample cell basic information before and after filtering, shows the relationship between nCount_RNA and nFeature_RNA. The numbers above the graph are Pearson correlation coefficients.
Figure 1—figure supplement 2

Violin plots showing the expression of marker genes for per immune cell and renal cell categories at the single cell level.
(A) neutrophil; (B) macrophage/myeloid cells; (C) B cells; (D) T cells; (E) Kidney multiciliated cells; (F) Kidney distal tubule cells; (G) Kidney mucin cells; (H) hematopoietic stem/progenitor cells (HSPCs) 3; (I) NK cells; (J) HSPCs 2; (K) Kidney proximal tubule cells; (L) HSPCs 1.
Figure 2
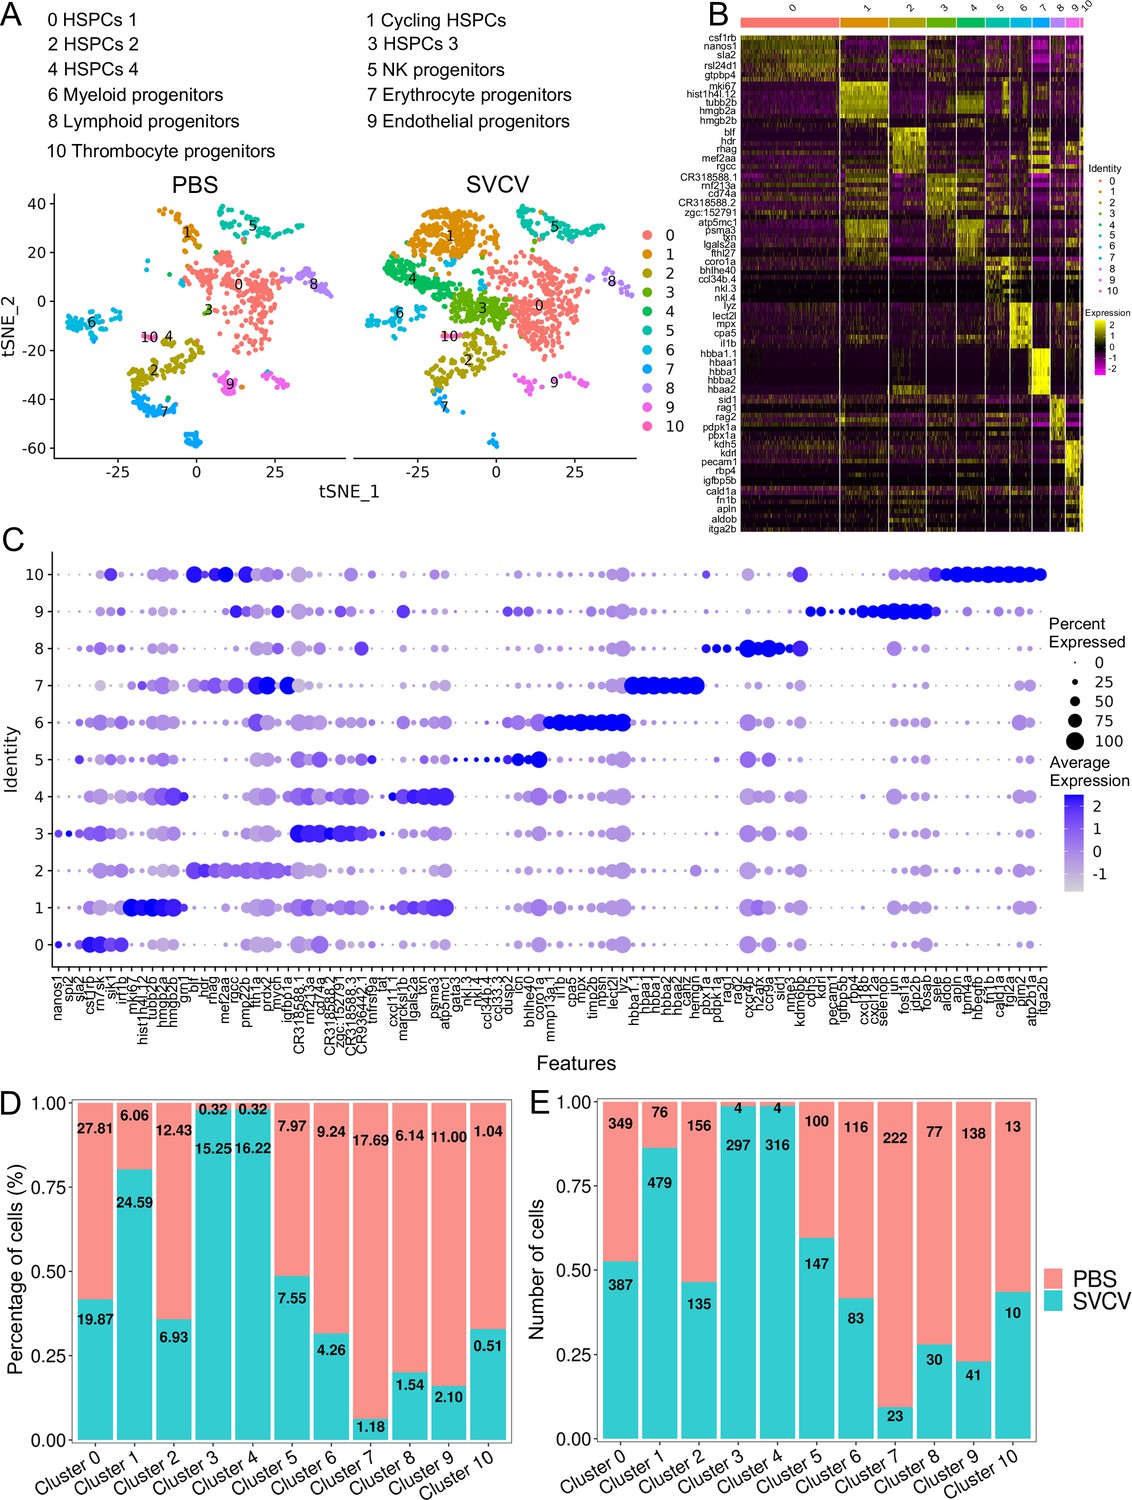
Hematopoietic stem/progenitor cells (HSPCs) subtype analysis based on single-cell gene expression.
(A) Graph-based clustering revealed 11 subclusters of HSPCs within both the control group (PBS) and the spring viremia of carp virus (SVCV)-infected group. (B) Heatmap presenting marker gene expression for each HSPC subcluster. (C) Dot plots of differentially expressed selected markers across HSPCs subtypes. Dot size indicates the percentage of cells within a population expressing a specific marker, while dot color indicates average expression. (D) Histogram demonstrating differences in HSPC subset ratios between the control group (PBS) and SVCV-infected group. (E) Histogram illustrating discrepancies in HSPC numbers across clusters between the control group and the SVCV-infected group.
Figure 3
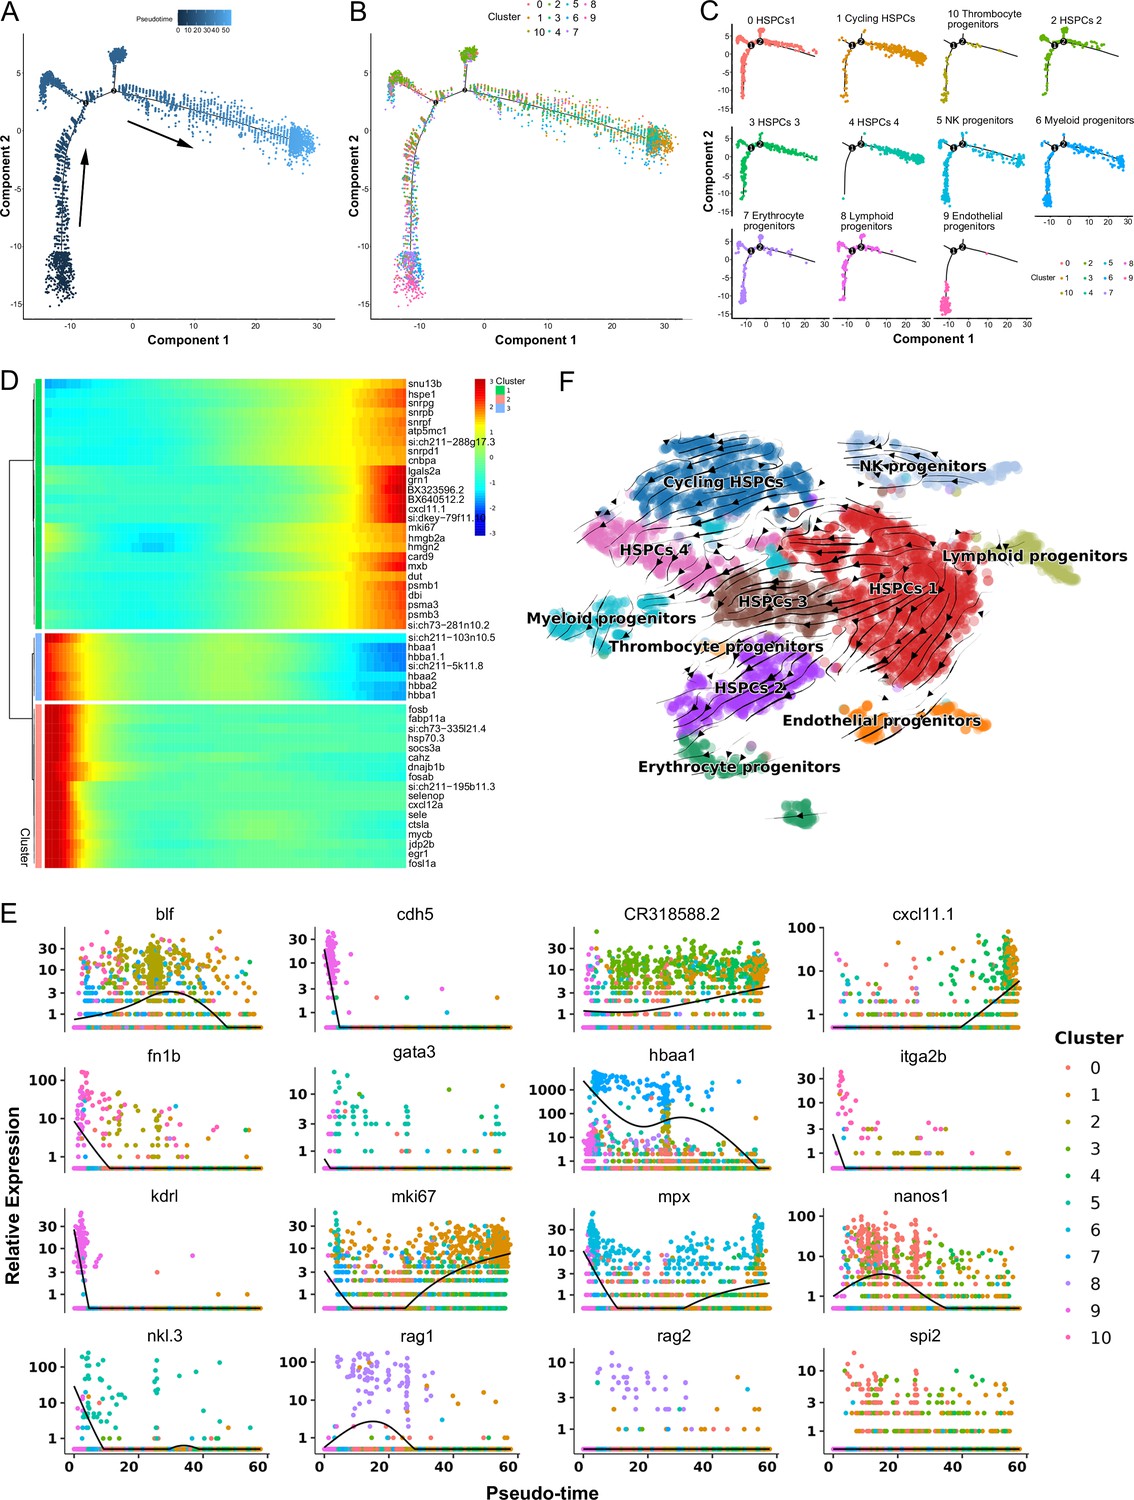
Pseudotemporal and RNA velocity analyses of zebrafish kidney hematopoietic stem/progenitor cells (HSPCs) development.
(A) Pseudotime single-cell trajectory of HSPCs reconstructed using Monocle2. Pseudotime is represented in a gradient from dark to light blue, with its starting point indicated. (B–C) Distribution of the 11 HSPC subsets within the trajectory. (D) Pseudotemporal heatmap demonstrating gene expression dynamics of significant marker genes. Genes (rows) were grouped into three modules, while cells (columns) were ordered according to pseudotime. (E) Gene expression dynamics over pseudotime computed in Monocle2, color-coded by cluster assignment for 16 genes linked to HSPCs development. (F) Single cell velocities of the HSPCs subclusters are visualized as streamlines in a t-distributed stochastic neighbor embedding (t-SNE) plot. Black arrows indicate direction and thickness indicates speed along the HSPCs development trajectory.
Figure 4
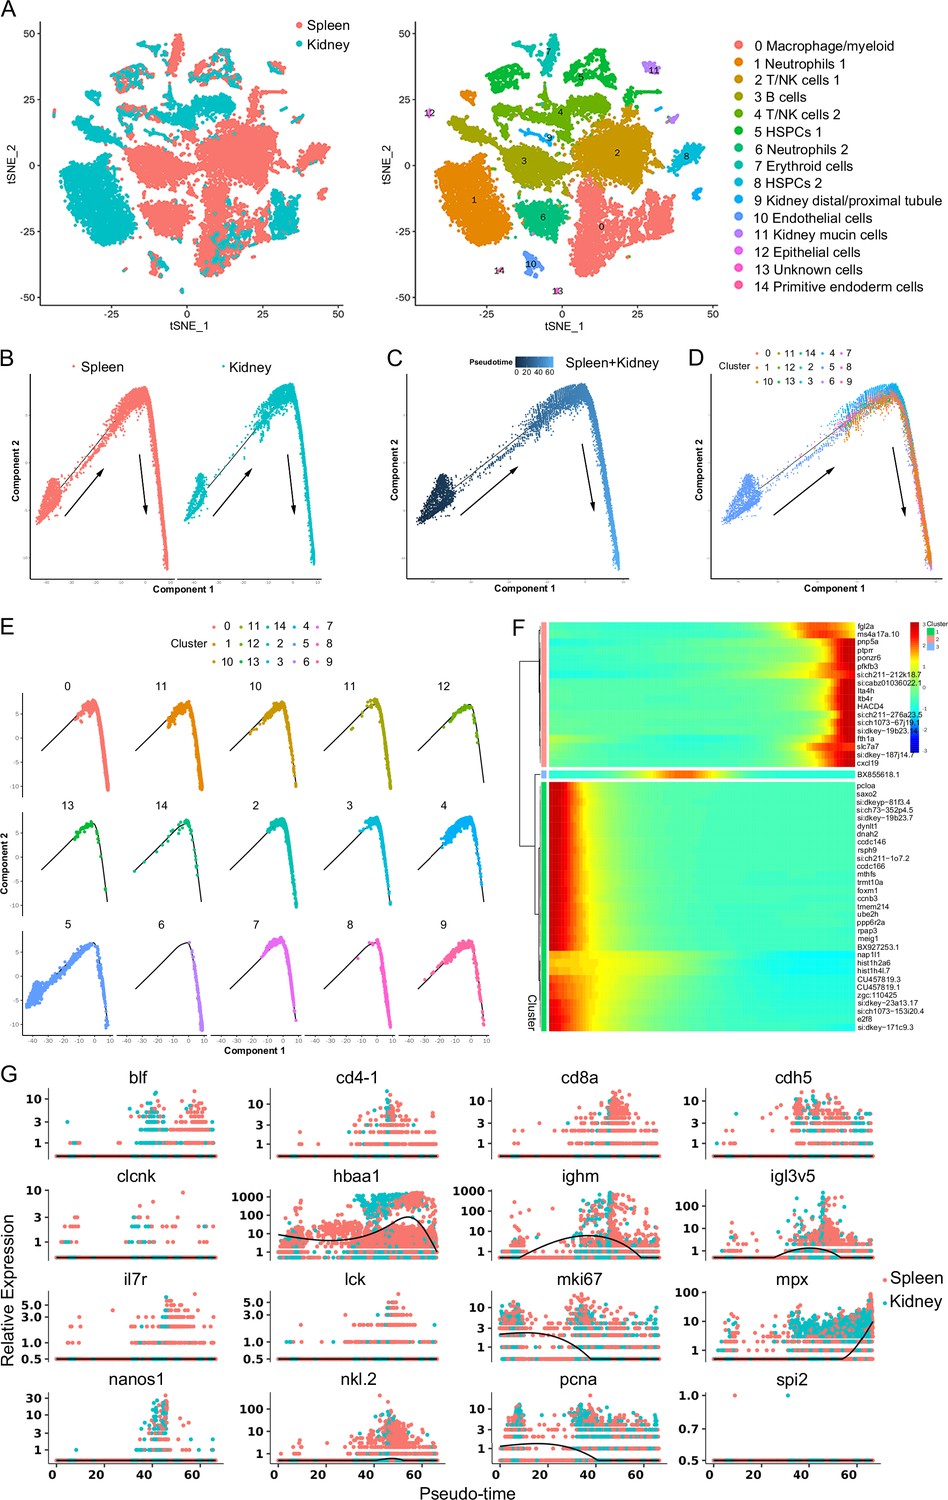
Integrated clustering and pseudotemporal analysis of zebrafish kidney and spleen hematopoietic stem/progenitor cells (HSPCs) and immune cells development.
(A) Nonlinear t-distributed stochastic neighbor embedding (t-SNE) clustering illustrated the divergence in classification outcomes of zebrafish leukocyte populations between the kidney and spleen. (B) Pseudotime single-cell trajectory of zebrafish kidney marrow and spleen immune cells reconstructed using Monocle2. (C) Pseudotime single-cell trajectories of HSPCs and immune cells, with pseudotime depicted in a gradient from dark to light blue, marking its inception. (D–E) Distribution of subsets within the trajectory. (F) Pseudotemporal heatmap revealing gene expression dynamics of significant marker genes. Genes (rows) were organized into three modules, while cells (columns) followed pseudotime order. (G) Gene expression dynamics over pseudotime computed in Monocle2, colored by cluster assignment for 16 genes associated with immune cell development.
Figure 5
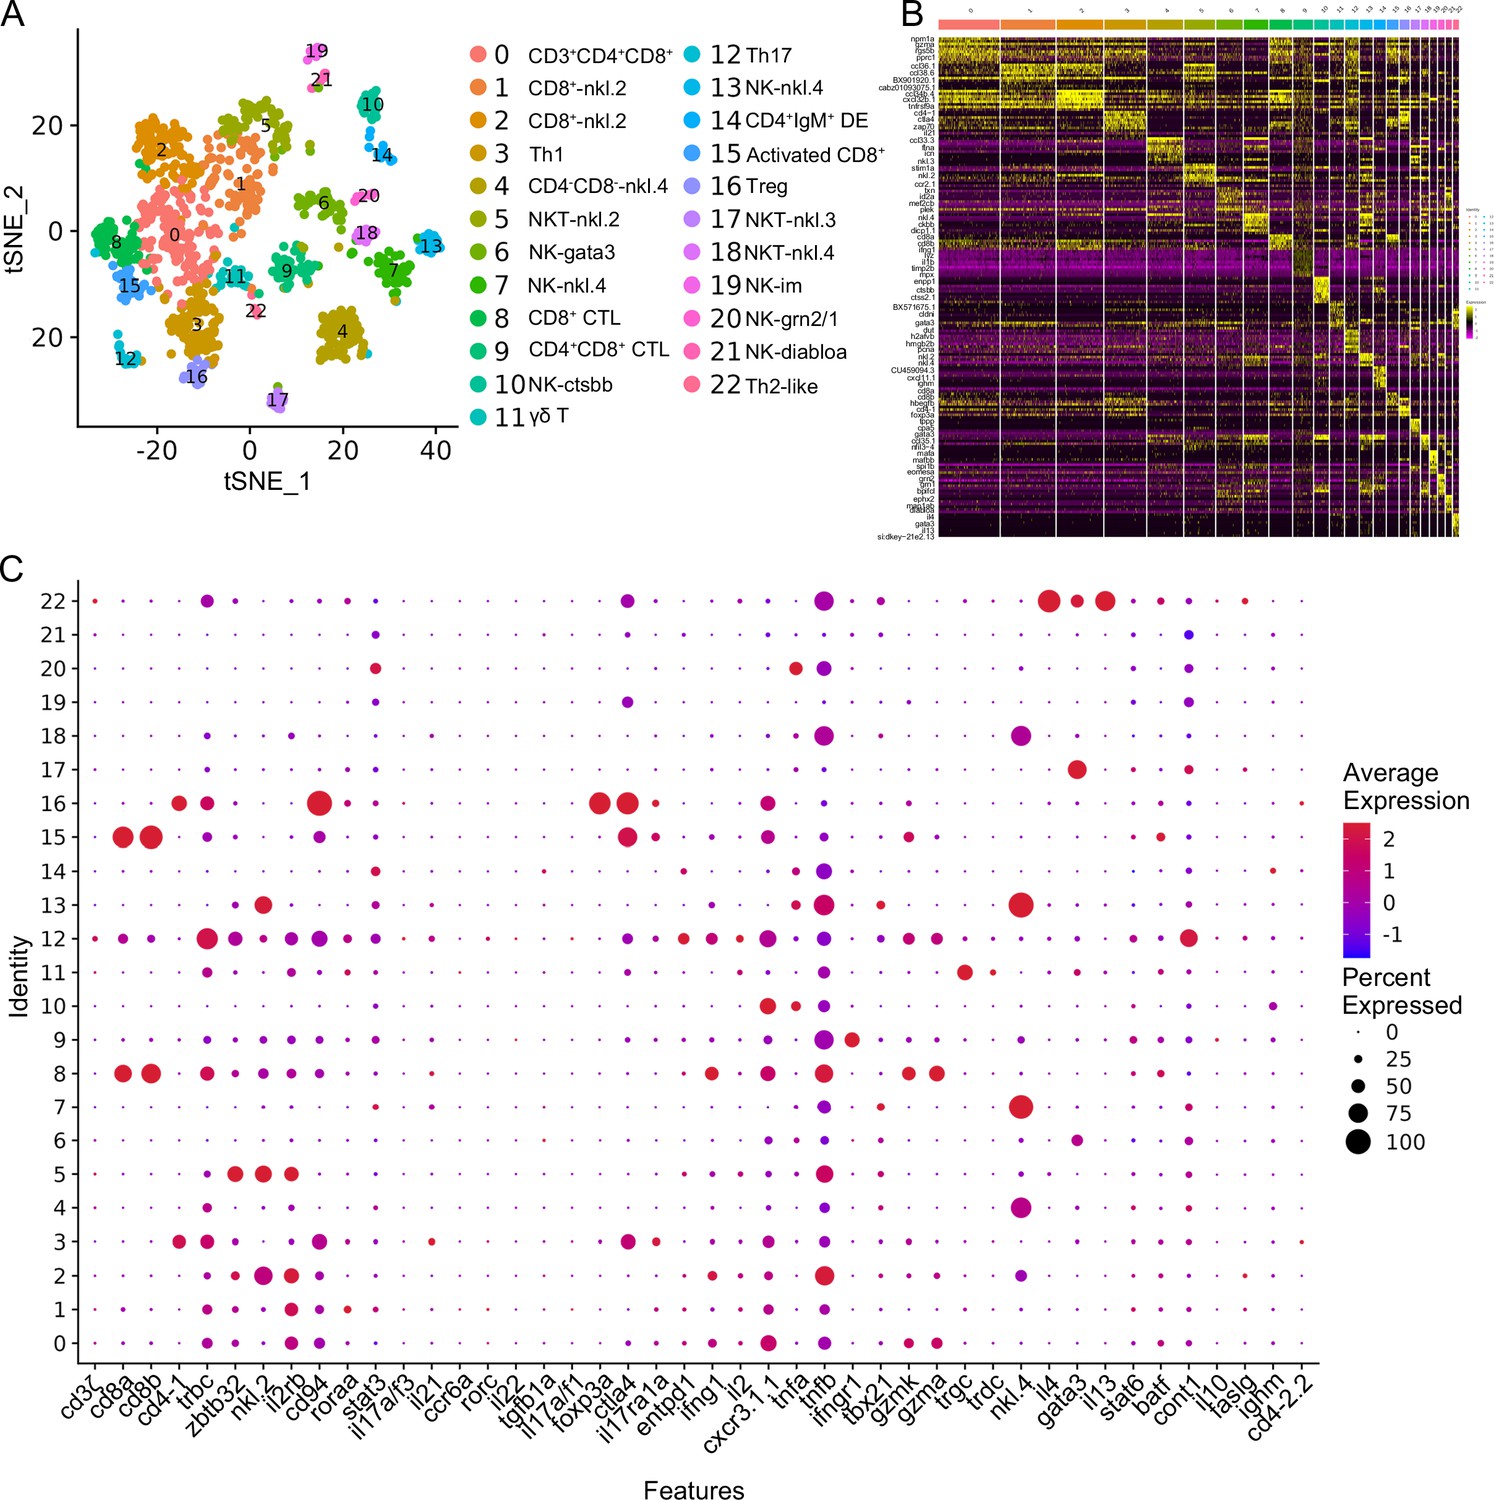
T/NK cell subtype analysis based on single-cell gene expression.
(A) Graph-based clustering unveiled 23T/NK cell subclusters within the control group. Nonlinear t-distributed stochastic neighbor embedding (t-SNE) clustering highlighted the differing classification outcomes of T/NK cell populations in zebrafish kidney. (B) Heatmap showcasing marker gene expression for each cluster. Columns represent cell subtypes, while rows depict genes, color-coded according to expression levels. (C) Dot plots demonstrating marker gene expression levels and the respective percentages of cells per cluster expressing the gene of interest.
Figure 6 with 2 supplements
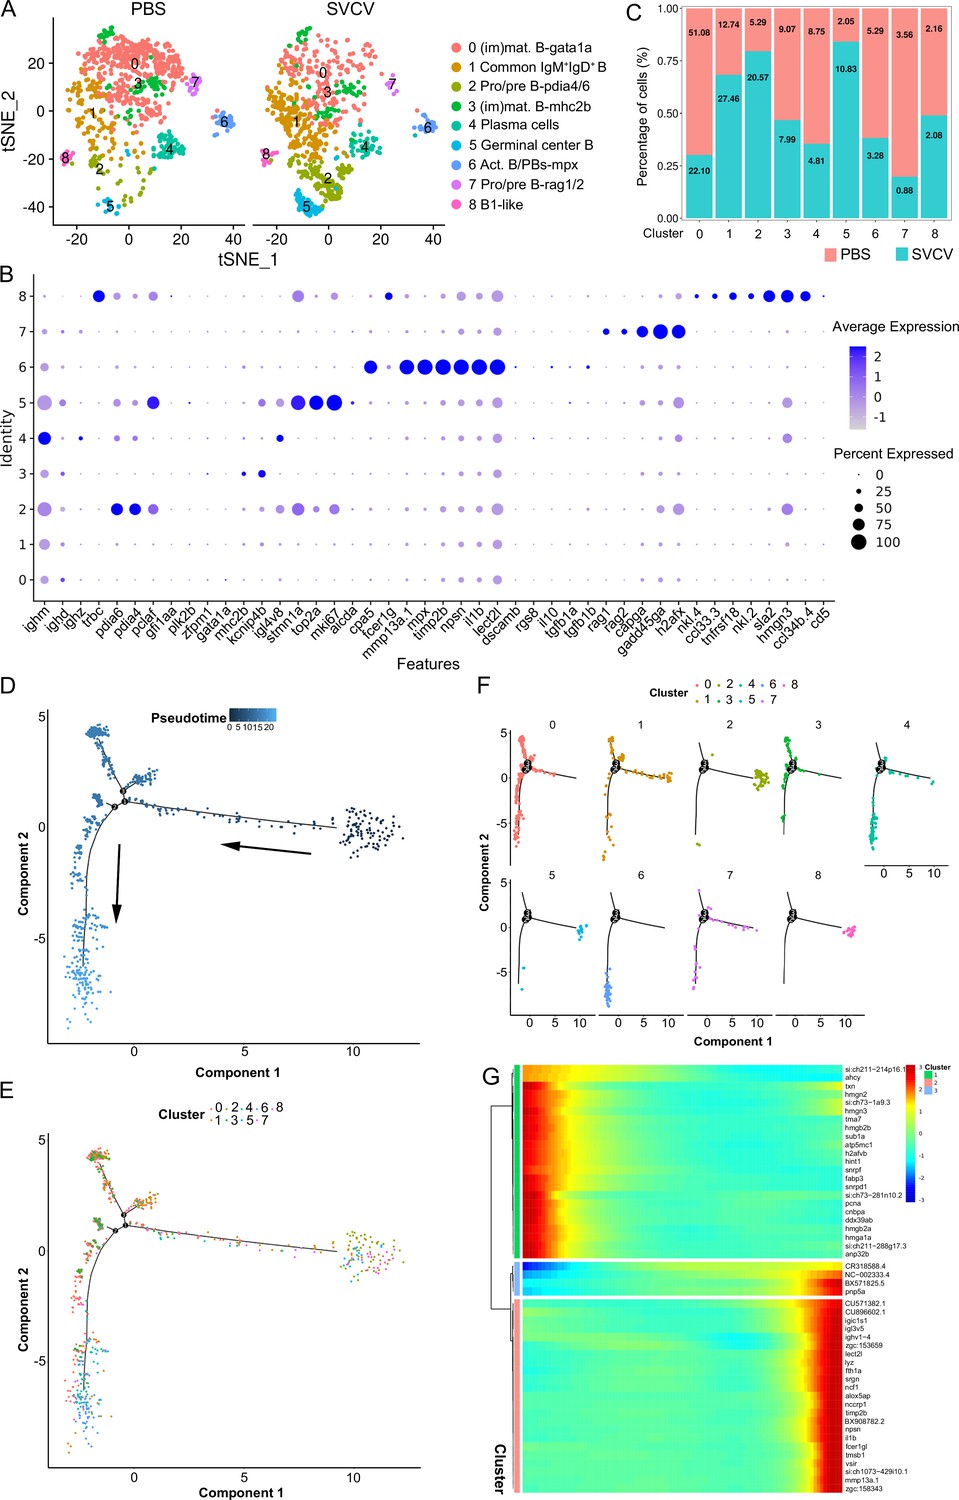
B-cell subtype and pseudotemporal analysis based on single-cell gene expression.
(A) Graph-based clustering disclosed nine B cell subclusters in both the control group (PBS) and spring viremia of carp virus (SVCV)-infected group. (B) Dot plots of differentially expressed selected markers across B cell subtypes. Dot size indicates the percentage of cells within a population expressing a specific marker, while dot color indicates average expression. (C) Histogram highlighting differences in cell ratios between the control group and the SVCV-infected group. (D) Pseudotime single-cell trajectory of B cells reconstructed using Monocle2, pseudotime shown in a gradient from dark to light blue, marking its starting point. (E–F) Distribution of the nine B cell subsets within the trajectory. (G) Pseudotemporal heatmap revealing gene expression dynamics of significant marker genes. Genes (rows) were grouped into three modules, while cells (columns) were ordered based on pseudotime.
Figure 6—figure supplement 1

Identification of B cell subtype clusters and the expression patterns of marker genes.
(A) Histogram presenting differences in cell numbers within each cluster between the control group and the spring viremia of carp virus (SVCV)-infected group. (B) The top 10 differently expressed genes (DEGs) for each cluster were shown in heatmap. (C) Top 20 most significant Kyoto Encyclopedia of Genes and Genomes (KEGG) pathways for the cluster 0 B-cell subset. (D) Heatmap of the differentially expressed genes for apoptosis, ferroptosis, necroptosis, and autophagy in the cluster 0 B-cell subset between the control group and the SVCV-infected group. (E) Gene expression dynamics over pseudotime computed in Monocle2, color-coded by cluster assignment for 16 genes linked to B cells development.
Figure 6—figure supplement 2
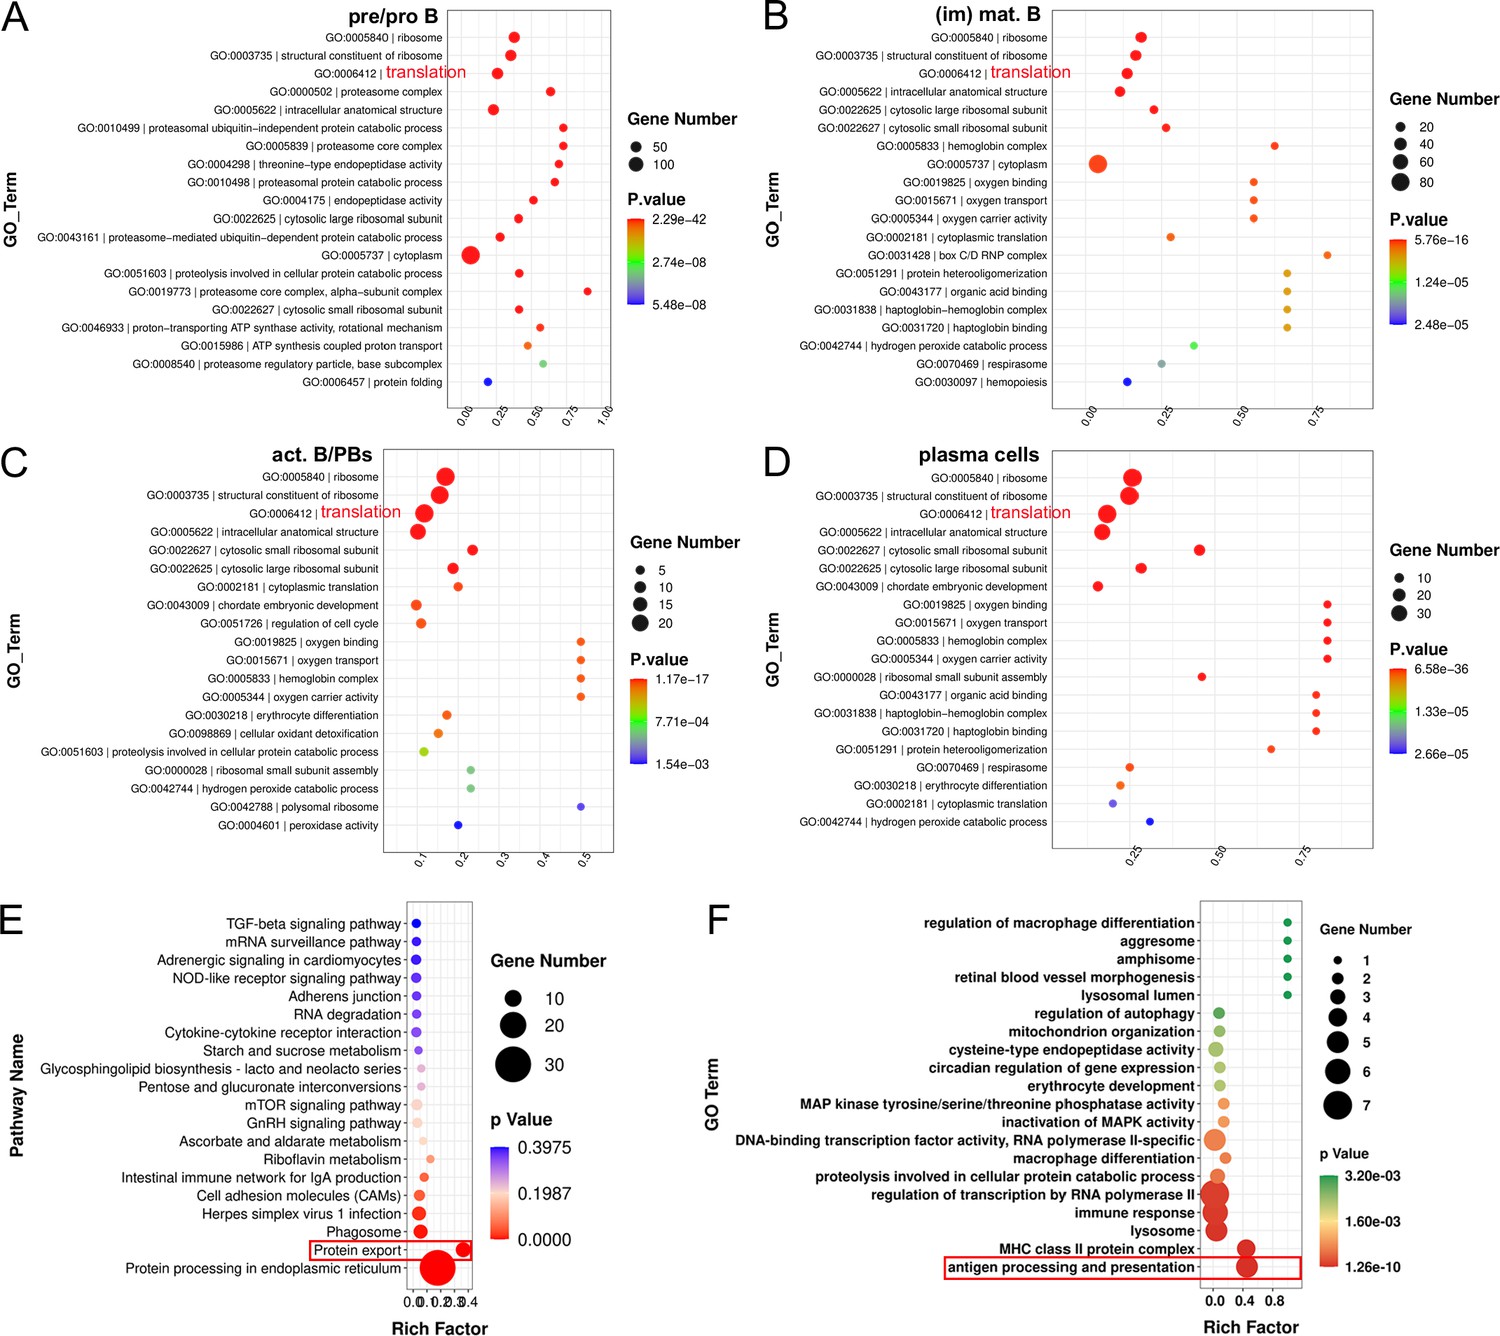
GO and Kyoto Encyclopedia of Genes and Genomes (KEGG) analysis of each cluster of B subset cells.
(A–D) The top 20 most significant Gene Ontology (GO) terms within the biological process (BP) category for pre/pro B, immature/mature B cells (im/mat. B), activated B cell and plasmablasts (act. B/PBs), and plasma cells (PCs). (E) Top 20 most significant KEGG pathways of plasma cells (Cluster 4). (F) Top 20 most significant GO terms of (im)mat. B cells (Cluster 3).
Figure 7
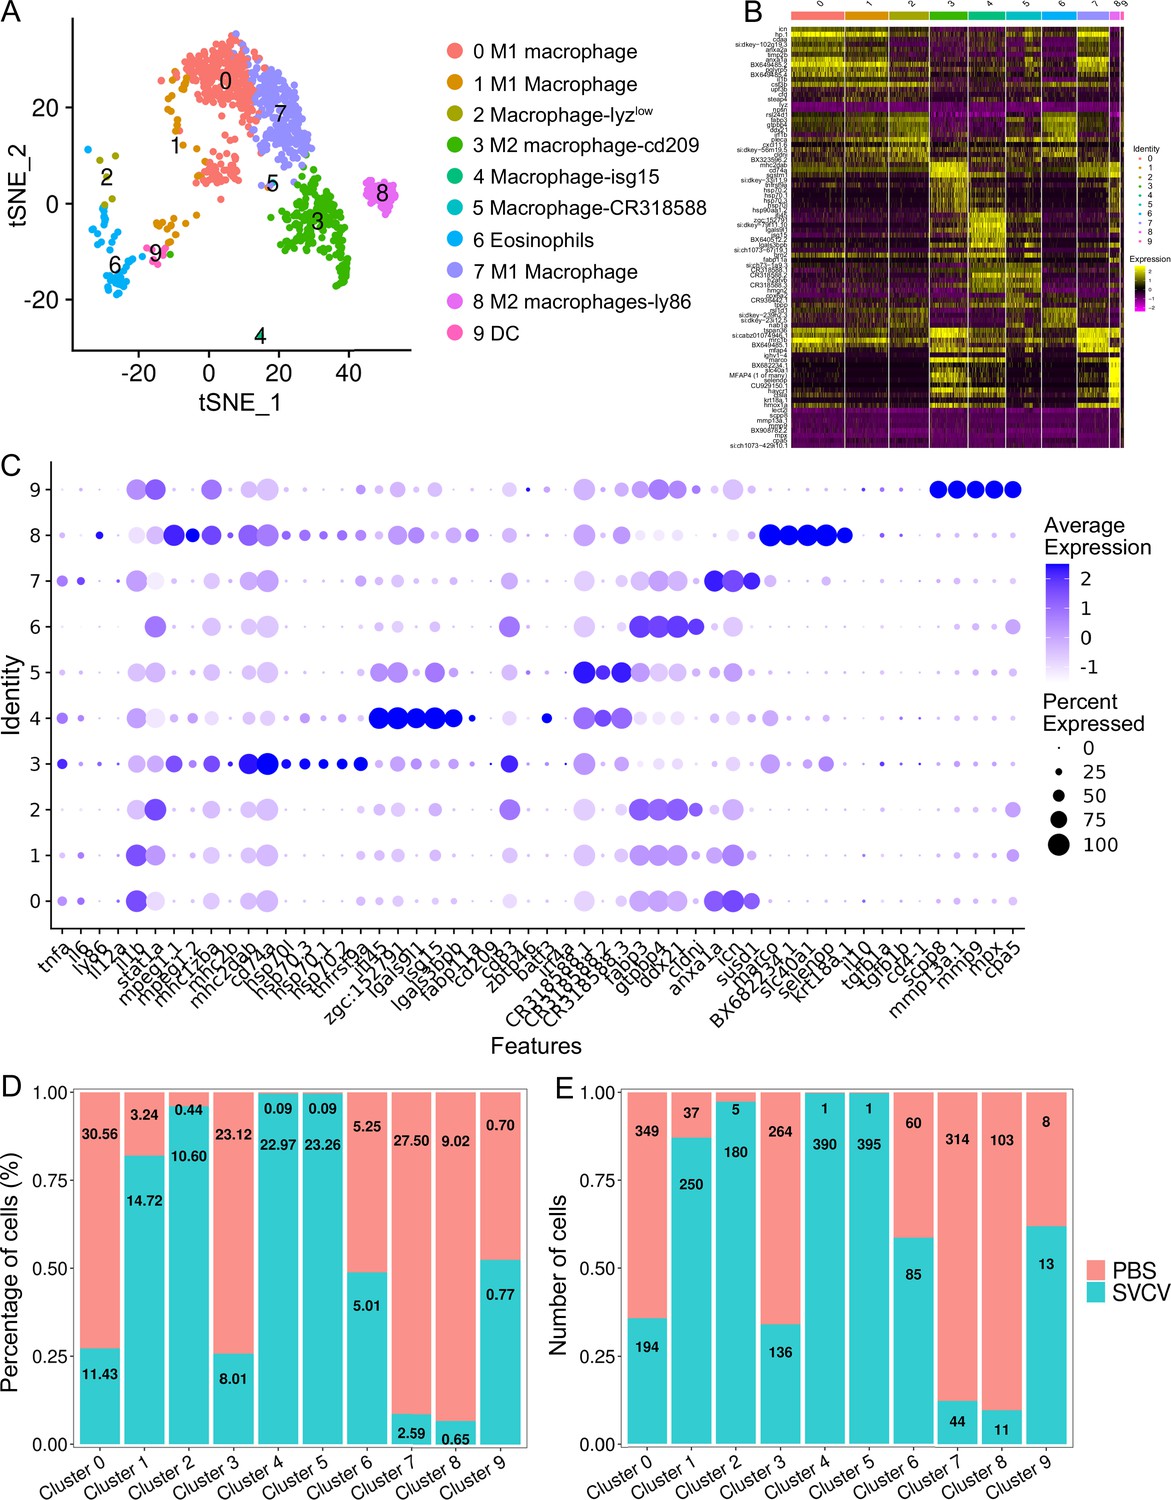
Identification of macrophage/myeloid cell subtypes.
(A) Graph-based clustering identified 10 macrophage/myeloid cell subclusters within the control group. (B) Heatmap displaying marker genes for each cluster. (C) Dot plots illustrating marker gene expression levels and the percentages of macrophages/myeloid cells per cluster expressing specific genes. (D) Histogram presenting variations in cell ratios between the control group and the spring viremia of carp virus (SVCV)-infected group. (E) Histogram illustrating differences in cell numbers within each cluster between the control group and the SVCV-infected group.
Figure 8 with 1 supplement
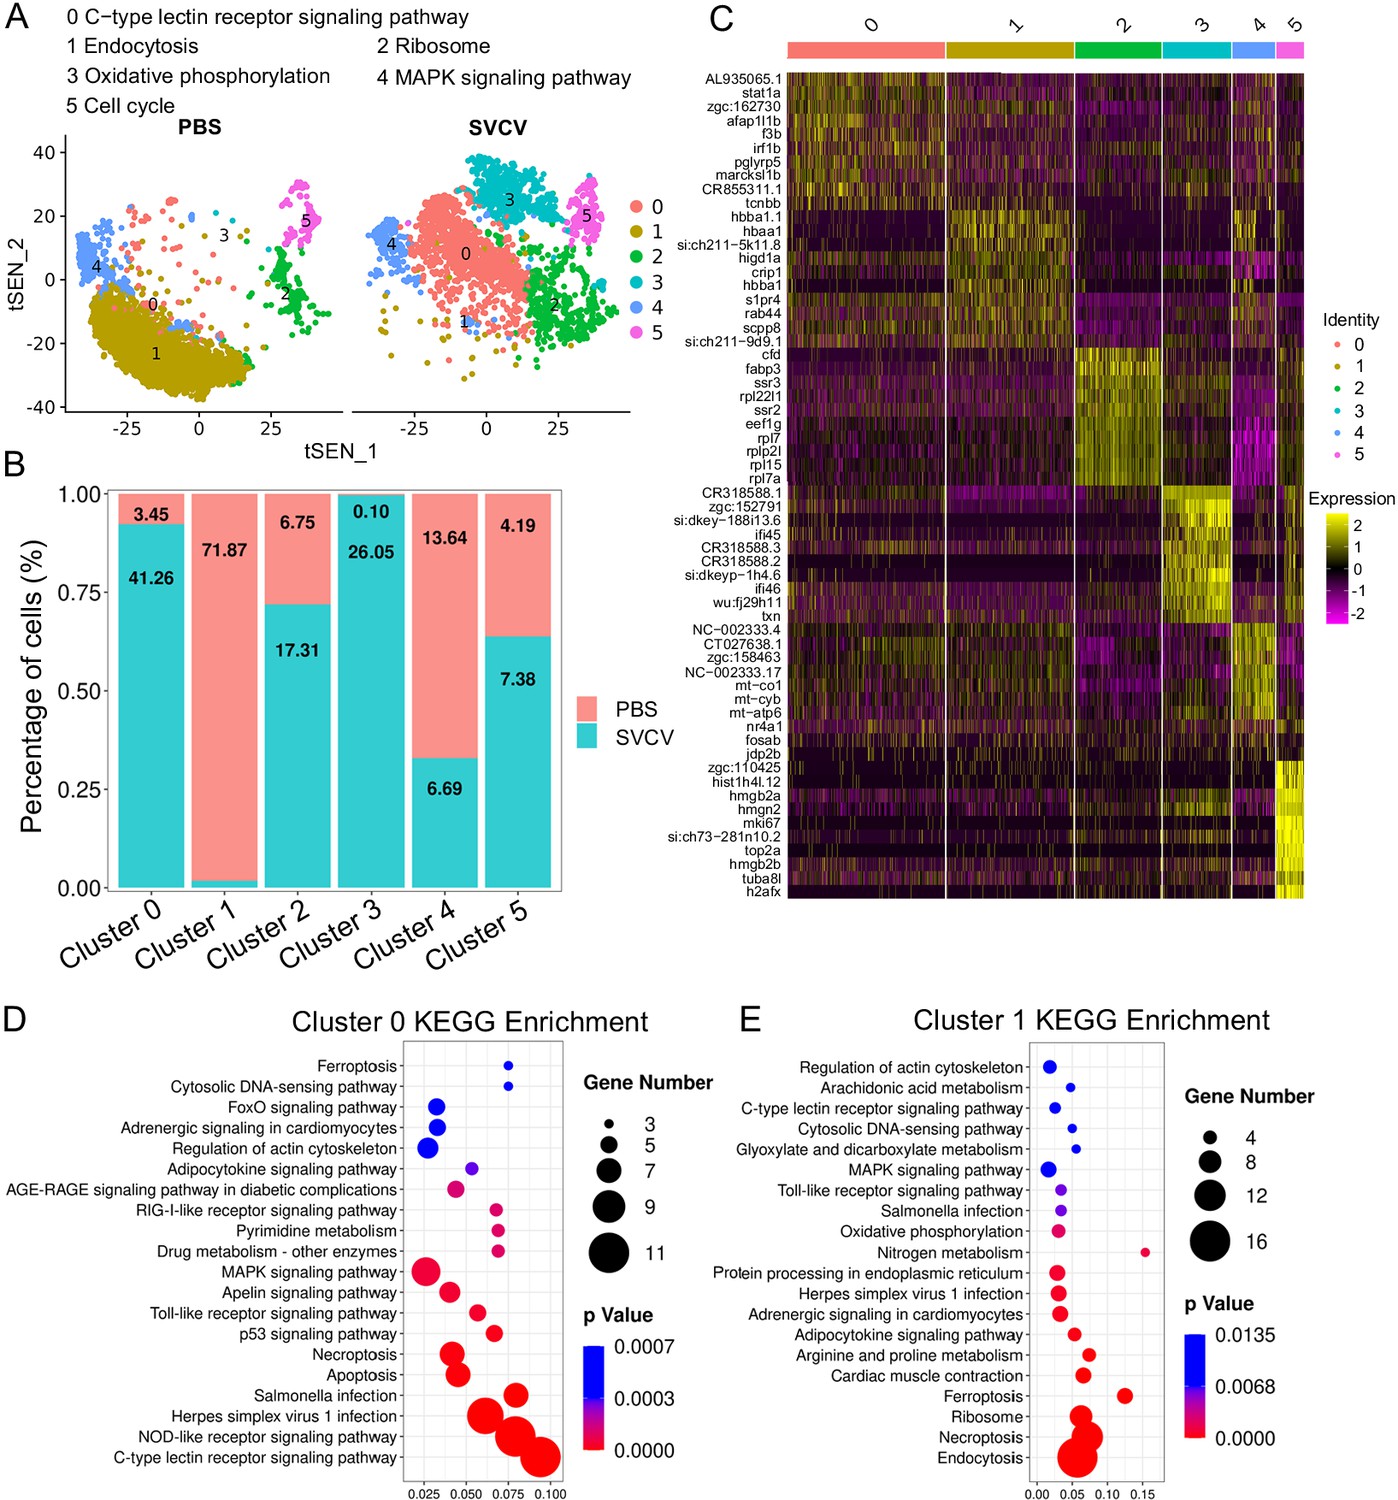
Neutrophil subtype analysis based on single-cell gene expression.
(A) Graph-based clustering of neutrophils revealed six subclusters within both the control group (PBS) and the spring viremia of carp virus (SVCV)-infected group. Increased and decreased neutrophil subtypes were significant in the SVCV-infected group, with numeric labels indicating cluster percentages. (B) Histogram depicting the differing neutrophil ratios between the control group and the SVCV-infected group. (C) Heatmap presenting marker gene expression for each cluster. (D) Kyoto Encyclopedia of Genes and Genomes (KEGG) analysis outcomes for cluster 0. RichFactor signifies the ratio of differentially expressed transcripts within the pathway entry to total transcripts located in the entry, indicating enrichment. Q value represents p-value post multiple hypothesis test correction, with a lower value indicating significant enrichment. The graph sorts the top 20 pathways based on ascending Q values. (E) KEGG analysis outcomes for cluster 1.
Figure 8—figure supplement 1
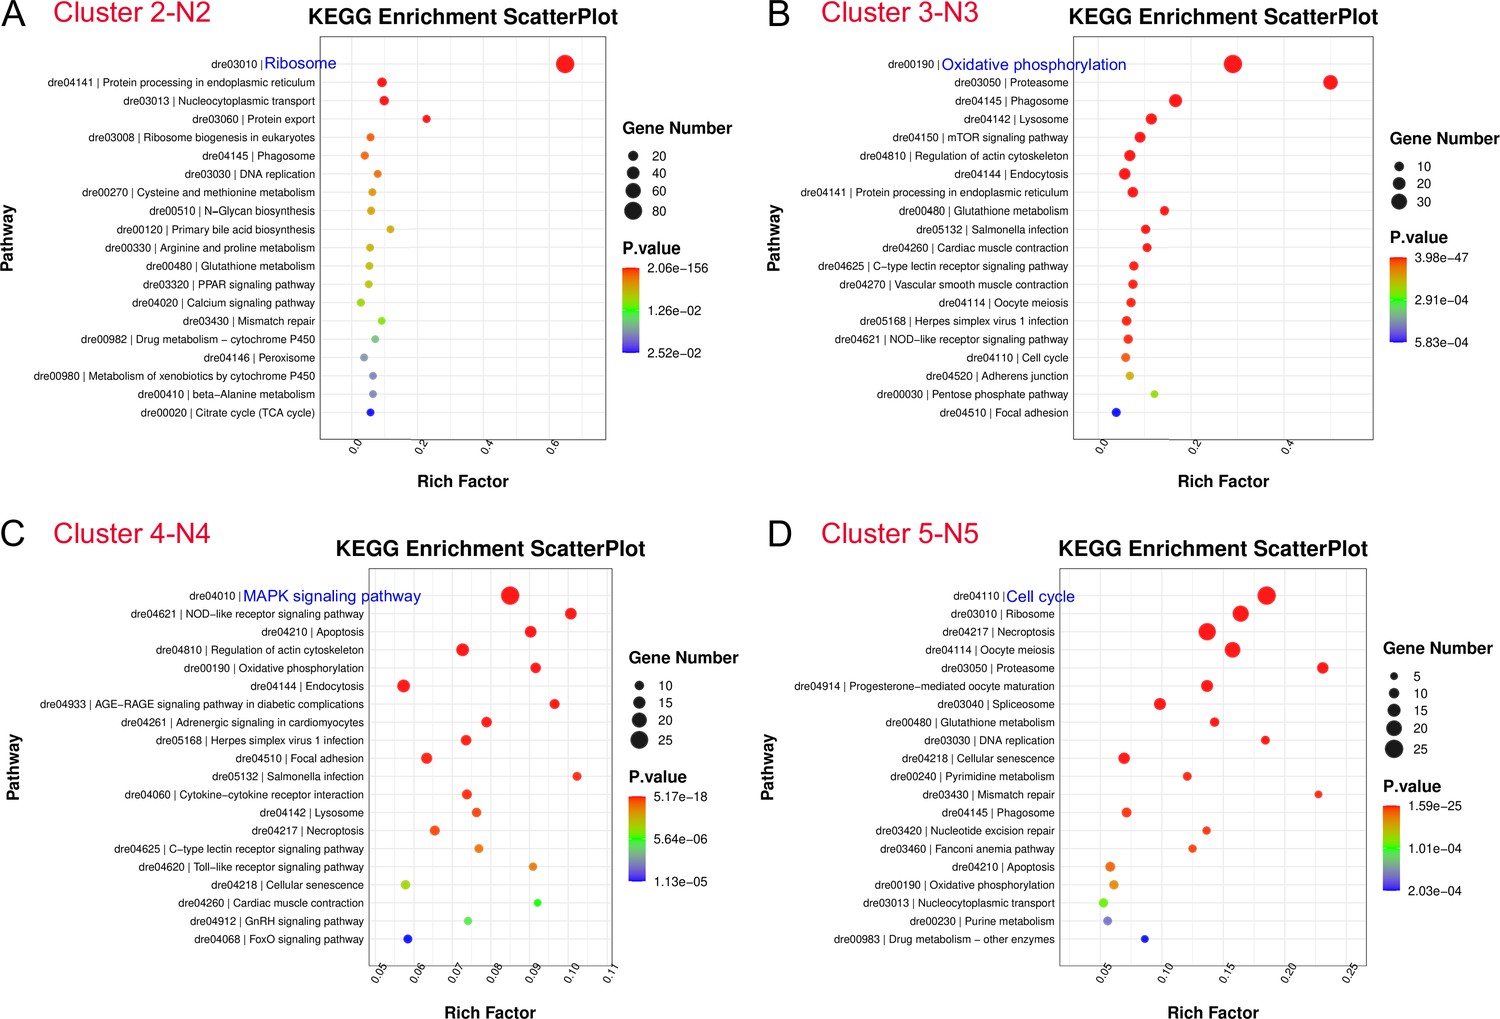
Kyoto Encyclopedia of Genes and Genomes (KEGG) analysis of neutrophil subsets (N2–N5).
(A–D) Top 20 most significant KEGG pathways of neutrophil subclusters (Cluster 2, 3, 4, 5).
Figure 9
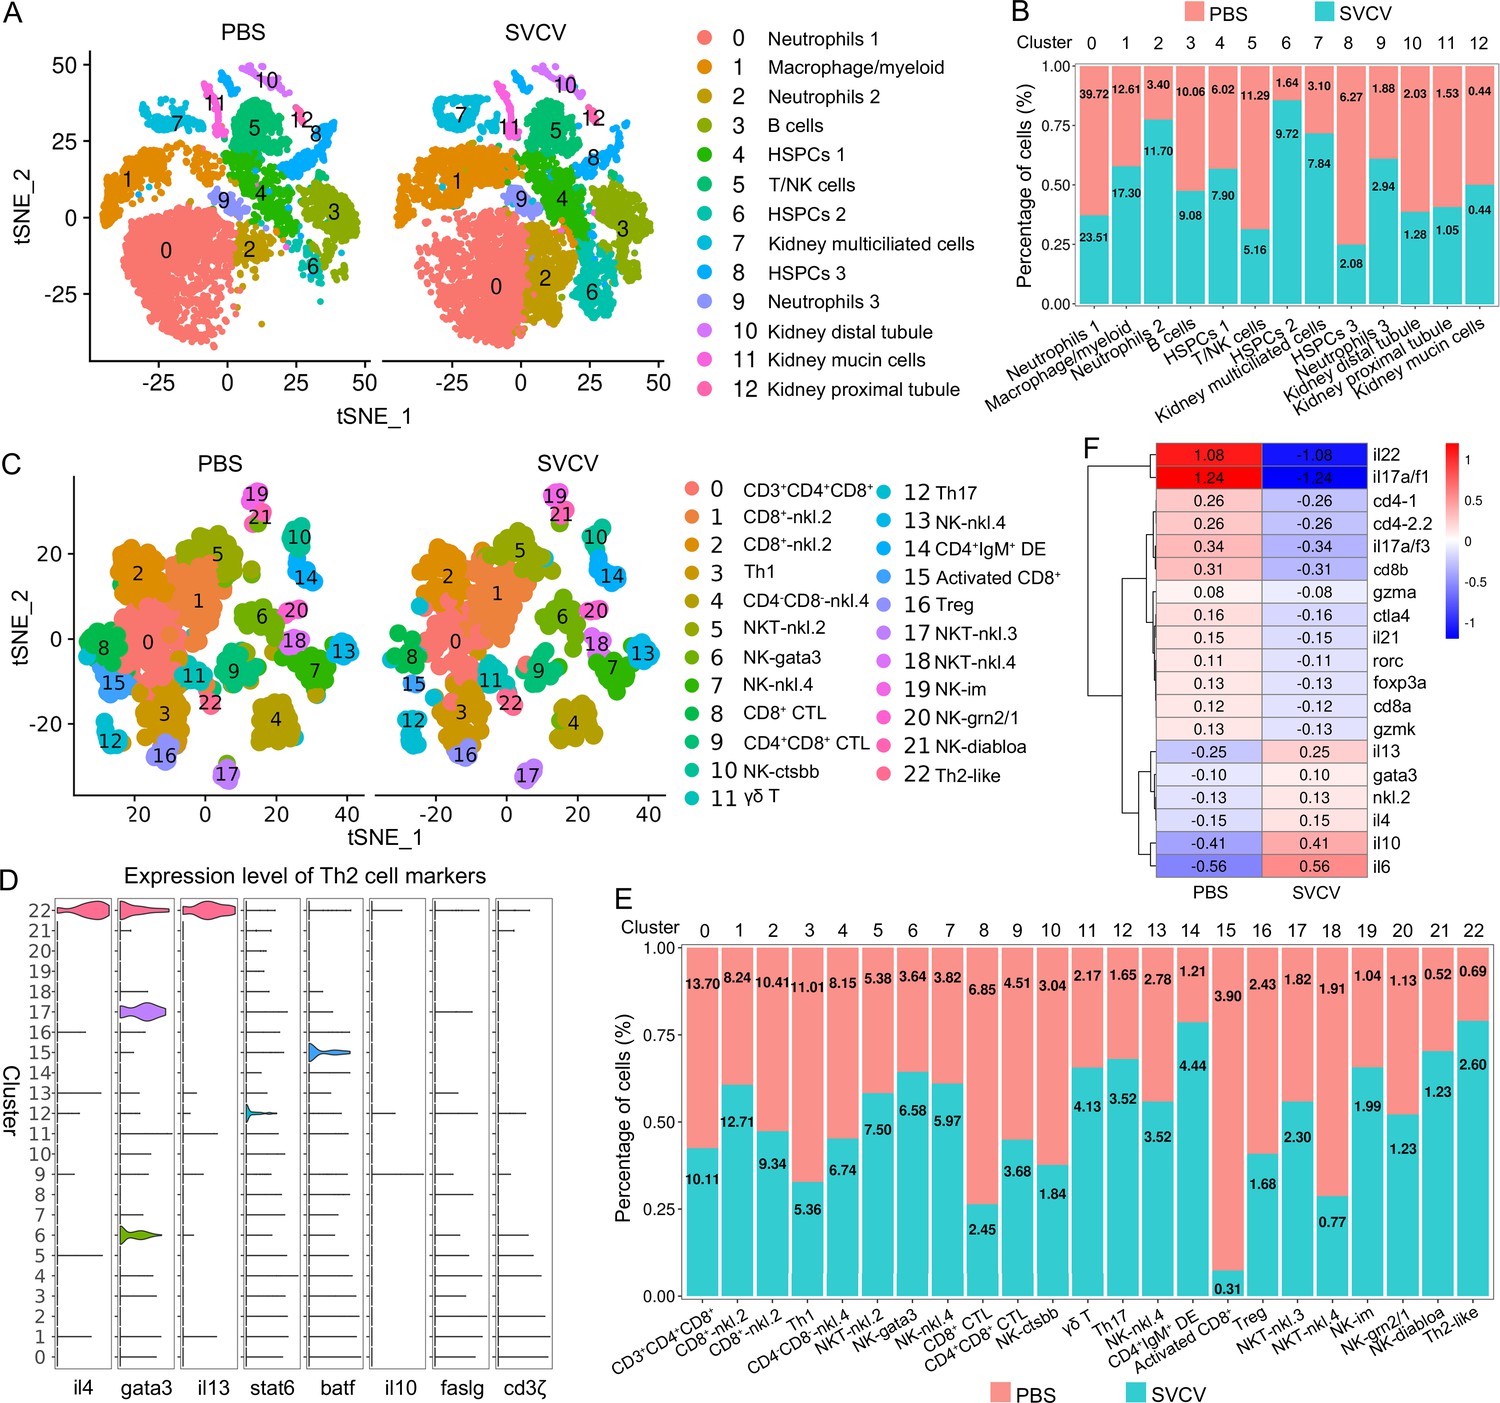
Zebrafish kidney immune-cell and T/NK cell subtype changes upon spring viremia of carp virus (SVCV) infection.
(A) Nonlinear t-distributed stochastic neighbor embedding (t-SNE) clustering depicted variations in zebrafish kidney leukocyte classification between control (PBS) and SVCV-infected groups. (B) Histogram showcasing differences in cell ratios between the control group and the SVCV-infected group. (C) Graph-based clustering of T/NK cells demonstrated 23 subclusters within both the control group (PBS) and the SVCV-infected group. Nonlinear t-SNE clustering displayed differences in zebrafish kidney leukocyte classification between control and SVCV-infected groups. (D) Violin plots of Th2 cell marker genes across all clusters, displaying normalized gene expression. (E) Histogram showing differences in T/NK cell ratios between the control group and the SVCV-infected group. (F) Heatmap of significantly differentially expressed marker genes in T/NK cells between the control group and the SVCV-infected group. Gene names are indicated on the right.
Figure 10 with 1 supplement
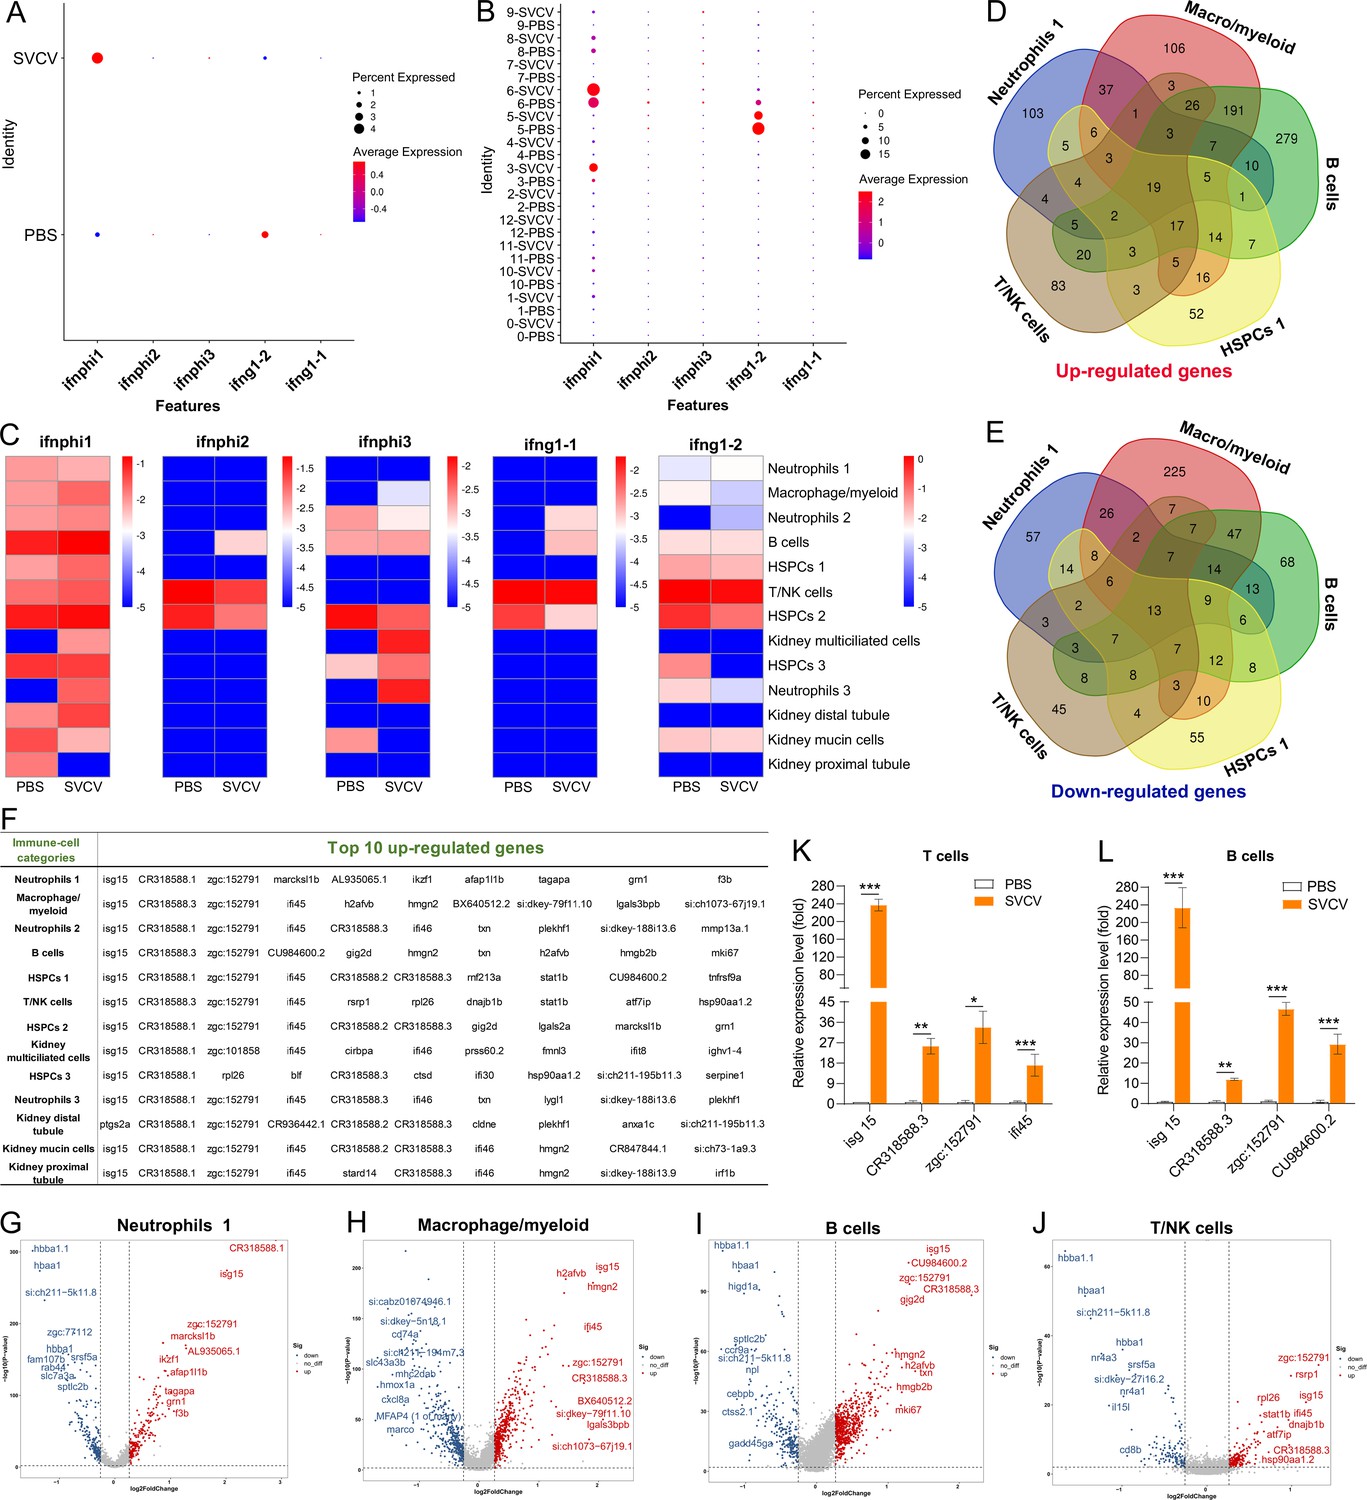
Analysis of interferons (IFN)-producing cell types and key virus-responsive genes upon spring viremia of carp virus (SVCV) infection.
(A) Dot plots illustrating five significantly up-/down-regulated IFNs during viral infection in zebrafish kidney immune cells. (B) Dot plots showing five differentially expressed IFN genes in each immune cell cluster between control and SVCV-infected zebrafish. (C) Heatmap of five differentially expressed IFN genes in each immune cell cluster between control and SVCV-infected zebrafish. (D–E) Venn diagram depicting overlapping up-regulated (D) and down-regulated (E) genes among five major kidney immune-cell categories. (F) Top 10 up-regulated genes in each cluster of immune cells and kidney cells. (G–J) Volcano plot of differentially expressed genes (DEGs) in neutrophils 1 (cluster 0), macrophage/myeloid cells (cluster 1), B cells (cluster 3), and T/NK cells (cluster 5) between the control and SVCV-infected groups. (K) Quantitative real-time PCR (RT-qPCR) examination of four key virus-responsive genes (isg15, CR318588.3, zgc:152791, and ifi45) in T cells upon SVCV stimulation. (L) RT-qPCR examination of four key virus-responsive genes (isg15, CR318588.3, zgc:152791, and CU984600.2) in B cells upon SVCV stimulation. Error bars represent SD. Data was collected from a minimum of three independent experiments. *p<0.05, **p<0.01, ***p<0.001.
Figure 10—figure supplement 1
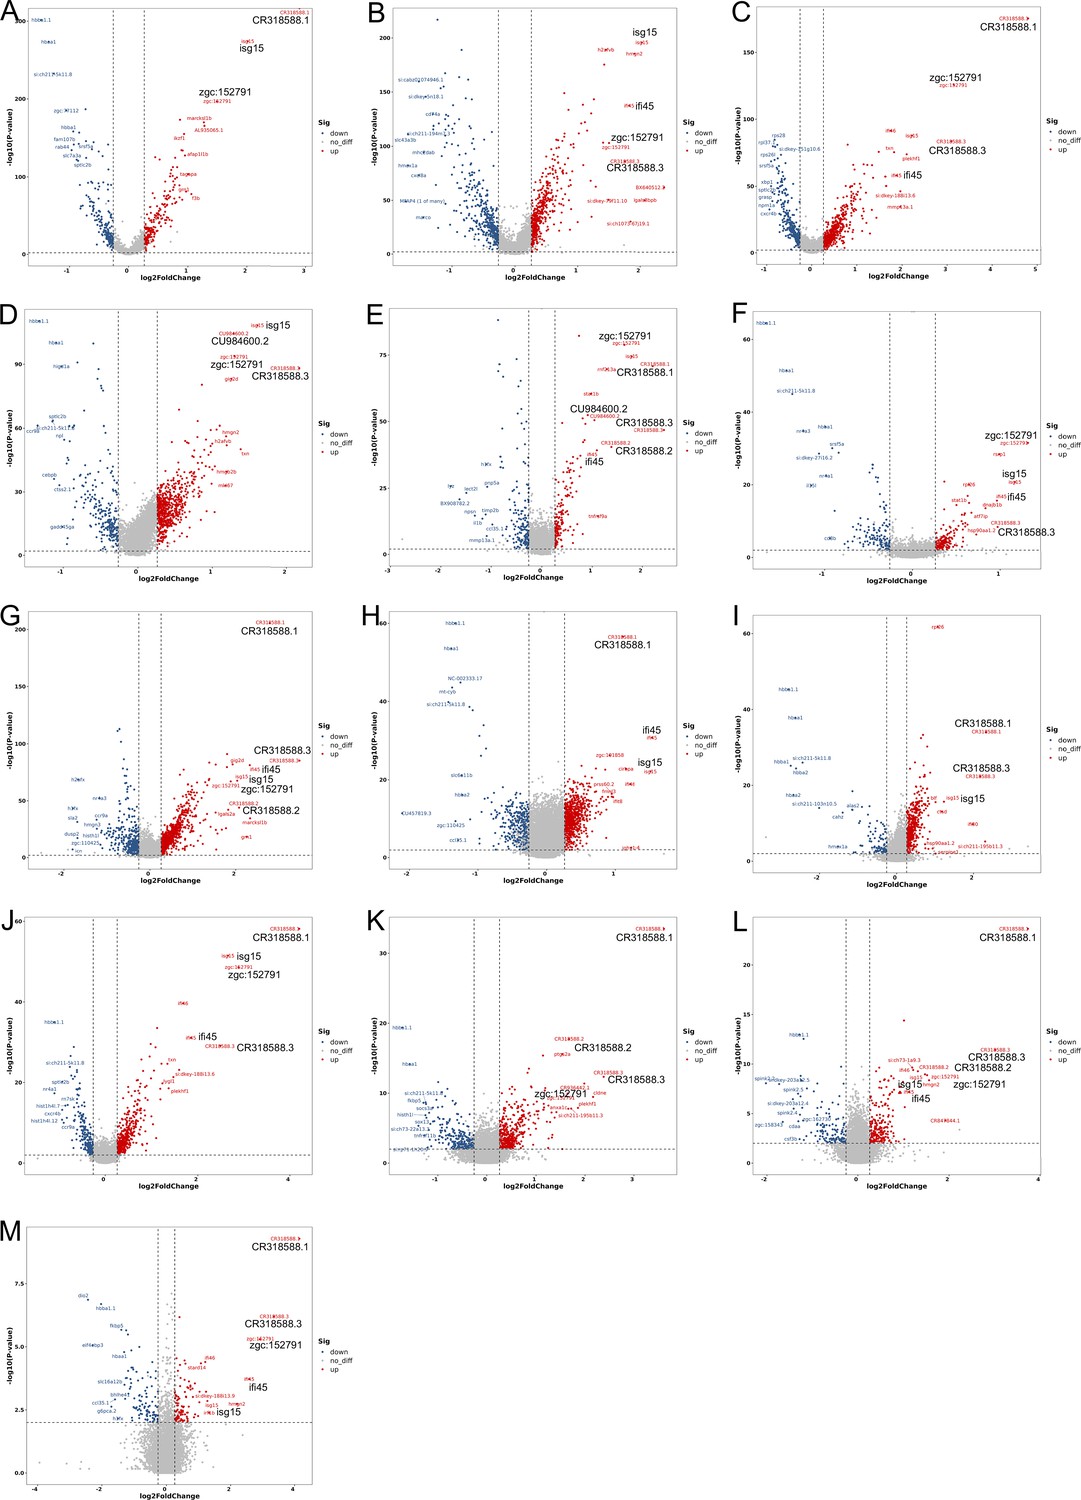
Volcano plots showing the differentially expressed genes (DEGs) in zebrafish kidney immune-cell and renal cell categories between control (PBS) and spring viremia of carp virus (SVCV)-infected groups (up-regulated: red; down-regulated: blue).
(A) Neutrophils 1; (B) Macrophage/myeloid cells; (C) Neutrophils 2; (D) B cells; (E) hematopoietic stem/progenitor cells (HSPCs) 1; (F) T/NK cells; (G) HSPCs 2; (H) Kidney multiciliated cells; (I) HSPCs 3; (J) Neutrophils 3; (K) Kidney distal tubule cells; (L) Kidney mucin cells; (M) Kidney proximal tubule cells. Some key up-regulated genes are displayed in bold, including isg15, ifi45, zgc:152791, CR318588.1, CR318588.2, and CU984600.2.
Figure 11 with 1 supplement
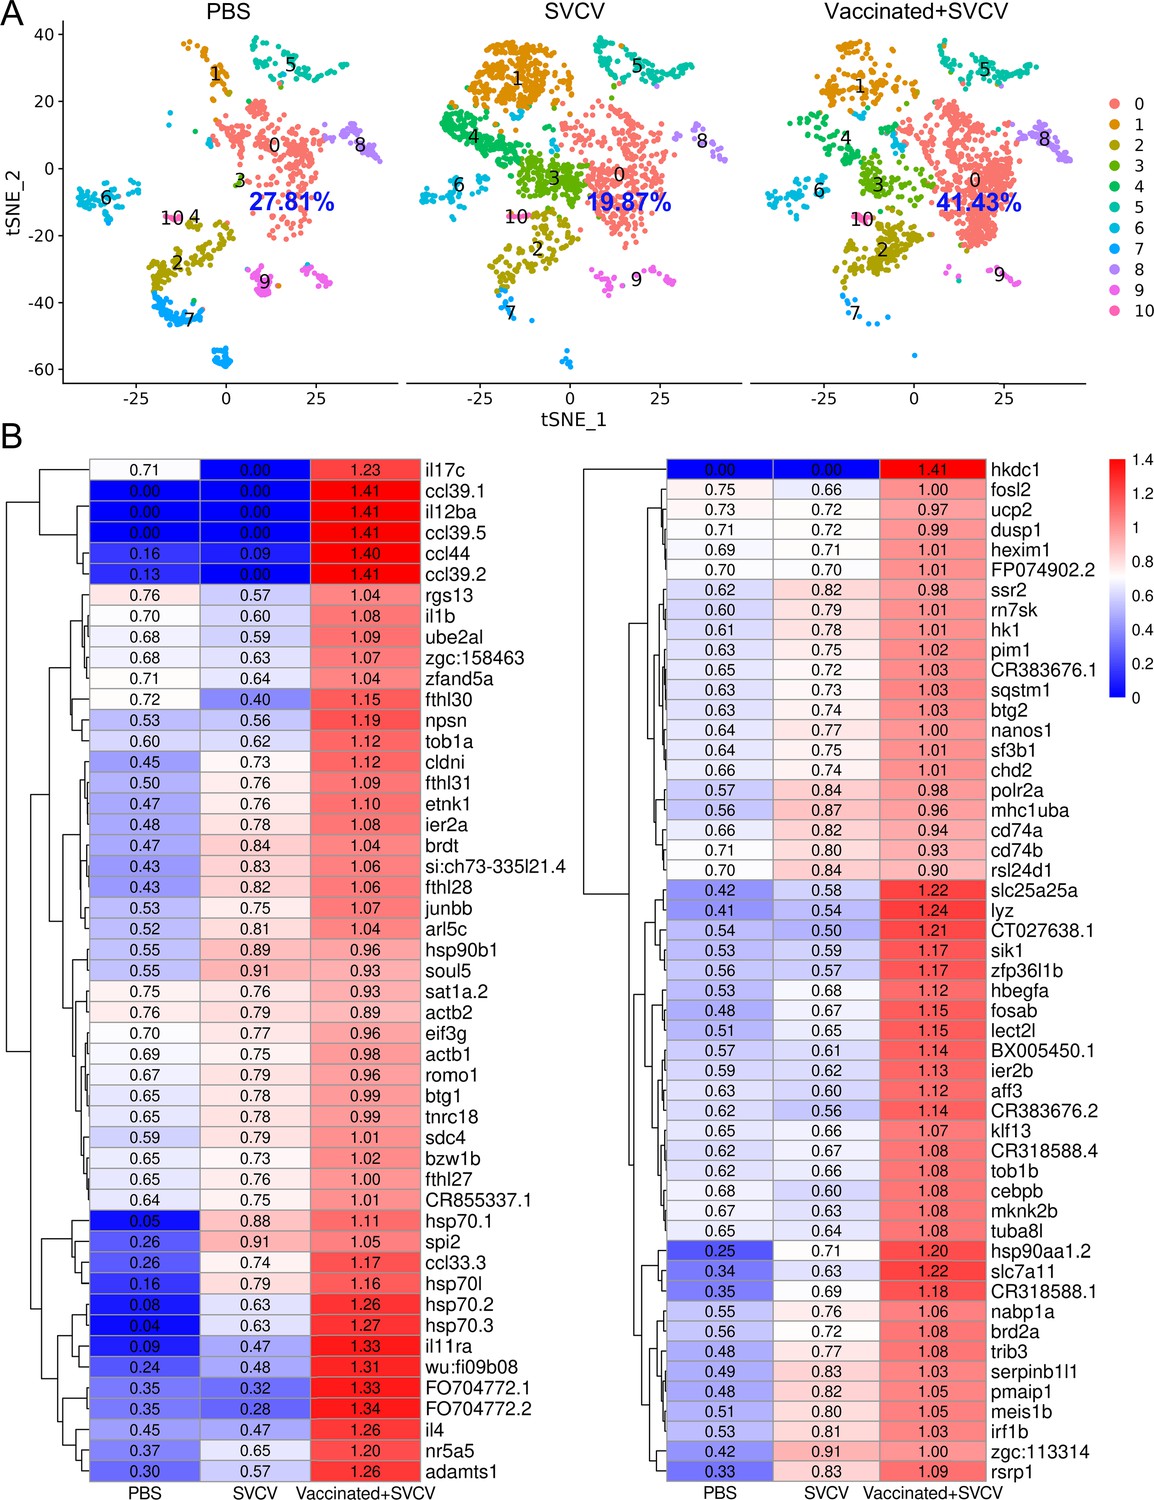
Induction of trained immunity in hematopoietic stem/progenitor cells (HSPCs) through zebrafish vaccination with inactivated spring viremia of carp virus (SVCV).
(A) Nonlinear t-distributed stochastic neighbor embedding (t-SNE) clustering displayed the proportions of HSPCs 1 (H0) in the PBS-administered (control), SVCV-infected (infected), and SVCV-vaccinated plus SVCV-infected (vaccinated+SVCV) groups. (B) Heatmap showcasing significant immune gene expression differences in HSPCs 1 (H0) among the PBS-administered, SVCV-infected, and vaccinated+SVCV groups.
Figure 11—figure supplement 1

Percentage and number changes in zebrafish kidney hematopoietic stem/progenitor cells (HSPCs) and immune-cell categories in response to spring viremia of carp virus (SVCV) infection.
(A) Histogram showing the differences in cell ratios between the control group, the SVCV-infected group and the SVCV-vaccinated plus SVCV-infected group. (B) Histogram presenting the differences in the cell numbers of each cluster between the control group, the SVCV-infected group, and the SVCV-vaccinated plus SVCV-infected group.
Figure 12
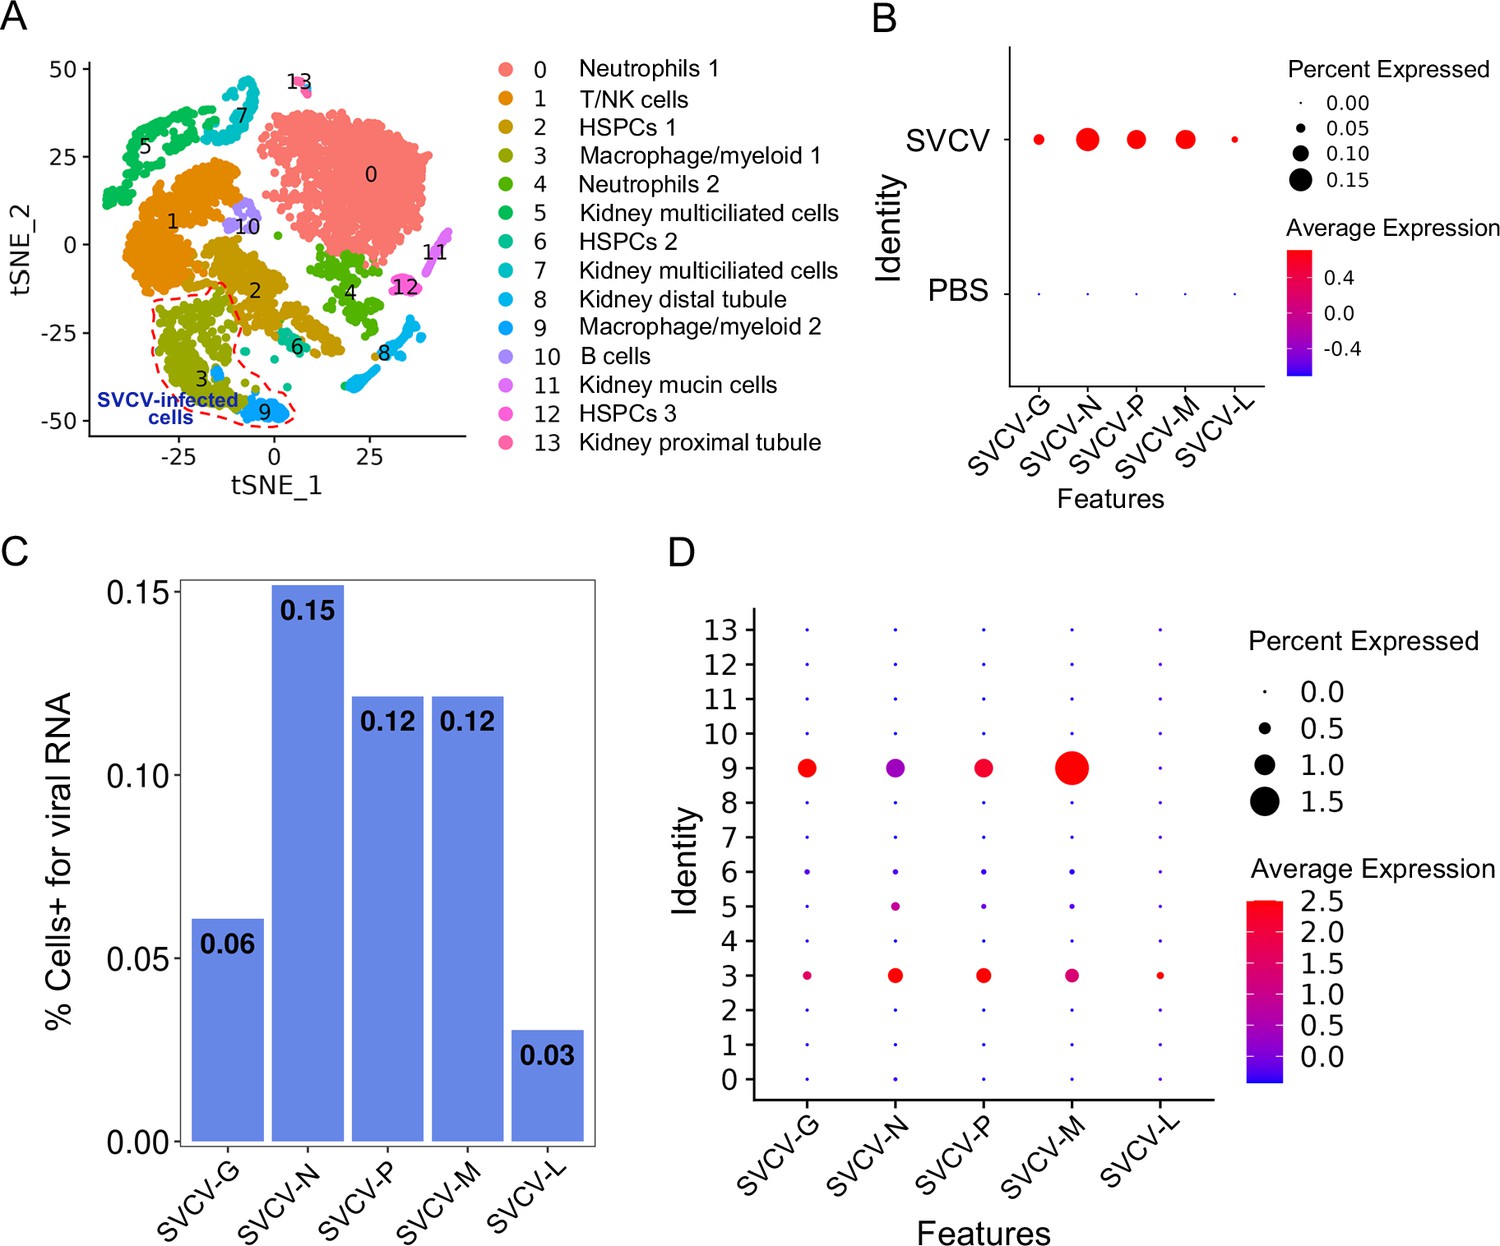
Single-cell sequencing reveals spring viremia of carp virus (SVCV)-infected cells in kidney tissue.
(A) Nonlinear t-distributed stochastic neighbor embedding (t-SNE) clustering depicted the zebrafish kidney leukocyte classification results after integrating SVCV genes into the zebrafish genome. Principal component analysis (PCA) analysis followed data normalization, and dimension reduction was achieved via principal component analysis and graph theory-based clustering. The infected cell populations are displayed in red dashed circles. (B) Dot plots illustrating expression levels of five SVCV genes and the percentage of cells per cluster expressing these genes. (C) Percentage of single-cell RNA sequencing (scRNA-seq)-identified cells positive for reads aligning to the viral genome in SVCV-infected cases. (D) Dot plots showing differential expression of five SVCV genes per immune cell cluster in SVCV-infected zebrafish.
Figure 13
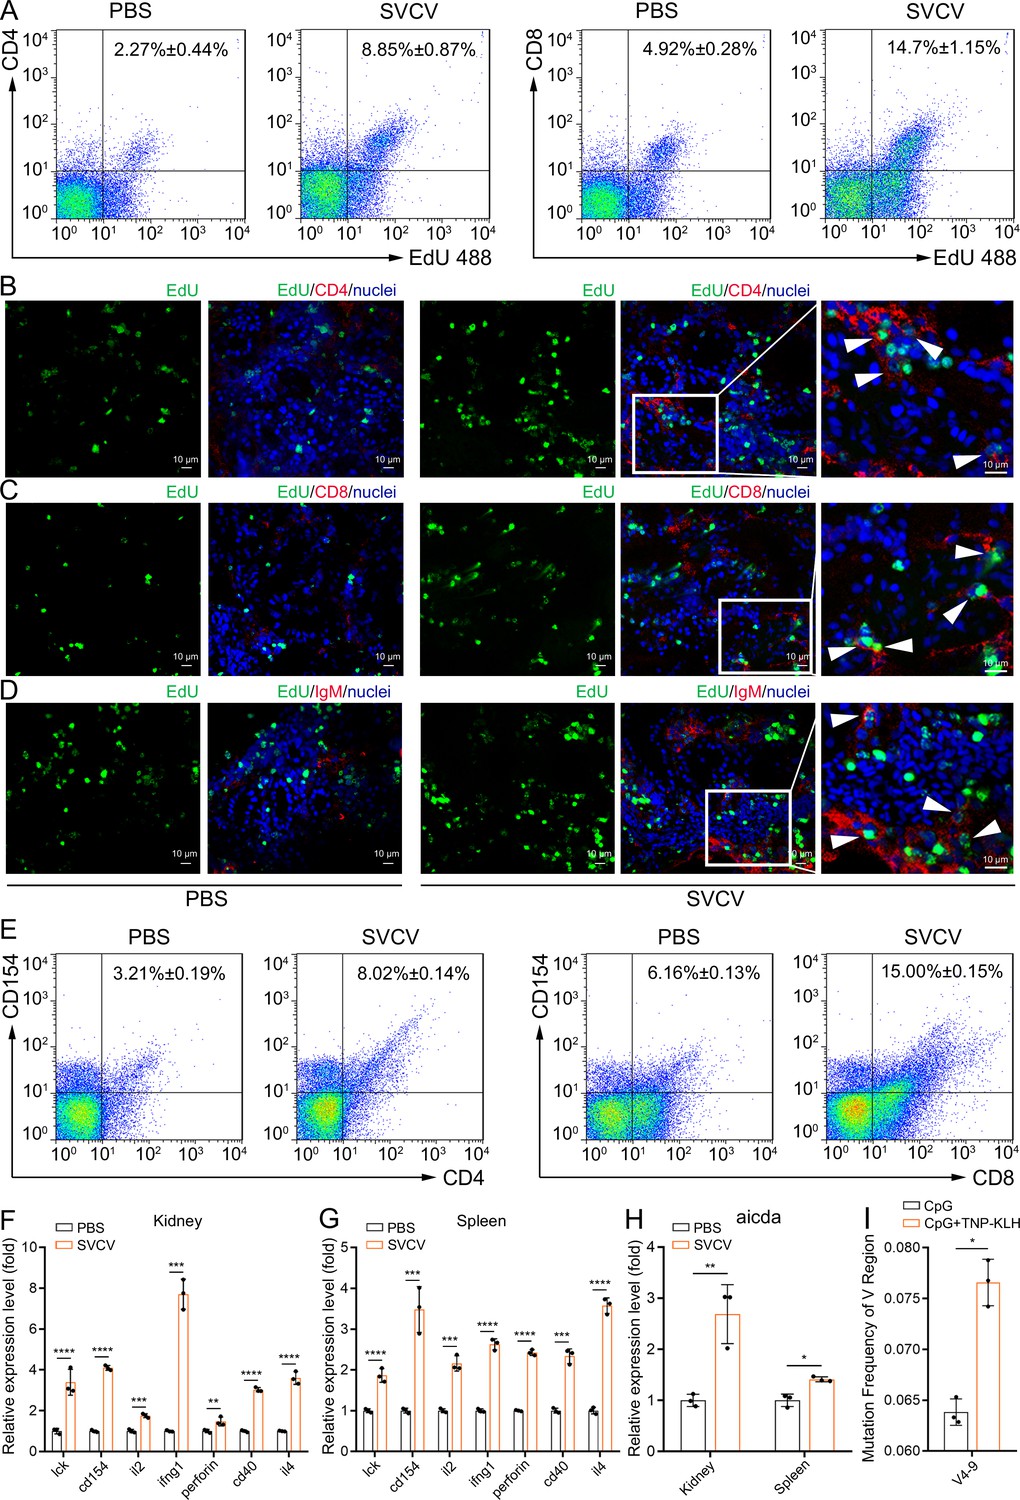
Examination of zebrafish kidney acting as a secondary immune organ involved in the antiviral immune response.
(A) In vivo proliferation assessment of CD4+ and CD8+ T cells in the kidney of zebrafish stimulated with inactivated spring viremia of carp virus (SVCV) (106 TCID50), determined by CD4+EdU+ and CD8+EdU+ T cell percentages via flow cytometry (FCM) analysis. (B–D) Analysis of proliferative CD4+ T, CD8+ T, and IgM+ B cells by immunofluorescence staining. Kidney cryosections were stained for EdU (green), CD4 (red, B), CD8 (red, C), and IgM (red, D), and nuclei (blue) detection. Fluorescence images were captured using a Laser scanning confocal microscope (FV3000, 60x oil). White arrowheads point to cells double-stained for EdU with CD4, CD8, or IgM. Scale bars, 10 µm. (E) In vivo activation examination of CD4+ and CD8+ T cells after SVCV stimulation, determined by CD4+CD154+ and CD8+CD154+ T cell percentages via FCM analysis. (F–G) Quantitative real-time PCR (RT-qPCR) analysis of transcriptional expression of T/B cell activation-related genes in kidney and spleen under SVCV stimulation. (H) RT-qPCR analysis of B cell somatic hypermutation (SHM)-related gene AID (aicda) transcriptional expression in kidney and spleen under SVCV stimulation. (I) SHM analysis in IgM antibody V genes through multiple PCR-based high-throughput sequencing. Experiments were independently repeated at least three times (*p<0.05, **p<0.01, ***p<0.001, ****p<0.0001).
Additional files
-
Supplementary file 1
Gene sets for all immune cell and HSPCs annotation.
- https://cdn.elifesciences.org/articles/92424/elife-92424-supp1-v1.xlsx
-
Supplementary file 2
Marker gene list and gene expression tables of 13 immune-cell and renal cell categories.
- https://cdn.elifesciences.org/articles/92424/elife-92424-supp2-v1.xlsx
-
Supplementary file 3
Marker gene list and gene expression tables of HSPC subsets.
- https://cdn.elifesciences.org/articles/92424/elife-92424-supp3-v1.xlsx
-
Supplementary file 4
Marker gene list and gene expression tables of T/NK cell subsets.
- https://cdn.elifesciences.org/articles/92424/elife-92424-supp4-v1.xlsx
-
Supplementary file 5
Marker gene list and gene expression tables of B cell subsets.
- https://cdn.elifesciences.org/articles/92424/elife-92424-supp5-v1.xlsx
-
Supplementary file 6
Marker gene list and gene expression tables of macrophages/myeloid cell subsets.
- https://cdn.elifesciences.org/articles/92424/elife-92424-supp6-v1.xlsx
-
Supplementary file 7
Marker gene list and gene expression tables of neutrophil subsets.
- https://cdn.elifesciences.org/articles/92424/elife-92424-supp7-v1.xlsx
-
Supplementary file 8
Similarities and differences in HSPC and immune cell populations between zebrafish and human.
- https://cdn.elifesciences.org/articles/92424/elife-92424-supp8-v1.xlsx
-
Supplementary file 9
Primers used in this study for Real-time quantitative PCR and IgM antibody repertoire analysis.
- https://cdn.elifesciences.org/articles/92424/elife-92424-supp9-v1.xlsx
-
MDAR checklist
- https://cdn.elifesciences.org/articles/92424/elife-92424-mdarchecklist1-v1.docx
Download links
A two-part list of links to download the article, or parts of the article, in various formats.
Downloads (link to download the article as PDF)
Open citations (links to open the citations from this article in various online reference manager services)
Cite this article (links to download the citations from this article in formats compatible with various reference manager tools)
Single-cell RNA sequencing unveils the hidden powers of zebrafish kidney for generating both hematopoiesis and adaptive antiviral immunity
eLife 13:RP92424.
https://doi.org/10.7554/eLife.92424.3


